Embed Size (px)
Citation preview

1
2
Abiqua Acres
DM CC WIP-$$100% 40% BI 5,000 DM $20,000
CC $16,000 57,000*$11.7932IN 60,000 57,000 out = $672,212.4
100% 50% EI 8,000 DM $250,000CC $450,000DM $33,230.40 8,000*100%*$4.1538
CC $30,557.20 8,000*50%*$7.6393
$63,787.60
BI + IN = EI + Out (?)$36,000 + $700,000 = $672,212.40 + $67,787.60
$736,000 = $736,000
DM CCOut 57,000 57,000EI 8,000*100% 8,000EU 8,000*50% 4,000
65,000 61,000
BI $20,000 $16,000IN $250,000 $450,000
Total $270,000 $466,000
Uni
ts t
o be
ac
coun
ted
for: WIP-Units
BI
INout
Wtd. Avg. E.U.
$ to Acct. for
$270,000/65,000 $466,000/61,000
=$4.1538 =$7.6393
$11.7932 per E.U.
$/E.U.
WEIGHTED AVERAGE METHOD
3
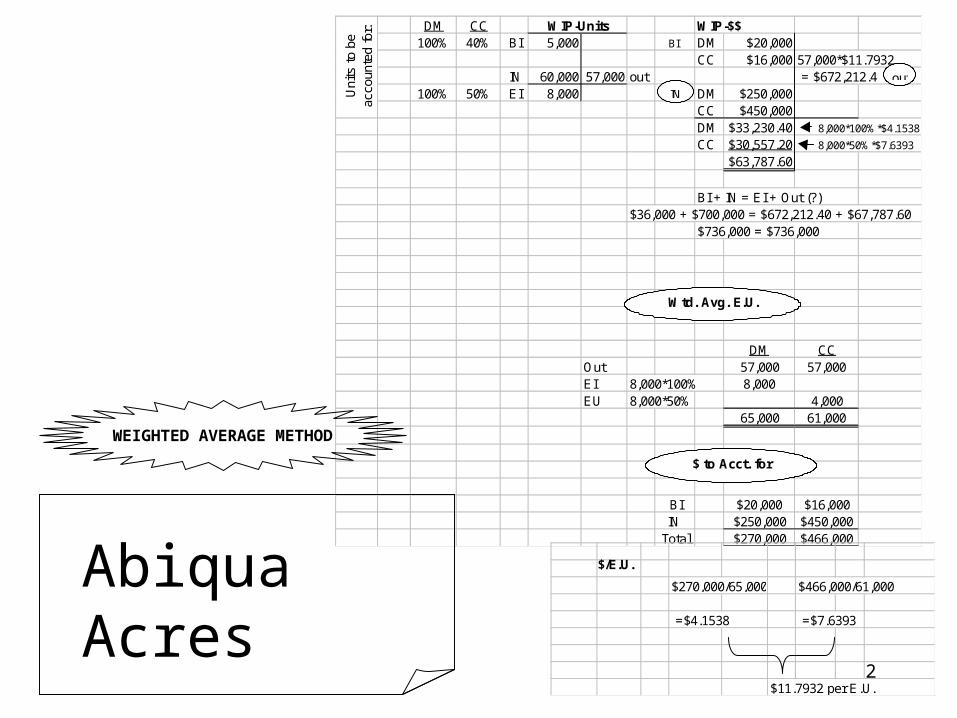
Abiqua Acres (p. 2)
WIP Units
5,000
60,000
8,000
57,000
OutBI
IN
EI
DM
100%
100%
CC
40%
50%
WIP - $ (FIFO)
DM $20,000
CC $16,000
DM $250,000
CC $450,000
DM $33,333.60
CC 30,508.40
$63,842.00
$ 36,000.00 from BI
22,881.30 Finished CC 5,000×60%×$7.6271
613,277.60 S&F 52,000 × $11.7938
$672,158.90
= 8,000 × 100% × $4.1667
= 8,000 × 50% × $7.6271
OutBI
IN
EI
E.U.
DM CC
- 0 -
52,000
8,000
60,000
3,000
52,000
4,000
59,000
Costs to Account For
DM CC
$4.00
$8.00
$ per EU
BI: (DM) 5,000× 0%
BI: (CC) 5,000×60%
Start & Finish
EI: (DM) 8,000×100%
EI: (CC) 8,000× 50%
E.U.
FIFO METHOD
BI
$20,000 DM ÷ (5,000×100%)
$16,000 CC ÷ (5,000× 40%)
Total
$12.00
$4.1667
$7.6271
$ per EUIN
$250,000 DM ÷ 60,000 E.U.
$450,000 CC ÷ 59,000 E.U. $11.7938
(Info we need to do problem)
$736,000 Costs to Account For
4
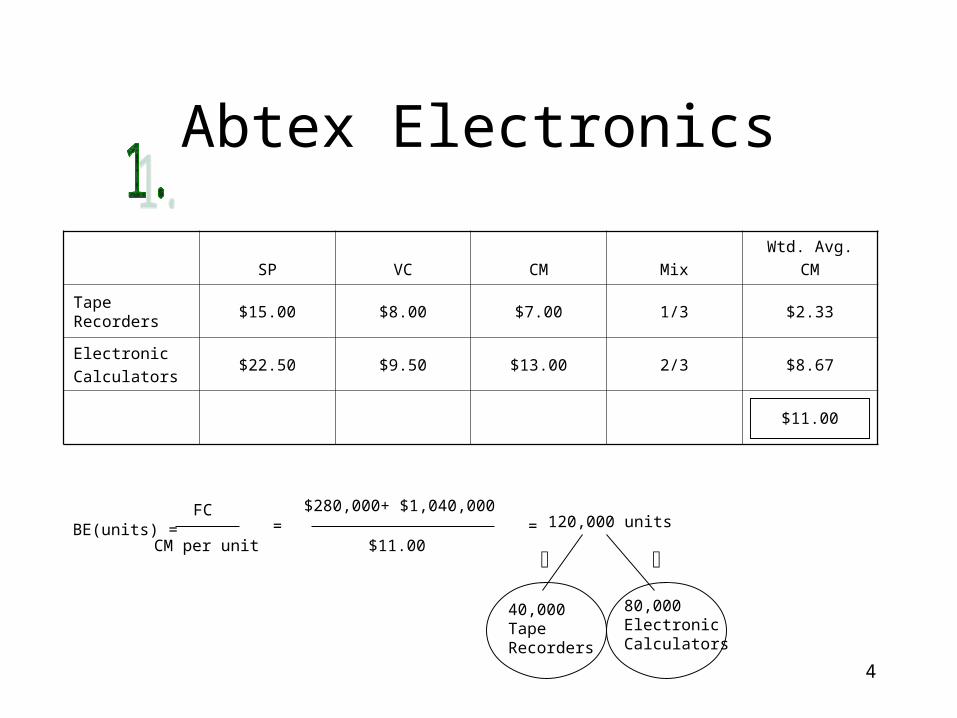
Abtex Electronics
SP VC CM Mix
Wtd. Avg.
CM
TapeRecorders
$15.00 $8.00 $7.00 1/3 $2.33
Electronic
Calculators$22.50 $9.50 $13.00 2/3 $8.67
$11.00
BE(units) =FC
CM per unit=
$280,000+ $1,040,000
$11.00= 120,000 units
40,000TapeRecorders
80,000ElectronicCalculators
5
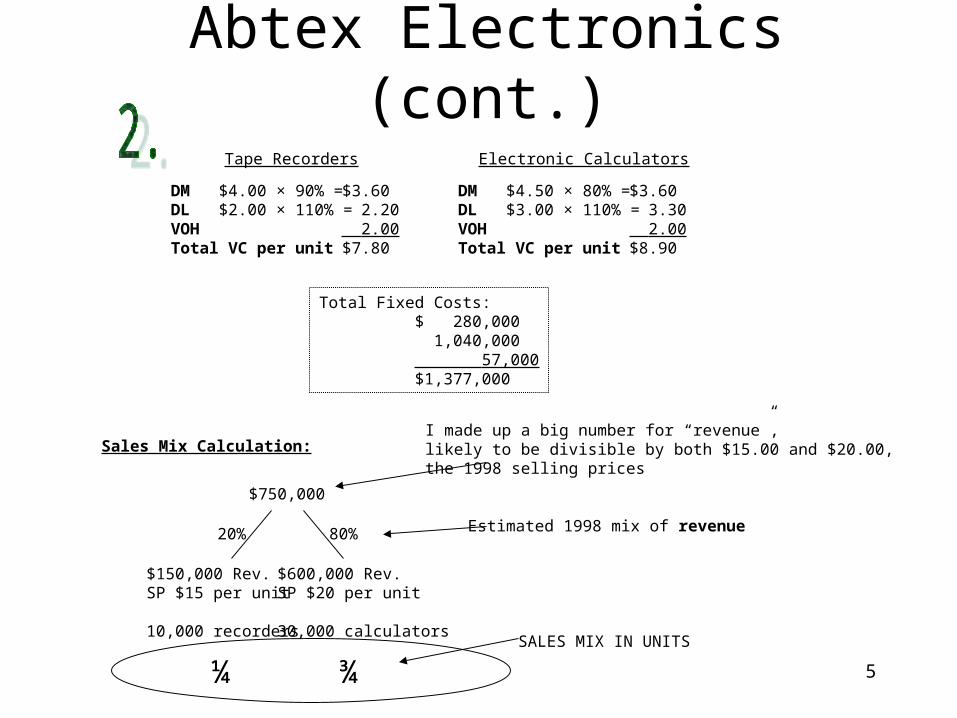
Abtex Electronics (cont.)
Tape Recorders Electronic Calculators
DM $4.00 × 90% =DL $2.00 × 110% =VOH Total VC per unit
DM $4.50 × 80% =DL $3.00 × 110% =VOH Total VC per unit
$3.60 2.20 2.00$7.80
$3.60 3.30 2.00$8.90
Total Fixed Costs:$ 280,000 1,040,000 57,000$1,377,000
Sales Mix Calculation:
$750,000
I made up a big number for “revenue”,likely to be divisible by both $15.00 and $20.00,the 1998 selling prices
20% 80% Estimated 1998 mix of revenue
$600,000 Rev.SP $20 per unit
30,000 calculators
$150,000 Rev.SP $15 per unit
10,000 recorders
¼ ¾SALES MIX IN UNITS
6
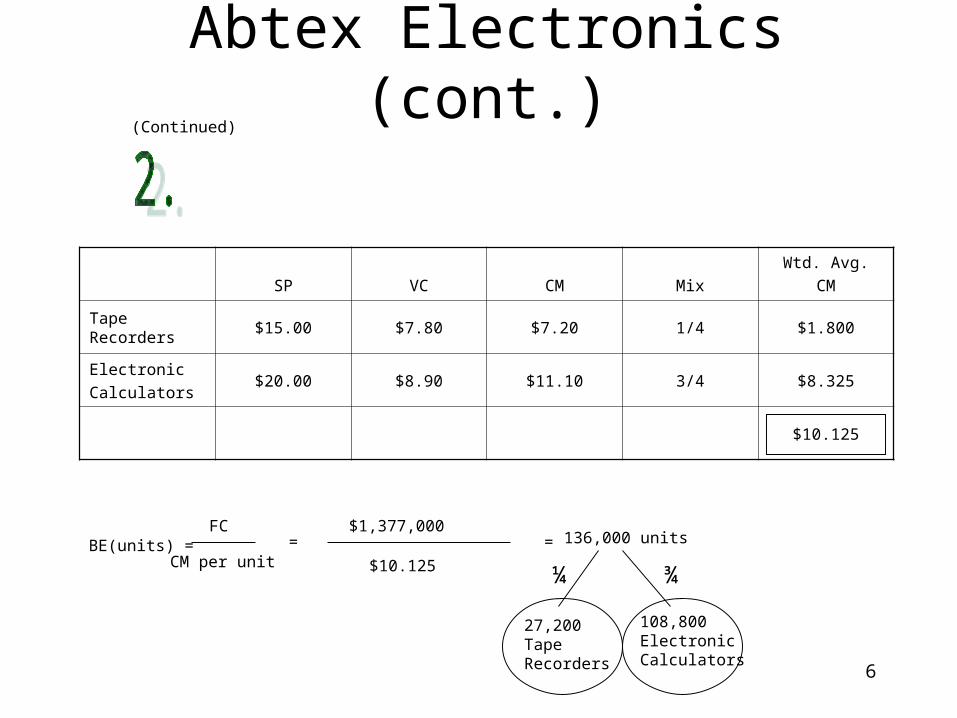
Abtex Electronics (cont.)(Continued)
SP VC CM Mix
Wtd. Avg.
CM
TapeRecorders
$15.00 $7.80 $7.20 1/4 $1.800
Electronic
Calculators$20.00 $8.90 $11.10 3/4 $8.325
$10.125
BE(units) =FC
CM per unit=
$1,377,000
$10.125
= 136,000 units
27,200TapeRecorders
108,800ElectronicCalculators
¼ ¾
7
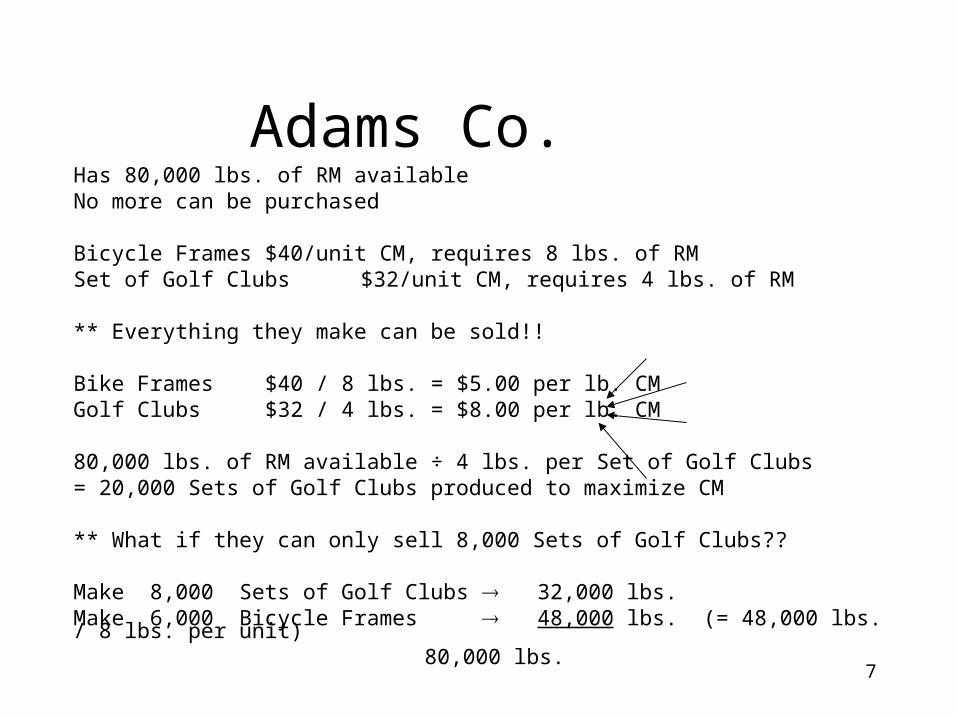
Adams Co.Has 80,000 lbs. of RM availableNo more can be purchased Bicycle Frames $40/unit CM, requires 8 lbs. of RMSet of Golf Clubs $32/unit CM, requires 4 lbs. of RM ** Everything they make can be sold!! Bike Frames $40 / 8 lbs. = $5.00 per lb. CMGolf Clubs $32 / 4 lbs. = $8.00 per lb. CM 80,000 lbs. of RM available ÷ 4 lbs. per Set of Golf Clubs= 20,000 Sets of Golf Clubs produced to maximize CM ** What if they can only sell 8,000 Sets of Golf Clubs?? Make 8,000 Sets of Golf Clubs 32,000 lbs.Make 6,000 Bicycle Frames 48,000 lbs. (= 48,000 lbs. / 8 lbs. per unit)
80,000 lbs.
8
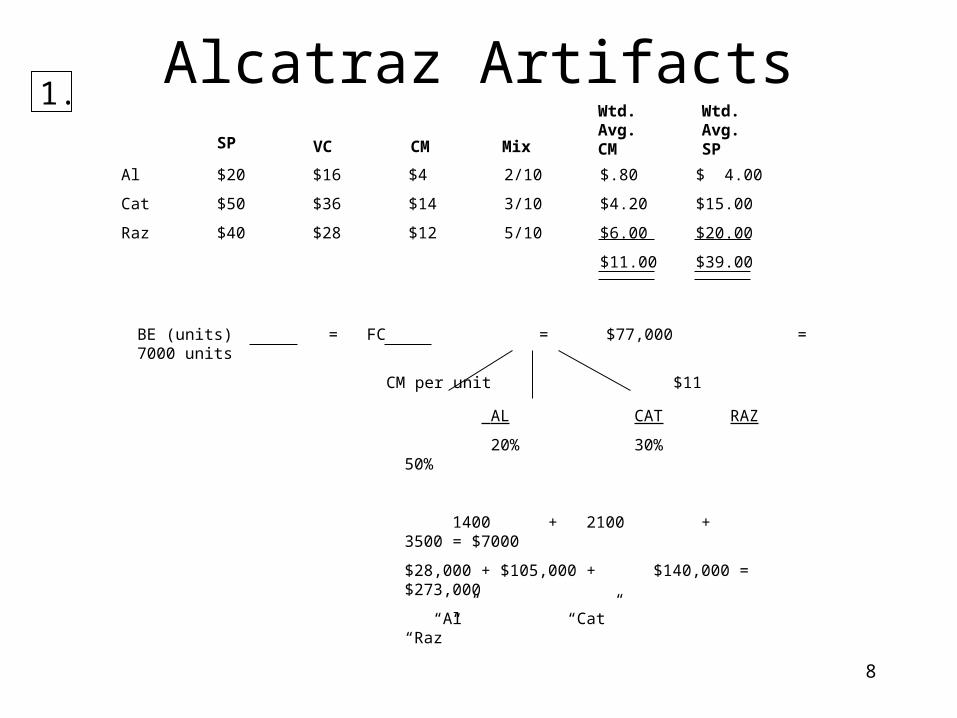
1.
Al $20 $16 $4 2/10 $.80 $ 4.00
Cat $50 $36 $14 3/10 $4.20 $15.00
Raz $40 $28 $12 5/10 $6.00 $20.00
$11.00 $39.00
BE (units) = FC = $77,000 = 7000 units
CM per unit $11
AL CAT RAZ
20% 30% 50%
1400 + 2100 + 3500 = $7000
$28,000 + $105,000 + $140,000 = $273,000
“Al” “Cat” “Raz”
Alcatraz ArtifactsSP VC CM Mix
Wtd.Avg.CM
Wtd.Avg.SP
9
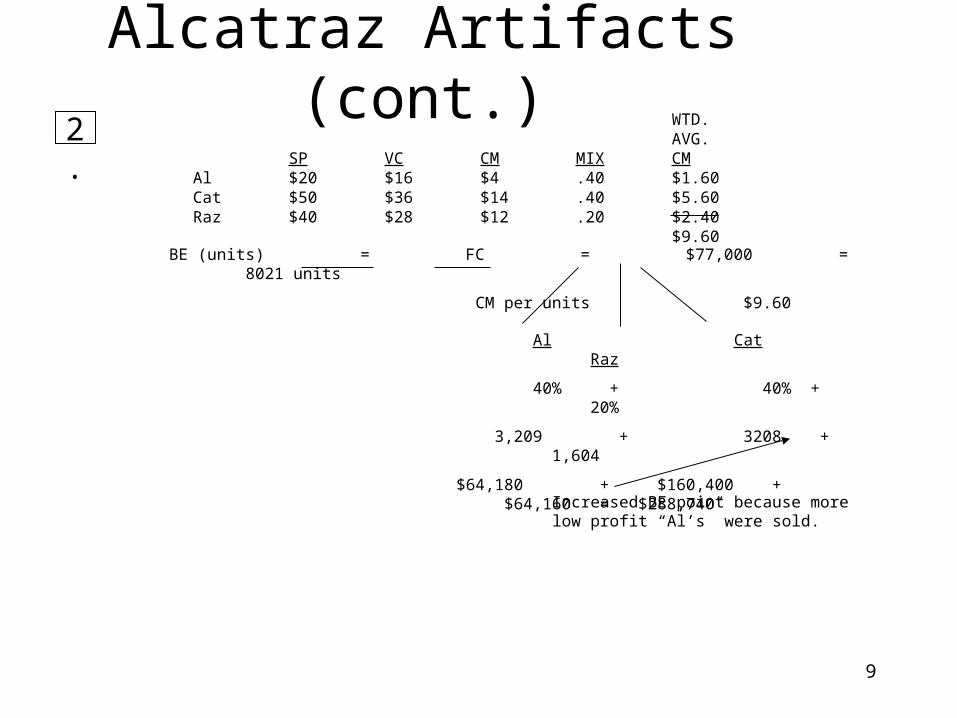
2. WTD.AVG.
SP VC CM MIX CMAl $20 $16 $4 .40 $1.60Cat $50 $36 $14 .40 $5.60Raz $40 $28 $12 .20 $2.40
$9.60BE (units) = FC = $77,000 = 8021 units
CM per units $9.60
Al Cat Raz
40% + 40% + 20%
3,209 + 3208 + 1,604
$64,180 + $160,400 + $64,160 = $288,740
Increased BE point because more low profit “Al’s” were sold.
Alcatraz Artifacts (cont.)
10
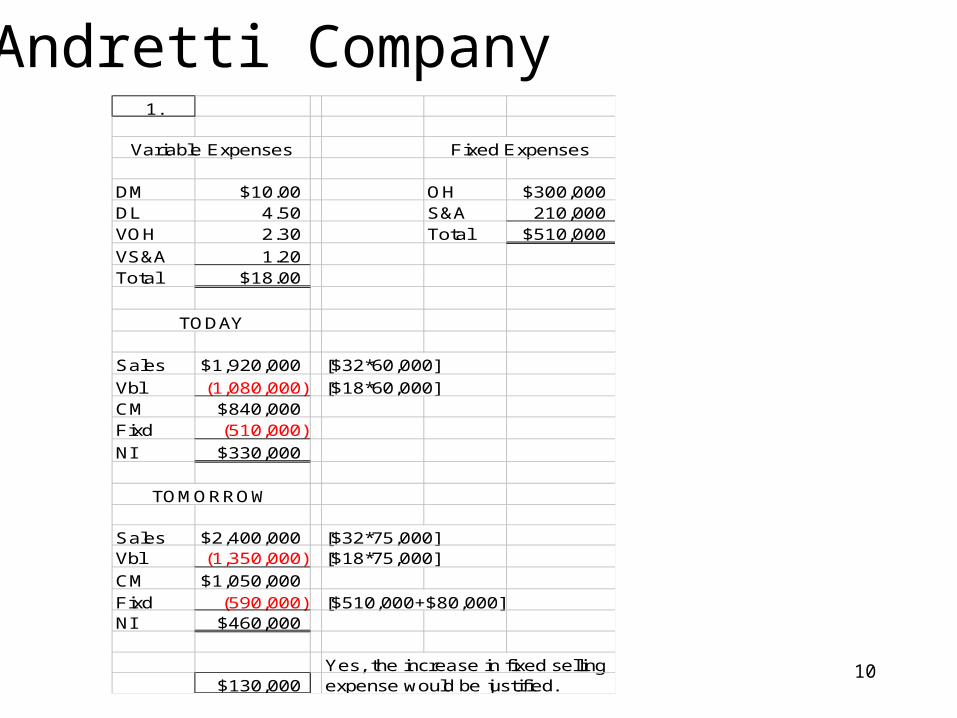
Andretti Company1.
Variable Expenses Fixed Expenses Variable Expenses
DM $10.00 OH $300,000DL 4.50 S&A 210,000VOH 2.30 Total $510,000
VS&A 1.20Total $18.00
TODAY
Sales $1,920,000 [$32*60,000]
Vbl (1,080,000) [$18*60,000]CM $840,000Fixd (510,000)
NI $330,000
TOMORROW
Sales $2,400,000 [$32*75,000]Vbl (1,350,000) [$18*75,000]
CM $1,050,000Fixd (590,000) [$510,000+$80,000]NI $460,000
Yes, the increase in fixed selling$130,000 expense would be justified.
11
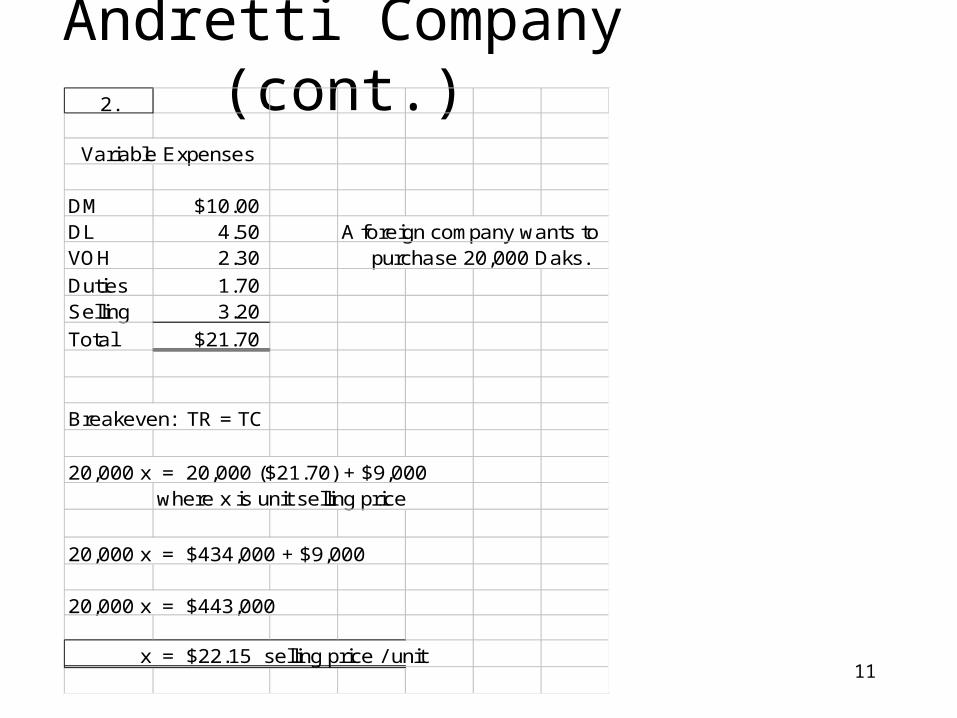
Andretti Company (cont.)2.
Variable Expenses
DM $10.00DL 4.50 A foreign company wants toVOH 2.30 purchase 20,000 Daks.
Duties 1.70Selling 3.20
Total $21.70
Breakeven: TR = TC
20,000 x = 20,000 ($21.70) + $9,000where x is unit selling price
20,000 x = $434,000 + $9,000
20,000 x = $443,000
x = $22.15 selling price / unit
12
Andretti Company (cont.)
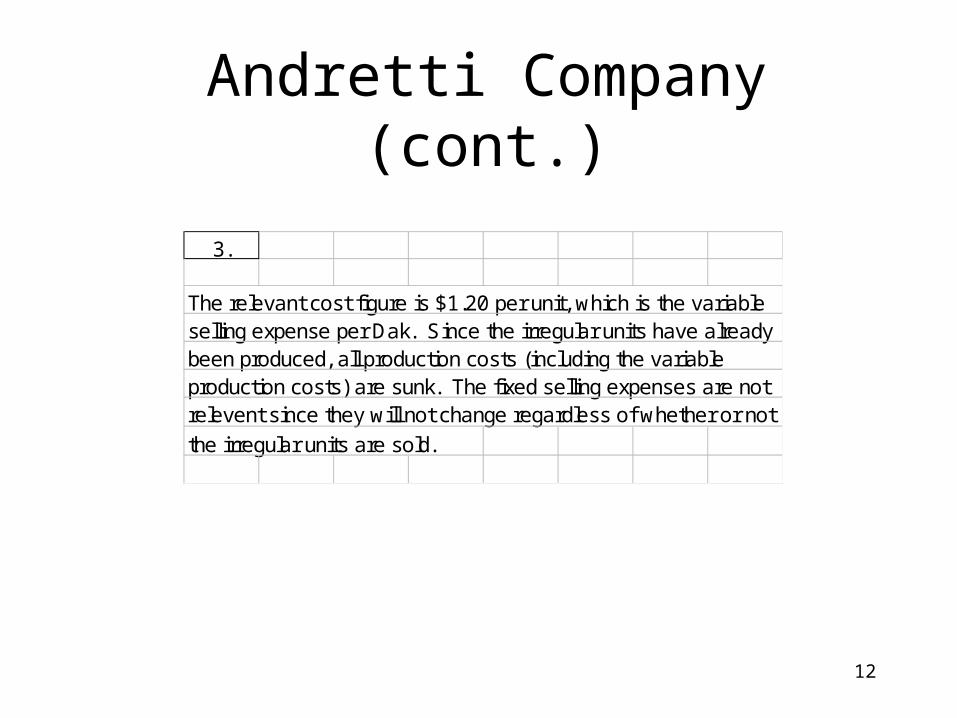
3.
The relevant cost figure is $1.20 per unit, which is the variableselling expense per Dak. Since the irregular units have alreadybeen produced, all production costs (including the variableproduction costs) are sunk. The fixed selling expenses are notrelevent since they will not change regardless of whether or not
the irregular units are sold.
13
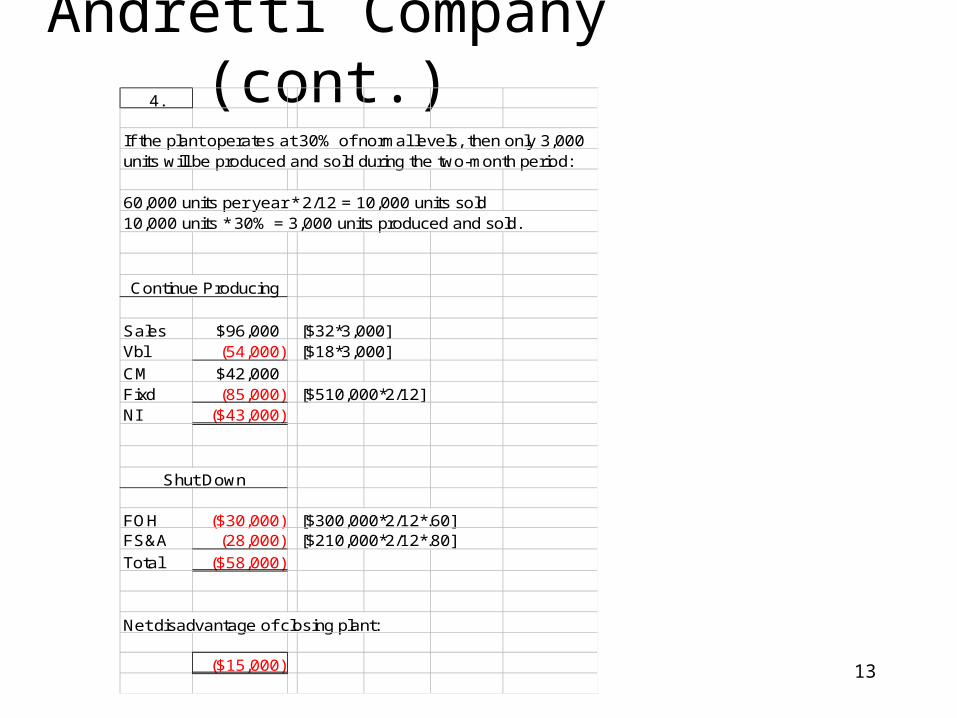
Andretti Company (cont.)4.
If the plant operates at 30% of normal levels, then only 3,000units will be produced and sold during the two-month period:
60,000 units per year * 2/12 = 10,000 units sold10,000 units * 30% = 3,000 units produced and sold.
Continue Producing
Sales $96,000 [$32*3,000]Vbl (54,000) [$18*3,000]
CM $42,000Fixd (85,000) [$510,000*2/12]NI ($43,000)
Shut Down
FOH ($30,000) [$300,000*2/12*.60]FS&A (28,000) [$210,000*2/12*.80]
Total ($58,000)
Net disadvantage of closing plant:
($15,000)
14
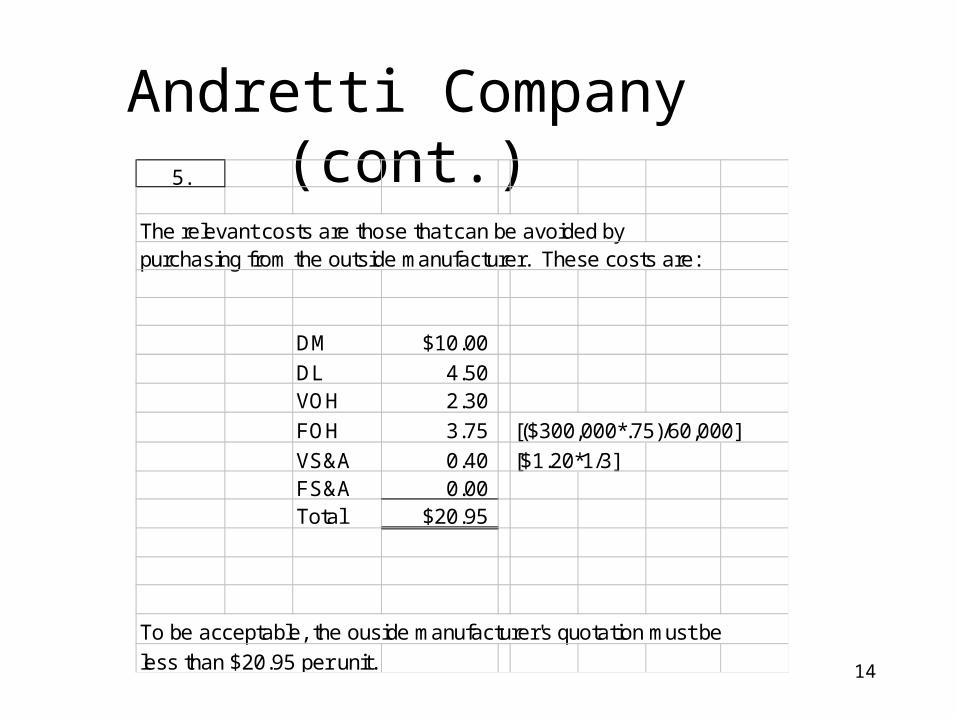
Andretti Company (cont.)5.
The relevant costs are those that can be avoided bypurchasing from the outside manufacturer. These costs are:
DM $10.00
DL 4.50VOH 2.30
FOH 3.75 [($300,000*.75)/60,000]
VS&A 0.40 [$1.20*1/3]FS&A 0.00Total $20.95
To be acceptable, the ouside manufacturer's quotation must be
less than $20.95 per unit.
15
Apple Appliances
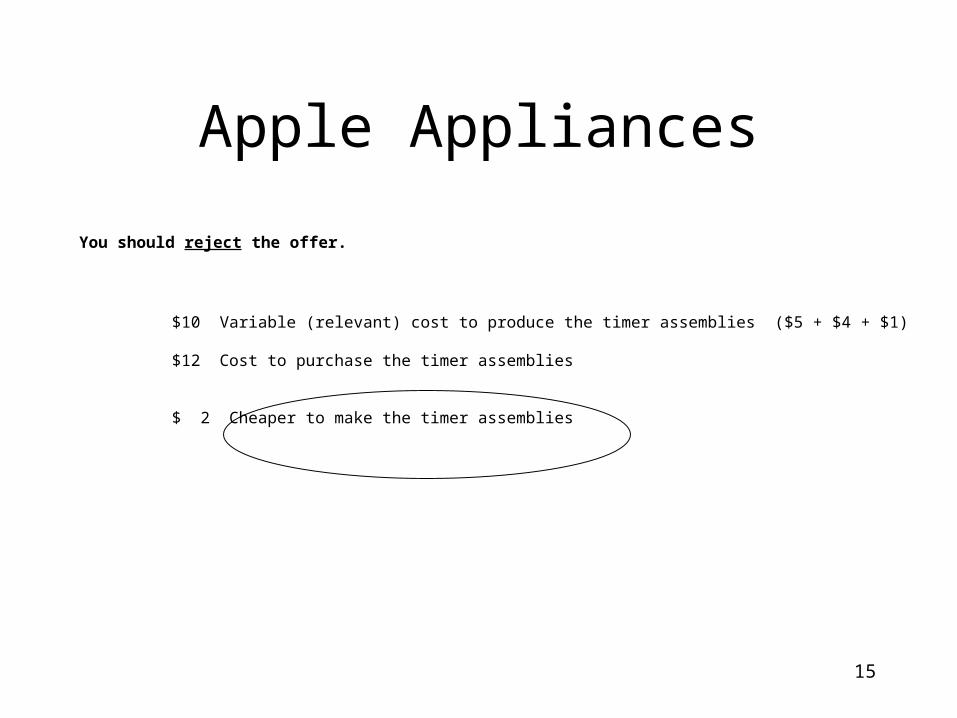
You should reject the offer.
$10 Variable (relevant) cost to produce the timer assemblies ($5 + $4 + $1)
$12 Cost to purchase the timer assemblies
$ 2 Cheaper to make the timer assemblies
16
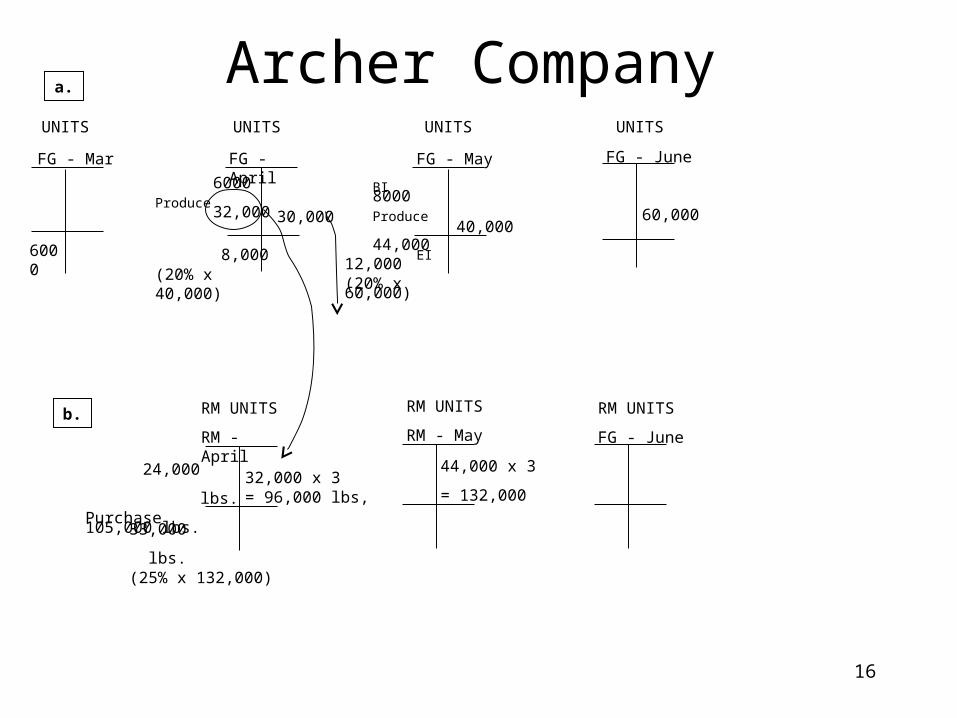
UNITS UNITS UNITS UNITS
FG - Mar FG - April FG - May FG - June
6000
6000
32,000
8,000(20% x 40,000)
Produce30,000
BI 8000Produce 44,000 40,000
EI 12,000(20% x 60,000)
60,000
RM UNITS
RM - April
RM UNITS
RM - May
RM UNITS
FG - June
44,000 x 3
= 132,000
33,000 lbs.(25% x 132,000)
24,000 lbs.Purchase 105,000 lbs.
32,000 x 3= 96,000 lbs,
Archer Companya.
b.
17
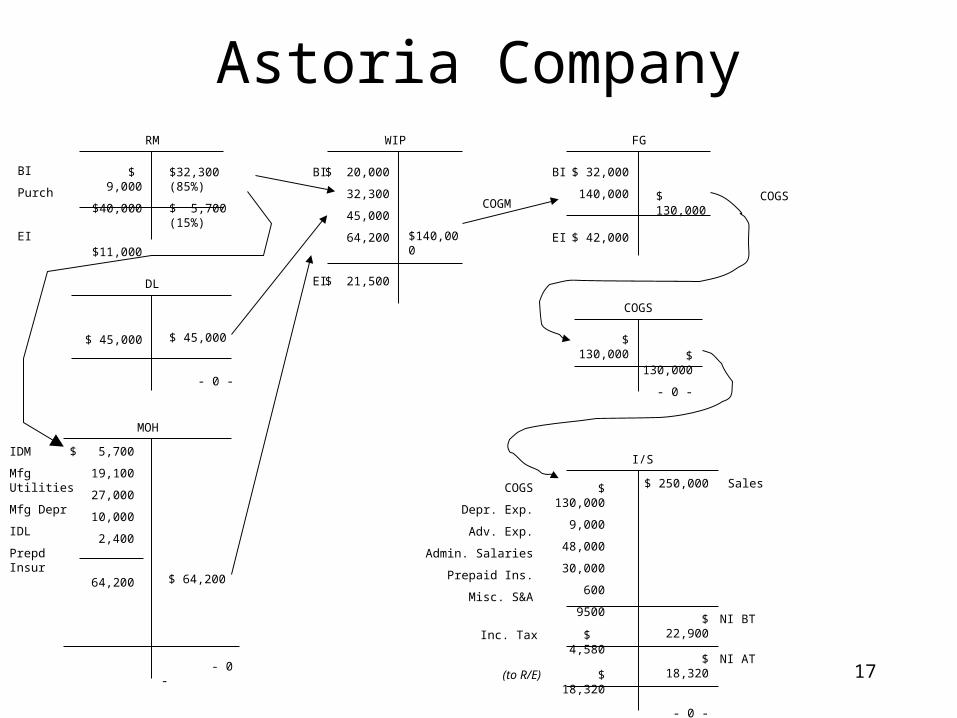
$ 9,000
$40,000
$11,000
$32,300 (85%)
$ 5,700 (15%)
RM
BI
Purch
EI
$ 20,000
32,300
45,000
64,200
$ 21,500
$140,000
BI
EI
WIP
$ 32,000
140,000
$ 42,000
$ 130,000
BI
EI
FG
$ 45,000 $ 45,000
- 0 -
DL
MOH
$ 5,700
19,100
27,000
10,000
2,400
64,200 $ 64,200
- 0 -
IDM
Mfg Utilities
Mfg Depr
IDL
Prepd Insur
COGS
I/S
$ 130,000
9,000
48,000
30,000
600
9500
$ 250,000COGS
Depr. Exp.
Adv. Exp.
Admin. Salaries
Prepaid Ins.
Misc. S&A
Sales
NI BT
$ 130,000
- 0 -
$ 130,000
COGS
Astoria Company
$ 22,900$ 4,580Inc. Tax
NI AT$ 18,320$ 18,320
- 0 -
(to R/E)
COGM
18
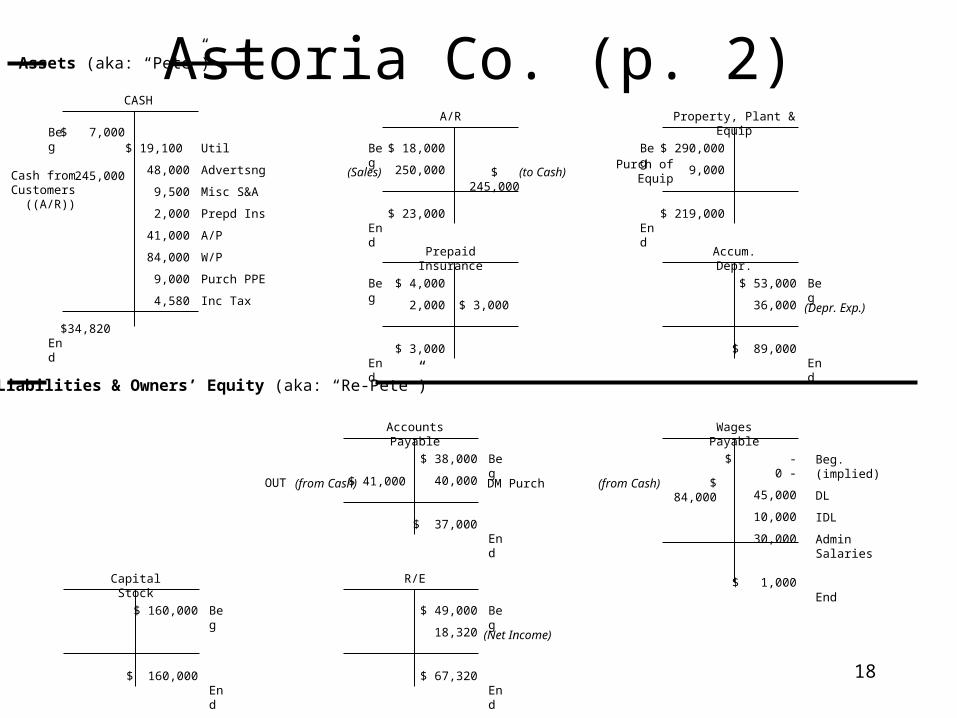
Astoria Co. (p. 2)$ 7,000
245,000
$34,820
$ 19,100
48,000
9,500
2,000
41,000
84,000
9,000
4,580
Beg
End
CASH
Assets (aka: “Pete”)
$ 18,000
250,000
$ 23,000
$ 245,000
Beg
End
A/R
$ 290,000
9,000
$ 219,000
Beg
End
Property, Plant & Equip
$ 53,000
36,000
$ 89,000
Beg
End
Accum. Depr.
Cash fromCustomers
((A/R))
Util
Advertsng
Misc S&A
Prepd Ins
A/P
W/P
Purch PPE
Inc Tax
Liabilities & Owners’ Equity (aka: “Re-Pete”)
$ 38,000
40,000
$ 37,000
Beg
End
Accounts Payable
$ - 0 -
45,000
10,000
30,000
$ 1,000
Wages Payable
$ 160,000
$ 160,000
Beg
End
Capital Stock
$ 49,000
18,320
$ 67,320
Beg
End
R/E
$ 84,000
(to Cash)(Sales)
(Depr. Exp.)
(Net Income)
$ 4,000
2,000
$ 3,000
Beg
End
Prepaid Insurance
Beg. (implied)
DL
IDL
Admin Salaries
End
(from Cash)
Purch ofEquip
$ 3,000
$ 41,000 DM Purch(from Cash)OUT

19
Astoria Company (p. 3)Cannon Beach Sand Company
Balance SheetAs of December 31, 2001
Assets CashA/RPrepd InsurPPEAccum DeprRMWIPFG
Total
$ 34,820 23,000 3,000
219,000 (89,000)11,000 21,500 42,000
$265,320
Liabilities& Owners’Equity
A/PW/PC/SR/E
Total
$ 37,000 1,000
160,000 67,320
$265,320
20
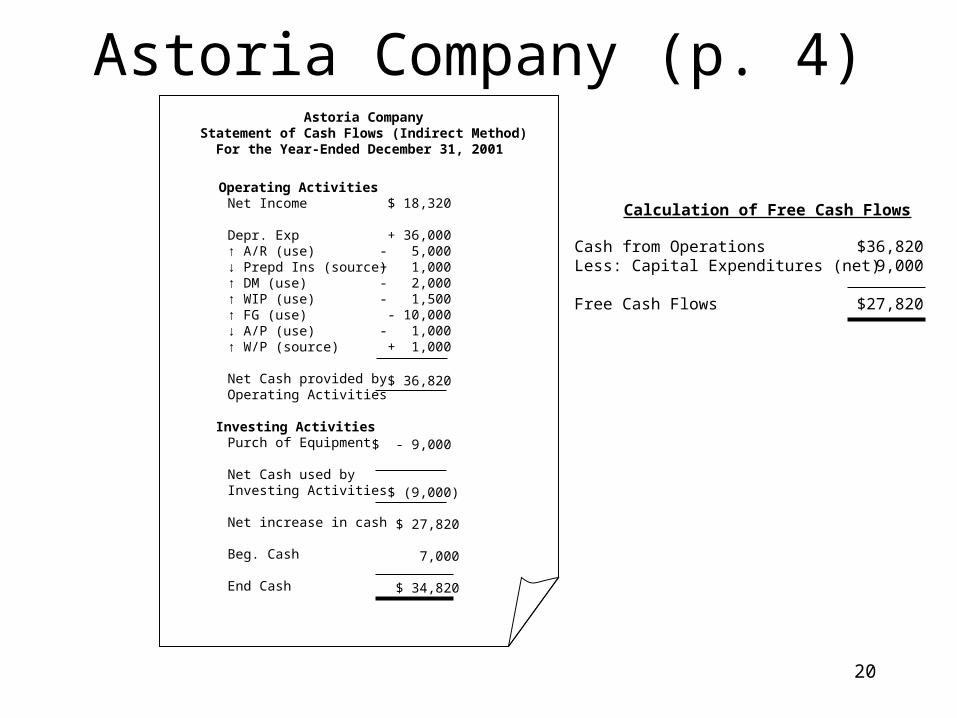
Astoria Company (p. 4)Astoria Company
Statement of Cash Flows (Indirect Method)For the Year-Ended December 31, 2001
Net Income
Depr. Exp↑ A/R (use)↓ Prepd Ins (source)↑ DM (use)↑ WIP (use)↑ FG (use)↓ A/P (use)↑ W/P (source)
Net Cash provided byOperating Activities
Purch of Equipment
Net Cash used byInvesting Activities
Net increase in cash
Beg. Cash
End Cash
$ 18,320
+ 36,000 - 5,000 + 1,000 - 2,000 - 1,500 - 10,000 - 1,000 + 1,000
$ 36,820
$ - 9,000
$ (9,000)
$ 27,820
7,000
$ 34,820
Calculation of Free Cash Flows
Cash from OperationsLess: Capital Expenditures (net)
Free Cash Flows
$36,8209,000
$27,820
Operating Activities
Investing Activities
21
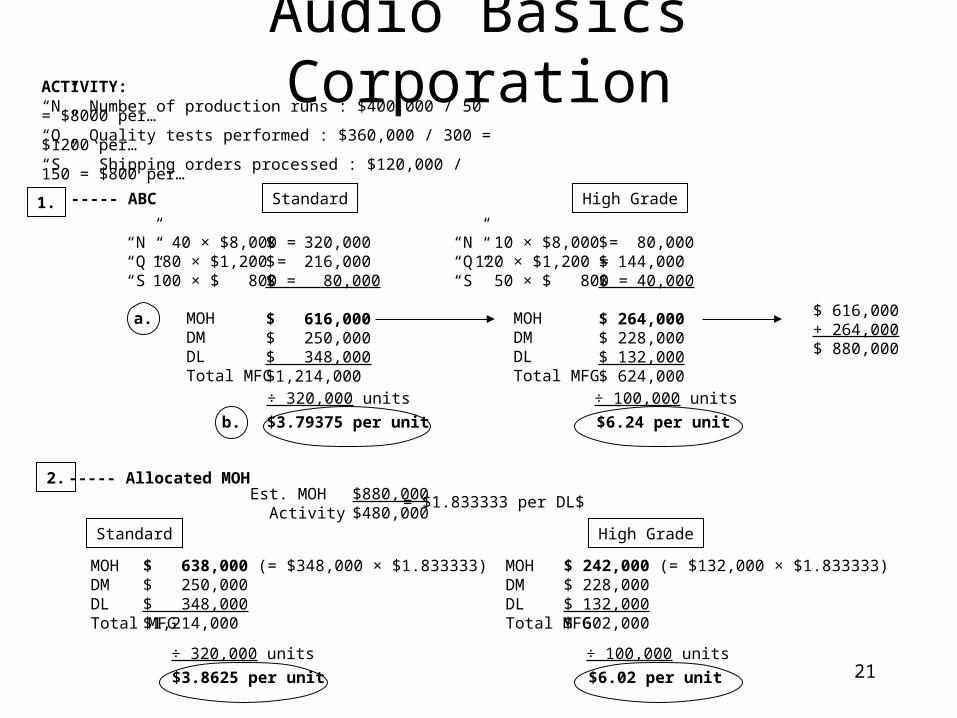
ACTIVITY:“N” Number of production runs : $400,000 / 50 = $8000 per…“Q” Quality tests performed : $360,000 / 300 = $1200 per…“S” Shipping orders processed : $120,000 / 150 = $800 per…
Audio Basics Corporation
1. ----- ABC Standard High Grade
“N”“Q”“S”
40 × $8,000 =180 × $1,200 =100 × $ 800 =
$ 320,000$ 216,000$ 80,000
$ 616,000$ 250,000$ 348,000$1,214,000
MOHDMDLTotal MFG
÷ 320,000 units
$3.79375 per unit
“N”“Q”“S”
10 × $8,000 =120 × $1,200 = 50 × $ 800 =
$ 80,000$ 144,000$ 40,000
$ 264,000$ 228,000$ 132,000$ 624,000
MOHDMDLTotal MFG
÷ 100,000 units
$6.24 per unit
a.
b.
2. ----- Allocated MOHEst. MOH Activity
$880,000$480,000
= $1.833333 per DL$
$ 638,000 (= $348,000 × $1.833333)$ 250,000$ 348,000$1,214,000
MOHDMDLTotal MFG
÷ 320,000 units
$3.8625 per unit
$ 242,000 (= $132,000 × $1.833333)$ 228,000$ 132,000$ 602,000
MOHDMDLTotal MFG
÷ 100,000 units
$6.02 per unit
Standard High Grade
$ 616,000+ 264,000$ 880,000
22
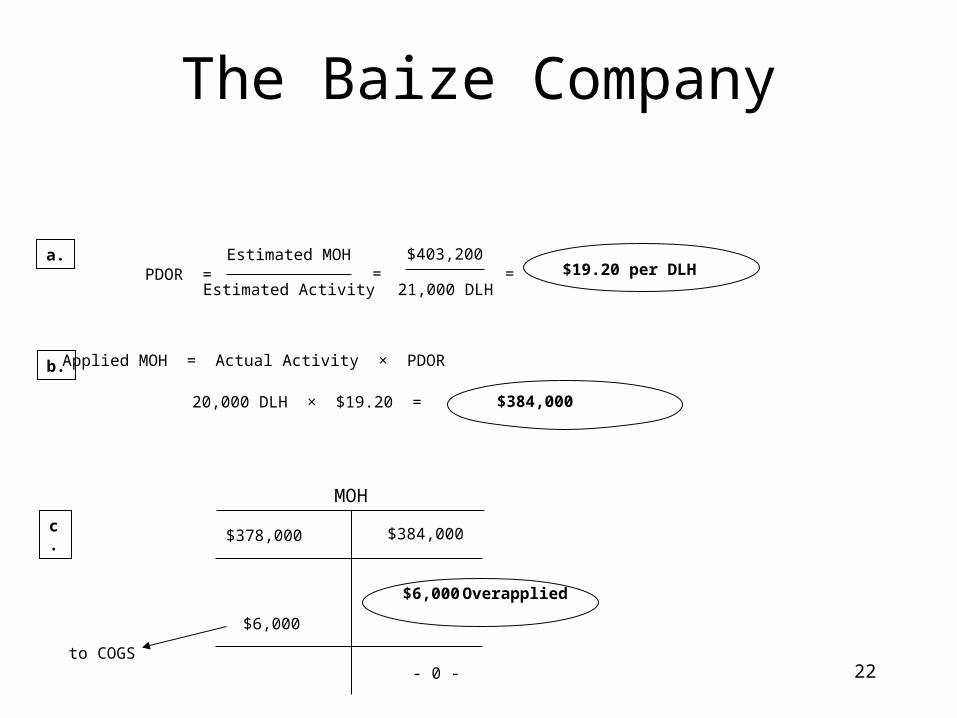
The Baize Company
PDOR = Estimated MOH
Estimated Activity=
$403,200
21,000 DLH= $19.20 per DLH
a.
b.
c.
Applied MOH = Actual Activity × PDOR
20,000 DLH × $19.20 = $384,000
MOH
$378,000 $384,000
$6,000
$6,000
- 0 -to COGS
Overapplied
23
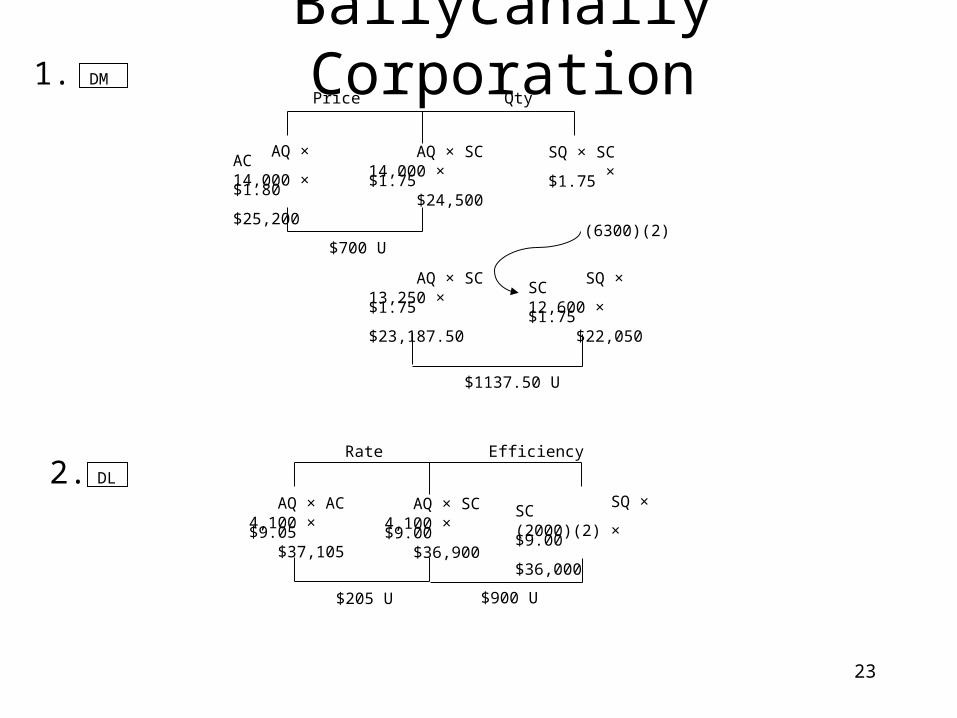
1.
2.
DMPrice Qty
AQ × AC14,000 × $1.80 $25,200
AQ × SC14,000 × $1.75 $24,500
SQ × SC × $1.75
$700 U
AQ × SC13,250 × $1.75 $23,187.50
SQ × SC12,600 × $1.75 $22,050
(6300)(2)
$1137.50 U
DL
AQ × AC4,100 × $9.05 $37,105
AQ × SC4,100 × $9.00 $36,900
SQ × SC(2000)(2) × $9.00 $36,000
$205 U
Rate Efficiency
$900 U
Ballycanally Corporation
24
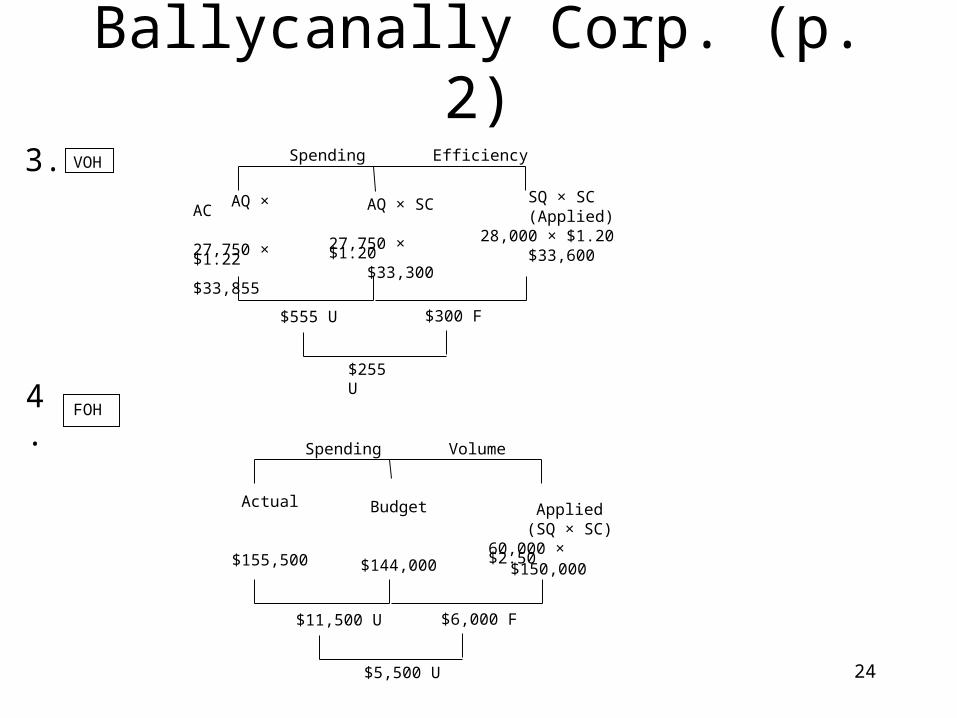
AQ × AC
27,750 × $1.22 $33,855
AQ × SC
27,750 × $1.20 $33,300
$555 U
Spending Efficiency
$300 F
SQ × SC (Applied)28,000 × $1.20 $33,600
VOH3.
$255 U
4. FOH
Actual
$155,500
Budget
$144,000
$11,500 U
Spending Volume
$6,000 F
$5,500 U
Applied (SQ × SC)60,000 × $2.50
$150,000
Ballycanally Corp. (p. 2)
25
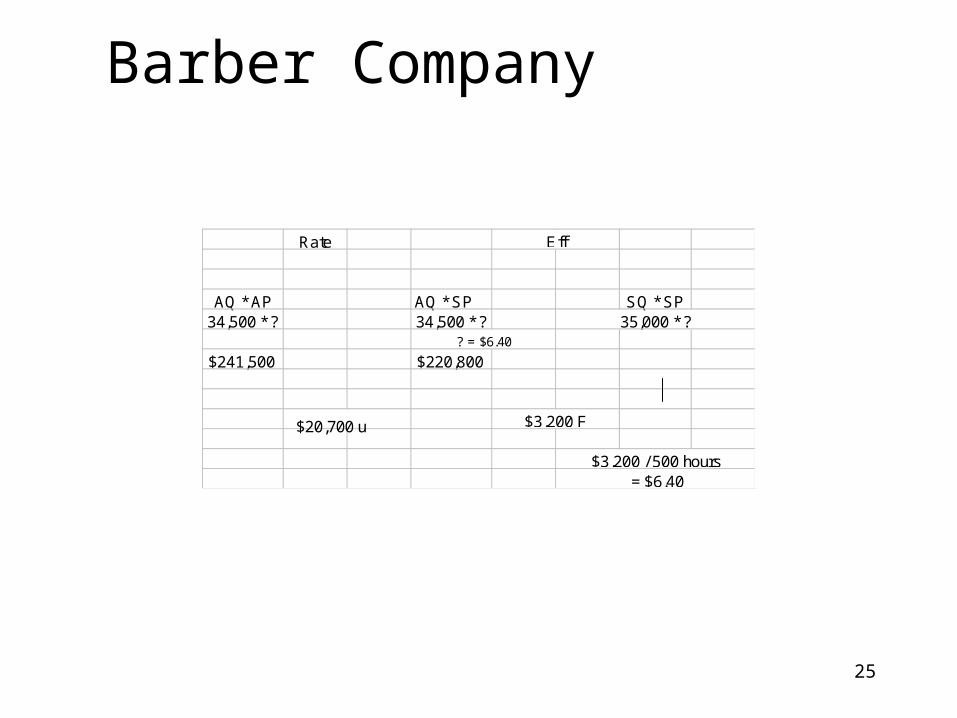
Barber Company
Rate
AQ * AP AQ * SP SQ * SP34,500 * ? 34,500 * ? 35,000 * ?
$241,500 $220,800
$3,200 / 500 hours = $6.40
Eff
$3,200 F
? = $6.40
$20,700 u
26
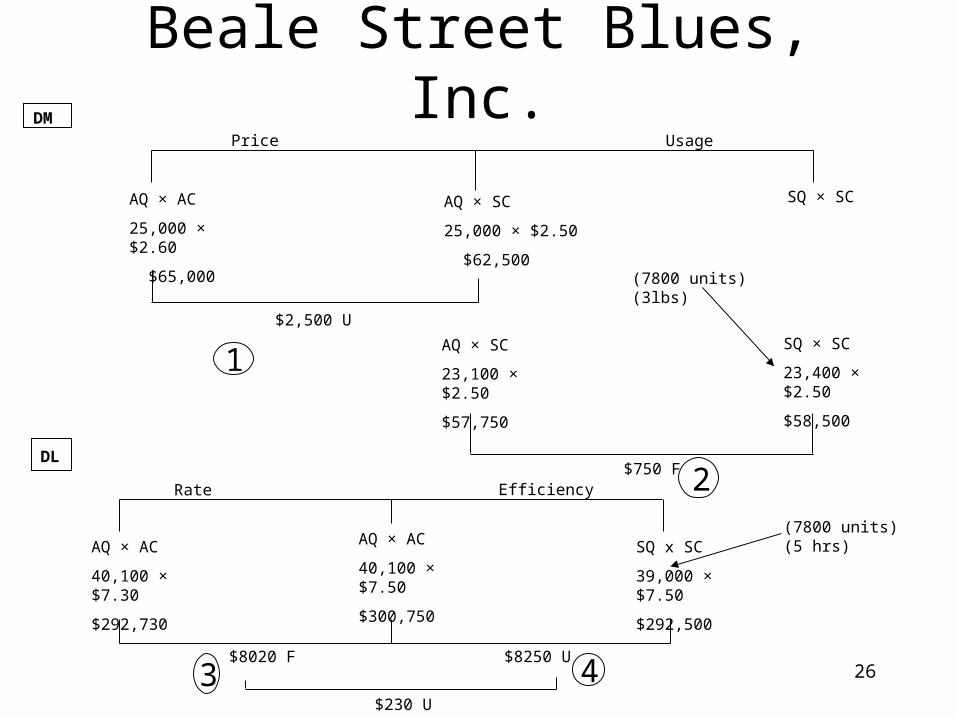
Price Usage
AQ × AC
25,000 × $2.60
$65,000
AQ × SC
25,000 × $2.50
$62,500
SQ × SC
$2,500 U
1AQ × SC
23,100 × $2.50
$57,750
SQ × SC
23,400 × $2.50
$58,500
(7800 units)(3lbs)
$750 F 2
DM
DL
Rate Efficiency
AQ × AC
40,100 × $7.30
$292,730
AQ × AC
40,100 × $7.50
$300,750
SQ x SC
39,000 × $7.50
$292,500
$8020 F $8250 U
$230 U
3 4
(7800 units)(5 hrs)
Beale Street Blues, Inc.
27
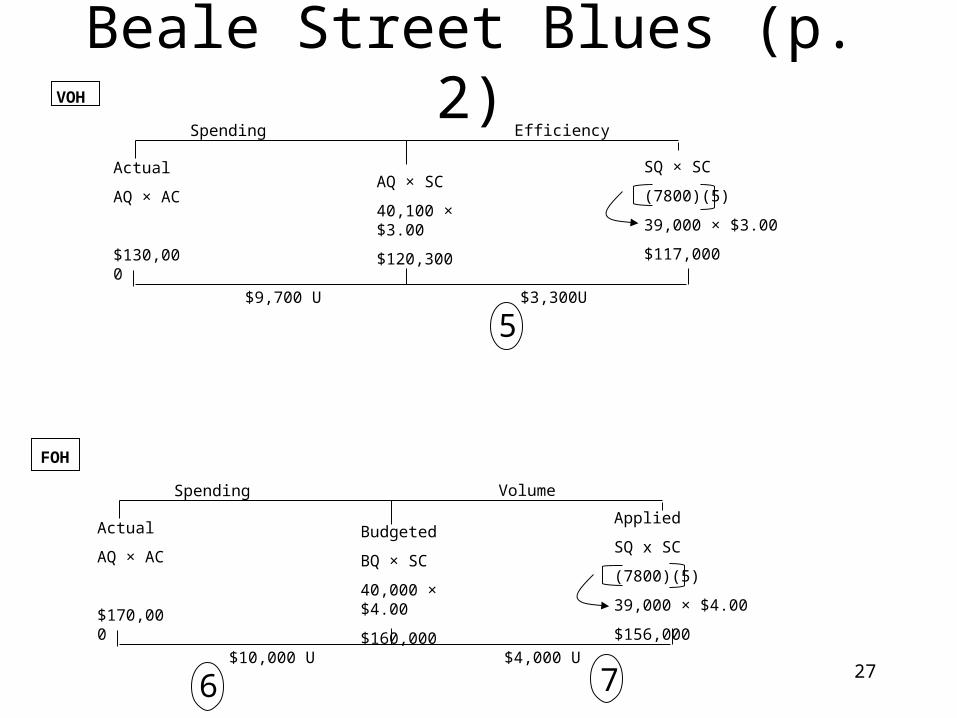
FOH
Spending Volume
Actual
AQ × AC
$170,000
Budgeted
BQ × SC
40,000 × $4.00
$160,000
$10,000 U $4,000 U
Applied
SQ x SC
(7800)(5)
39,000 × $4.00
$156,000
6
VOH
Spending Efficiency
Actual
AQ × AC
$130,000
AQ × SC
40,100 × $3.00
$120,300
$9,700 U $3,300U
5
SQ × SC
(7800)(5)
39,000 × $3.00
$117,000
Beale Street Blues (p. 2)
7
28
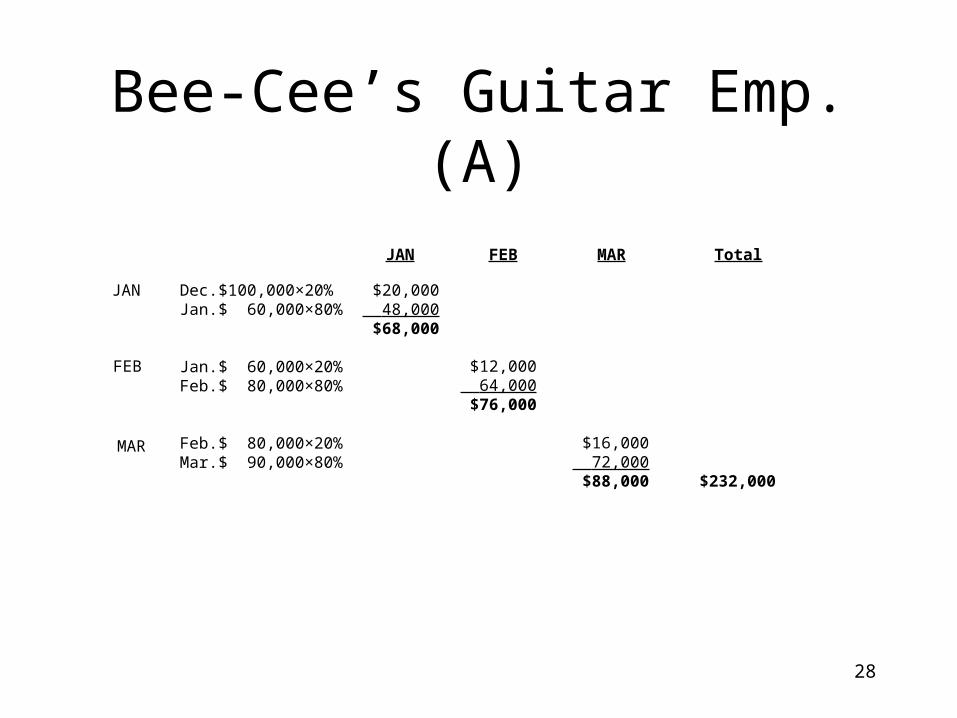
Bee-Cee’s Guitar Emp. (A)
JAN
FEB
MAR
Dec.Jan.
Jan.Feb.
Feb.Mar.
$100,000×20%$ 60,000×80%
$ 60,000×20%$ 80,000×80%
$ 80,000×20%$ 90,000×80%
$20,000 48,000$68,000
$12,000 64,000$76,000
$16,000 72,000$88,000
JAN FEB MAR Total
$232,000
29
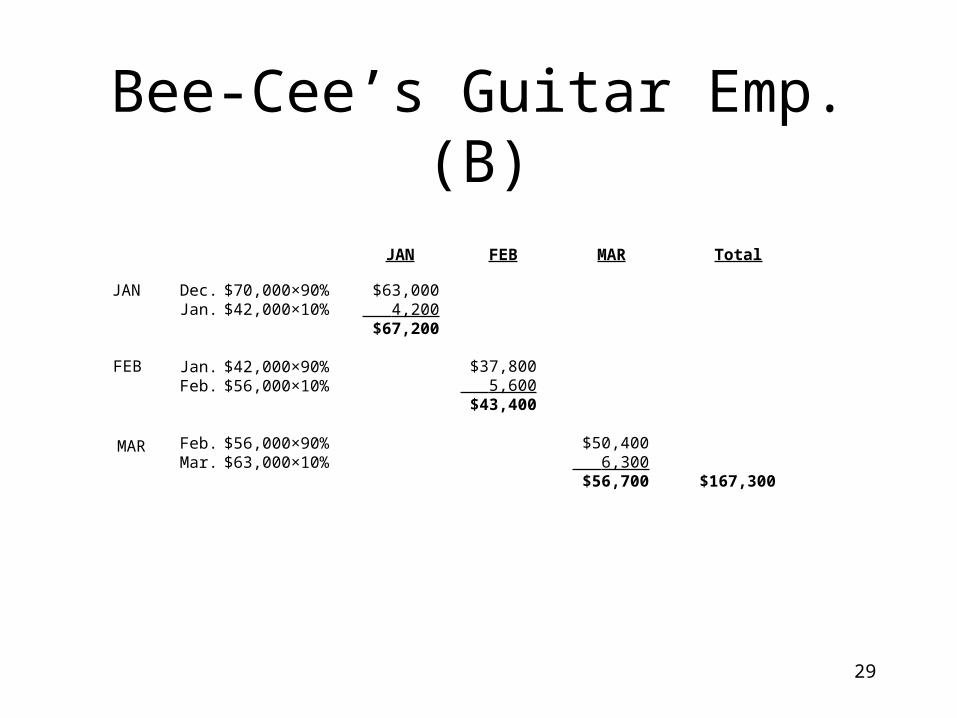
Bee-Cee’s Guitar Emp. (B)
JAN
FEB
MAR
Dec.Jan.
Jan.Feb.
Feb.Mar.
$70,000×90%$42,000×10%
$42,000×90%$56,000×10%
$56,000×90%$63,000×10%
$63,000 4,200$67,200
$37,800 5,600$43,400
$50,400 6,300$56,700
JAN FEB MAR Total
$167,300
30
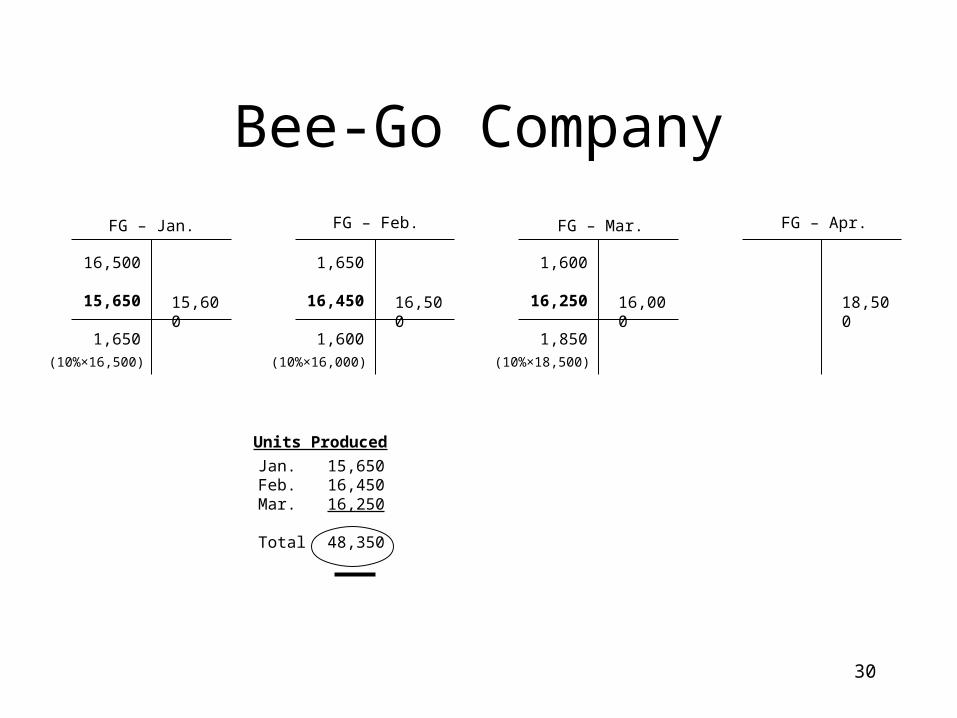
Bee-Go Company
FG – Jan. FG – Mar.FG – Feb. FG – Apr.
16,500
15,650
1,650
1,600
16,250
1,850
1,650
16,450
1,600
15,600 18,50016,00016,500
15,65016,45016,250
48,350
Jan.Feb.Mar.
Total
(10%×16,500) (10%×18,500)(10%×16,000)
Units Produced
31
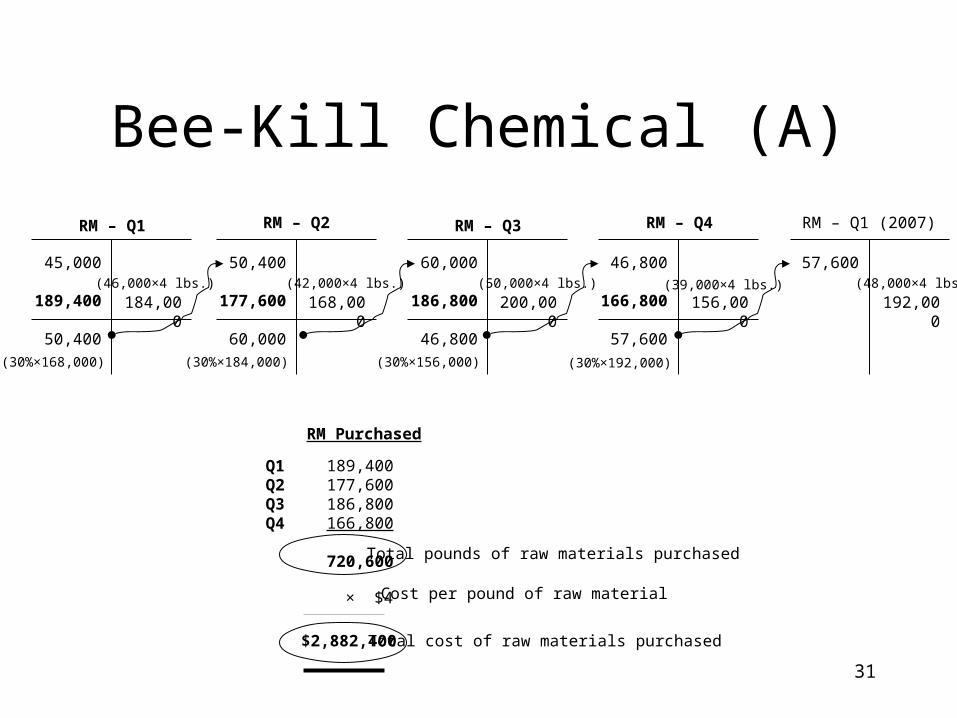
Bee-Kill Chemical (A)
RM – Q1 RM – Q3RM – Q2 RM – Q4
45,000
189,400
50,400
60,000
186,800
46,800
50,400
177,600
60,000
184,000
189,400177,600186,800166,800
720,600
Q1Q2Q3Q4
(30%×168,000) (30%×156,000)(30%×184,000)
RM – Q1 (2007)
46,800
166,800
57,600
168,000 200,000 156,000 192,000
(30%×192,000)
(46,000×4 lbs.) (48,000×4 lbs.)(39,000×4 lbs.)(50,000×4 lbs.)(42,000×4 lbs.)
57,600
× $4
$2,882,400
Total pounds of raw materials purchased
Total cost of raw materials purchased
RM Purchased
Cost per pound of raw material
32
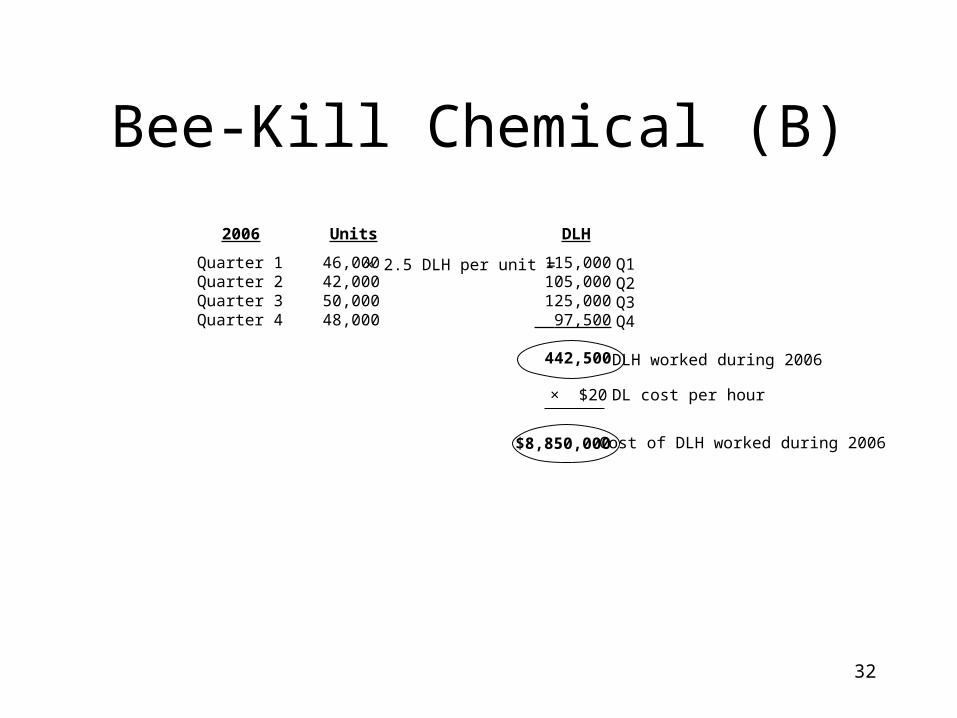
Bee-Kill Chemical (B)
Quarter 1Quarter 2Quarter 3Quarter 4
46,00042,00050,00048,000
Units
115,000105,000125,000 97,500
442,500
DLH
× 2.5 DLH per unit =
DLH worked during 2006
× $20 DL cost per hour
$8,850,000 Cost of DLH worked during 2006
2006
Q1Q2Q3Q4
33
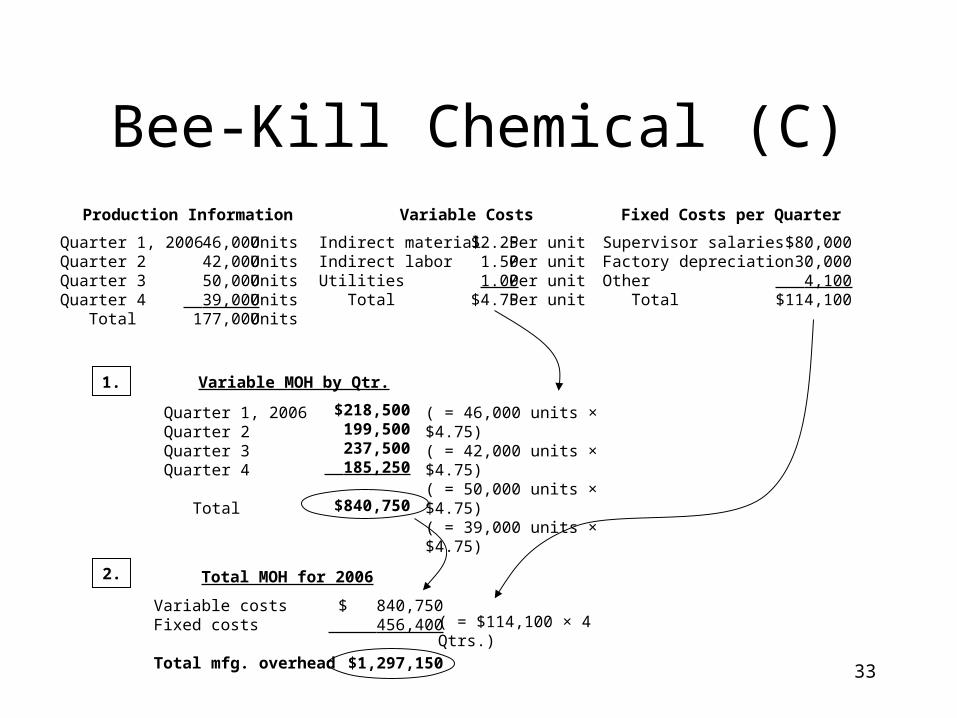
Bee-Kill Chemical (C)
Quarter 1, 2006Quarter 2Quarter 3Quarter 4 Total
46,00042,00050,000
39,000177,000
UnitsUnitsUnitsUnitsUnits
Production Information
Indirect materialIndirect laborUtilities Total
$2.251.501.00
$4.75
Per unitPer unitPer unitPer unit
Variable Costs
Supervisor salariesFactory depreciationOther Total
$80,00030,000
4,100$114,100
Fixed Costs per Quarter
1.
2.
$218,500199,500237,500
185,250
$840,750
Variable costsFixed costs
Total mfg. overhead
$ 840,750 456,400
$1,297,150
( = $114,100 × 4 Qtrs.)
Quarter 1, 2006Quarter 2Quarter 3Quarter 4
Total
Variable MOH by Qtr.
Total MOH for 2006
( = 46,000 units × $4.75)( = 42,000 units × $4.75)( = 50,000 units × $4.75)( = 39,000 units × $4.75)
34
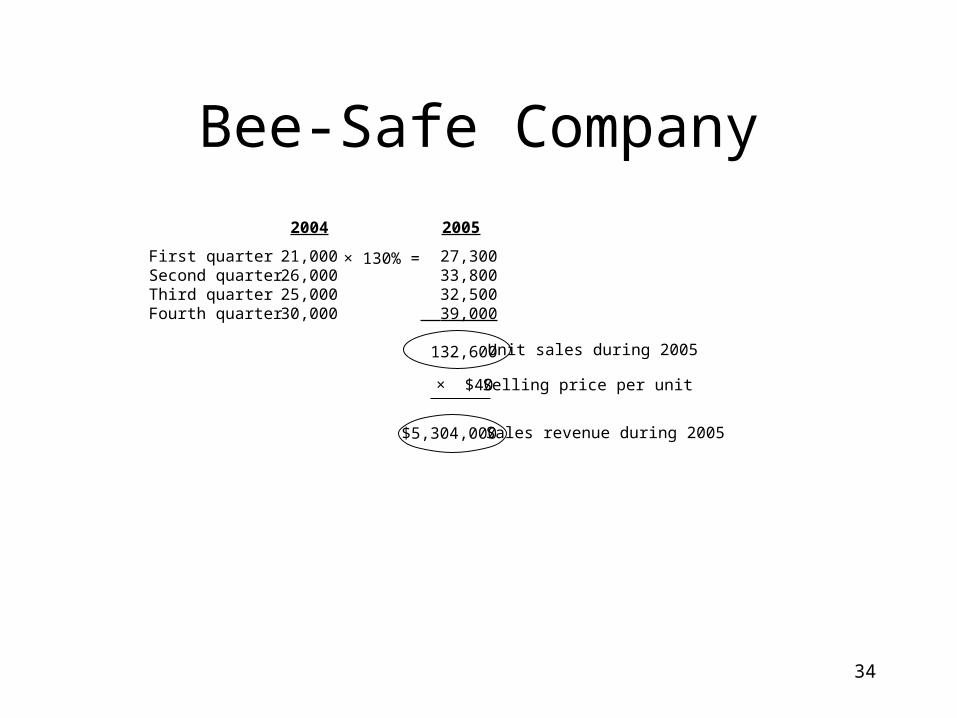
Bee-Safe Company
First quarterSecond quarterThird quarterFourth quarter
21,00026,00025,00030,000
2004
27,30033,80032,500
39,000
132,600
2005
× 130% =
Unit sales during 2005
× $40 Selling price per unit
$5,304,000 Sales revenue during 2005
35
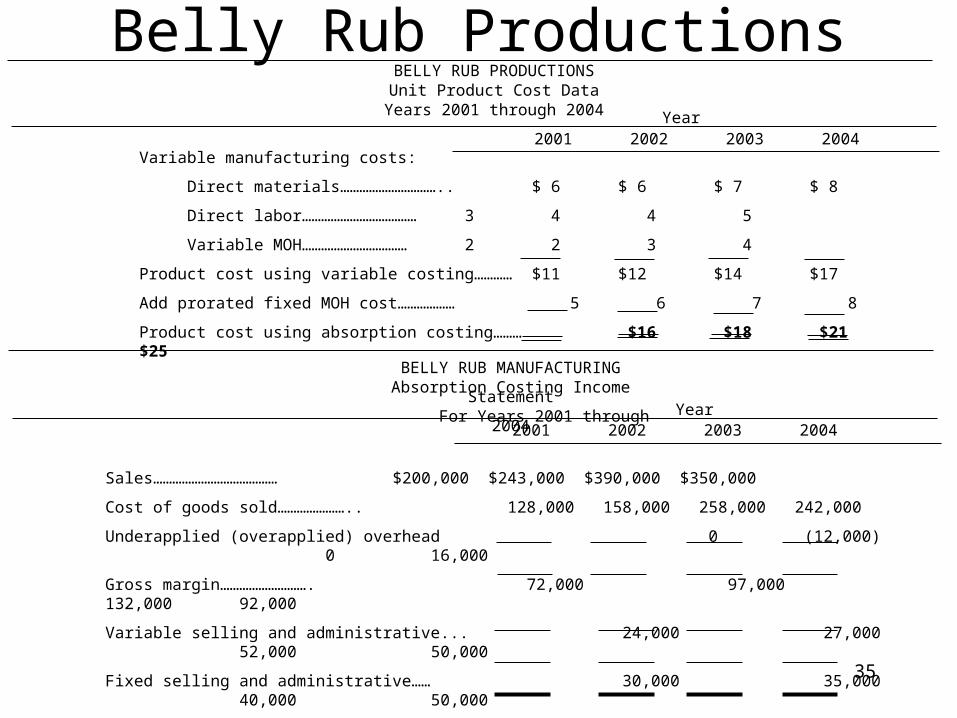
BELLY RUB PRODUCTIONSUnit Product Cost Data
Years 2001 through 2004 Year2001 2002 2003 2004
Variable manufacturing costs:
Direct materials………………………….. $ 6 $ 6 $ 7 $ 8
Direct labor……………………………… 3 4 4 5
Variable MOH…………………………… 2 2 3 4
Product cost using variable costing………… $11 $12 $14 $17
Add prorated fixed MOH cost……………… 5 6 7 8
Product cost using absorption costing……… $16 $18 $21 $25
BELLY RUB MANUFACTURINGAbsorption Costing Income Statement
For Years 2001 through 2004
Sales………………………………… $200,000 $243,000 $390,000 $350,000
Cost of goods sold………………….. 128,000 158,000 258,000 242,000
Underapplied (overapplied) overhead 0 (12,000) 0 16,000
Gross margin………………………. 72,000 97,000 132,000 92,000
Variable selling and administrative... 24,000 27,000 52,000 50,000
Fixed selling and administrative…… 30,000 35,000 40,000 50,000
Total operating expenses…………… 54,000 62,000 92,000 100,000
Net income………………………… $18,000 $35,000 $40,000 $ (8,000)
Year2001 2002 2003 2004
Belly Rub Productions
36
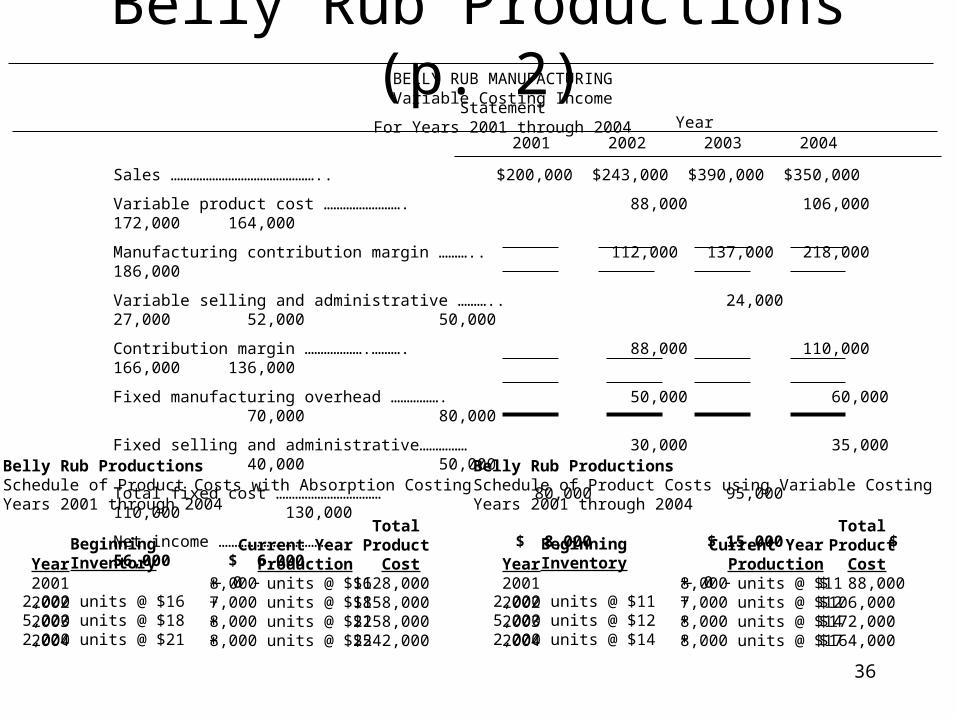
Belly Rub Productions (p. 2)BELLY RUB MANUFACTURINGVariable Costing Income Statement
For Years 2001 through 2004
Sales ……………………………………….. $200,000 $243,000 $390,000 $350,000
Variable product cost ……………………. 88,000 106,000 172,000 164,000
Manufacturing contribution margin ……….. 112,000 137,000 218,000 186,000
Variable selling and administrative ……….. 24,000 27,000 52,000 50,000
Contribution margin ……………….………. 88,000 110,000 166,000 136,000
Fixed manufacturing overhead ……………. 50,000 60,000 70,000 80,000
Fixed selling and administrative…………… 30,000 35,000 40,000 50,000
Total fixed cost …………………………… 80,000 95,000 110,000 130,000
Net income ……………………………….. $ 8,000 $ 15,000 $ 56,000 $ 6,000
Year2001 2002 2003 2004
Belly Rub ProductionsSchedule of Product Costs with Absorption CostingYears 2001 through 2004
Year2001200220032004
Beginning Inventory - 0 -2,000 units @ $165,000 units @ $182,000 units @ $21
++++
Current Year Production8,000 units @ $167,000 units @ $188,000 units @ $218,000 units @ $25
Total Product Cost$128,000$158,000$258,000$242,000
Belly Rub ProductionsSchedule of Product Costs using Variable CostingYears 2001 through 2004
Year2001200220032004
Beginning Inventory - 0 -2,000 units @ $115,000 units @ $122,000 units @ $14
++++
Current Year Production8,000 units @ $117,000 units @ $128,000 units @ $148,000 units @ $17
Total Product Cost$ 88,000$106,000$172,000$164,000
37
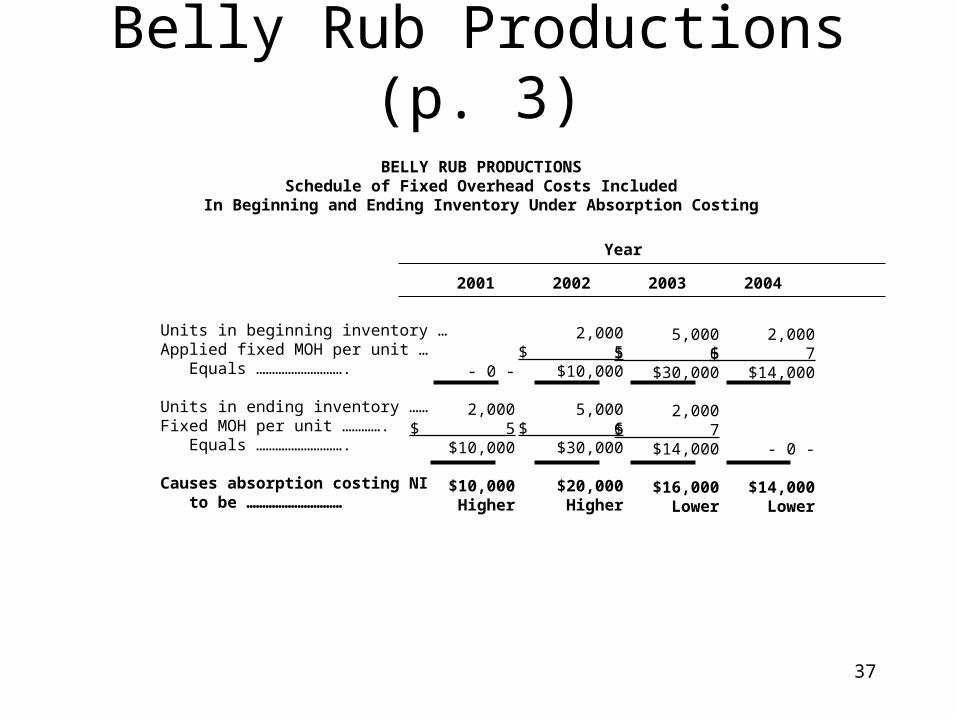
Belly Rub Productions (p. 3)
BELLY RUB PRODUCTIONSSchedule of Fixed Overhead Costs Included
In Beginning and Ending Inventory Under Absorption Costing
Year
2001 2002 2003 2004
Units in beginning inventory …Applied fixed MOH per unit … Equals ……………………….
Units in ending inventory ……Fixed MOH per unit …………. Equals ……………………….
Causes absorption costing NI to be …………………………
- 0 -
2,000$ 5$10,000
$10,000Higher
2,000$ 5$10,000
5,000$ 6$30,000
$20,000Higher
5,000$ 6$30,000
2,000$ 7$14,000
$16,000Lower
2,000$ 7$14,000
- 0 -
$14,000Lower
38
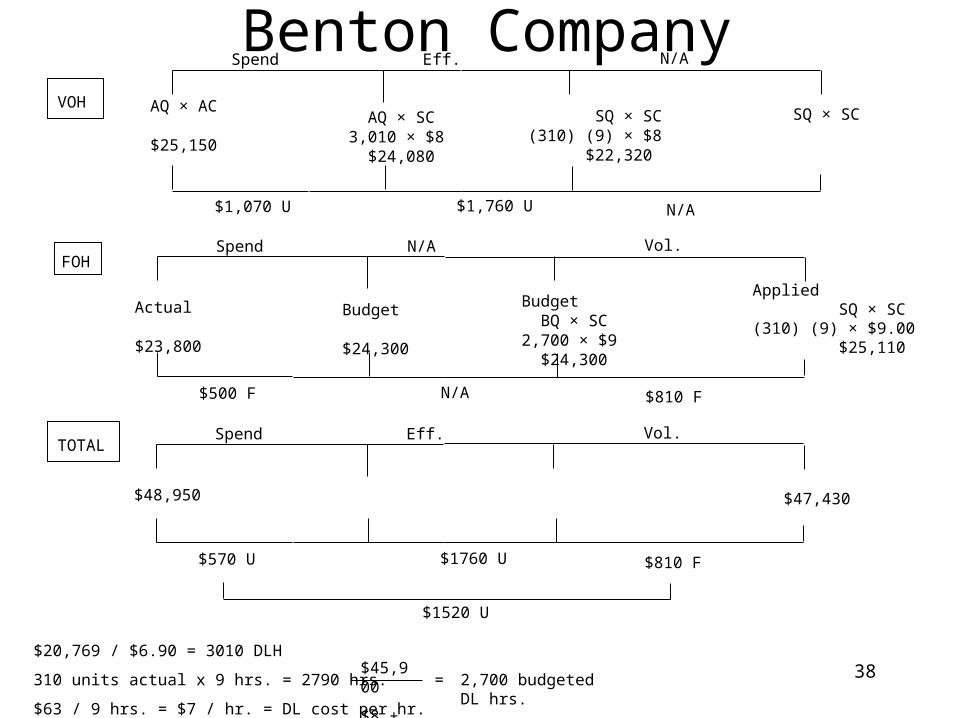
AQ × AC
$25,150
AQ × SC3,010 × $8 $24,080
$1,070 U
Spend Eff.
$1,760 U
N/A
N/A
SQ × SC(310) (9) × $8 $22,320
SQ × SCVOH
Actual
$23,800
Budget
$24,300
$500 F
Spend N/A
N/A
Vol.
$810 F
Budget BQ × SC2,700 × $9 $24,300
Applied SQ × SC(310) (9) × $9.00 $25,110
FOH
$48,950
$570 U
Spend Eff.
$1760 U
Vol.
$810 F
$1520 U
$20,769 / $6.90 = 3010 DLH
310 units actual x 9 hrs. = 2790 hrs.
$63 / 9 hrs. = $7 / hr. = DL cost per hr.
$45,900
$8 + $9= 2,700 budgeted DL hrs.
TOTAL
Benton Company
$47,430
39
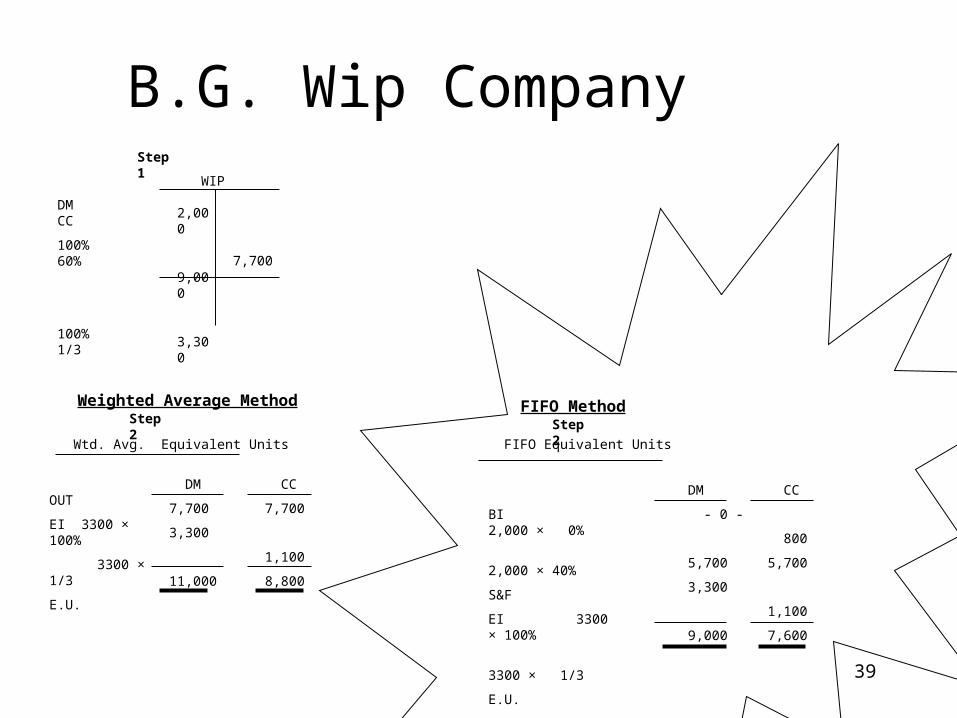
B.G. Wip CompanyStep 1
DM CC
100% 60%
100% 1/3
WIP
2,000
9,000
3,300
7,700
Step 2
Wtd. Avg. Equivalent Units
OUT
EI 3300 × 100%
3300 × 1/3
E.U.
DM CC
7,700 7,700
3,300
1,100
11,000 8,800
Weighted Average Method
Step 2
BI 2,000 × 0%
2,000 × 40%
S&F
EI 3300 × 100%
3300 × 1/3
E.U.
DM CC
- 0 -
800
5,700 5,700
3,300
1,100
9,000 7,600
FIFO Method
FIFO Equivalent Units
40
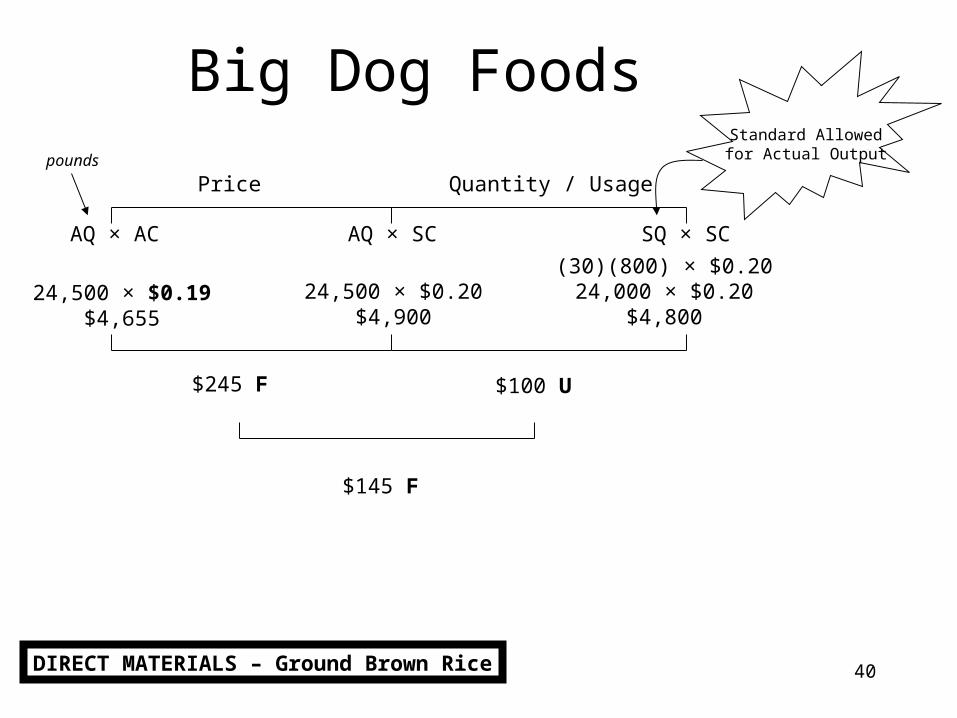
Big Dog FoodsStandard Allowedfor Actual Output
Price Quantity / Usage
AQ × AC AQ × SC SQ × SC
pounds
24,500 × $0.19$4,655
(30)(800) × $0.2024,000 × $0.20
$4,80024,500 × $0.20
$4,900
$245 F $100 U
$145 F
DIRECT MATERIALS – Ground Brown Rice
41
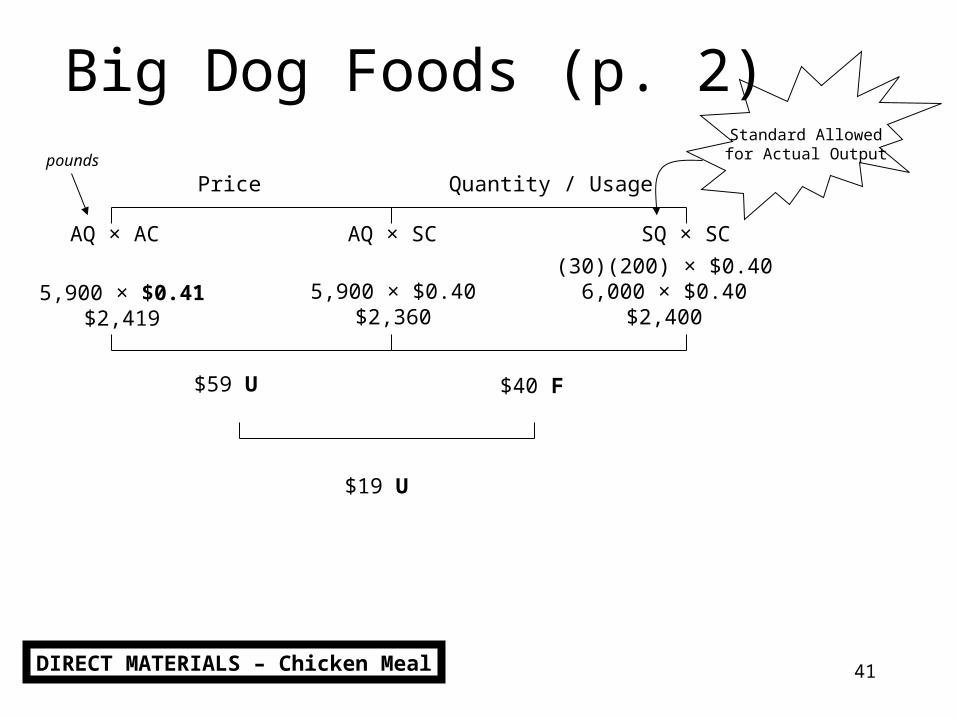
Big Dog Foods (p. 2)Standard Allowedfor Actual Output
Price Quantity / Usage
AQ × AC AQ × SC SQ × SC
pounds
5,900 × $0.41$2,419
(30)(200) × $0.406,000 × $0.40
$2,4005,900 × $0.40
$2,360
$59 U $40 F
$19 U
DIRECT MATERIALS – Chicken Meal
42
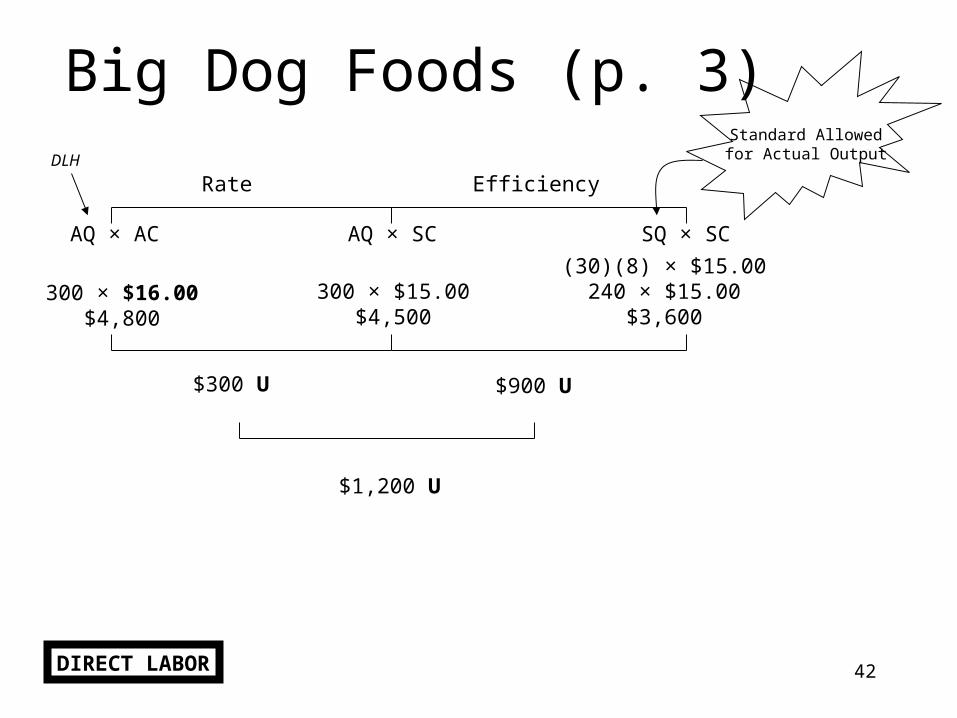
Big Dog Foods (p. 3)Standard Allowedfor Actual Output
Rate Efficiency
AQ × AC AQ × SC SQ × SC
DLH
300 × $16.00$4,800
(30)(8) × $15.00240 × $15.00
$3,600300 × $15.00
$4,500
$300 U $900 U
$1,200 U
DIRECT LABOR
43
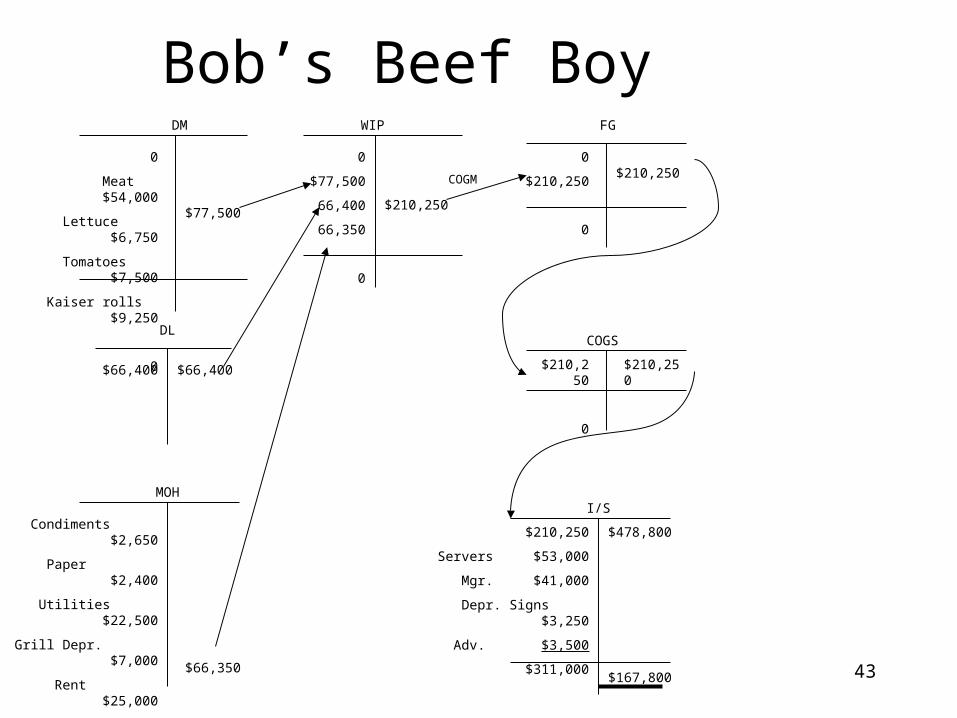
Bob’s Beef Boy0
Meat $54,000
Lettuce $6,750
Tomatoes $7,500
Kaiser rolls $9,250
0
$77,500
DM
$66,400 $66,400
DL
Condiments $2,650
Paper $2,400
Utilities $22,500
Grill Depr. $7,000
Rent $25,000
Cleaning $6,800
$66,350 $66,350
MOH
0
$77,500
66,400
66,350
0
$210,250
WIP
0
$210,250
0
$210,250
FG
$210,250
0
$210,250
COGS
COGM
$210,250
Servers $53,000
Mgr. $41,000
Depr. Signs $3,250
Adv. $3,500
$311,000
$478,800
$167,800
I/S
44
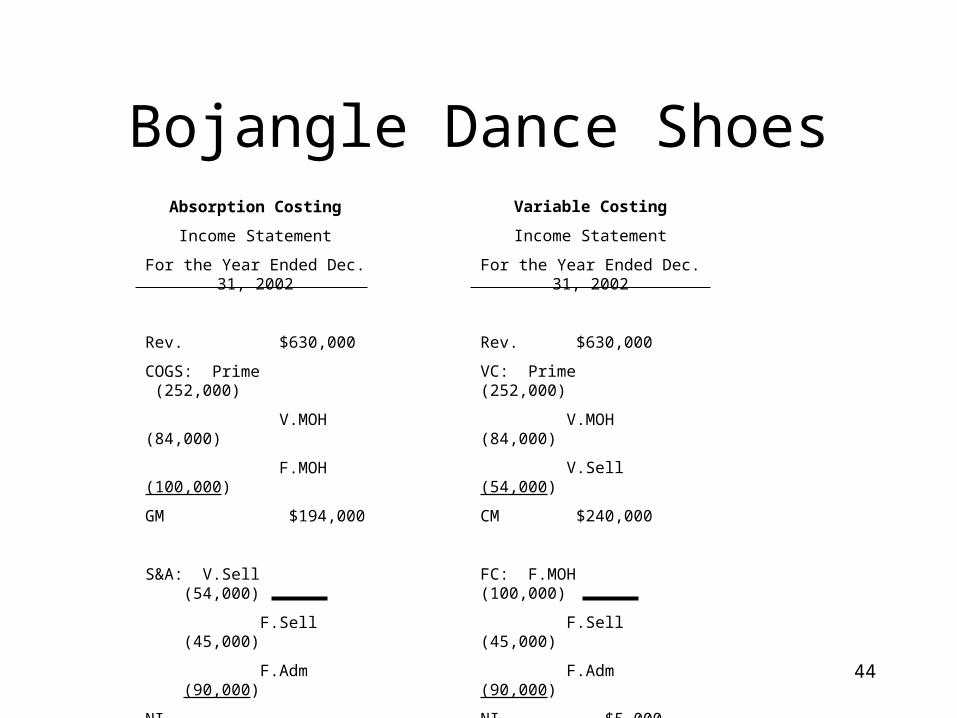
Absorption Costing
Income Statement
For the Year Ended Dec. 31, 2002
Rev. $630,000
COGS: Prime (252,000)
V.MOH (84,000)
F.MOH (100,000)
GM $194,000
S&A: V.Sell (54,000)
F.Sell (45,000)
F.Adm (90,000)
NI $5,000
Variable Costing
Income Statement
For the Year Ended Dec. 31, 2002
Rev. $630,000
VC: Prime (252,000)
V.MOH (84,000)
V.Sell (54,000)
CM $240,000
FC: F.MOH (100,000)
F.Sell (45,000)
F.Adm (90,000)
NI $5,000
Bojangle Dance Shoes
45
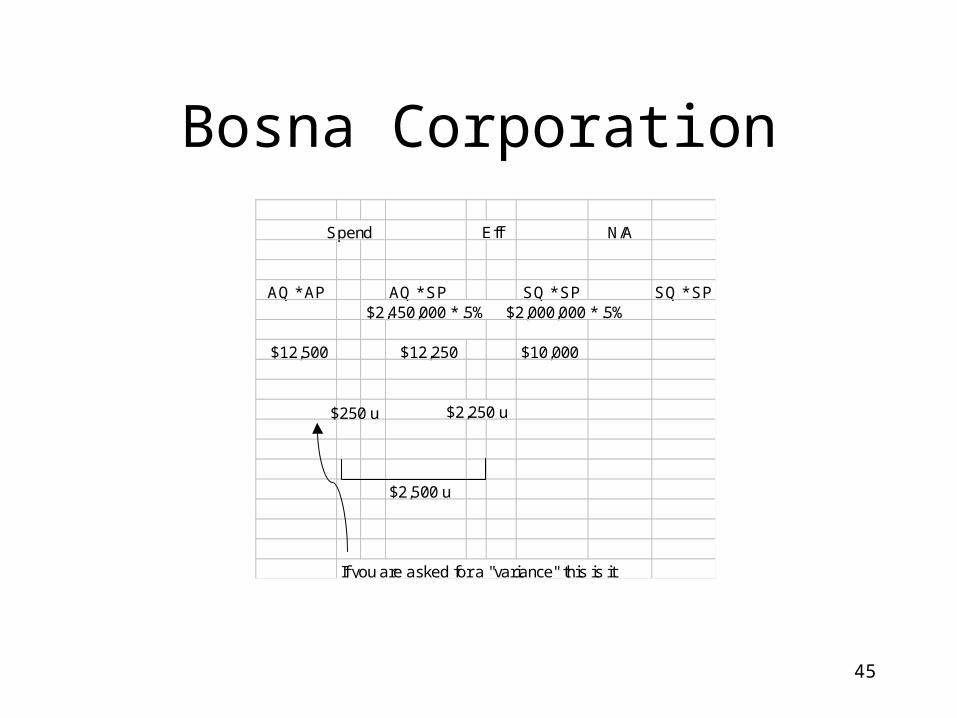
Bosna Corporation
Spend N/A
AQ * AP AQ * SP SQ * SP SQ * SP$2,450,000 * .5% $2,000,000 * .5%
$12,500 $12,250 $10,000
$2,250 u
$2,500 u
If you are asked for a "variance" this is it
Eff
$250 u
46
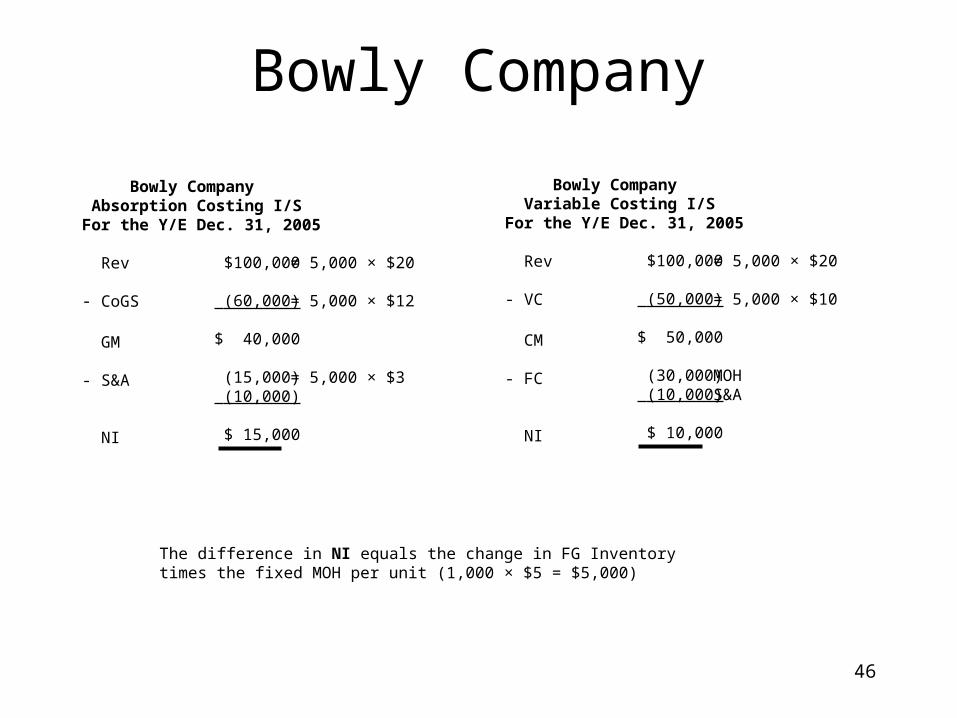
Bowly Company
Bowly Company Absorption Costing I/SFor the Y/E Dec. 31, 2005
Rev
- CoGS
GM
- S&A
NI
$100,000
(60,000)
$ 40,000
(15,000) (10,000)
$ 15,000
= 5,000 × $20
= 5,000 × $12
= 5,000 × $3
Bowly Company Variable Costing I/SFor the Y/E Dec. 31, 2005
Rev
- VC
CM
- FC
NI
$100,000
(50,000)
$ 50,000
(30,000) (10,000)
$ 10,000
= 5,000 × $20
= 5,000 × $10
MOHS&A
The difference in NI equals the change in FG Inventorytimes the fixed MOH per unit (1,000 × $5 = $5,000)
47
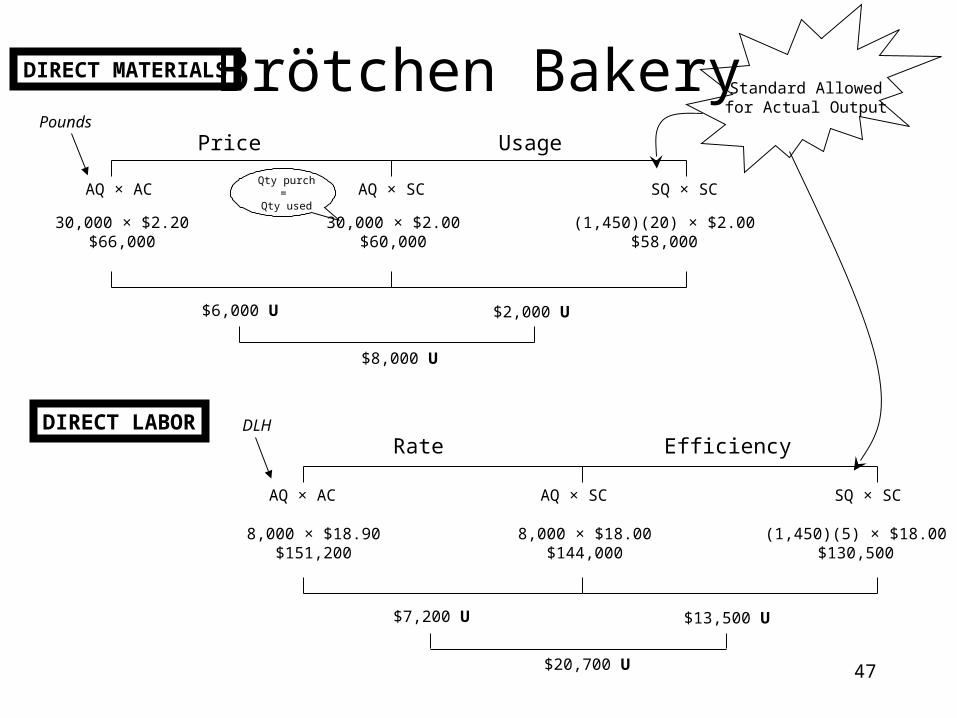
Brötchen Bakery Standard Allowedfor Actual Output
Price Usage
AQ × AC AQ × SC SQ × SC
Pounds
30,000 × $2.20$66,000
(1,450)(20) × $2.00$58,000
30,000 × $2.00$60,000
$6,000 U $2,000 U
$8,000 U
DIRECT MATERIALS
Rate Efficiency
AQ × AC AQ × SC SQ × SC
DLH
8,000 × $18.90$151,200
(1,450)(5) × $18.00$130,500
8,000 × $18.00$144,000
$7,200 U $13,500 U
$20,700 U
DIRECT LABOR
Qty purch=
Qty used
48
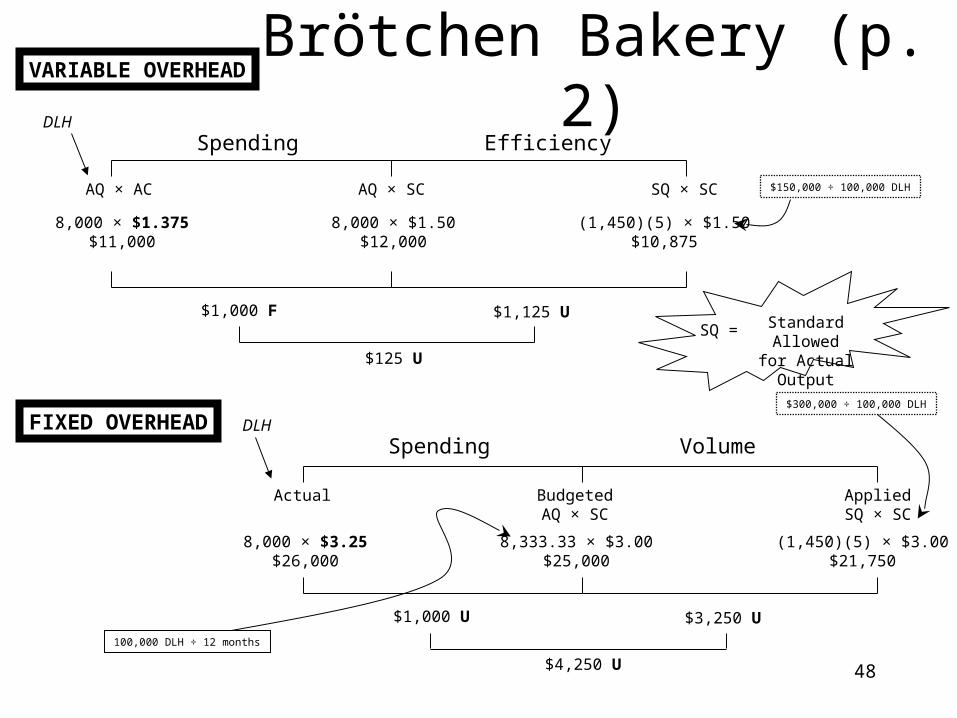
Brötchen Bakery (p. 2)Spending Efficiency
AQ × AC AQ × SC SQ × SC
DLH
8,000 × $1.375$11,000
(1,450)(5) × $1.50$10,875
8,000 × $1.50$12,000
$1,000 F $1,125 U
$125 U
VARIABLE OVERHEAD
Spending Volume
Actual BudgetedAQ × SC
AppliedSQ × SC
DLH
8,000 × $3.25$26,000
(1,450)(5) × $3.00$21,750
8,333.33 × $3.00$25,000
$1,000 U $3,250 U
$4,250 U
FIXED OVERHEAD
$150,000 ÷ 100,000 DLH
$300,000 ÷ 100,000 DLH
Standard Allowedfor Actual Output
SQ =
100,000 DLH ÷ 12 months
49
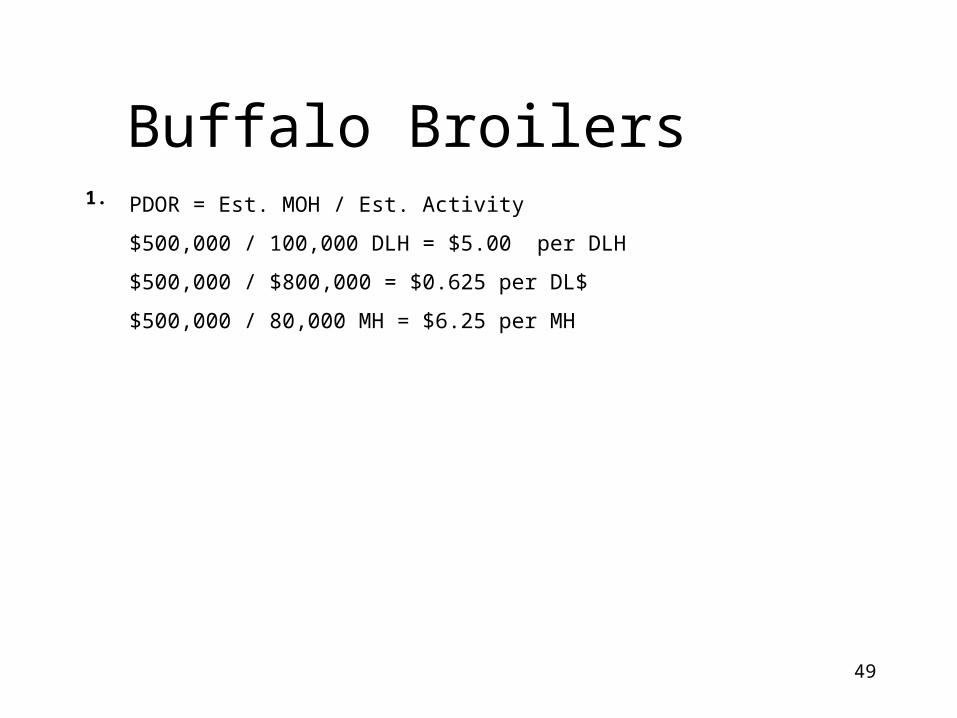
Buffalo BroilersPDOR = Est. MOH / Est. Activity
$500,000 / 100,000 DLH = $5.00 per DLH
$500,000 / $800,000 = $0.625 per DL$
$500,000 / 80,000 MH = $6.25 per MH
1.
50
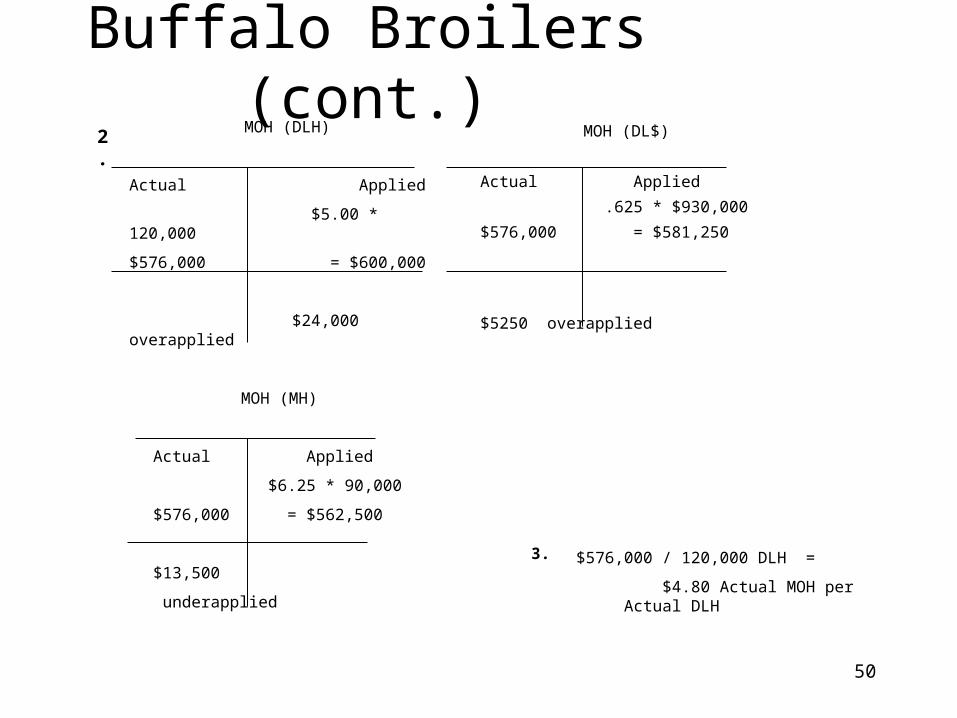
Buffalo Broilers (cont.)MOH (DLH)
Actual Applied
$5.00 * 120,000
$576,000 = $600,000
$24,000 overapplied
MOH (DL$)
Actual Applied
.625 * $930,000
$576,000 = $581,250
$5250 overapplied
MOH (MH)
Actual Applied
$6.25 * 90,000
$576,000 = $562,500
$13,500
underapplied
2.
$576,000 / 120,000 DLH =
$4.80 Actual MOH per Actual DLH
3.
51
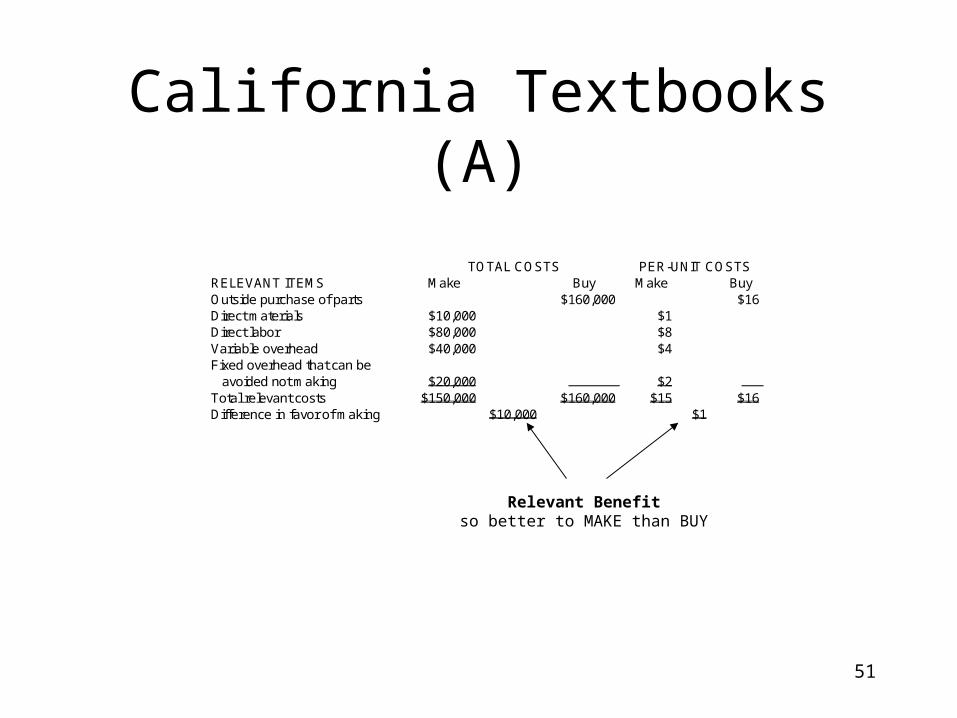
California Textbooks (A)
RELEVANT ITEMS Make Buy Make BuyOutside purchase of parts $160,000 $16Direct materials $10,000 $1Direct labor $80,000 $8Variable overhead $40,000 $4Fixed overhead that can be avoided not making $20,000 $2 Total relevant costs $150,000 $160,000 $15 $16Difference in favor of making $10,000 $1
TOTAL COSTS PER-UNIT COSTS
Relevant Benefitso better to MAKE than BUY
52
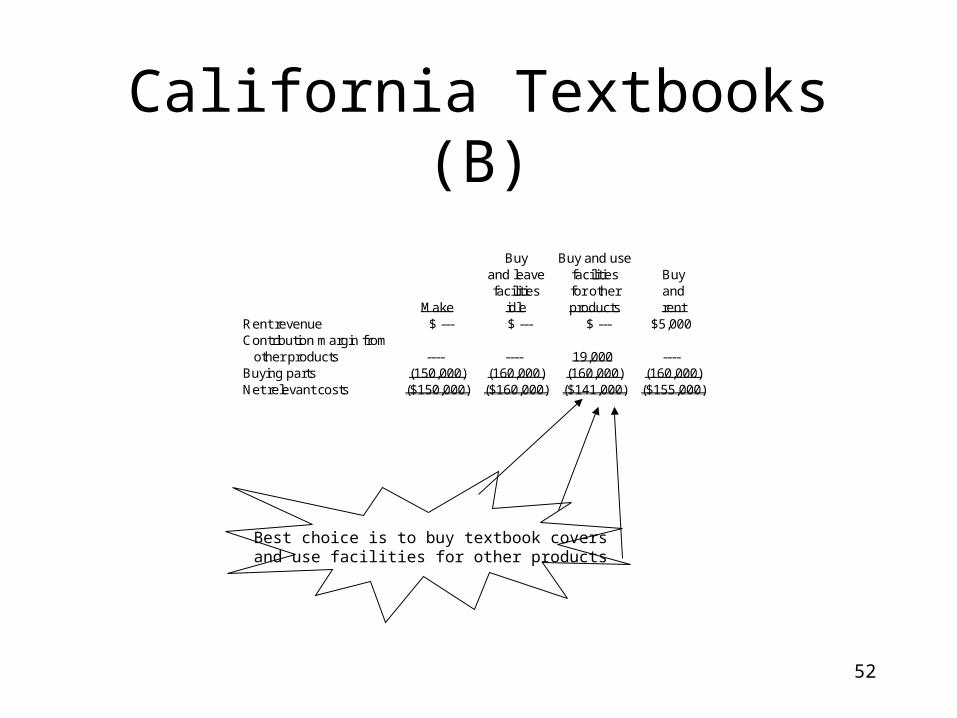
California Textbooks (B)
Best choice is to buy textbook coversand use facilities for other products
Buy Buy and useand leave facilities Buyfacilities for other and
Make idle products rentRent revenue $ --- $ --- $ --- $5,000Contribution margin from other products ---- ---- 19,000 ----Buying parts (150,000) (160,000) (160,000) (160,000)Net relevant costs ($150,000) ($160,000) ($141,000) ($155,000)
53
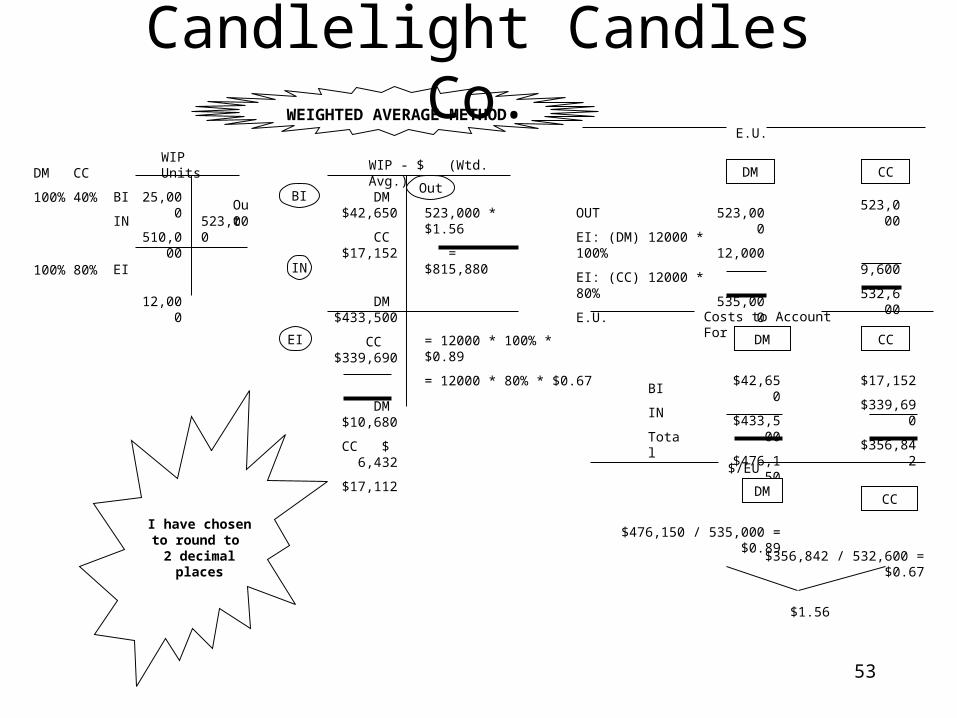
Candlelight Candles Co.
I have chosen to round to
2 decimal places
WIP Units
25,000
510,000
12,000
523,000Out
BI
IN
EI
DM
100%
100%
CC
40%
80%
WIP - $ (Wtd. Avg.)
DM $42,650
CC $17,152
DM $433,500
CC $339,690
DM $10,680
CC $ 6,432
$17,112
523,000 * $1.56
= $815,880
= 12000 * 100% * $0.89
= 12000 * 80% * $0.67
OutBI
IN
EI
E.U.
DM CC
523,000
12,000
535,000
523,000
9,600
532,600
OUT
EI: (DM) 12000 * 100%
EI: (CC) 12000 * 80%
E.U.
Costs to Account For
DM CC
$42,650
$433,500
$476,150
$17,152
$339,690
$356,842
BI
IN
Total
$/EU
DMCC
$476,150 / 535,000 = $0.89
$356,842 / 532,600 = $0.67
$1.56
WEIGHTED AVERAGE METHOD
54
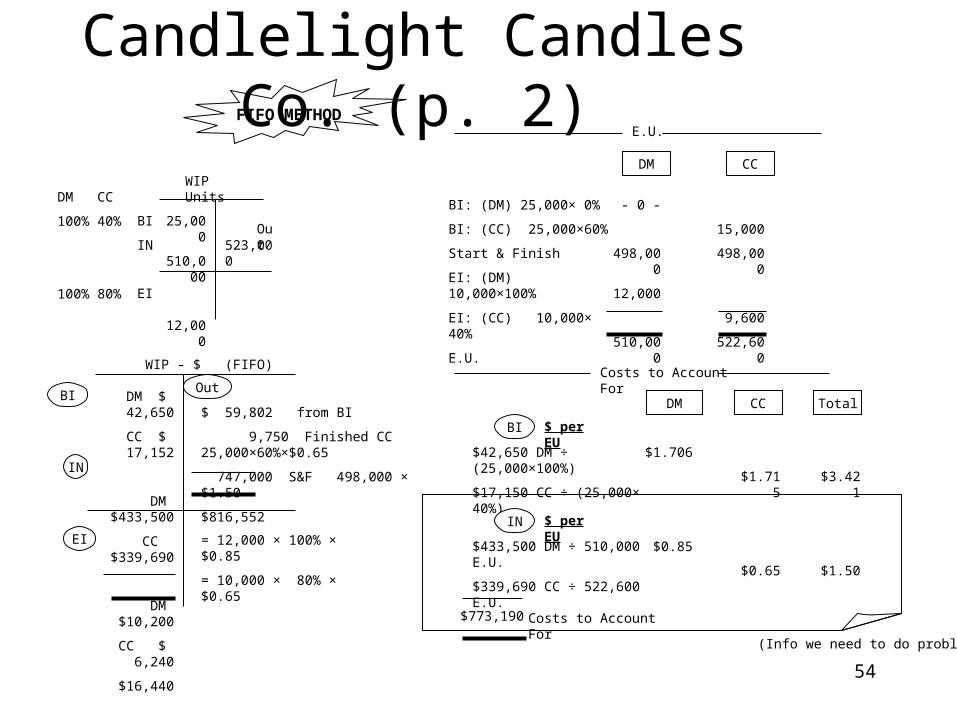
Candlelight Candles Co. (p. 2)
WIP - $ (FIFO)
DM $ 42,650
CC $ 17,152
DM $433,500
CC $339,690
DM $10,200
CC $ 6,240
$16,440
$ 59,802 from BI
9,750 Finished CC 25,000×60%×$0.65
747,000 S&F 498,000 × $1.50
$816,552
= 12,000 × 100% × $0.85
= 10,000 × 80% × $0.65
OutBI
IN
EI
E.U.
DM CC
- 0 -
498,000
12,000
510,000
15,000
498,000
9,600
522,600
Costs to Account For
DM CC
$1.706
$1.715
$ per EU
BI: (DM) 25,000× 0%
BI: (CC) 25,000×60%
Start & Finish
EI: (DM) 10,000×100%
EI: (CC) 10,000× 40%
E.U.
FIFO METHOD
BI
$42,650 DM ÷ (25,000×100%)
$17,150 CC ÷ (25,000× 40%)
Total
$3.421
$0.85
$0.65
$ per EUIN
$433,500 DM ÷ 510,000 E.U.
$339,690 CC ÷ 522,600 E.U. $1.50
(Info we need to do problem)
$773,190 Costs to Account For
WIP Units
25,000
510,000
12,000
523,000Out
BI
IN
EI
DM
100%
100%
CC
40%
80%
55
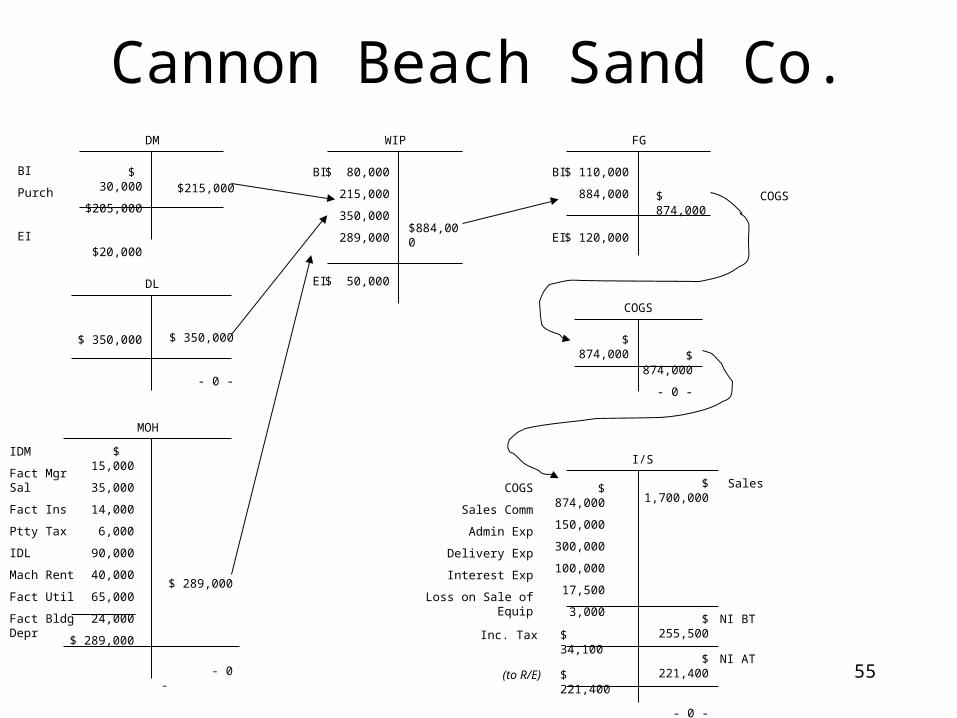
$ 30,000
$205,000
$20,000
$215,000
DM
BI
Purch
EI
$ 80,000
215,000
350,000
289,000
$ 50,000
$884,000
BI
EI
WIP
$ 110,000
884,000
$ 120,000
$ 874,000
BI
EI
FG
$ 350,000 $ 350,000
- 0 -
DL
MOH
$ 15,000
35,000
14,000
6,000
90,000
40,000
65,000
24,000
$ 289,000
$ 289,000
- 0 -
IDM
Fact Mgr Sal
Fact Ins
Ptty Tax
IDL
Mach Rent
Fact Util
Fact Bldg Depr
COGS
I/S
$ 874,000
150,000
300,000
100,000
17,500
3,000
$ 1,700,000COGS
Sales Comm
Admin Exp
Delivery Exp
Interest Exp
Loss on Sale of Equip
Sales
NI BT
$ 874,000
- 0 -
$ 874,000
COGS
Cannon Beach Sand Co.
$ 255,500$ 34,100Inc. Tax
NI AT$ 221,400$ 221,400
- 0 -
(to R/E)
56
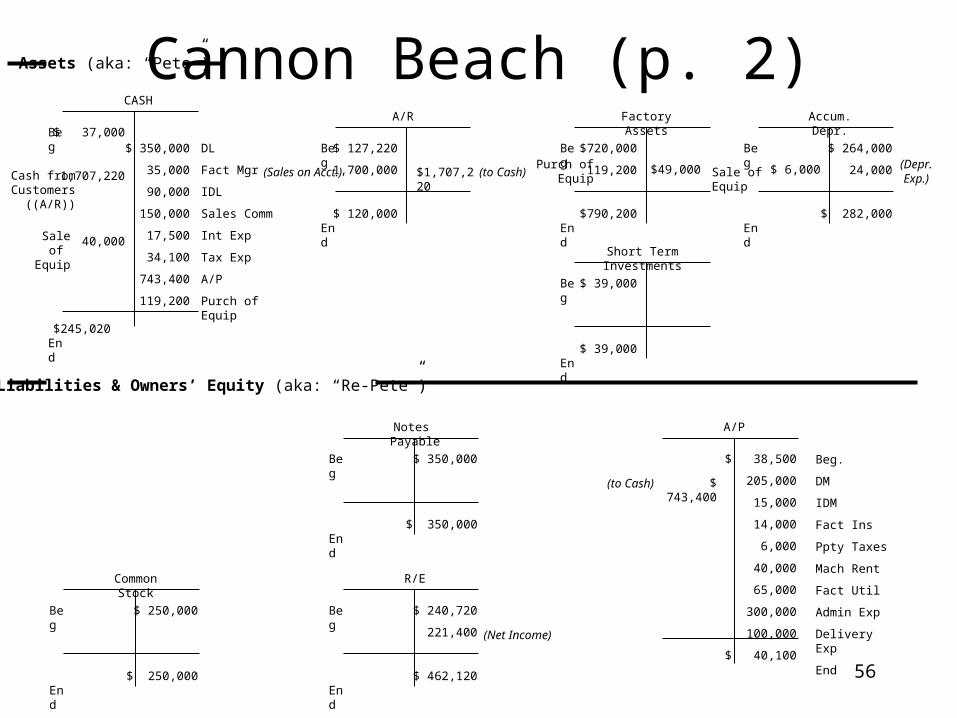
Cannon Beach (p. 2)$ 37,000
1,707,220
40,000
$245,020
$ 350,000
35,000
90,000
150,000
17,500
34,100
743,400
119,200
Beg
End
CASH
Assets (aka: “Pete”)
$ 127,220
1,700,000
$ 120,000
$1,707,220
Beg
End
A/R
$720,000
119,200
$790,200
Beg
End
Factory Assets
$ 264,000
24,000
$ 282,000
Beg
End
Accum. Depr.
Cash fromCustomers
((A/R))
DL
Fact Mgr
IDL
Sales Comm
Int Exp
Tax Exp
A/P
Purch of Equip
Liabilities & Owners’ Equity (aka: “Re-Pete”)
$ 350,000
$ 350,000
Beg
End
Notes Payable
$ 38,500
205,000
15,000
14,000
6,000
40,000
65,000
300,000
100,000
$ 40,100
A/P
$ 250,000
$ 250,000
Beg
End
Common Stock
$ 240,720
221,400
$ 462,120
Beg
End
R/E
$ 743,400
(to Cash)(Sales on Acct.)(Depr.Exp.)
(Net Income)
$ 39,000
$ 39,000
Beg
End
Short Term Investments
Beg.
DM
IDM
Fact Ins
Ppty Taxes
Mach Rent
Fact Util
Admin Exp
Delivery Exp
End
(to Cash)
$ 6,000Sale of EquipPurch of
Equip$49,000
Sale of Equip
57
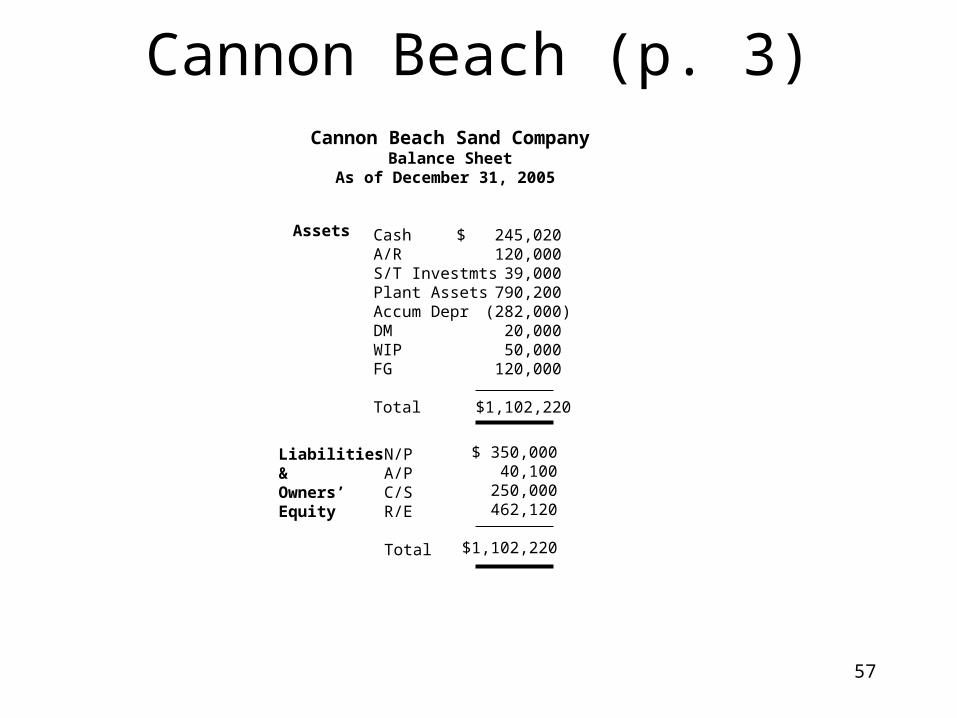
Cannon Beach (p. 3)Cannon Beach Sand Company
Balance SheetAs of December 31, 2005
Assets CashA/RS/T InvestmtsPlant AssetsAccum DeprDMWIPFG
Total
$ 245,020 120,000 39,000
790,200 (282,000)
20,000 50,000
120,000
$1,102,220
Liabilities& Owners’Equity
N/PA/PC/SR/E
Total
$ 350,000 40,100
250,000 462,120
$1,102,220
58
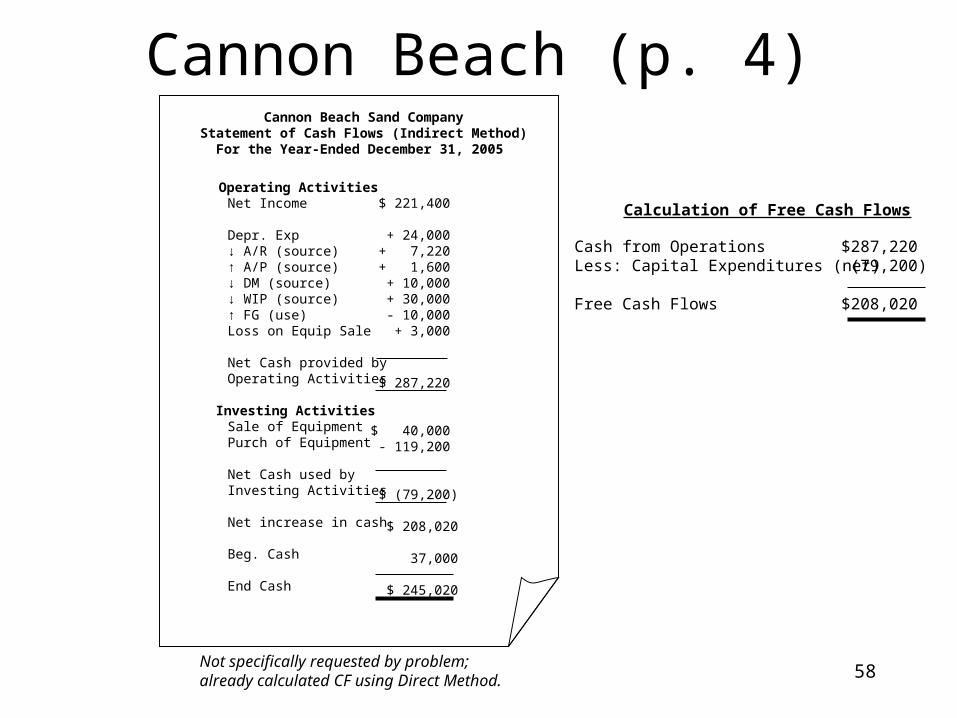
Cannon Beach (p. 4)Cannon Beach Sand Company
Statement of Cash Flows (Indirect Method)For the Year-Ended December 31, 2005
Net Income
Depr. Exp↓ A/R (source)↑ A/P (source)↓ DM (source)↓ WIP (source)↑ FG (use)Loss on Equip Sale
Net Cash provided byOperating Activities
Sale of EquipmentPurch of Equipment
Net Cash used byInvesting Activities
Net increase in cash
Beg. Cash
End Cash
$ 221,400
+ 24,000 + 7,220 + 1,600 + 10,000 + 30,000 - 10,000 + 3,000
$ 287,220
$ 40,000 - 119,200
$ (79,200)
$ 208,020
37,000
$ 245,020
Not specifically requested by problem;already calculated CF using Direct Method.
Calculation of Free Cash Flows
Cash from OperationsLess: Capital Expenditures (net)
Free Cash Flows
$287,220 (79,200)
$208,020
Operating Activities
Investing Activities
59
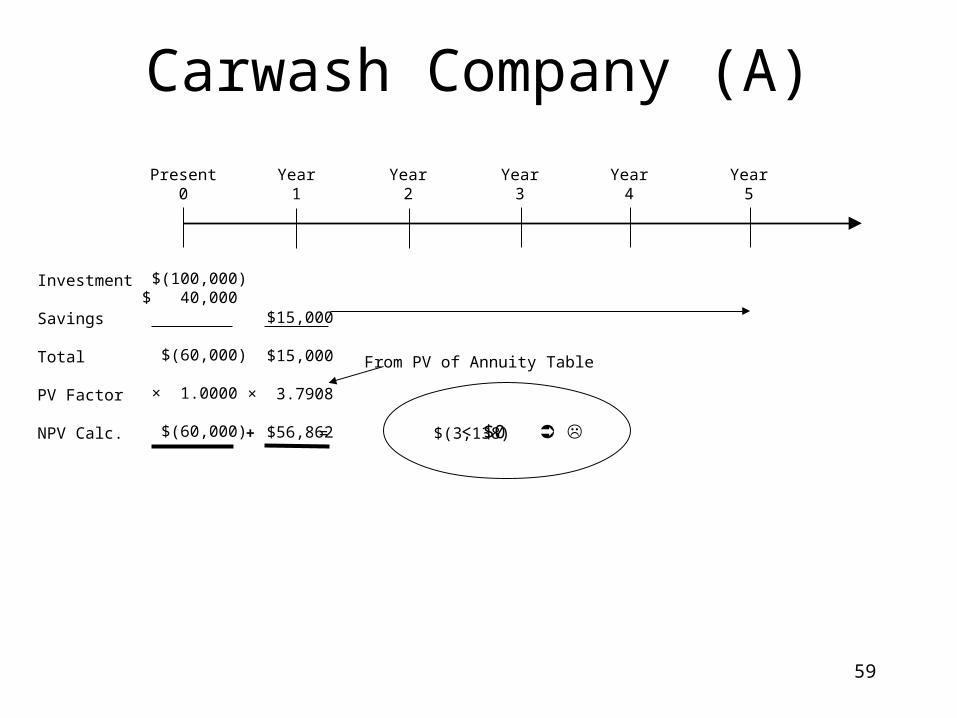
Carwash Company (A)
Present0
Year1
Year2
Year3
Investment
Savings
Total
PV Factor
NPV Calc.
$(100,000)$ 40,000
$(60,000)
× 1.0000
$(60,000)
$15,000
$15,000
× 3.7908
$56,862
Year4
Year5
= $(3,138) < $0 +
From PV of Annuity Table
60
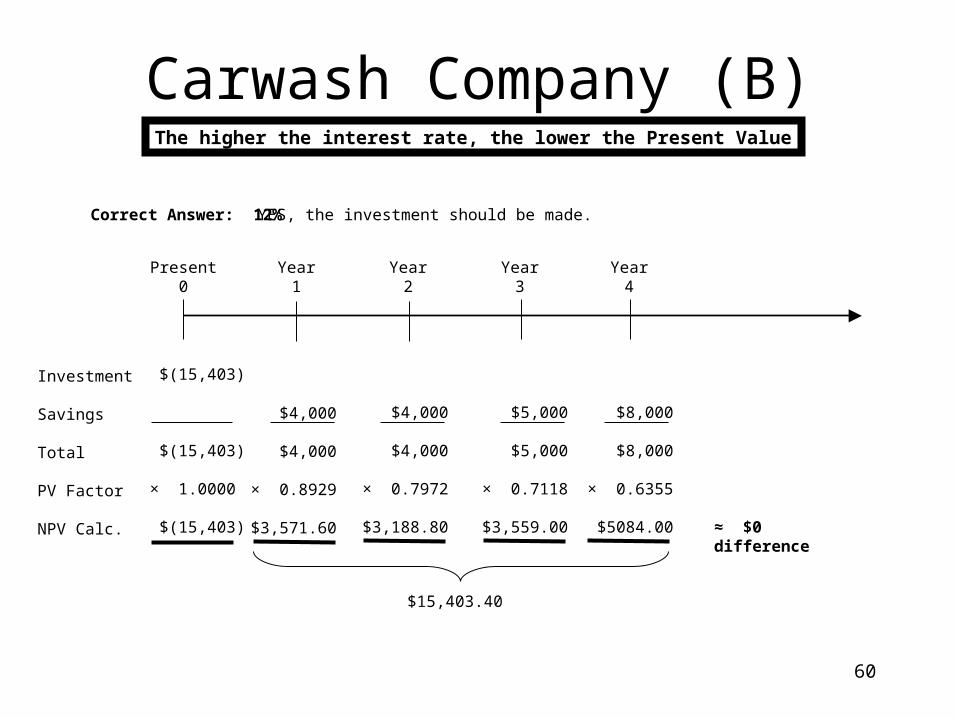
Carwash Company (B)The higher the interest rate, the lower the Present Value
Correct Answer: 12% YES, the investment should be made.
Present0
Year1
Year2
Year3
Investment
Savings
Total
PV Factor
NPV Calc.
$(15,403)
$(15,403)
× 1.0000
$(15,403)
$4,000
$4,000
× 0.8929
$3,571.60
Year4
$4,000
$4,000
× 0.7972
$3,188.80
$5,000
$5,000
× 0.7118
$3,559.00
$8,000
$8,000
× 0.6355
$5084.00 ≈ $0 difference
$15,403.40
61
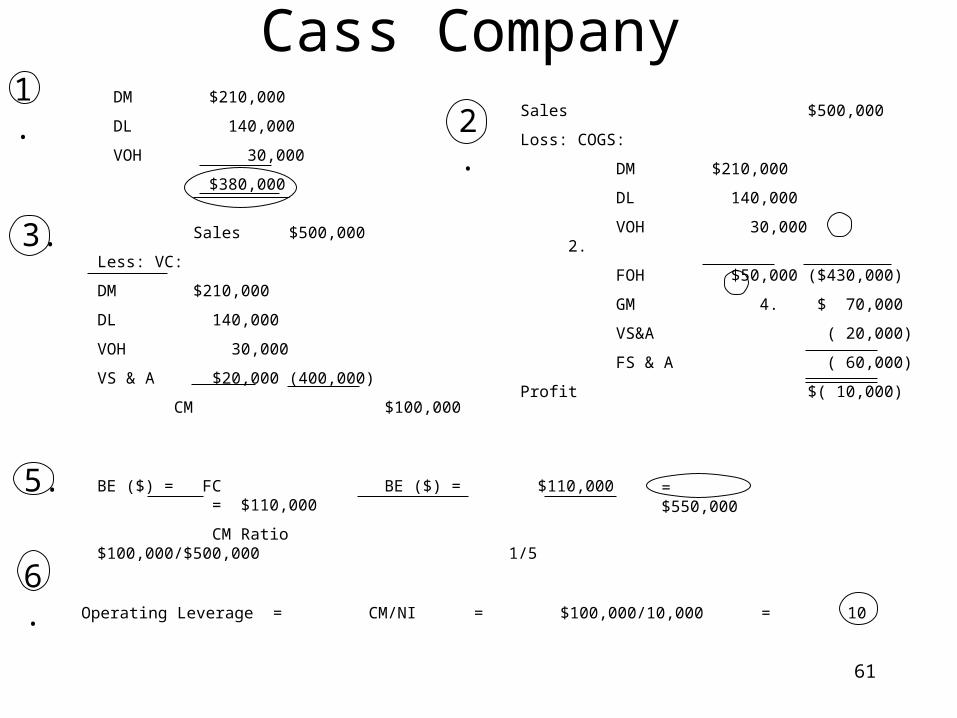
1. DM $210,000
DL 140,000
VOH 30,000
$380,000
2. Sales $500,000
Loss: COGS:
DM $210,000
DL 140,000
VOH 30,000 2.
FOH $50,000 ($430,000)
GM 4. $ 70,000
VS&A ( 20,000)
FS & A ( 60,000)
Profit $( 10,000)
3. Sales $500,000
Less: VC:
DM $210,000
DL 140,000
VOH 30,000
VS & A $20,000 (400,000)
CM $100,000
5. BE ($) = FC BE ($) = $110,000 = $110,000
CM Ratio $100,000/$500,000 1/5
6.Operating Leverage = CM/NI = $100,000/10,000 = 10
= $550,000
Cass Company
62
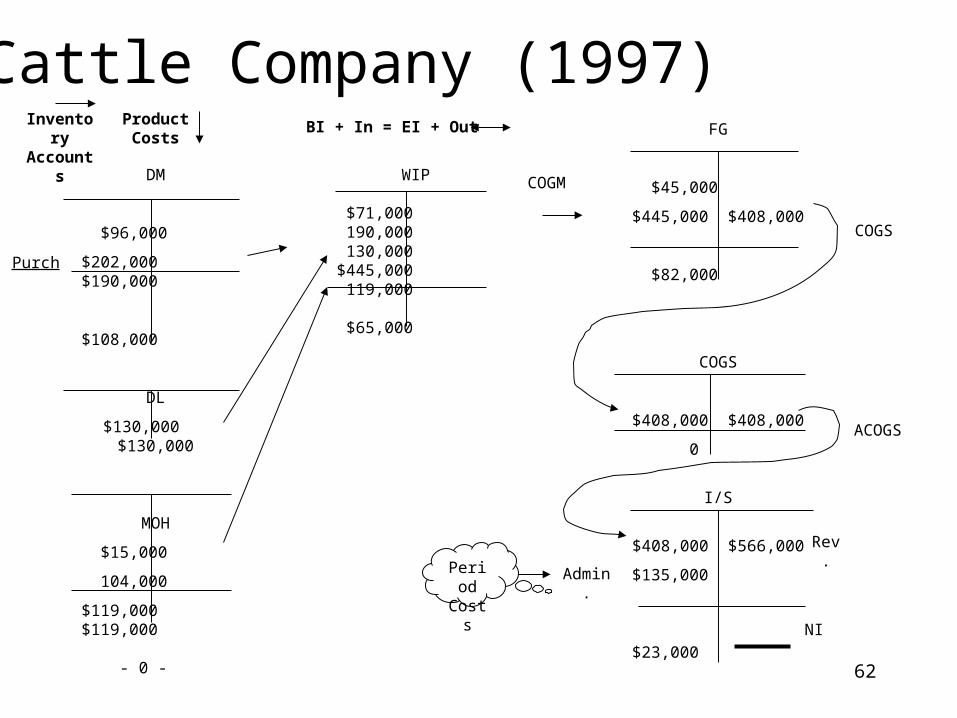
Cattle Company (1997)
DM
$96,000
$202,000 $190,000
$108,000
DL
$130,000 $130,000
MOH
$15,000
104,000
$119,000 $119,000
- 0 -
Purch
Inventory Accounts
Product Costs
WIP
$71,000 190,000 130,000 $445,000 119,000
$65,000
FG
$45,000
$445,000 $408,000
$82,000
COGS
$408,000 $408,000
0
I/S
$408,000 $566,000
$135,000
$23,000
COGS
ACOGS
COGM
NI
Rev.
Admin.
BI + In = EI + Out
PeriodCosts
63
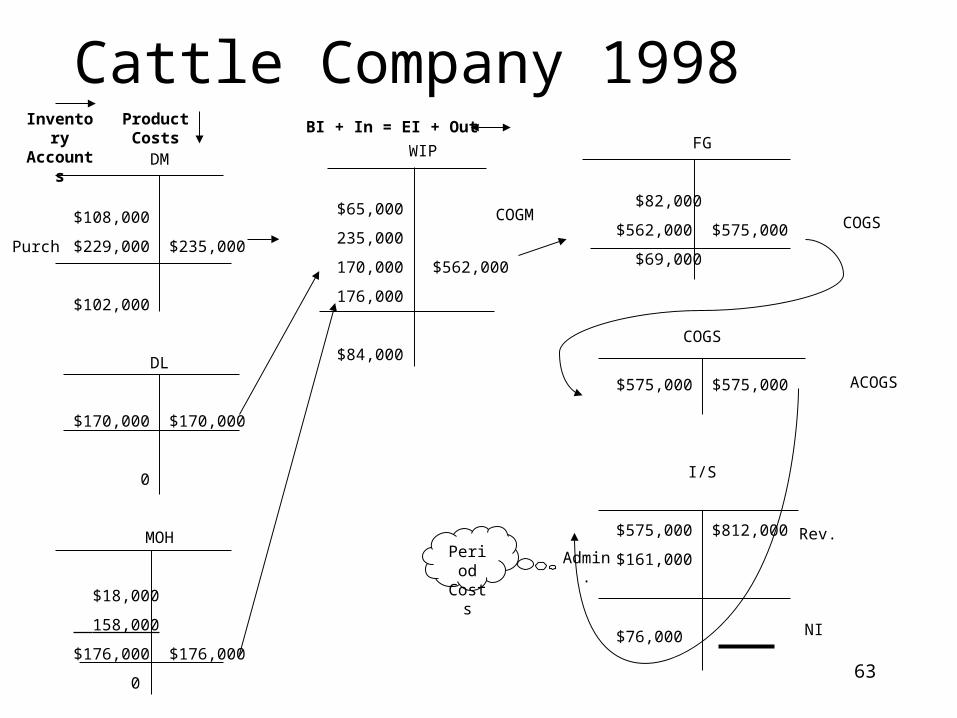
Cattle Company 1998WIP
$65,000
235,000
170,000 $562,000
176,000
$84,000
FG
$82,000
$562,000 $575,000
$69,000
COGS
$575,000 $575,000
I/S
$575,000 $812,000
$161,000
$76,000NI
Rev.
ACOGS
COGSCOGM
DM
$108,000
$229,000 $235,000
$102,000
DL
$170,000 $170,000
0
MOH
$18,000
158,000
$176,000 $176,000
0
Purch
Inventory Accounts
Product Costs
BI + In = EI + Out
Admin.PeriodCosts
64
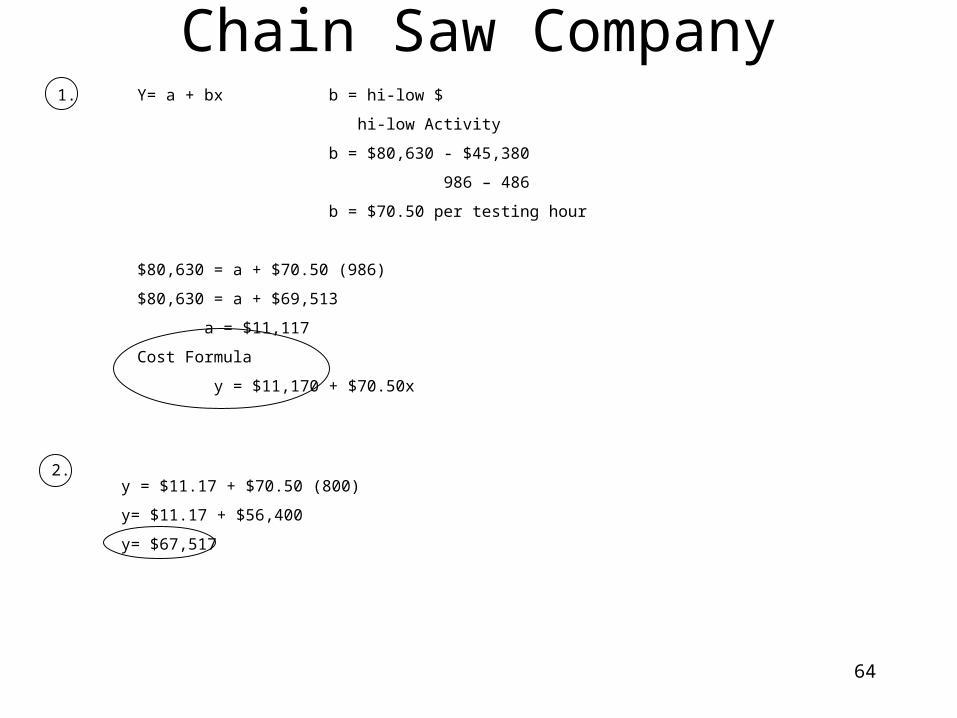
1. Y= a + bx b = hi-low $
hi-low Activity
b = $80,630 - $45,380
986 – 486
b = $70.50 per testing hour
$80,630 = a + $70.50 (986)
$80,630 = a + $69,513
a = $11,117
Cost Formula
y = $11,170 + $70.50x
2.y = $11.17 + $70.50 (800)
y= $11.17 + $56,400
y= $67,517
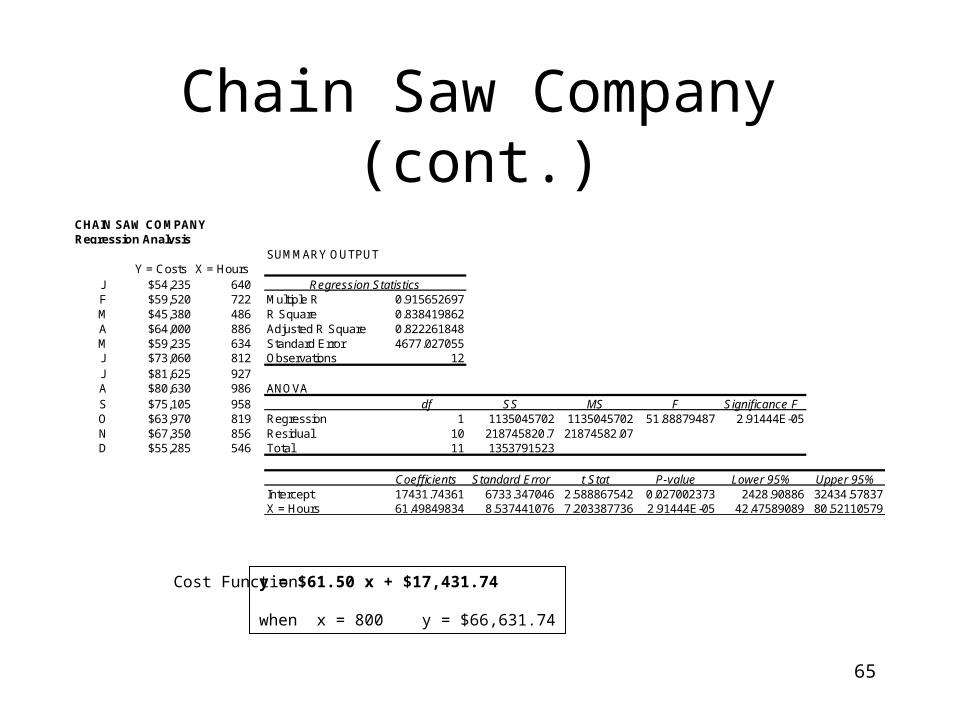
Chain Saw Company
65
Chain Saw Company (cont.)CHAIN SAW COMPANYRegression Analysis
SUMMARY OUTPUTY = Costs X = Hours
J $54,235 640 Regression StatisticsF $59,520 722 Multiple R 0.915652697M $45,380 486 R Square 0.838419862A $64,000 886 Adjusted R Square 0.822261848M $59,235 634 Standard Error 4677.027055J $73,060 812 Observations 12J $81,625 927A $80,630 986 ANOVAS $75,105 958 df SS MS F Significance FO $63,970 819 Regression 1 1135045702 1135045702 51.88879487 2.91444E-05N $67,350 856 Residual 10 218745820.7 21874582.07D $55,285 546 Total 11 1353791523
Coefficients Standard Error t Stat P-value Lower 95% Upper 95%Intercept 17431.74361 6733.347046 2.588867542 0.027002373 2428.90886 32434.57837X = Hours 61.49849834 8.537441076 7.203387736 2.91444E-05 42.47589089 80.52110579
y = $61.50 x + $17,431.74
when x = 800 y = $66,631.74
Cost Function:
66
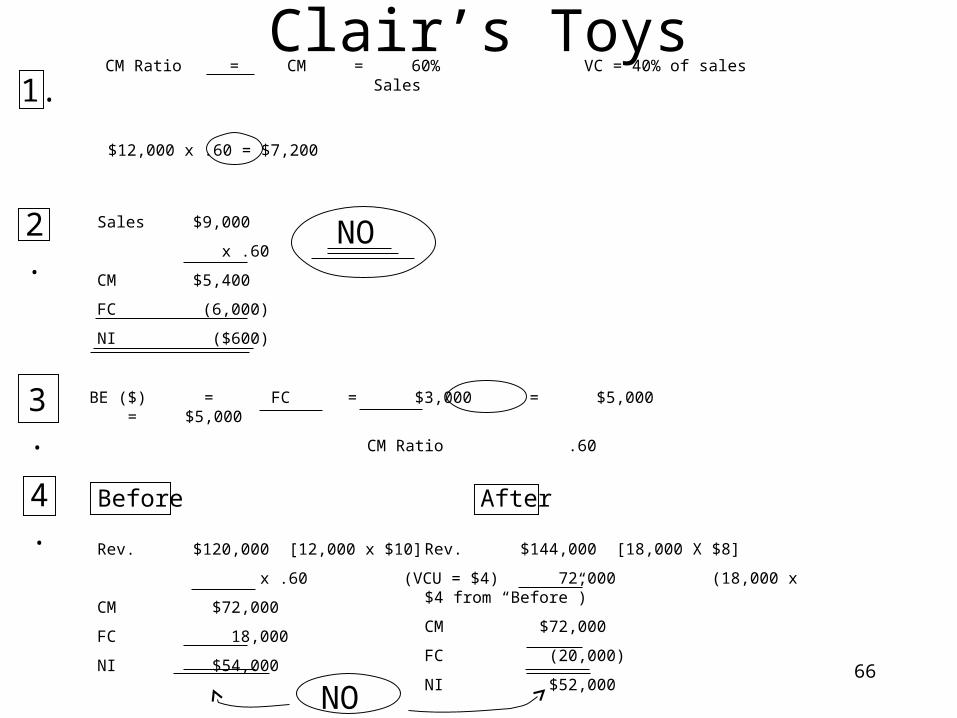
1.CM Ratio = CM = 60% VC = 40% of sales Sales
$12,000 x .60 = $7,200
2. Sales $9,000
x .60
CM $5,400
FC (6,000)
NI ($600)
NO
3. BE ($) = FC = $3,000 = $5,000 = $5,000
CM Ratio .60
4. Before After
Rev. $120,000 [12,000 x $10]
x .60 (VCU = $4)
CM $72,000
FC 18,000
NI $54,000
Rev. $144,000 [18,000 X $8]
72,000 (18,000 x $4 from “Before”)
CM $72,000
FC (20,000)
NI $52,000
NO
Clair’s Toys
67
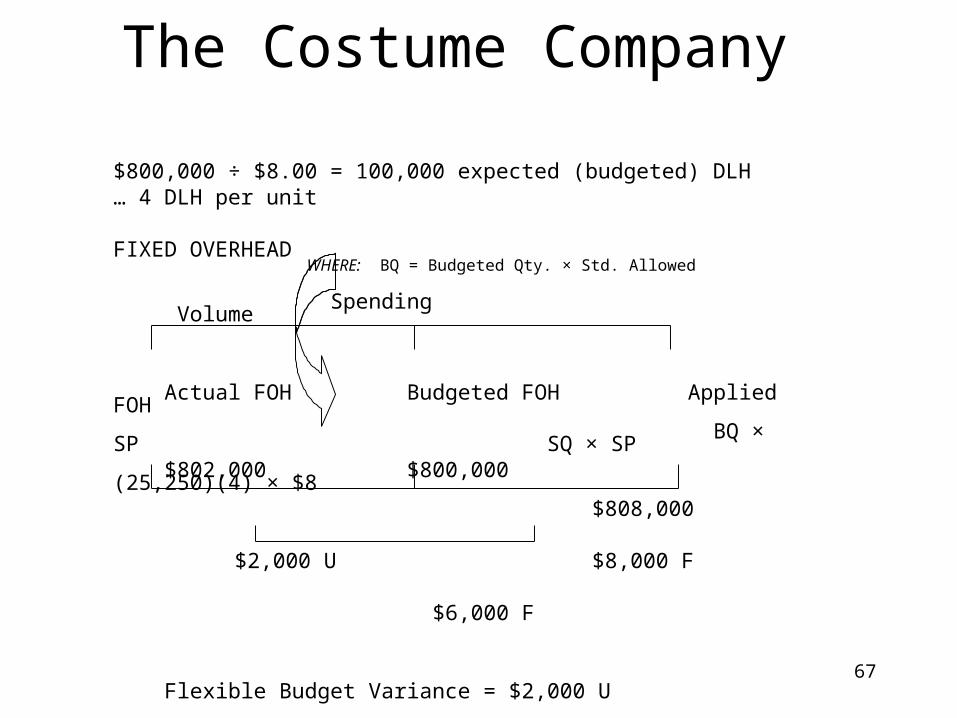
The Costume Company
$800,000 ÷ $8.00 = 100,000 expected (budgeted) DLH… 4 DLH per unit
FIXED OVERHEAD Spending Volume Actual FOH Budgeted FOH Applied FOH BQ × SP SQ × SP $802,000 $800,000 (25,250)(4) × $8
$808,000
$2,000 U $8,000 F
$6,000 F
Flexible Budget Variance = $2,000 U
WHERE: BQ = Budgeted Qty. × Std. Allowed
68
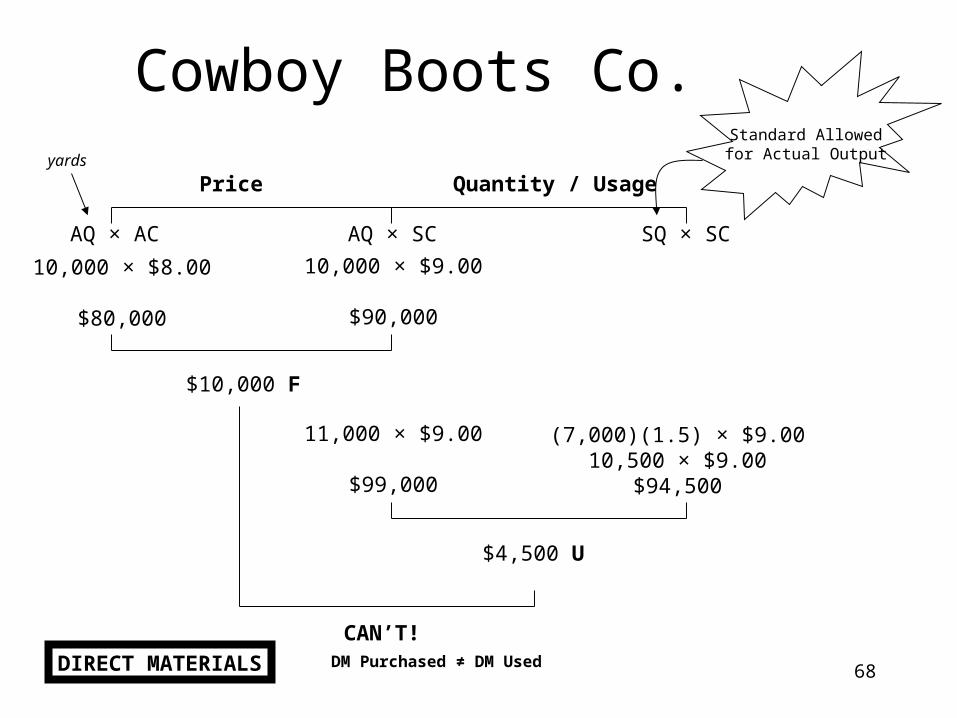
Cowboy Boots Co.Standard Allowedfor Actual Output
Price Quantity / Usage
AQ × AC AQ × SC SQ × SC
yards
10,000 × $8.00
$80,000
(7,000)(1.5) × $9.0010,500 × $9.00
$94,500
10,000 × $9.00
$90,000
$10,000 F
$4,500 U
CAN’T!
DIRECT MATERIALS
11,000 × $9.00
$99,000
DM Purchased ≠ DM Used
69
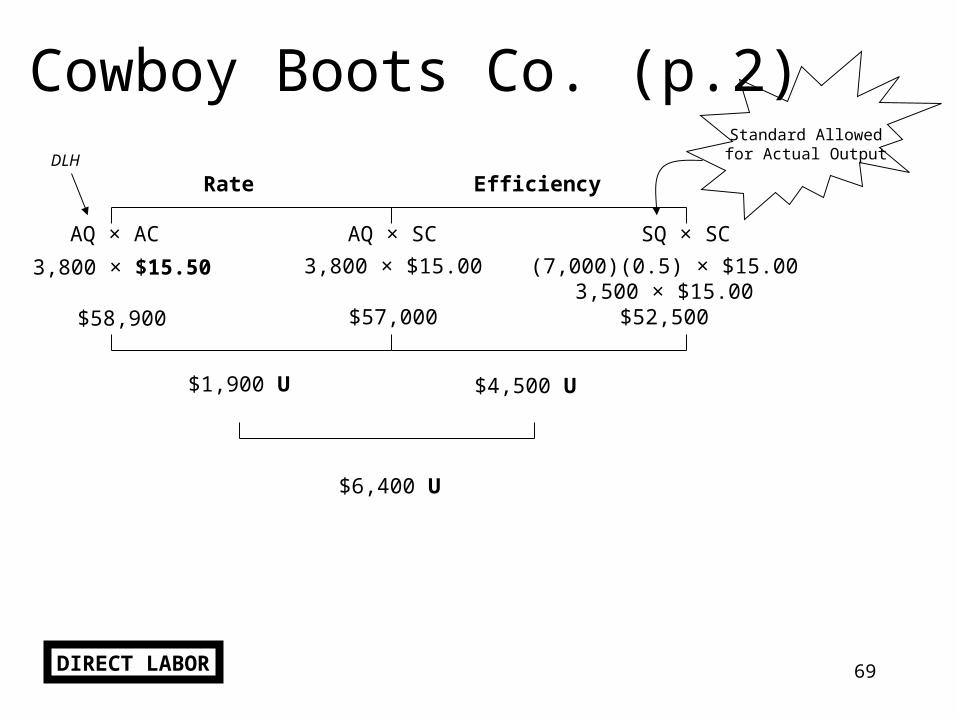
Cowboy Boots Co. (p.2)Standard Allowedfor Actual Output
Rate Efficiency
AQ × AC AQ × SC SQ × SC
DLH
3,800 × $15.50
$58,900
(7,000)(0.5) × $15.003,500 × $15.00
$52,500
3,800 × $15.00
$57,000
$1,900 U $4,500 U
$6,400 U
DIRECT LABOR
70
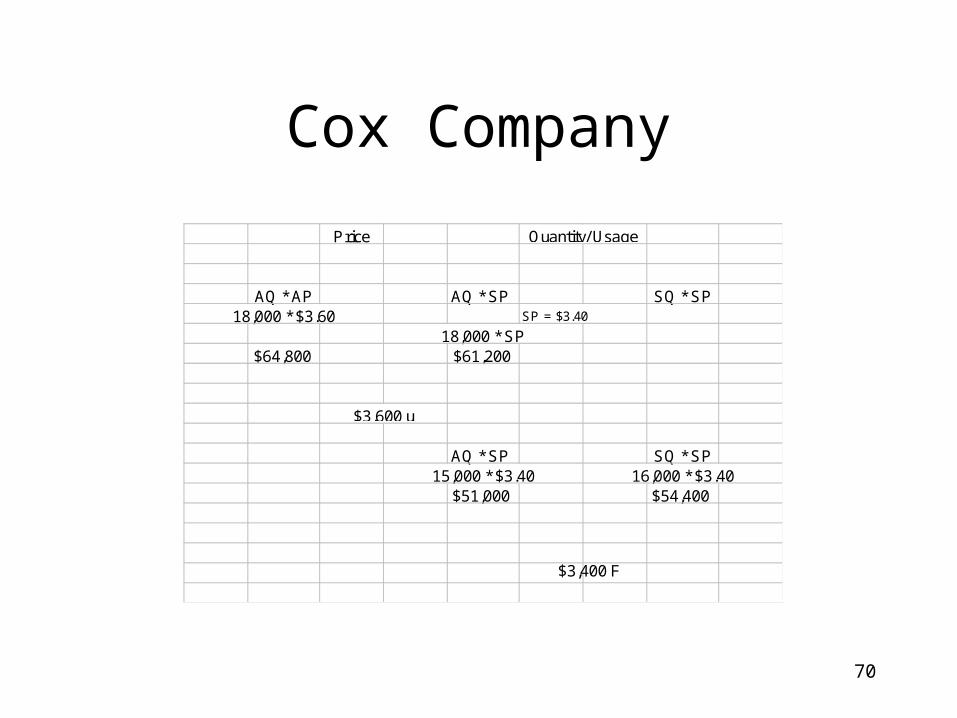
Cox Company
Price
AQ * AP AQ * SP SQ * SP18,000 * $3.60 SP = $3.40
18,000 * SP$64,800 $61,200
AQ * SP SQ * SP15,000 * $3.40 16,000 * $3.40
$51,000 $54,400
$3,600 u
Quantity/ Usage
$3,400 F
71
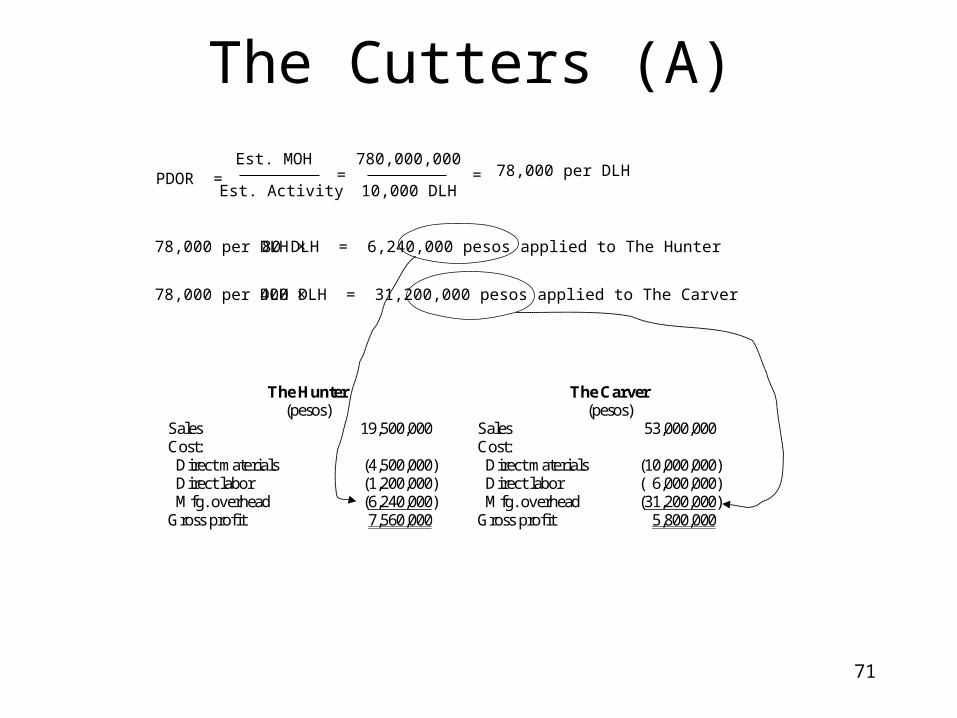
The Cutters (A)
PDOR =Est. MOH
Est. Activity=
780,000,000
10,000 DLH= 78,000 per DLH
78,000 per DLH × 80 DLH = 6,240,000 pesos applied to The Hunter
78,000 per DLH × 400 DLH = 31,200,000 pesos applied to The Carver
The Hunter (pesos)
The Carver (pesos)
Sales 19,500,000 Sales 53,000,000 Cost: Cost: Direct materials (4,500,000) Direct materials (10,000,000) Direct labor (1,200,000) Direct labor ( 6,000,000) Mfg. overhead (6,240,000) Mfg. overhead (31,200,000) Gross profit 7,560,000 Gross profit 5,800,000
72
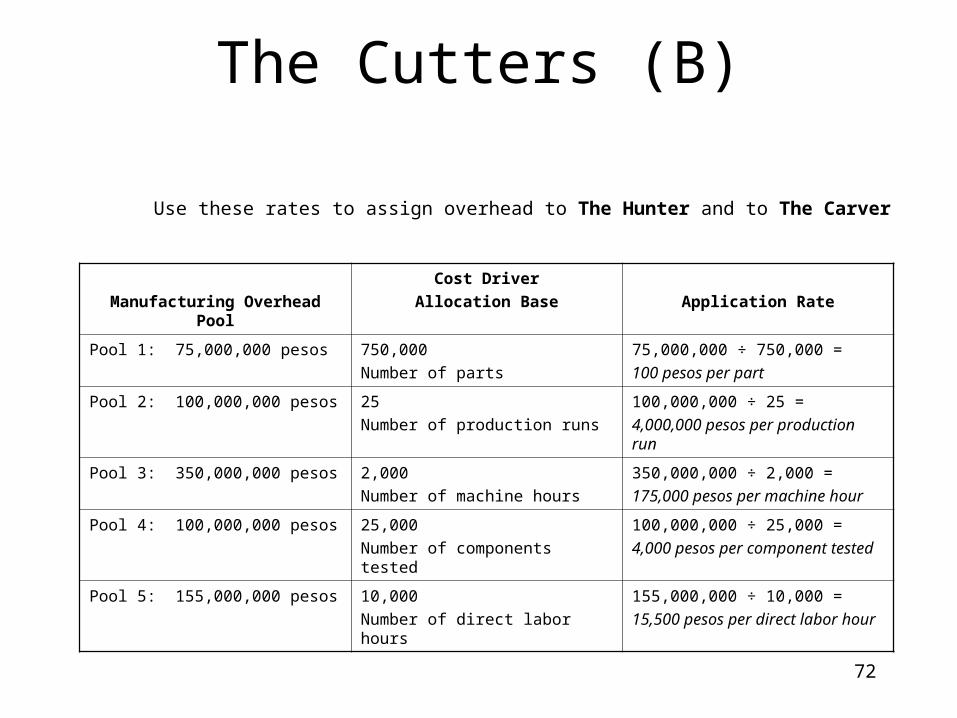
The Cutters (B)
Manufacturing Overhead Pool
Cost Driver
Allocation Base Application Rate
Pool 1: 75,000,000 pesos 750,000
Number of parts
75,000,000 ÷ 750,000 =
100 pesos per part
Pool 2: 100,000,000 pesos 25
Number of production runs
100,000,000 ÷ 25 =
4,000,000 pesos per production run
Pool 3: 350,000,000 pesos 2,000
Number of machine hours
350,000,000 ÷ 2,000 =
175,000 pesos per machine hour
Pool 4: 100,000,000 pesos 25,000
Number of components tested
100,000,000 ÷ 25,000 =
4,000 pesos per component tested
Pool 5: 155,000,000 pesos 10,000
Number of direct labor hours
155,000,000 ÷ 10,000 =
15,500 pesos per direct labor hour
Use these rates to assign overhead to The Hunter and to The Carver
73
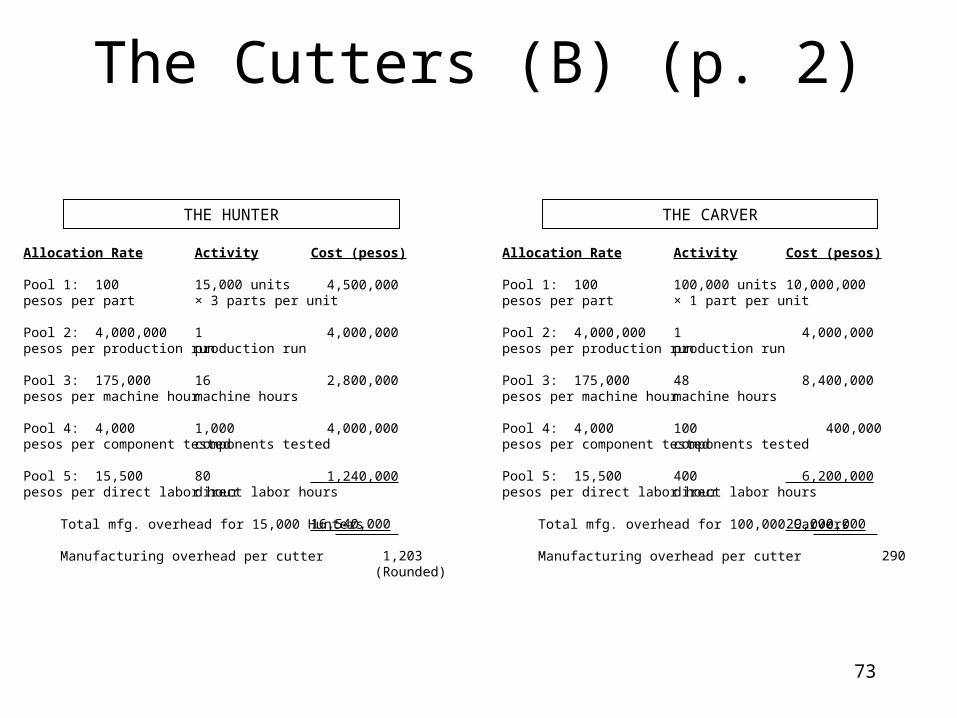
Allocation Rate
Pool 1: 100 pesos per part
Pool 2: 4,000,000 pesos per production run
Pool 3: 175,000pesos per machine hour
Pool 4: 4,000pesos per component tested
Pool 5: 15,500pesos per direct labor hour
Activity
15,000 units × 3 parts per unit
1production run
16machine hours
1,000components tested
80direct labor hours
Cost (pesos)
4,500,000
4,000,000
2,800,000
4,000,000
1,240,000
16,540,000
1,203 (Rounded)
Total mfg. overhead for 15,000 Hunters
Manufacturing overhead per cutter
Allocation Rate
Pool 1: 100 pesos per part
Pool 2: 4,000,000 pesos per production run
Pool 3: 175,000pesos per machine hour
Pool 4: 4,000pesos per component tested
Pool 5: 15,500pesos per direct labor hour
Activity
100,000 units × 1 part per unit
1production run
48machine hours
100components tested
400direct labor hours
Cost (pesos)
10,000,000
4,000,000
8,400,000
400,000
6,200,000
29,000,000
290
Total mfg. overhead for 100,000 Carvers
Manufacturing overhead per cutter
THE HUNTER THE CARVER
The Cutters (B) (p. 2)
74
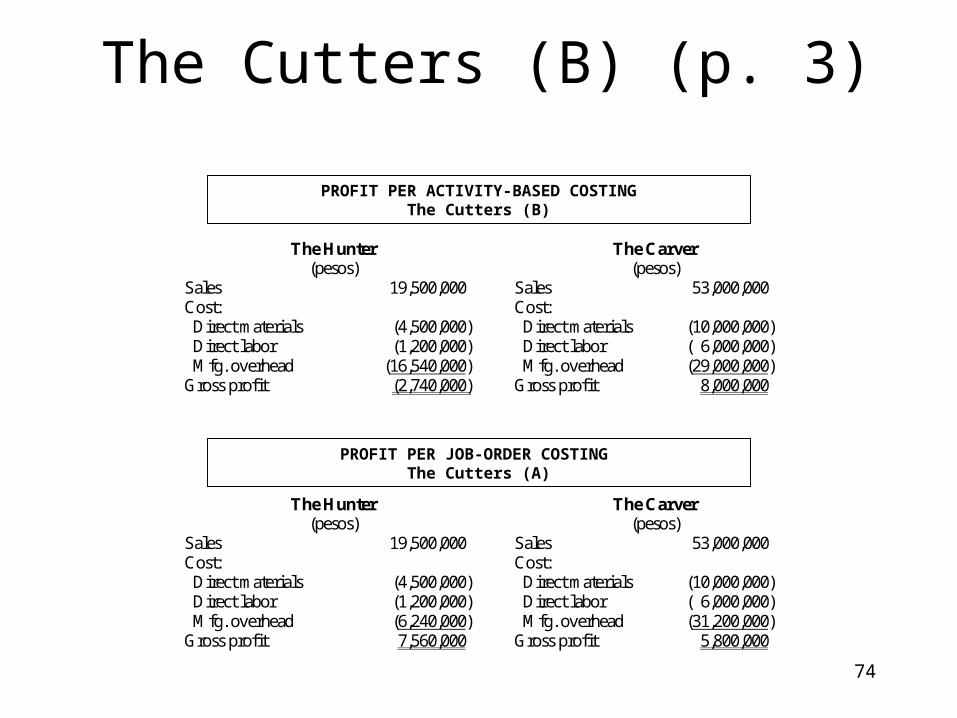
The Cutters (B) (p. 3)
The Hunter (pesos)
The Carver (pesos)
Sales 19,500,000 Sales 53,000,000 Cost: Cost: Direct materials (4,500,000) Direct materials (10,000,000) Direct labor (1,200,000) Direct labor ( 6,000,000) Mfg. overhead (16,540,000) Mfg. overhead (29,000,000) Gross profit (2,740,000) Gross profit 8,000,000
PROFIT PER ACTIVITY-BASED COSTINGThe Cutters (B)
The Hunter (pesos)
The Carver (pesos)
Sales 19,500,000 Sales 53,000,000 Cost: Cost: Direct materials (4,500,000) Direct materials (10,000,000) Direct labor (1,200,000) Direct labor ( 6,000,000) Mfg. overhead (6,240,000) Mfg. overhead (31,200,000) Gross profit 7,560,000 Gross profit 5,800,000
PROFIT PER JOB-ORDER COSTING The Cutters (A)
75
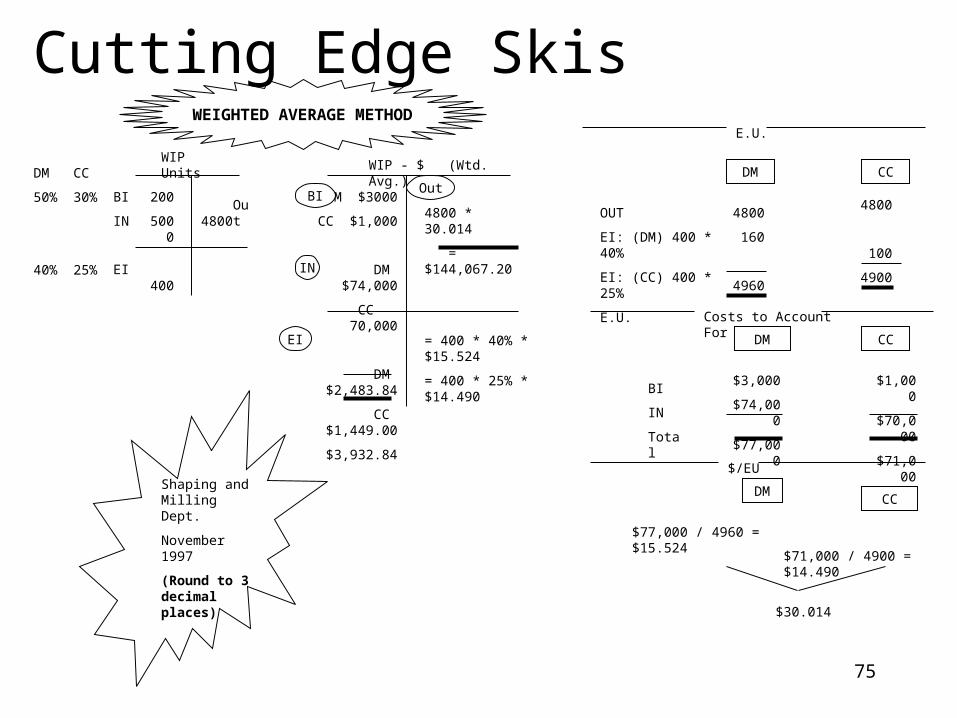
Cutting Edge Skis
Shaping and Milling Dept.
November 1997
(Round to 3 decimal places)
WIP Units
200
5000
400
4800Out
BI
IN
EI
DM
50%
40%
CC
30%
25%
WIP - $ (Wtd. Avg.)
DM $3000
CC $1,000
DM $74,000
CC 70,000
DM $2,483.84
CC $1,449.00
$3,932.84
4800 * 30.014
= $144,067.20
= 400 * 40% * $15.524
= 400 * 25% * $14.490
OutBI
IN
EI
E.U.
DM CC
4800
160
4960
4800
100
4900
Costs to Account For
DM CC
$3,000
$74,000
$77,000
$1,000
$70,000
$71,000
BI
IN
Total
$/EU
DMCC
$77,000 / 4960 = $15.524
$71,000 / 4900 = $14.490
$30.014
OUT
EI: (DM) 400 * 40%
EI: (CC) 400 * 25%
E.U.
WEIGHTED AVERAGE METHOD
76
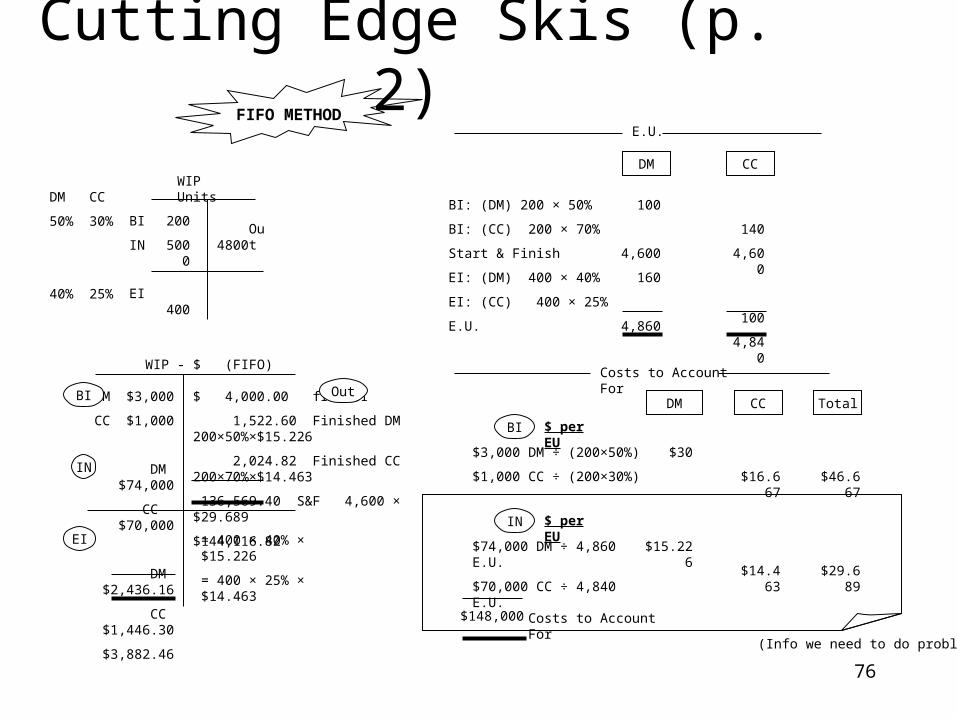
Cutting Edge Skis (p. 2)
WIP - $ (FIFO)
DM $3,000
CC $1,000
DM $74,000
CC $70,000
DM $2,436.16
CC $1,446.30
$3,882.46
$ 4,000.00 from BI
1,522.60 Finished DM 200×50%×$15.226
2,024.82 Finished CC 200×70%×$14.463
136,569.40 S&F 4,600 × $29.689
$144,116.82
= 400 × 40% × $15.226
= 400 × 25% × $14.463
OutBI
IN
EI
E.U.
DM CC
100
4,600
160
4,860
140
4,600
100
4,840
Costs to Account For
DM CC
$30
$16.667
$ per EU
BI: (DM) 200 × 50%
BI: (CC) 200 × 70%
Start & Finish
EI: (DM) 400 × 40%
EI: (CC) 400 × 25%
E.U.
FIFO METHOD
BI
$3,000 DM ÷ (200×50%)
$1,000 CC ÷ (200×30%)
Total
$46.667
$15.226
$14.463
$ per EUIN
$74,000 DM ÷ 4,860 E.U.
$70,000 CC ÷ 4,840 E.U. $29.689
(Info we need to do problem)
$148,000 Costs to Account For
WIP Units
200
5000
400
4800Out
BI
IN
EI
DM
50%
40%
CC
30%
25%
77
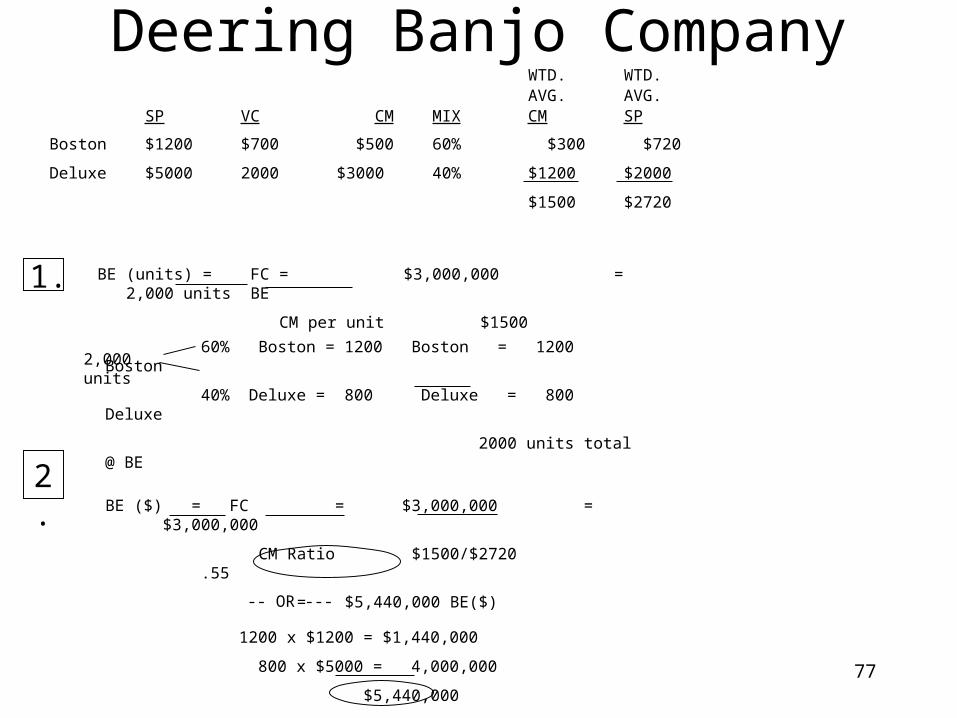
WTD. WTD.AVG. AVG.
SP VC CM MIX CM SP
Boston $1200 $700 $500 60% $300 $720
Deluxe $5000 2000 $3000 40% $1200 $2000
$1500 $2720
1.
60% Boston = 1200 Boston = 1200 Boston
40% Deluxe = 800 Deluxe = 800 Deluxe
2000 units total @ BE
2,000 units
BE (units) = FC = $3,000,000 = 2,000 units BE
CM per unit $1500
2.BE ($) = FC = $3,000,000 = $3,000,000
CM Ratio $1500/$2720 .55
= $5,440,000 BE($)
-- OR ---
1200 x $1200 = $1,440,000
800 x $5000 = 4,000,000
$5,440,000
Deering Banjo Company
78
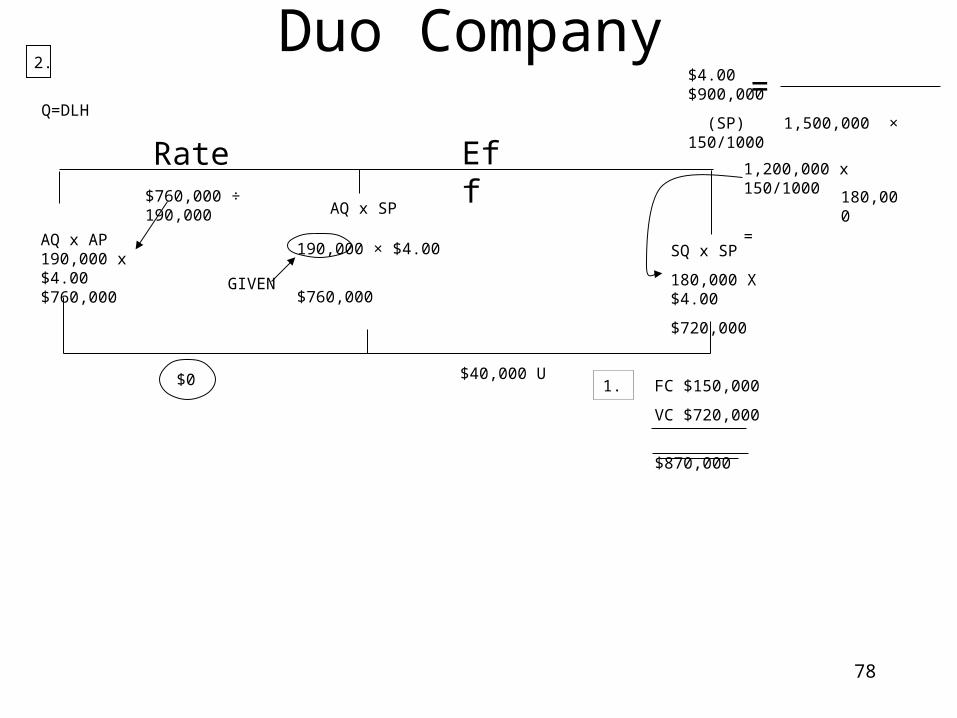
Q=DLH
$4.00 $900,000
(SP) 1,500,000 × 150/1000
Rate Eff
AQ x AP190,000 x $4.00$760,000
SQ x SP
180,000 X $4.00
$720,000
$760,000 ÷ 190,000AQ x SP
$0 $40,000 U
1,200,000 x 150/1000
=
1. FC $150,000
VC $720,000
$870,000
190,000 × $4.00
$760,000GIVEN
=
180,000
2.Duo Company
79
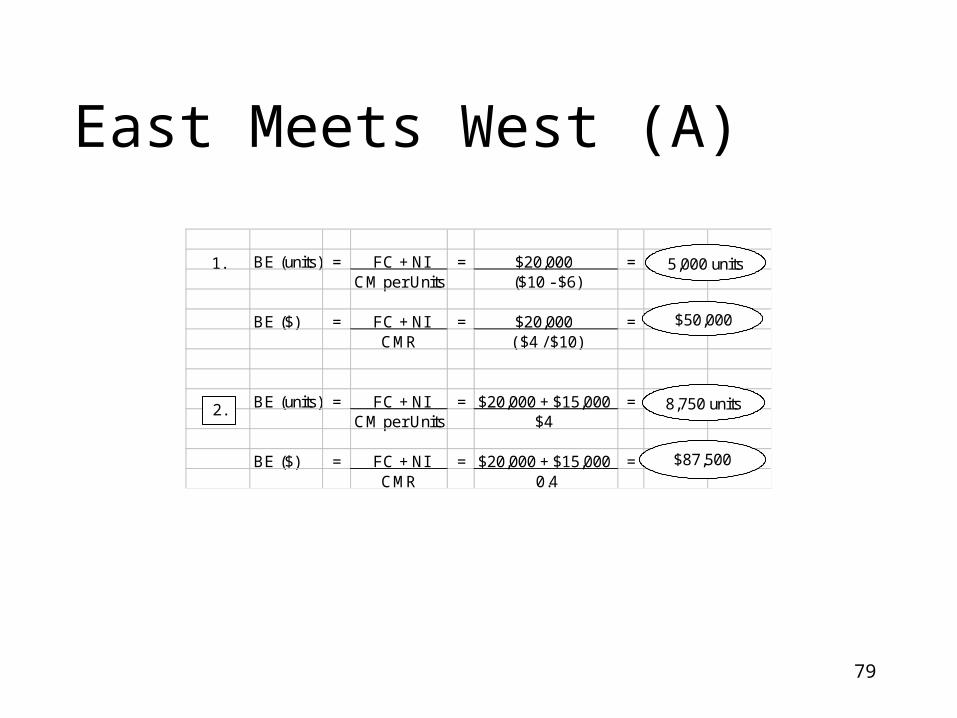
East Meets West (A)
BE (units) = FC + NI = $20,000 =CM per Units ($10 - $6)
BE ($) = FC + NI = $20,000 =CMR ( $4 / $10)
BE (units) = FC + NI = $20,000 + $15,000 =CM per Units $4
BE ($) = FC + NI = $20,000 + $15,000 =CMR 0.4
1. 5,000 units
$50,000
2. 8,750 units
$87,500
80
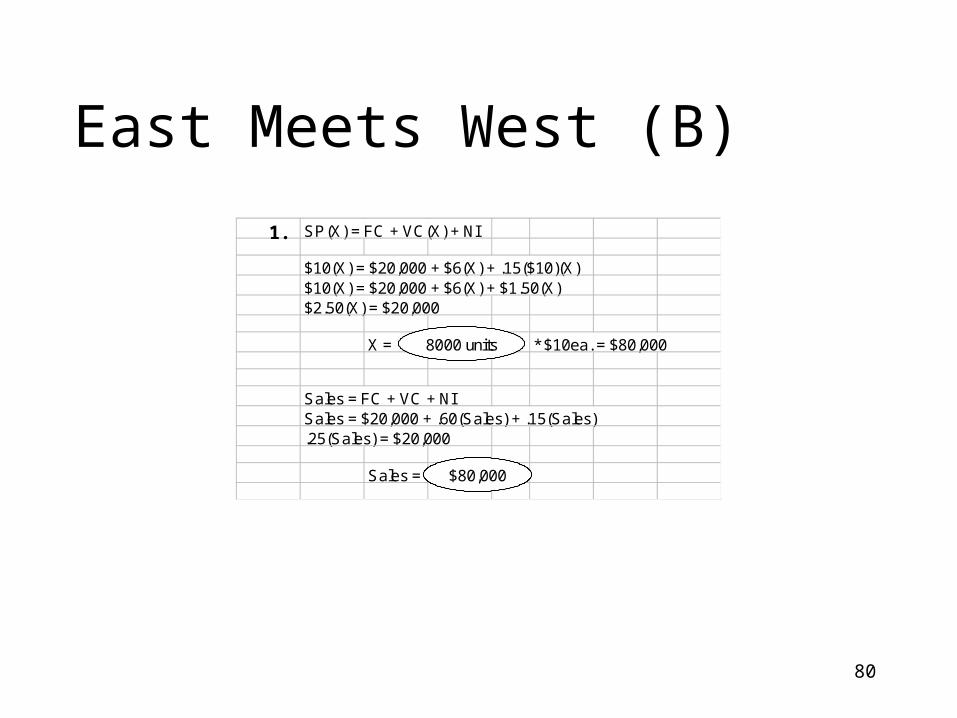
East Meets West (B)
SP(X) = FC + VC(X) + NI
$10(X) = $20,000 + $6(X) + .15($10)(X)$10(X) = $20,000 + $6(X) + $1.50(X)$2.50(X) = $20,000
X = * $10ea. = $80,000
Sales = FC + VC + NISales = $20,000 + .60(Sales) + .15(Sales).25(Sales) = $20,000
Sales =
1.
8000 units
$80,000
81
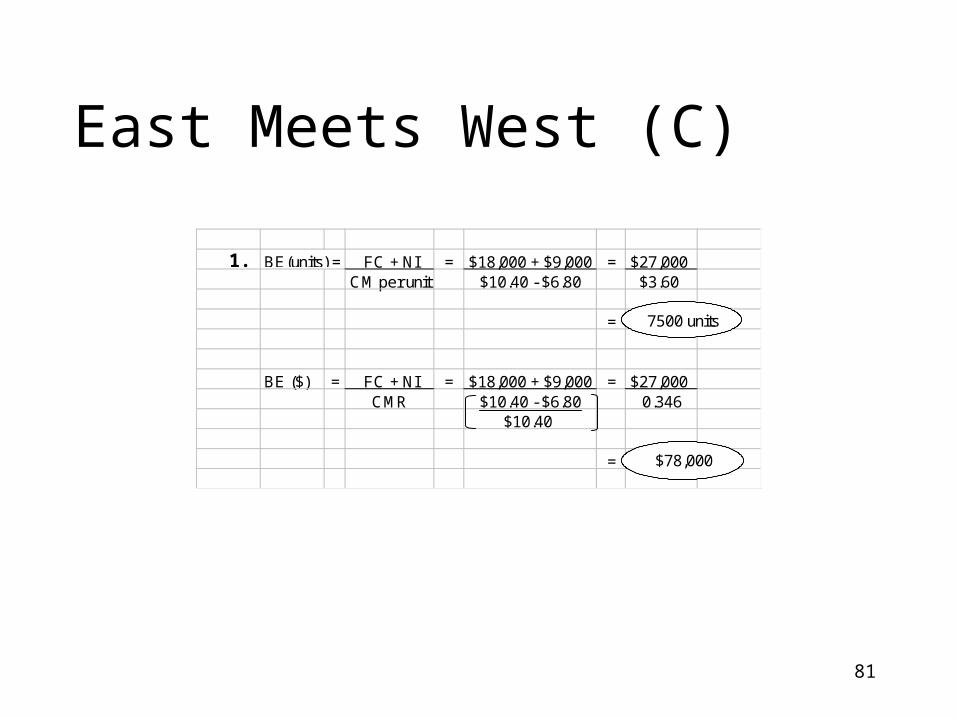
East Meets West (C)
BE(units) = FC + NI = $18,000 + $9,000 = $27,000CM per unit $10.40 - $6.80 $3.60
=
BE ($) = FC + NI = $18,000 + $9,000 = $27,000CMR $10.40 - $6.80 0.346
$10.40
=
1.
7500 units
$78,000
82
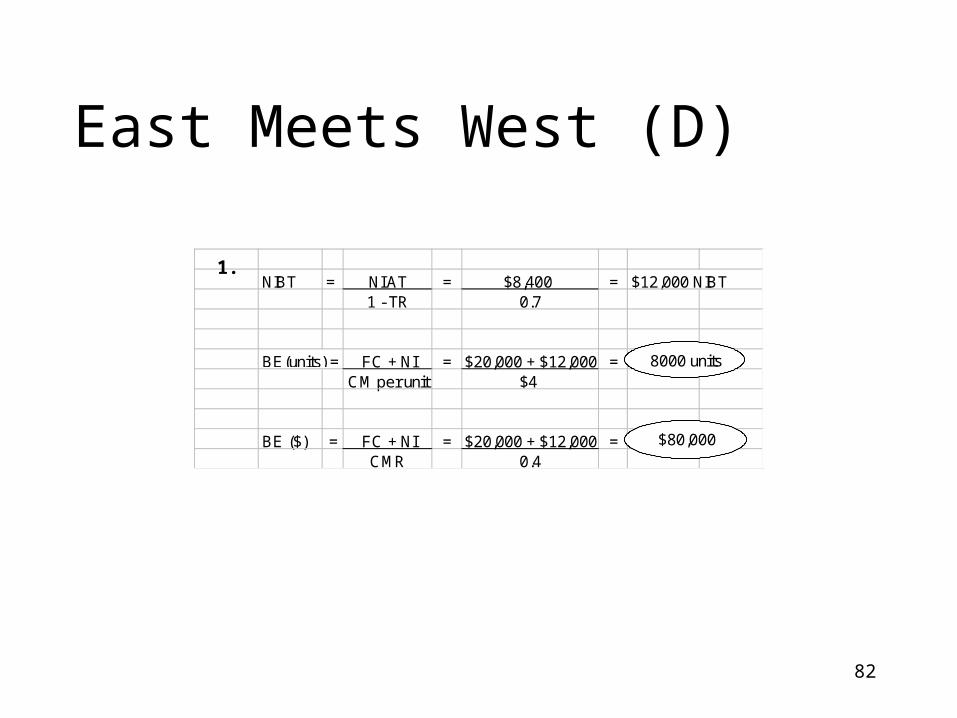
East Meets West (D)
NIBT = NI AT = $8,400 = $12,000 NIBT1 - TR 0.7
BE(units) = FC + NI = $20,000 + $12,000 =CM per unit $4
BE ($) = FC + NI = $20,000 + $12,000 =CMR 0.4
1.
8000 units
$80,000
83
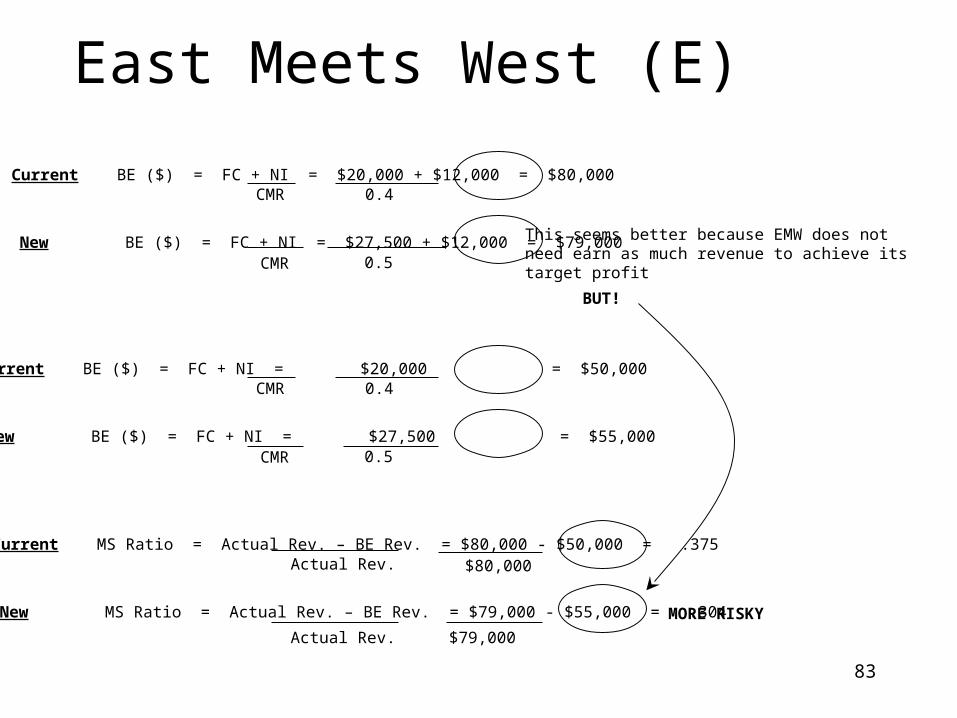
East Meets West (E)
Current BE ($) = FC + NI = $20,000 + $12,000 = $80,000CMR 0.4
New BE ($) = FC + NI = $27,500 + $12,000 = $79,000CMR 0.5
This seems better because EMW does notneed earn as much revenue to achieve itstarget profit
BUT!
Current BE ($) = FC + NI = $20,000 = $50,000CMR 0.4
New BE ($) = FC + NI = $27,500 = $55,000CMR 0.5
Current MS Ratio = Actual Rev. – BE Rev. = $80,000 - $50,000 = .375Actual Rev. $80,000
New MS Ratio = Actual Rev. – BE Rev. = $79,000 - $55,000 = .304
Actual Rev. $79,000
MORE RISKY
84
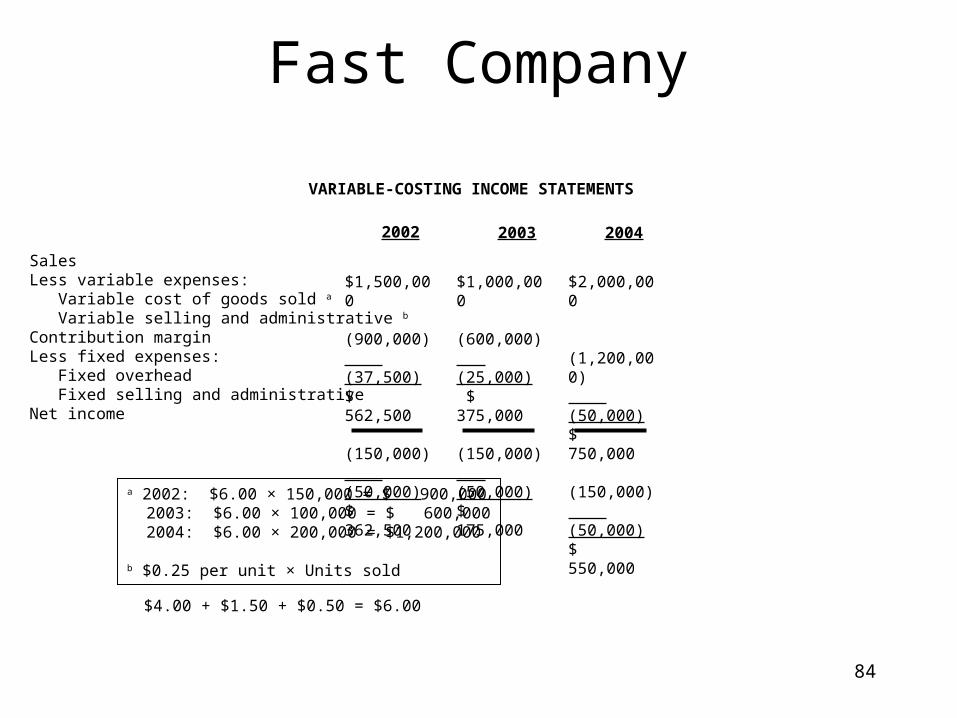
Fast Company
VARIABLE-COSTING INCOME STATEMENTS
SalesLess variable expenses: Variable cost of goods sold a
Variable selling and administrative b
Contribution marginLess fixed expenses: Fixed overhead Fixed selling and administrativeNet income
$1,500,000
(900,000) (37,500)$ 562,500
(150,000) (50,000)$ 362,500
$1,000,000
(600,000) (25,000) $ 375,000
(150,000) (50,000)$ 175,000
$2,000,000
(1,200,000) (50,000)$ 750,000
(150,000) (50,000)$ 550,000
2002 2003 2004
a 2002: $6.00 × 150,000 = $ 900,000 2003: $6.00 × 100,000 = $ 600,000 2004: $6.00 × 200,000 = $1,200,000
b $0.25 per unit × Units sold
$4.00 + $1.50 + $0.50 = $6.00
85
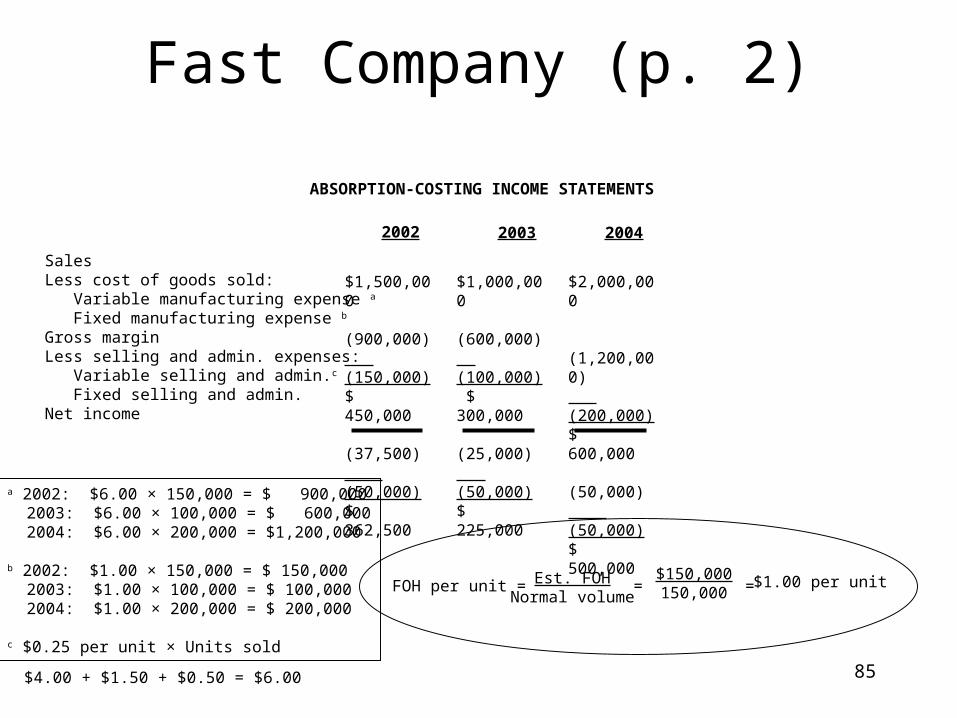
Fast Company (p. 2)
ABSORPTION-COSTING INCOME STATEMENTS
SalesLess cost of goods sold: Variable manufacturing expense a
Fixed manufacturing expense b
Gross marginLess selling and admin. expenses: Variable selling and admin.c
Fixed selling and admin.Net income
$1,500,000
(900,000) (150,000)$ 450,000
(37,500) (50,000)$ 362,500
$1,000,000
(600,000) (100,000) $ 300,000
(25,000) (50,000)$ 225,000
$2,000,000
(1,200,000) (200,000)$ 600,000
(50,000) (50,000)$ 500,000
2002 2003 2004
a 2002: $6.00 × 150,000 = $ 900,000 2003: $6.00 × 100,000 = $ 600,000 2004: $6.00 × 200,000 = $1,200,000
b 2002: $1.00 × 150,000 = $ 150,000 2003: $1.00 × 100,000 = $ 100,000 2004: $1.00 × 200,000 = $ 200,000
c $0.25 per unit × Units sold
FOH per unit = Est. FOHNormal volume
=$150,000150,000 = $1.00 per unit
$4.00 + $1.50 + $0.50 = $6.00
86
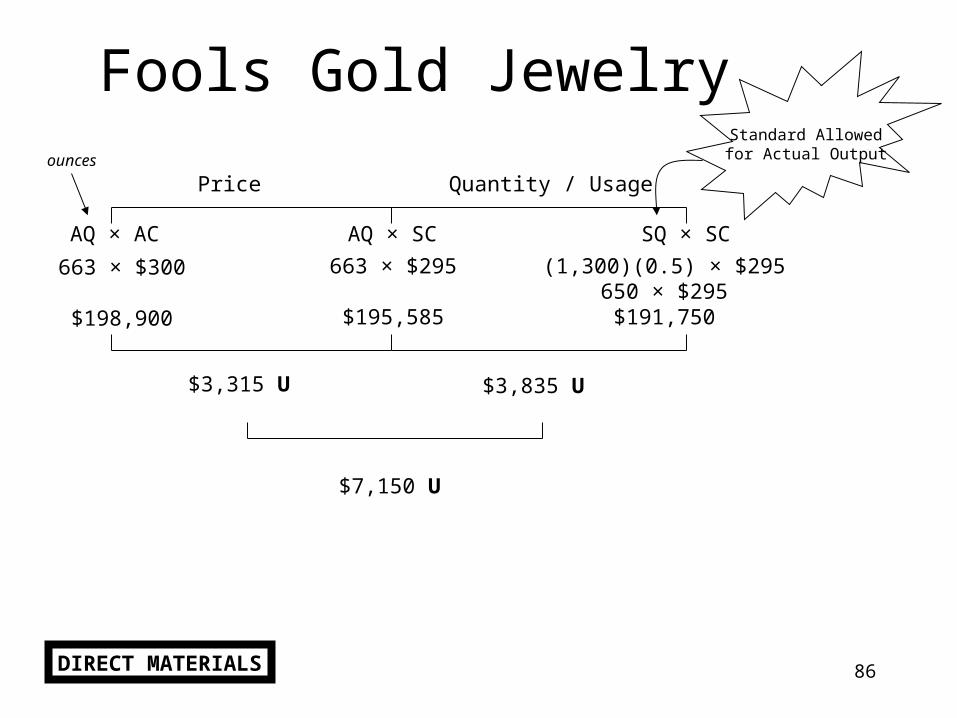
Fools Gold JewelryStandard Allowedfor Actual Output
Price Quantity / Usage
AQ × AC AQ × SC SQ × SC
ounces
663 × $300
$198,900
(1,300)(0.5) × $295650 × $295$191,750
663 × $295
$195,585
$3,315 U $3,835 U
$7,150 U
DIRECT MATERIALS
87
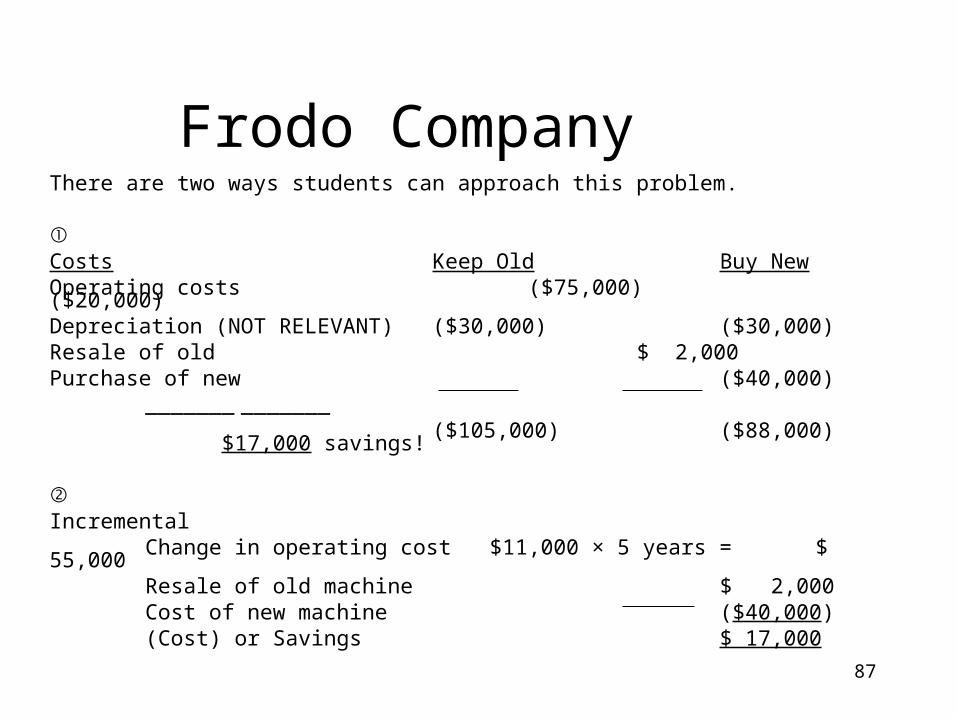
Frodo CompanyThere are two ways students can approach this problem. Costs Keep Old Buy NewOperating costs ($75,000) ($20,000)Depreciation (NOT RELEVANT) ($30,000) ($30,000)Resale of old $ 2,000Purchase of new ($40,000)
_______ _______($105,000) ($88,000) $17,000 savings!
Incremental
Change in operating cost $11,000 × 5 years = $ 55,000Resale of old machine $ 2,000Cost of new machine ($40,000)(Cost) or Savings $ 17,000
88
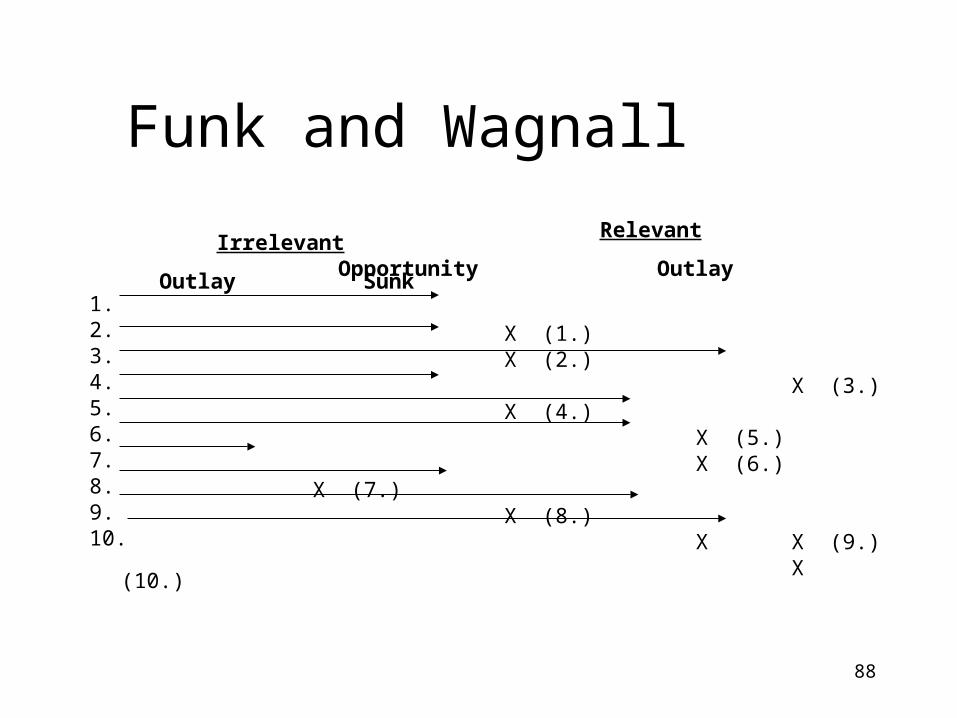
Funk and Wagnall
Relevant Irrelevant Opportunity Outlay Outlay Sunk
X (1.)X (2.)
X (3.)X (4.)
X (5.)X (6.)
X (7.)X (8.)
X X (9.)X (10.)
1.2.3.4.5.6.7.8.9.10.
89
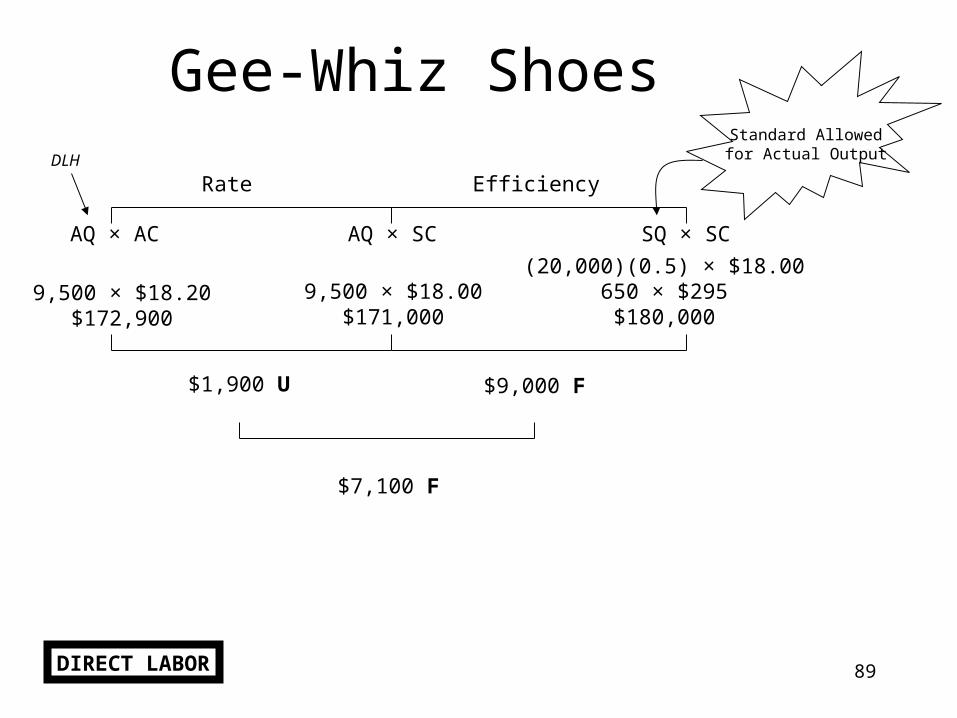
Gee-Whiz ShoesStandard Allowedfor Actual Output
Rate Efficiency
AQ × AC AQ × SC SQ × SC
DLH
9,500 × $18.20$172,900
(20,000)(0.5) × $18.00650 × $295$180,000
9,500 × $18.00$171,000
$1,900 U $9,000 F
$7,100 F
DIRECT LABOR
90
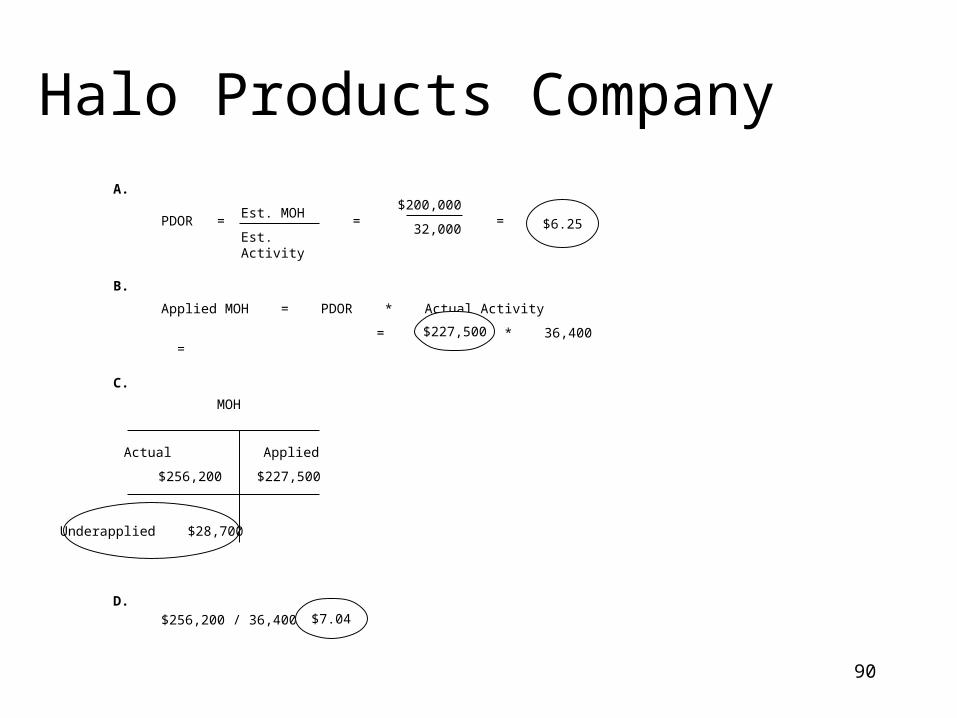
Halo Products CompanyA.
B.
C.
D.
PDOR = Est. MOH
Est. Activity=
$200,000
32,000= $6.25
Applied MOH = PDOR * Actual Activity
= $6.25 * 36,400 = $227,500
MOH
Actual
$256,200
Applied
$227,500
Underapplied $28,700
$256,200 / 36,400 = $7.04
91
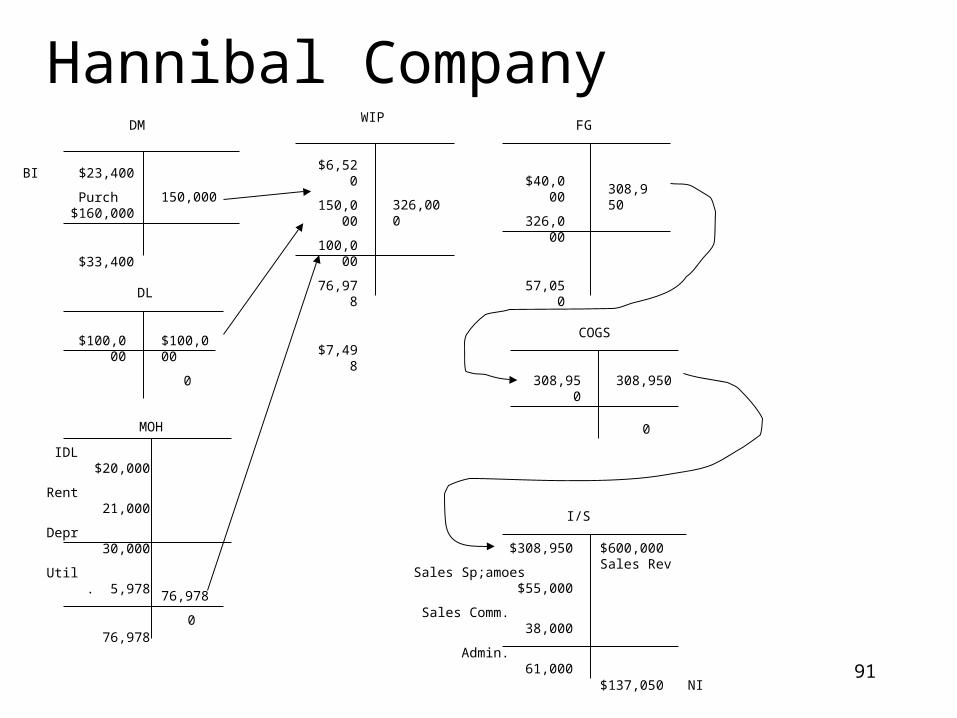
Hannibal CompanyDM
BI $23,400
Purch $160,000
$33,400
150,000
$100,000 $100,000
0
DL
IDL $20,000
Rent 21,000
Depr 30,000
Util . 5,978
76,978
76,978
0
$6,520
150,000
100,000
76,978
$7,498
326,000
WIP
$40,000
326,000
57,050
308,950
FG
308,950 308,950
0
COGS
I/S
$308,950
Sales Sp;amoes $55,000
Sales Comm. 38,000
Admin. 61,000
$600,000 Sales Rev
$137,050 NI
MOH
92
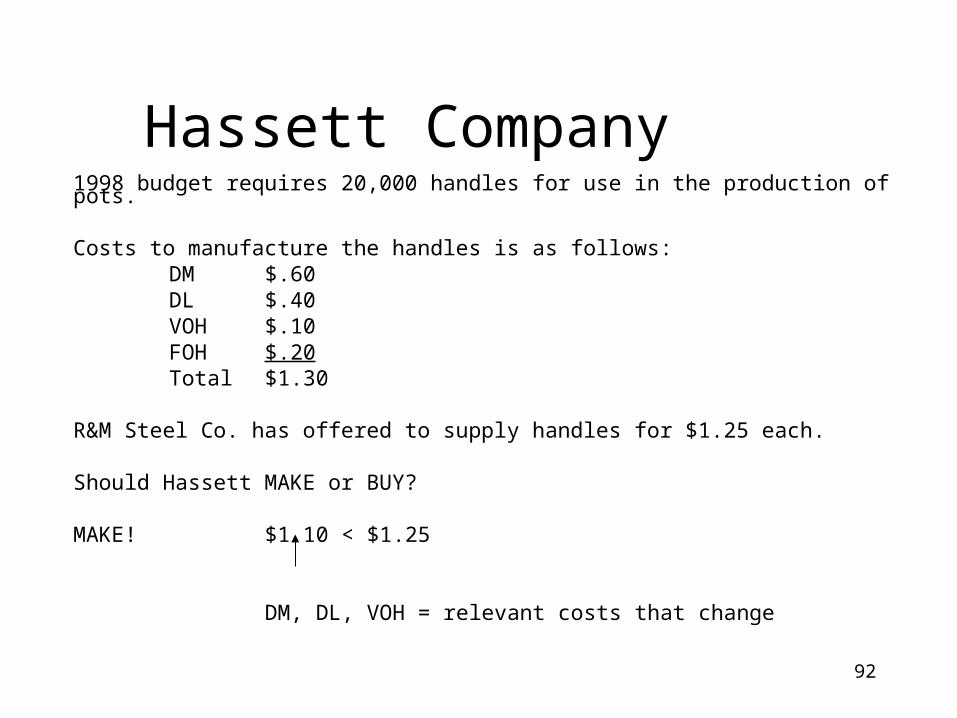
Hassett Company1998 budget requires 20,000 handles for use in the production of pots. Costs to manufacture the handles is as follows:
DM $.60DL $.40VOH $.10FOH $.20Total $1.30
R&M Steel Co. has offered to supply handles for $1.25 each. Should Hassett MAKE or BUY? MAKE! $1.10 < $1.25
DM, DL, VOH = relevant costs that change
93
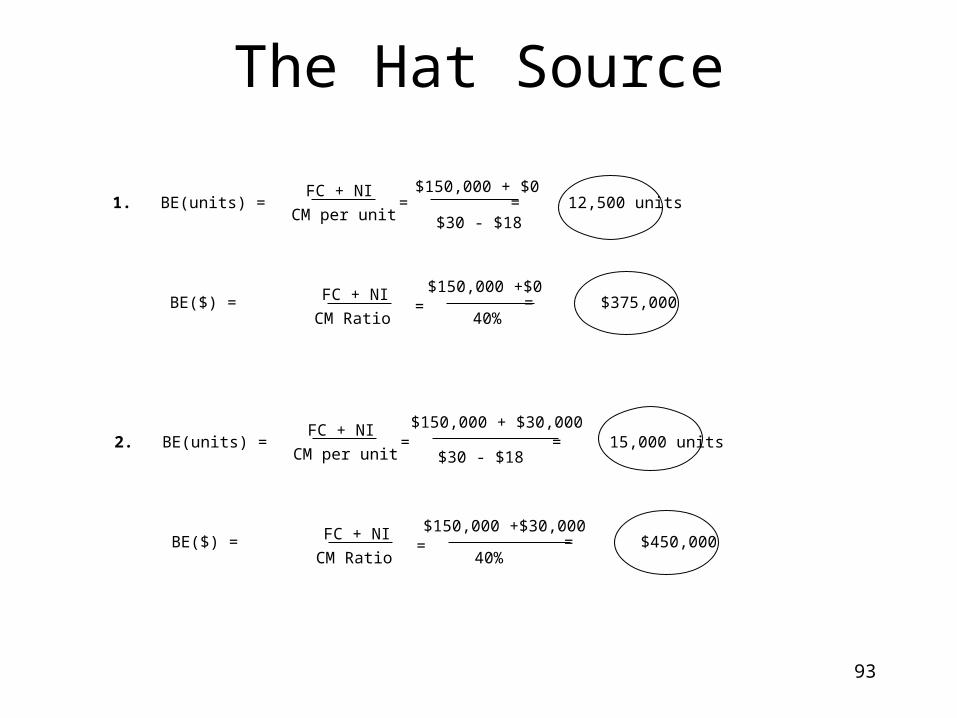
The Hat Source
1. BE(units) =CM per unit
FC + NI=
$150,000 + $0
$30 - $18= 12,500 units
BE($) =CM Ratio
FC + NI=
$150,000 +$0
40%= $375,000
2. BE(units) =CM per unit
FC + NI=
$30 - $18= 15,000 units
BE($) =CM Ratio
FC + NI=
$150,000 +$30,000
40%= $450,000
$150,000 + $30,000
94
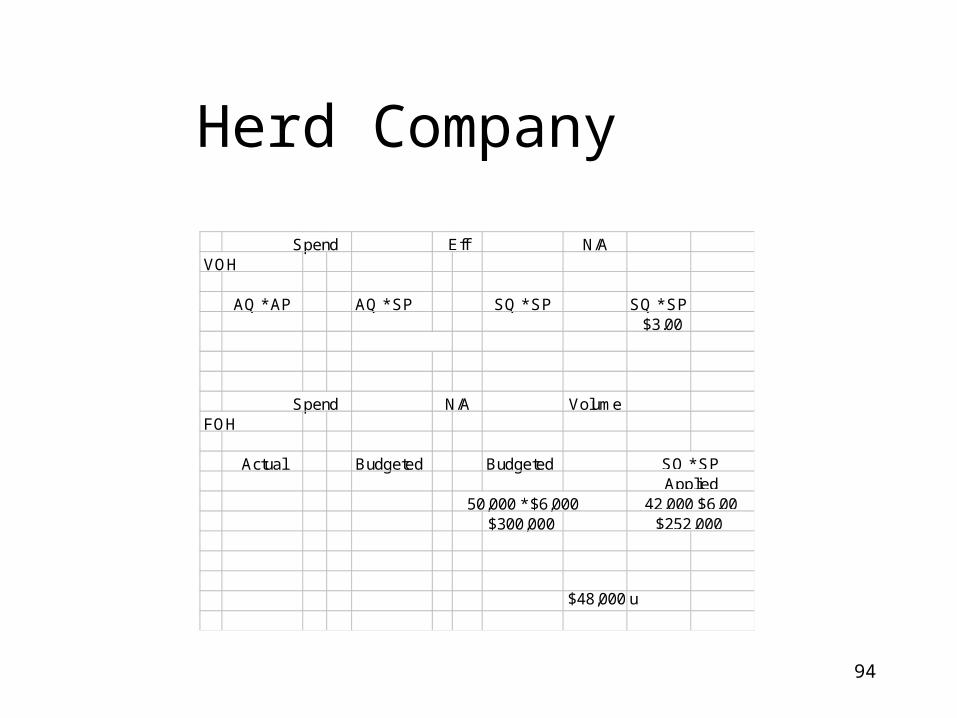
Herd Company
Spend N/AVOH
AQ * AP AQ * SP SQ * SP SQ * SP$3.00
Spend VolumeFOH
Actual Budgeted Budgeted
50,000 * $6,000$300,000
42,000 $6.00$252,000
N/A
SQ * SPApplied
Eff
$48,000 u
95
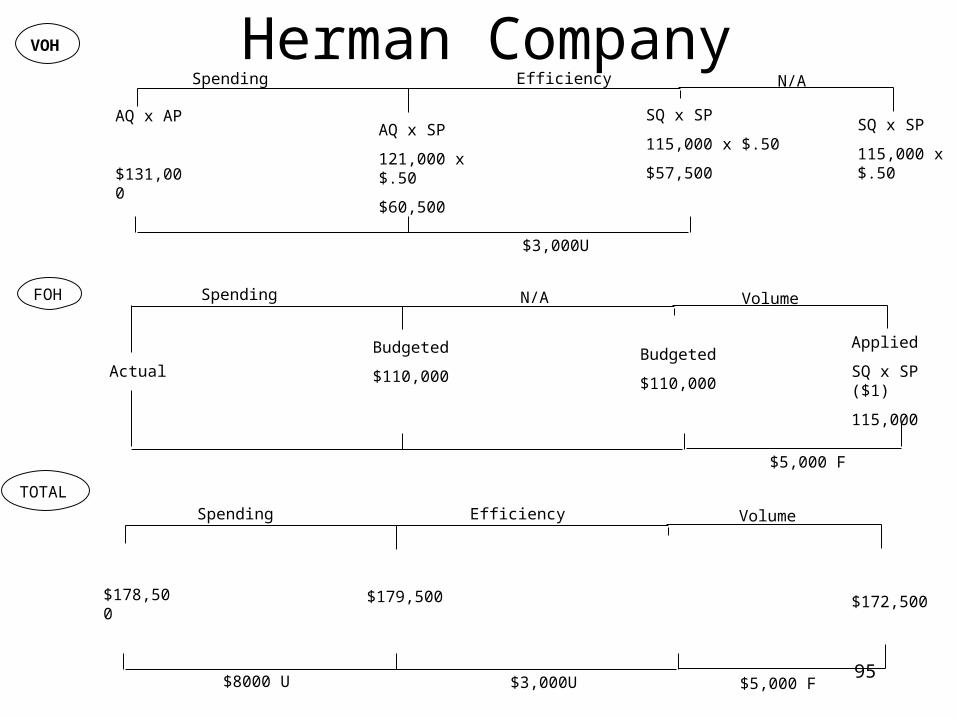
VOH
Spending Efficiency
AQ x AP
$131,000
AQ x SP
121,000 x $.50
$60,500
$3,000U
SQ x SP
115,000 x $.50
$57,500
N/A
SQ x SP
115,000 x $.50
FOH
Actual
Budgeted
$110,000
Budgeted
$110,000
Applied
SQ x SP ($1)
115,000
Spending N/A Volume
$5,000 F
TOTAL
$178,500 $179,500
$3,000U
$172,500
Spending Efficiency Volume
$5,000 F$8000 U
Herman Company
96
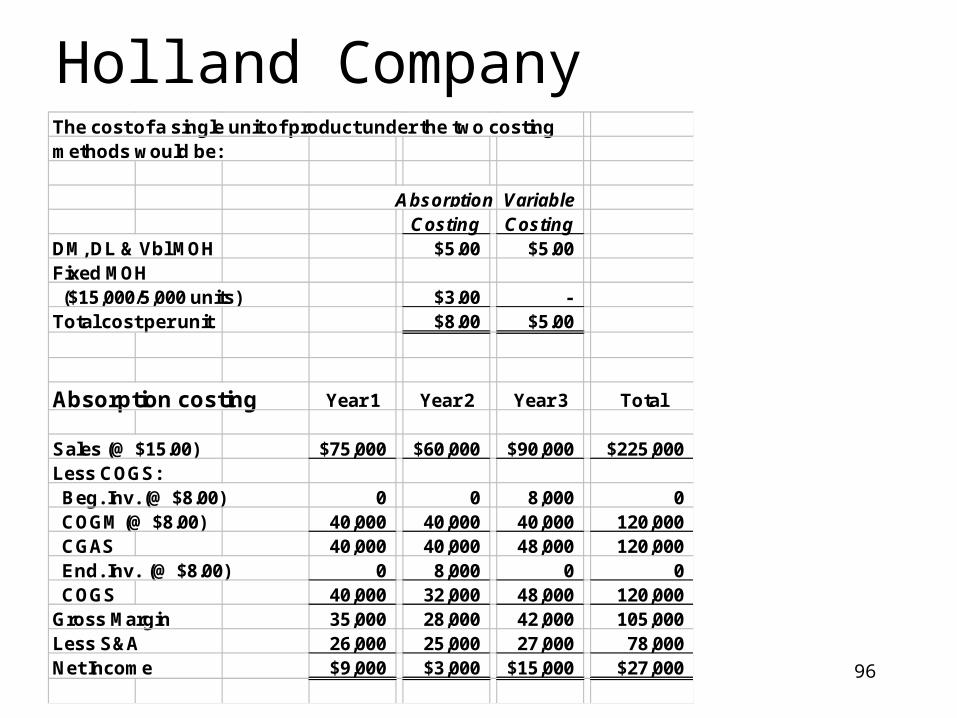
Holland CompanyThe cost of a single unit of product under the two costingmethods would be:
Absorption VariableCosting Costing
DM, DL & Vbl MOH $5.00 $5.00Fixed MOH ($15,000/5,000 units) $3.00 - Total cost per unit $8.00 $5.00
Absorption costing Year 1 Year 2 Year 3 Total
Sales (@ $15.00) $75,000 $60,000 $90,000 $225,000Less COGS: Beg. Inv. (@ $8.00) 0 0 8,000 0 COGM (@ $8.00) 40,000 40,000 40,000 120,000 CGAS 40,000 40,000 48,000 120,000 End. Inv. (@ $8.00) 0 8,000 0 0 COGS 40,000 32,000 48,000 120,000Gross Margin 35,000 28,000 42,000 105,000Less S&A 26,000 25,000 27,000 78,000Net Income $9,000 $3,000 $15,000 $27,000
97
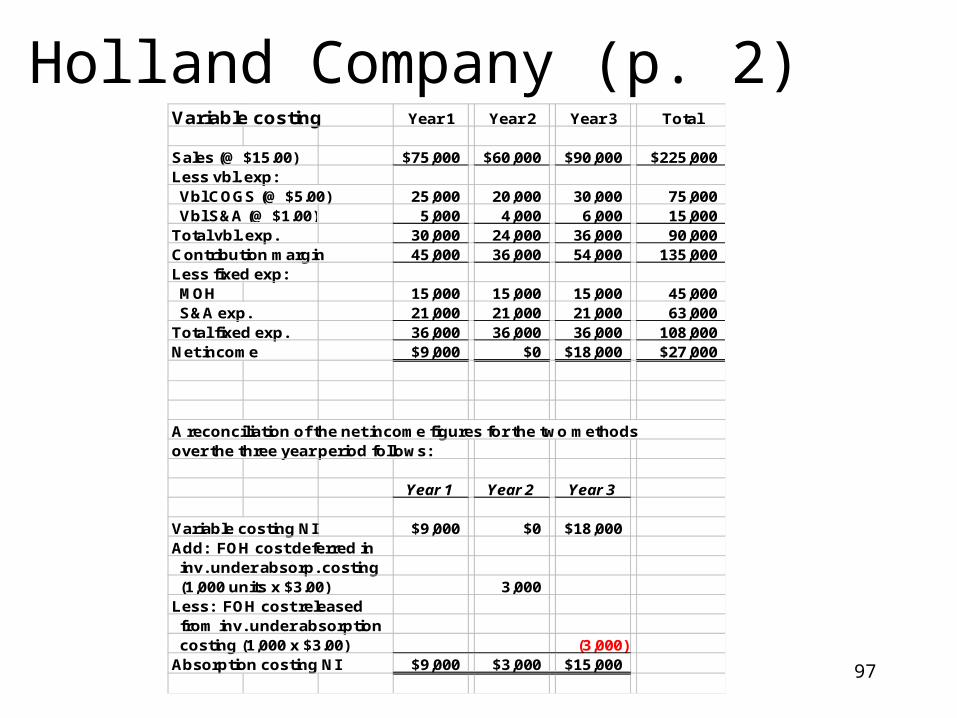
Holland Company (p. 2)Variable costing Year 1 Year 2 Year 3 Total
Sales (@ $15.00) $75,000 $60,000 $90,000 $225,000Less vbl. exp: Vbl COGS (@ $5.00) 25,000 20,000 30,000 75,000 Vbl S&A (@ $1.00) 5,000 4,000 6,000 15,000Total vbl. exp. 30,000 24,000 36,000 90,000Contribution margin 45,000 36,000 54,000 135,000Less fixed exp: MOH 15,000 15,000 15,000 45,000 S&A exp. 21,000 21,000 21,000 63,000Total fixed exp. 36,000 36,000 36,000 108,000Net income $9,000 $0 $18,000 $27,000
A reconciliation of the net income figures for the two methodsover the three year period follows:
Year 1 Year 2 Year 3
Variable costing NI $9,000 $0 $18,000Add: FOH cost deferred in inv. under absorp. costing (1,000 units x $3.00) 3,000Less: FOH cost released from inv. under absorption costing (1,000 x $3.00) (3,000)Absorption costing NI $9,000 $3,000 $15,000
98
Home Quality Products
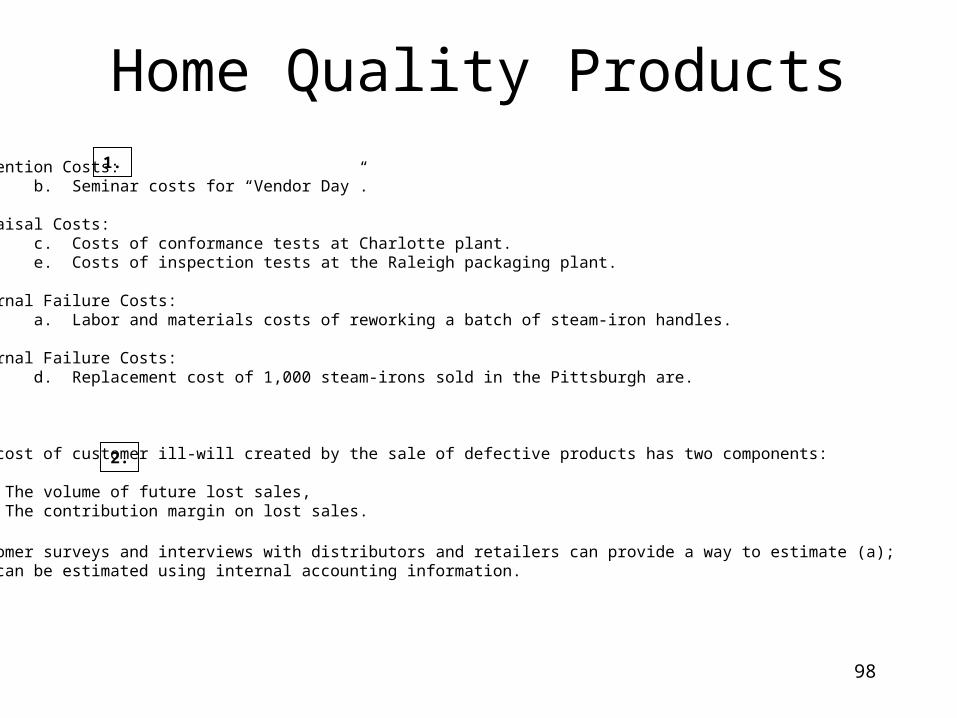
Prevention Costs: b. Seminar costs for “Vendor Day”.
Appraisal Costs: c. Costs of conformance tests at Charlotte plant. e. Costs of inspection tests at the Raleigh packaging plant.
Internal Failure Costs: a. Labor and materials costs of reworking a batch of steam-iron handles.
External Failure Costs: d. Replacement cost of 1,000 steam-irons sold in the Pittsburgh are.
The cost of customer ill-will created by the sale of defective products has two components:
(a) The volume of future lost sales,(b) The contribution margin on lost sales.
Customer surveys and interviews with distributors and retailers can provide a way to estimate (a);(b) can be estimated using internal accounting information.
1.
2.
99
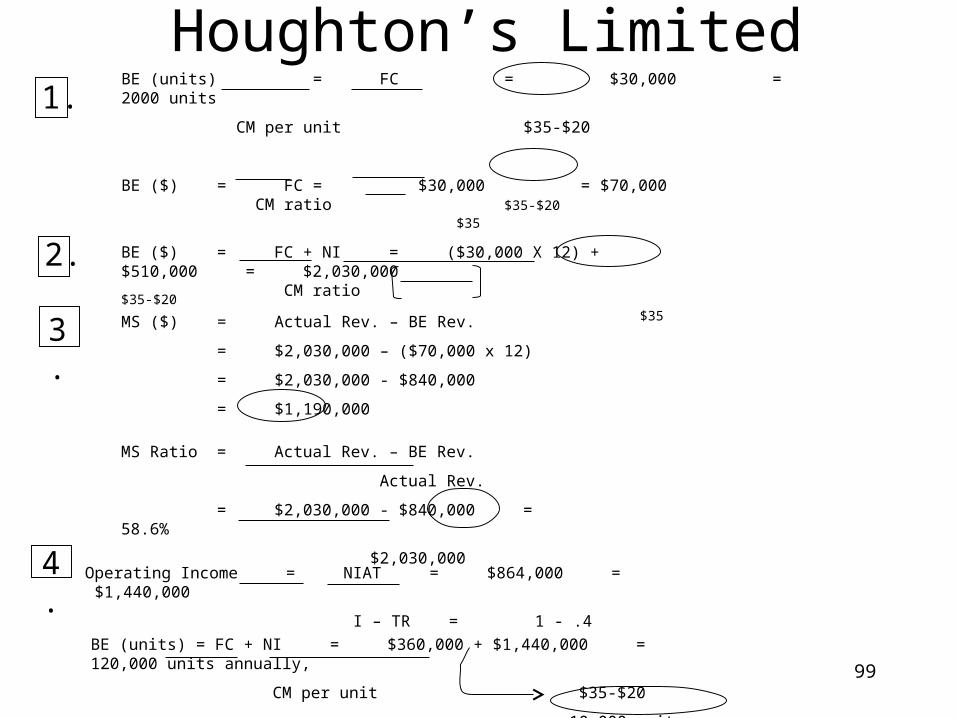
1.BE (units) = FC = $30,000 = 2000 units
CM per unit $35-$20
BE ($) = FC = $30,000 = $70,000 CM ratio $35-$20
$35
2. BE ($) = FC + NI = ($30,000 X 12) + $510,000 = $2,030,000 CM ratio $35-$20
$35
3. MS ($) = Actual Rev. – BE Rev.
= $2,030,000 – ($70,000 x 12)
= $2,030,000 - $840,000
= $1,190,000
MS Ratio = Actual Rev. – BE Rev.
Actual Rev.
= $2,030,000 - $840,000 = 58.6%
$2,030,000
4. Operating Income = NIAT = $864,000 = $1,440,000
I – TR = 1 - .4
BE (units) = FC + NI = $360,000 + $1,440,000 = 120,000 units annually,
CM per unit $35-$20
10,000 units monthly
Houghton’s Limited
100
The Hour RecordDistance traveled is the ‘score,’ determining who wins and who doesn’t, and seems to be best considered a financial measure. Net income or cash flow if you will. This is a historical measure; at any point in time this measure only tells you what has occurred in the past.
Bicycle speed is the predictive of what ‘score’ will be achieved. Measures that do this can be both financial (expected sales in dollars) and nonfinancial (expected sales in units).
Heart Rate is a measure of current effort, such as the amount (in units or dollars) of materials, labor and/or overhead being used in production. In general, with heart rate and with materials usage, lower is better. Again, this is a historical measure but is predictive to the degree that heart rate this minute will be the same as heart rate the next minute. Human body efficiency decreases over time, so heart rate will increase over time, but business efficiency should increase over time, and the corresponding efficiency measures should improve.
Can a target (or budgeted) distance be useful in this scenario? Or at least knowledge of the last record set? If after 30 minutes the rider is less than halfway toward the old record, someone should determine if the record can realistically be equaled or broken. If the record is unrealistic, the rider might as well cut his or her losses and save the energy for another task.
101
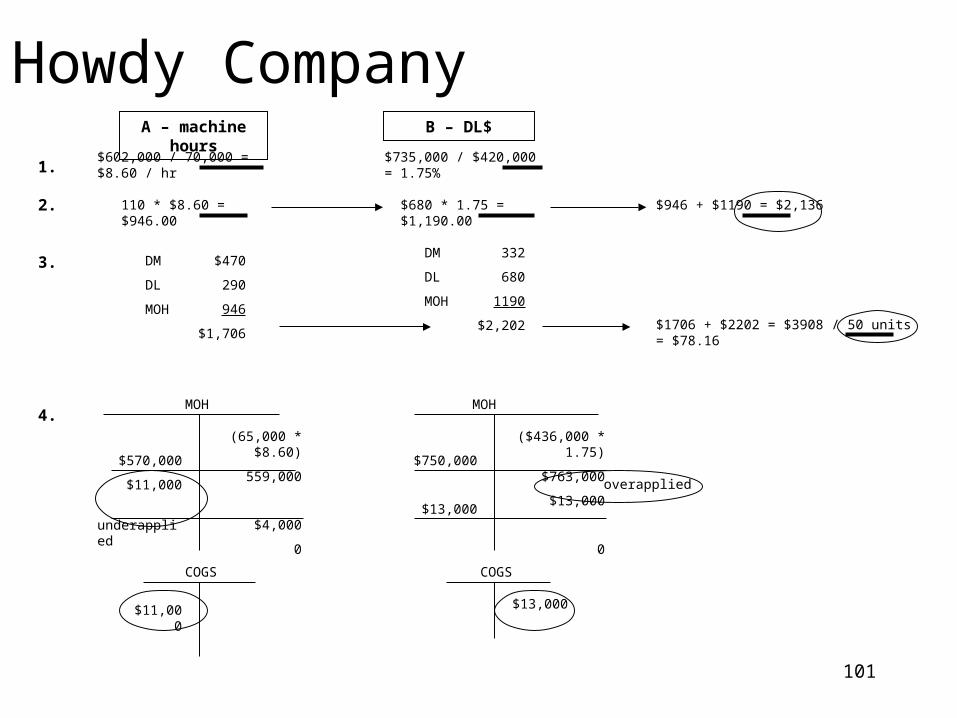
Howdy Company$602,000 / 70,000 = $8.60 / hr $735,000 / $420,000 = 1.75%
110 * $8.60 = $946.00 $680 * 1.75 = $1,190.00 $946 + $1190 = $2,136
DM
DL
MOH
$470
290
946
$1,706
DM
DL
MOH
332
680
1190
$2,202 $1706 + $2202 = $3908 / 50 units = $78.16
MOH
(65,000 * $8.60)
559,000
$4,000
0
$570,000
$11,000
underapplied
COGS
$11,000
MOH
$750,000
$13,000
($436,000 * 1.75)
$763,000
$13,000
0
COGS
$13,000
1.
2.
3.
4.
A – machine hours B – DL$
overapplied
102
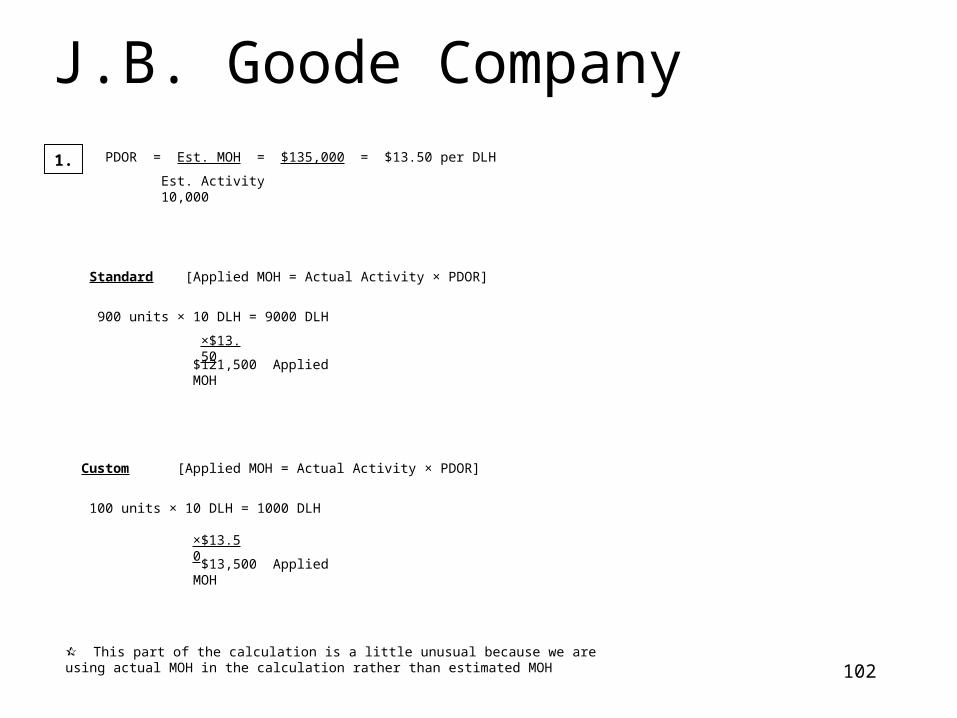
J.B. Goode CompanyPDOR = Est. MOH = $135,000 = $13.50 per DLH
Standard [Applied MOH = Actual Activity × PDOR]
Custom [Applied MOH = Actual Activity × PDOR]
This part of the calculation is a little unusual because we are using actual MOH in the calculation rather than estimated MOH
Est. Activity 10,000
900 units × 10 DLH = 9000 DLH
×$13.50
$121,500 Applied MOH
100 units × 10 DLH = 1000 DLH
×$13.50
$13,500 Applied MOH
1.
103
J.B. Goode Company (p. 2)
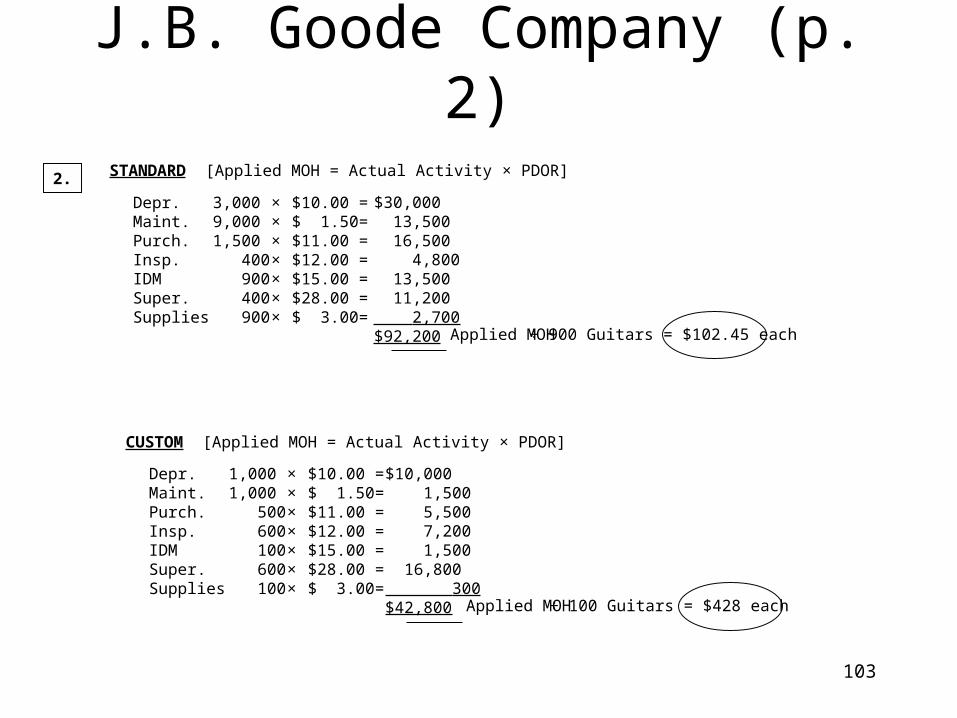
2. STANDARD [Applied MOH = Actual Activity × PDOR]
Depr.Maint.Purch.Insp.IDMSuper.Supplies
3,0009,0001,500 400 900 400 900
×××××××
$10.00$ 1.50$11.00$12.00$15.00$28.00$ 3.00
=======
$30,000 13,500 16,500 4,800 13,500 11,200 2,700$92,200 Applied MOH ÷ 900 Guitars = $102.45 each
CUSTOM [Applied MOH = Actual Activity × PDOR]
Depr.Maint.Purch.Insp.IDMSuper.Supplies
1,0001,000 500 600 100 600 100
×××××××
$10.00$ 1.50$11.00$12.00$15.00$28.00$ 3.00
=======
$10,000 1,500 5,500 7,200 1,500 16,800 300$42,800 Applied MOH ÷ 100 Guitars = $428 each
104
J.B. Goode Company (p. 3)
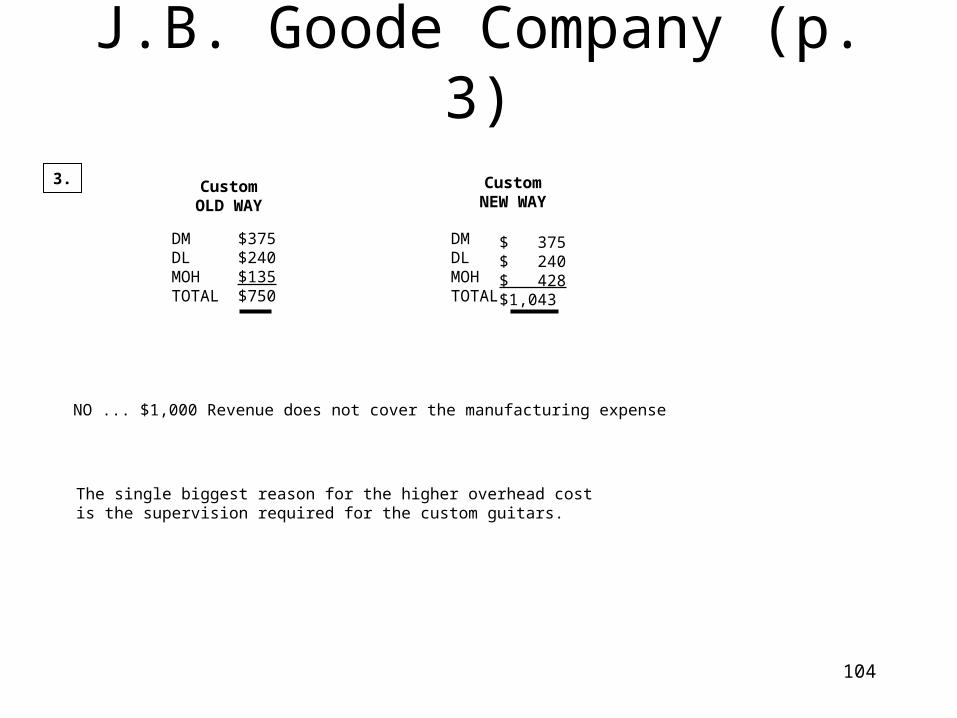
3. CustomOLD WAY
CustomNEW WAY
DMDLMOHTOTAL
DMDLMOHTOTAL
$375$240$135$750
$ 375$ 240$ 428$1,043
NO ... $1,000 Revenue does not cover the manufacturing expense
The single biggest reason for the higher overhead costis the supervision required for the custom guitars.
105
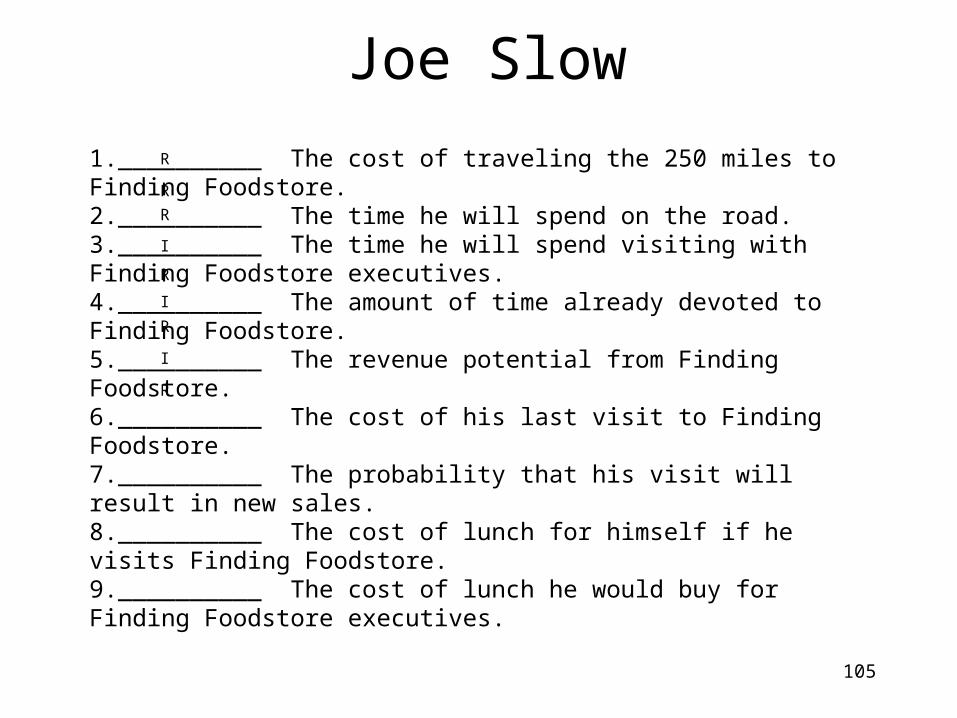
Joe Slow
R
R
R
I
R
I
R
I
R
1.__________ The cost of traveling the 250 miles to Finding Foodstore.2.__________ The time he will spend on the road.3.__________ The time he will spend visiting with Finding Foodstore executives.4.__________ The amount of time already devoted to Finding Foodstore.5.__________ The revenue potential from Finding Foodstore.6.__________ The cost of his last visit to Finding Foodstore.7.__________ The probability that his visit will result in new sales.8.__________ The cost of lunch for himself if he visits Finding Foodstore.9.__________ The cost of lunch he would buy for Finding Foodstore executives.
106
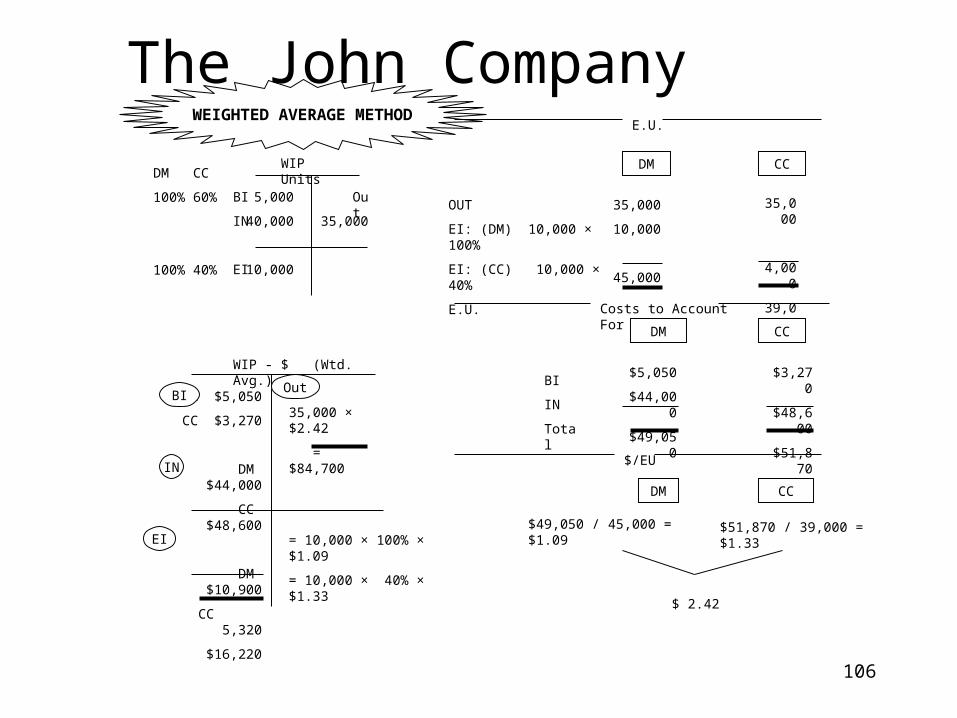
The John Company
WIP Units
5,000
40,000
10,000
35,000
OutBI
IN
EI
DM
100%
100%
CC
60%
40%
WIP - $ (Wtd. Avg.)
DM $5,050
CC $3,270
DM $44,000
CC $48,600
DM $10,900
CC 5,320
$16,220
35,000 × $2.42
= $84,700
= 10,000 × 100% × $1.09
= 10,000 × 40% × $1.33
OutBI
IN
EI
E.U.
DM CC
35,000
10,000
45,000
35,000
4,000
39,000
Costs to Account For
DM CC
$5,050
$44,000
$49,050
$3,270
$48,600
$51,870
BI
IN
Total
$/EU
DM CC
$49,050 / 45,000 = $1.09 $51,870 / 39,000 = $1.33
$ 2.42
OUT
EI: (DM) 10,000 × 100%
EI: (CC) 10,000 × 40%
E.U.
WEIGHTED AVERAGE METHOD
107
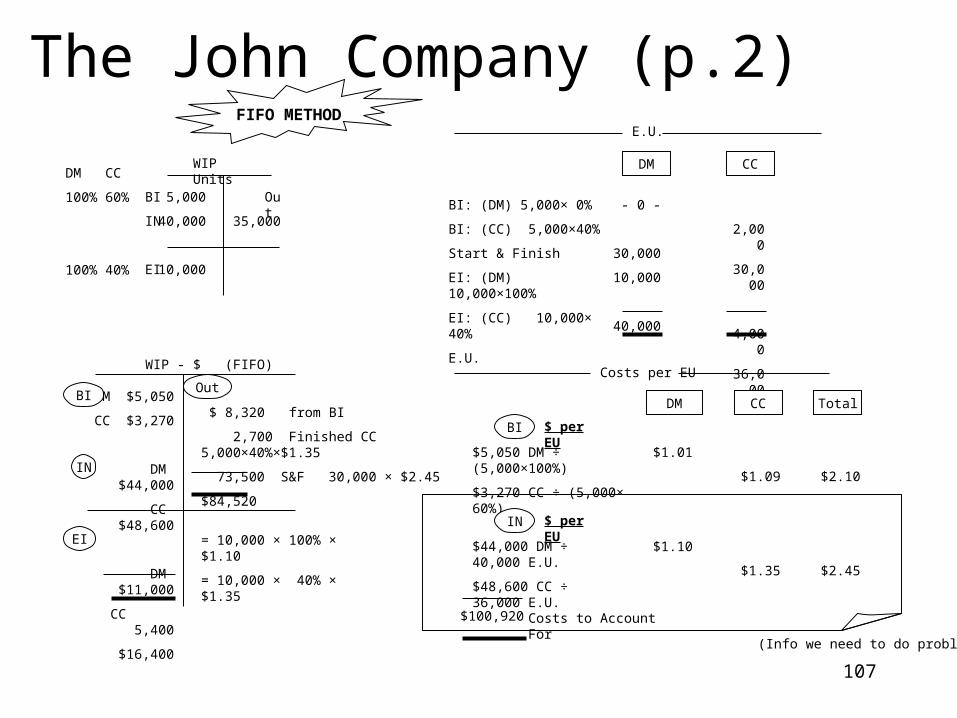
The John Company (p.2)
WIP Units
5,000
40,000
10,000
35,000
OutBI
IN
EI
DM
100%
100%
CC
60%
40%
WIP - $ (FIFO)
DM $5,050
CC $3,270
DM $44,000
CC $48,600
DM $11,000
CC 5,400
$16,400
$ 8,320 from BI
2,700 Finished CC 5,000×40%×$1.35
73,500 S&F 30,000 × $2.45
$84,520
= 10,000 × 100% × $1.10
= 10,000 × 40% × $1.35
OutBI
IN
EI
E.U.
DM CC
- 0 -
30,000
10,000
40,000
2,000
30,000
4,000
36,000
Costs per EU
DM CC
$1.01
$1.09
$ per EU
BI: (DM) 5,000× 0%
BI: (CC) 5,000×40%
Start & Finish
EI: (DM) 10,000×100%
EI: (CC) 10,000× 40%
E.U.
FIFO METHOD
BI
$5,050 DM ÷ (5,000×100%)
$3,270 CC ÷ (5,000× 60%)
Total
$2.10
$1.10
$1.35
$ per EUIN
$44,000 DM ÷ 40,000 E.U.
$48,600 CC ÷ 36,000 E.U. $2.45
(Info we need to do problem)
$100,920 Costs to Account For
108
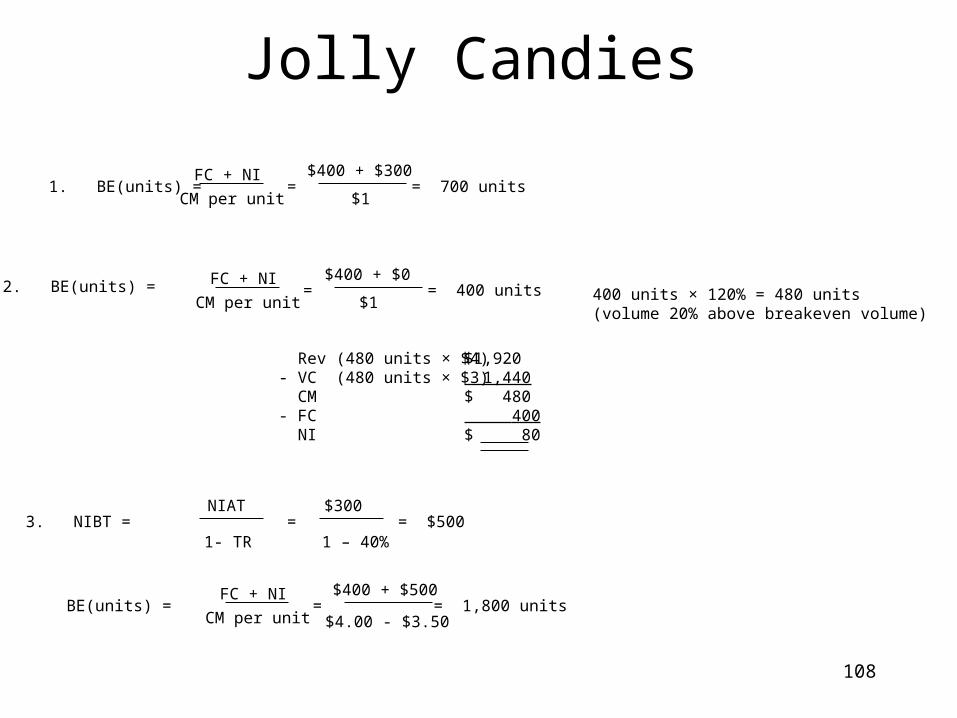
Jolly Candies
1. BE(units) =CM per unit
FC + NI=
$400 + $300
$1= 700 units
2. BE(units) =CM per unit
FC + NI=
$400 + $0
$1= 400 units 400 units × 120% = 480 units
(volume 20% above breakeven volume)
Rev (480 units × $4)- VC (480 units × $3) CM- FC NI
$1,920 1,440$ 480 400$ 80
3. NIBT = NIAT
1- TR=
$300
1 – 40%= $500
BE(units) =CM per unit
FC + NI=
$400 + $500
$4.00 - $3.50= 1,800 units
109
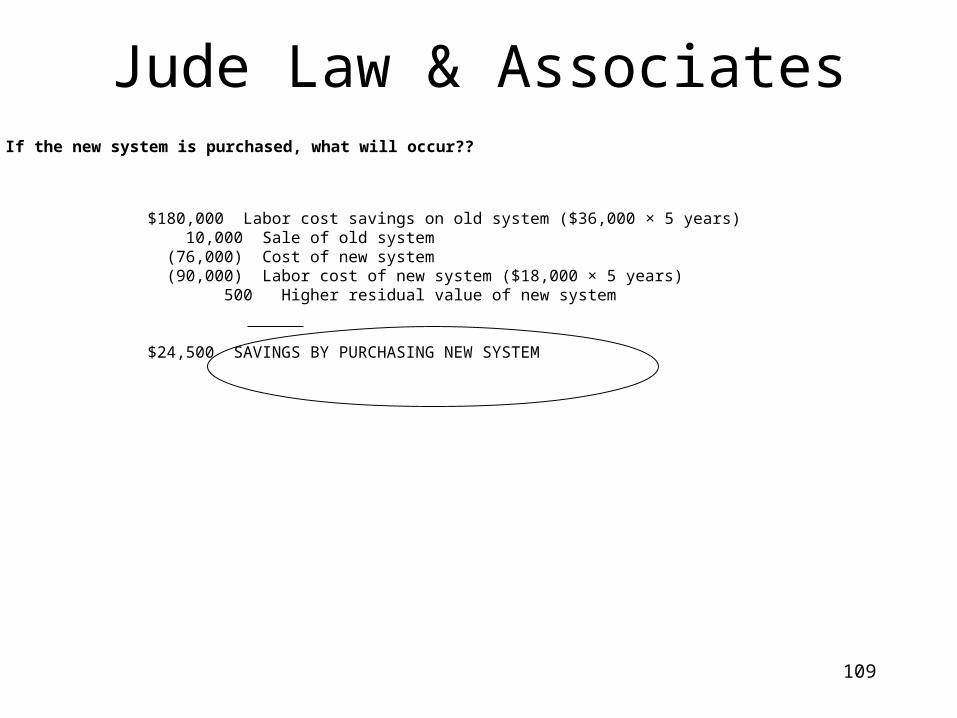
Jude Law & AssociatesIf the new system is purchased, what will occur??
$180,000 Labor cost savings on old system ($36,000 × 5 years) 10,000 Sale of old system (76,000) Cost of new system (90,000) Labor cost of new system ($18,000 × 5 years) 500 Higher residual value of new system
$24,500 SAVINGS BY PURCHASING NEW SYSTEM
110
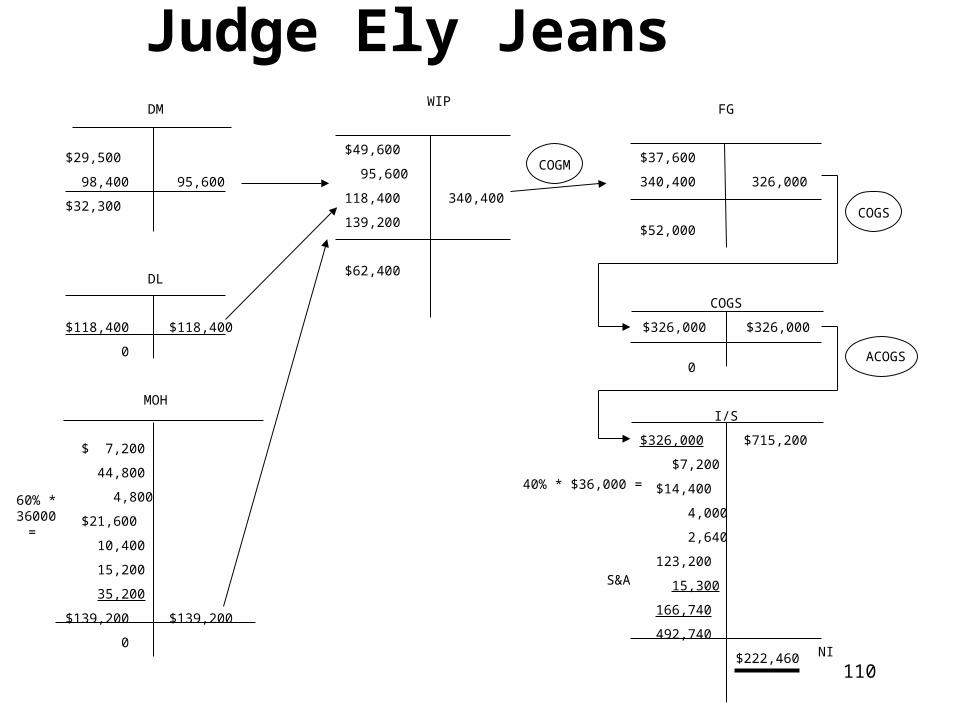
Judge Ely JeansDM
$29,500
98,400 95,600
$32,300
DL
$118,400 $118,400
0
MOH
$ 7,200
44,800
4,800
$21,600
10,400
15,200
35,200
$139,200 $139,200
0
60% * 36000 =
WIP
$49,600
95,600
118,400 340,400
139,200
$62,400
FG
$37,600
340,400 326,000
$52,000
COGS
$326,000 $326,000
0
I/S
$326,000 $715,200
$7,200
$14,400
4,000
2,640
123,200
15,300
166,740
492,740
$222,460 NI
S&A
40% * $36,000 =
COGS
ACOGS
COGM
111
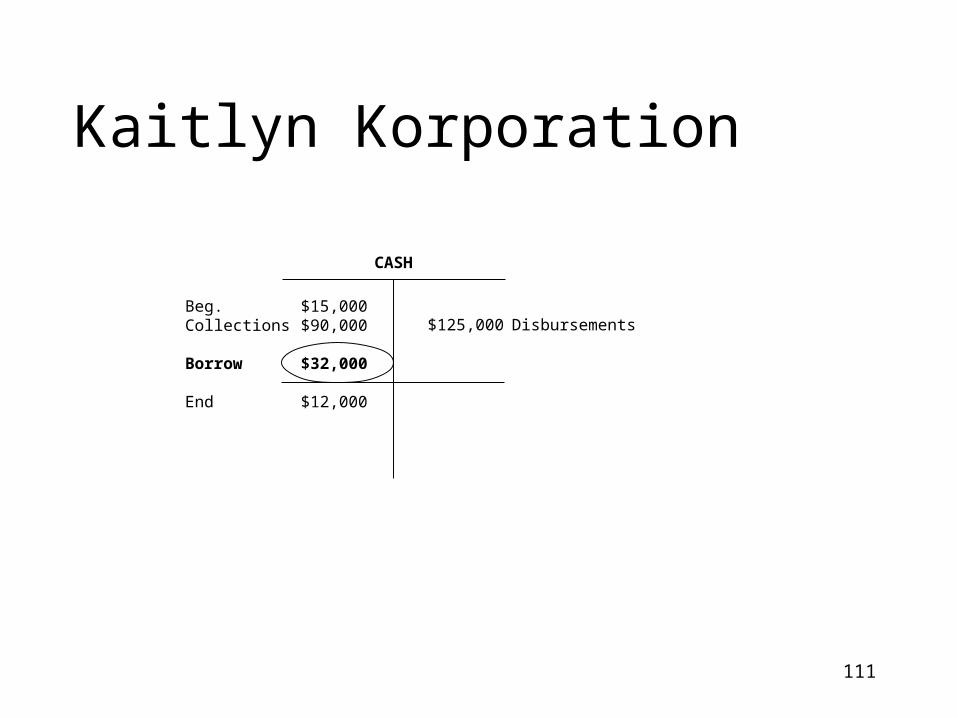
Kaitlyn Korporation
CASH
$15,000$90,000
$32,000
$12,000
$125,000Beg.Collections
Borrow
End
Disbursements
112
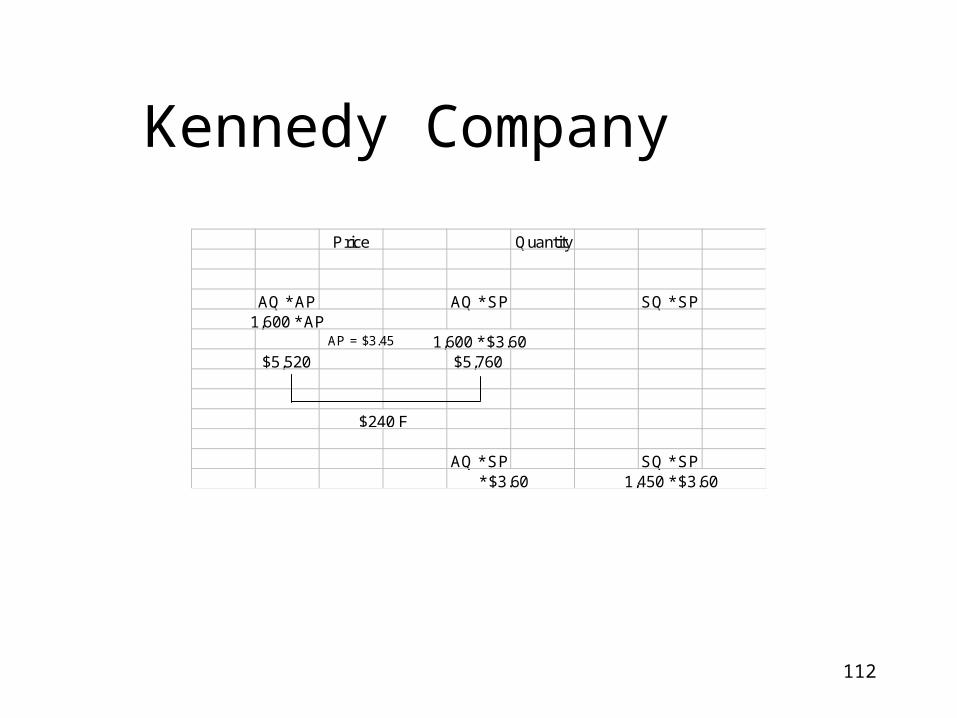
Kennedy Company
Price Quantity
AQ * AP AQ * SP SQ * SP1,600 * AP
1,600 * $3.60$5,520 $5,760
AQ * SP SQ * SP * $3.60 1,450 * $3.60
$240 F
AP = $3.45
113
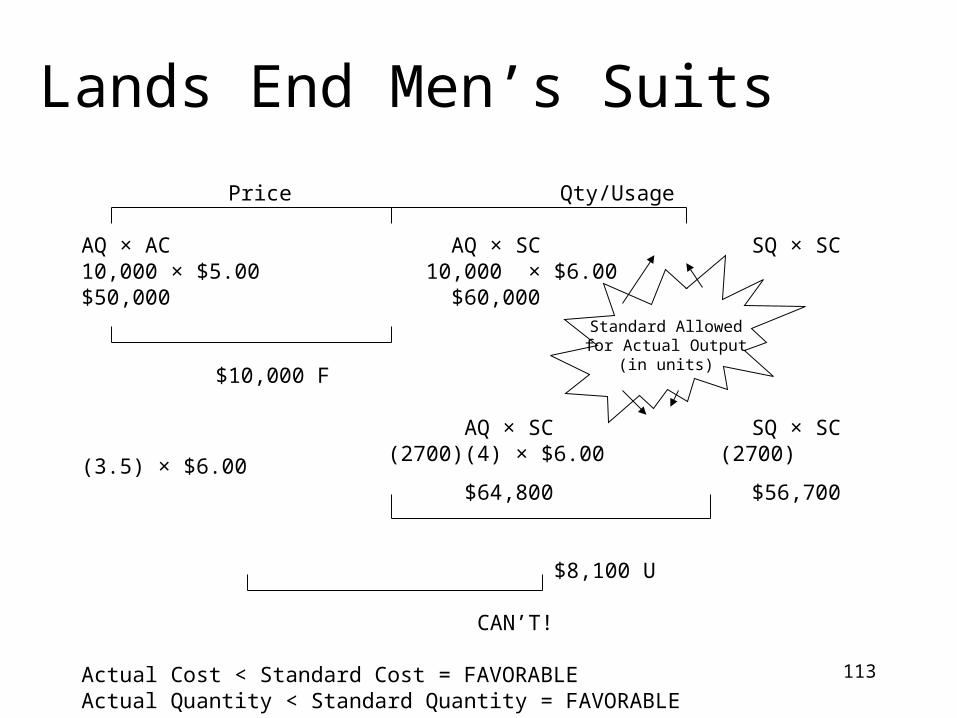
Lands End Men’s Suits Price Qty/Usage
AQ × AC AQ × SC SQ × SC10,000 × $5.00 10,000 × $6.00$50,000 $60,000
$10,000 F
AQ × SC SQ × SC (2700)(4) × $6.00 (2700)(3.5) × $6.00 $64,800 $56,700
$8,100 U
CAN’T!
Actual Cost < Standard Cost = FAVORABLEActual Quantity < Standard Quantity = FAVORABLE
Standard Allowedfor Actual Output
(in units)
114
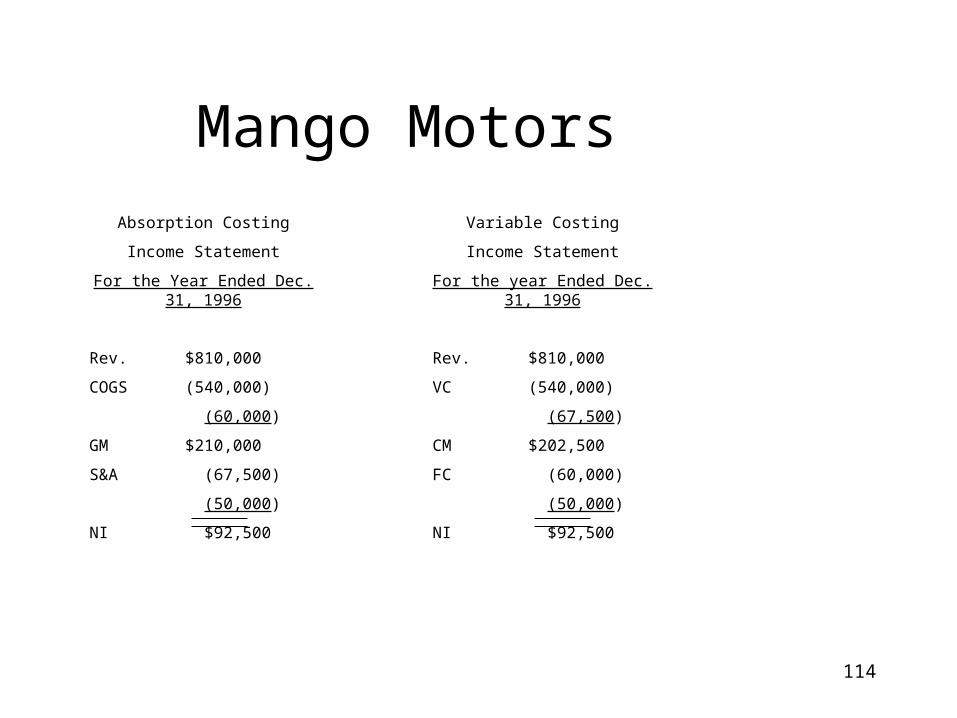
Mango Motors
Absorption Costing
Income Statement
For the Year Ended Dec. 31, 1996
Rev. $810,000
COGS (540,000)
(60,000)
GM $210,000
S&A (67,500)
(50,000)
NI $92,500
Variable Costing
Income Statement
For the year Ended Dec. 31, 1996
Rev. $810,000
VC (540,000)
(67,500)
CM $202,500
FC (60,000)
(50,000)
NI $92,500
115
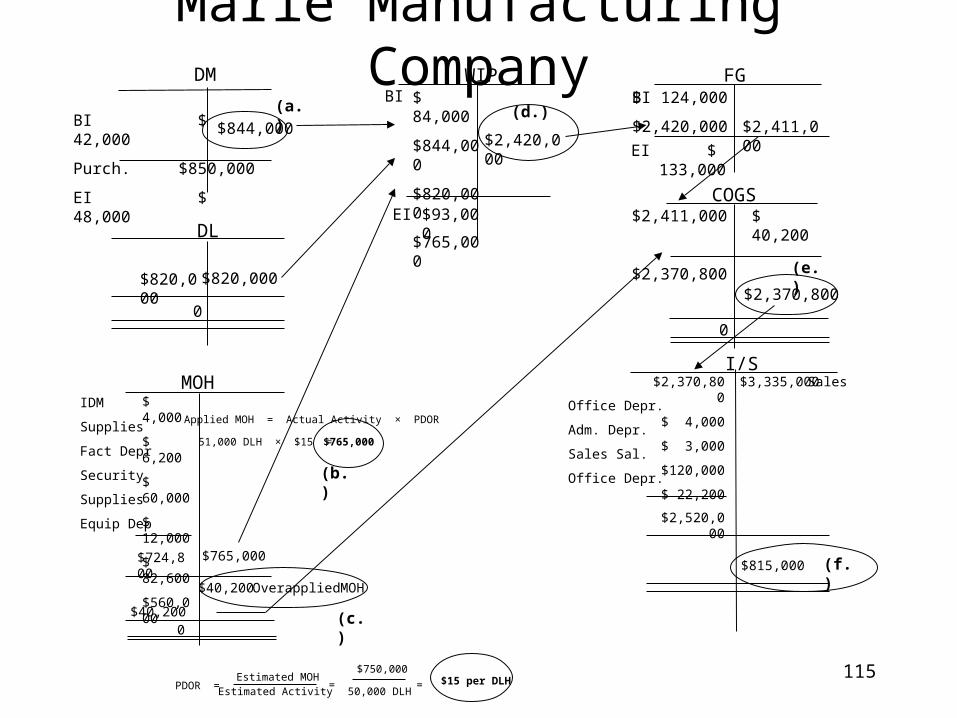
Marie Manufacturing CompanyBI $ 42,000
Purch. $850,000
EI $ 48,000
DM
(a.)
$844,000
$820,000
DL
$820,000
MOHIDM
Supplies
Fact Depr
Security
Supplies
Equip Dep
$ 4,000
$ 6,200
$ 60,000
$ 12,000
$ 82,600
$560,000
$765,000$724,800
OverappliedMOH
$40,200
$40,200
WIPBI $ 84,000
$844,000
$820,000
$765,000
$93,000EI
$2,420,000
(d.)
FG$ 124,000
$2,420,000
BI
$2,411,000
$ 133,000EI
COGS$2,411,000
$2,370,800 (e.)
$2,370,800
0
I/S
Office Depr.
Adm. Depr.
Sales Sal.
Office Depr.
$3,335,000 Sales$2,370,800
$ 4,000
$ 3,000
$120,000
$ 22,200
$2,520,000
$815,000 (f.)
0
0
PDOR = Estimated MOH
Estimated Activity=
$750,000
50,000 DLH= $15 per DLH
Applied MOH = Actual Activity × PDOR
51,000 DLH × $15 = $765,000
(b.)
(c.)
$ 40,200
116
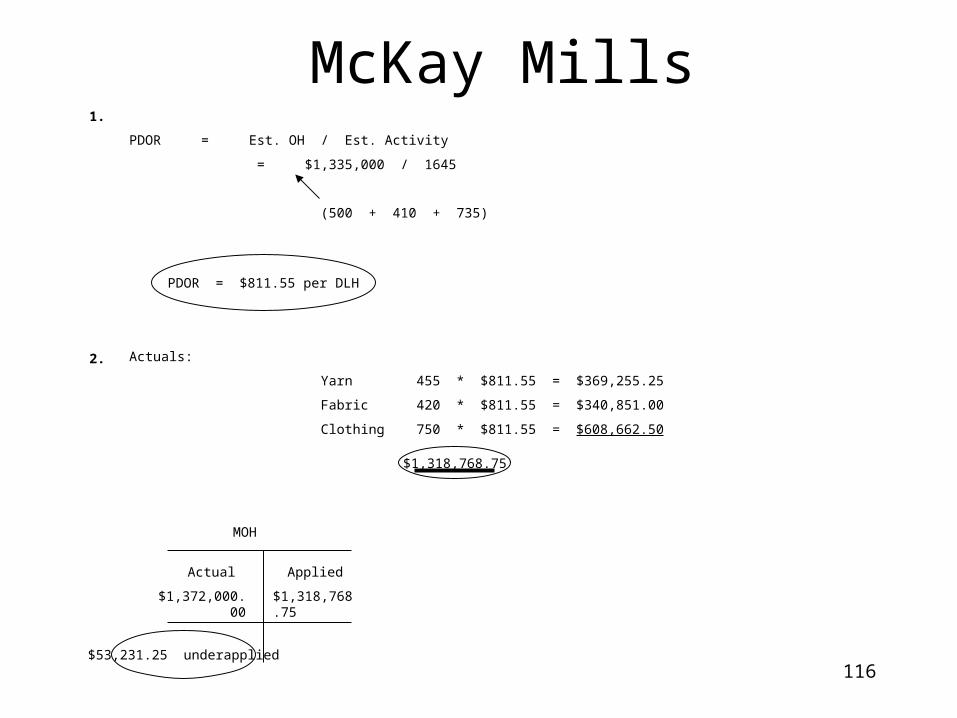
McKay Mills1.
2.
PDOR = Est. OH / Est. Activity
= $1,335,000 / 1645
(500 + 410 + 735)
PDOR = $811.55 per DLH
Actuals:
Yarn 455 * $811.55 = $369,255.25
Fabric 420 * $811.55 = $340,851.00
Clothing 750 * $811.55 = $608,662.50
$1,318,768.75
MOH
Actual
$1,372,000.00
Applied
$1,318,768.75
$53,231.25 underapplied
117
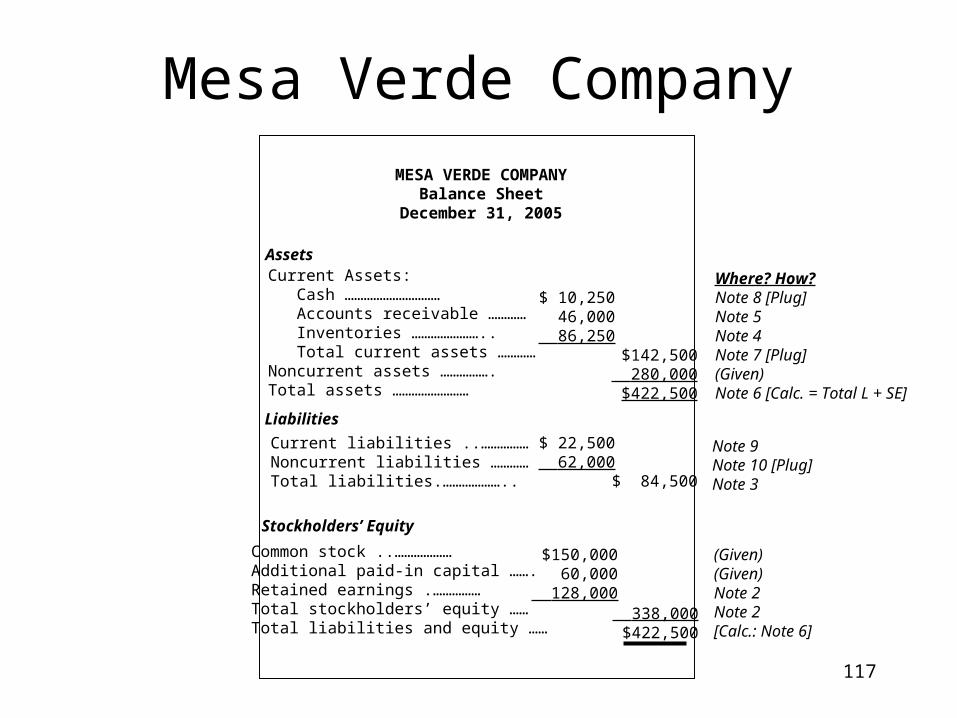
Mesa Verde Company
MESA VERDE COMPANYBalance Sheet
December 31, 2005
AssetsCurrent Assets: Cash ………………………… Accounts receivable ………… Inventories ………………….. Total current assets …………Noncurrent assets …………….Total assets ……………………
Liabilities
Stockholders’ Equity
Current liabilities ..……………Noncurrent liabilities …………Total liabilities.………………..
Common stock ..………………Additional paid-in capital …….Retained earnings .……………Total stockholders’ equity ……Total liabilities and equity ……
$ 10,25046,000
86,250
$ 22,500 62,000
$142,500 280,000$422,500
$ 84,500
$150,00060,000
128,000 338,000
$422,500
Where? How?Note 8 [Plug]Note 5Note 4Note 7 [Plug](Given)Note 6 [Calc. = Total L + SE]
Note 9Note 10 [Plug]Note 3
(Given)(Given)Note 2Note 2[Calc.: Note 6]
118
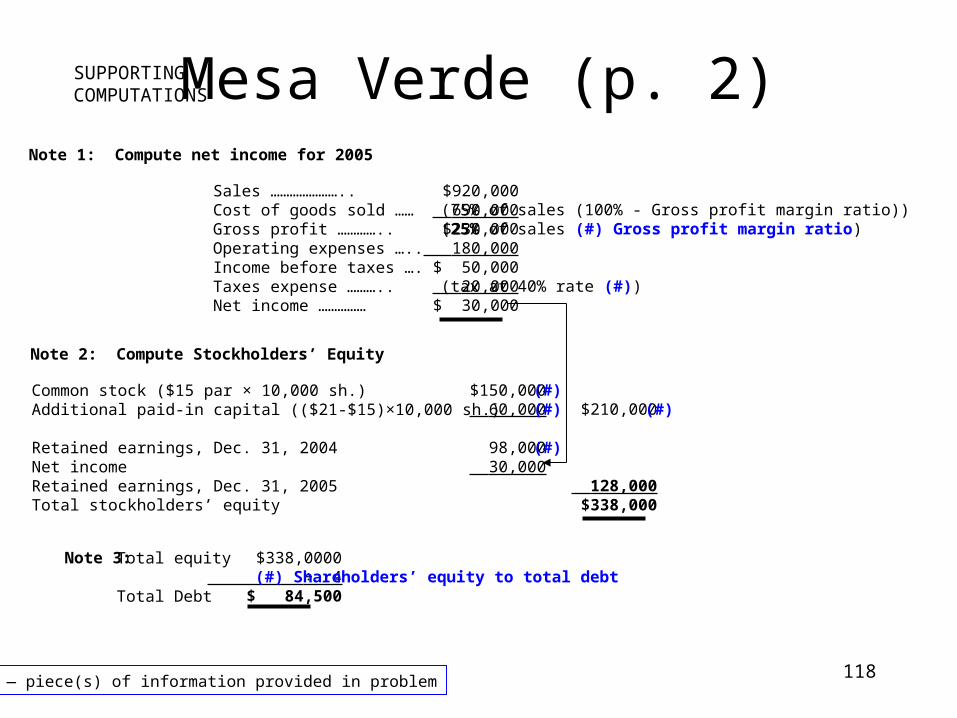
Mesa Verde (p. 2)SUPPORTINGCOMPUTATIONS
Note 1: Compute net income for 2005
Sales …………………..Cost of goods sold ……Gross profit …………..Operating expenses …..Income before taxes ….Taxes expense ………..Net income ……………
$920,000 690,000$230,000
180,000$ 50,000 20,000
$ 30,000
(75% of sales (100% - Gross profit margin ratio))(25% of sales (#) Gross profit margin ratio)
(tax at 40% rate (#))
Note 2: Compute Stockholders’ Equity
Common stock ($15 par × 10,000 sh.)Additional paid-in capital (($21-$15)×10,000 sh.)
Retained earnings, Dec. 31, 2004Net incomeRetained earnings, Dec. 31, 2005Total stockholders’ equity
$150,000 60,000
98,000 30,000
(#) — piece(s) of information provided in problem
$210,000
128,000$338,000
(#)(#)
(#)
(#)
Note 3: Total equity
Total Debt
$338,0000 ÷ 4$ 84,500
(#) Shareholders’ equity to total debt
119
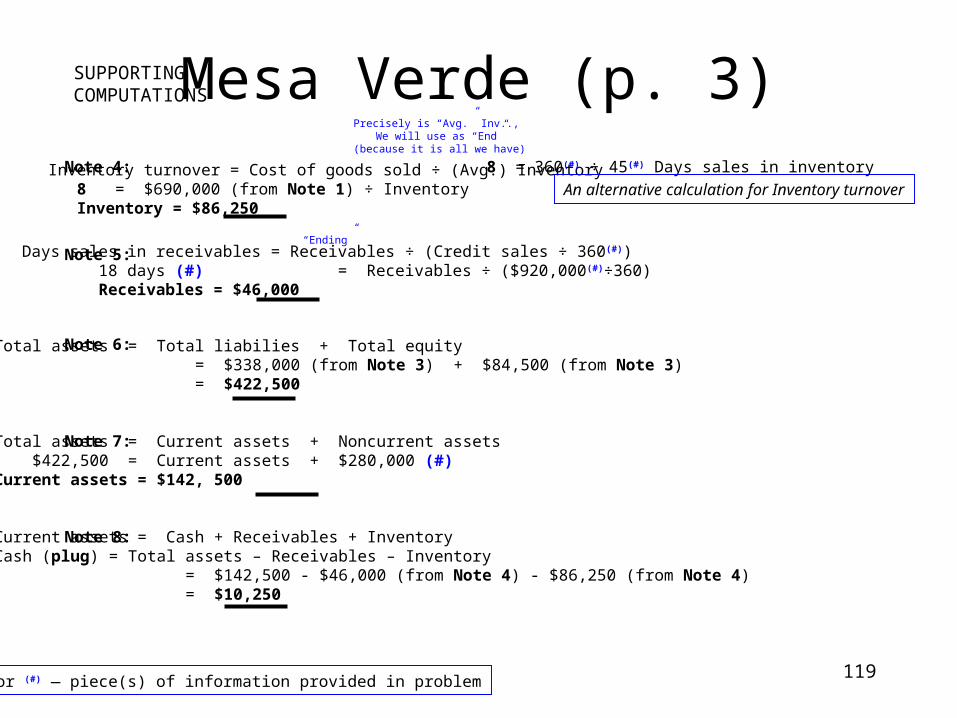
Mesa Verde (p. 3)SUPPORTINGCOMPUTATIONS
Note 4: Inventory turnover = Cost of goods sold ÷ (Avg.) Inventory 8 = $690,000 (from Note 1) ÷ Inventory Inventory = $86,250
(#) or (#) — piece(s) of information provided in problem
Precisely is “Avg.” Inv.., We will use as “End”
(because it is all we have)
8 = 360(#) ÷ 45(#) Days sales in inventory
An alternative calculation for Inventory turnover
Days sales in receivables = Receivables ÷ (Credit sales ÷ 360(#)) 18 days (#) = Receivables ÷ ($920,000(#)÷360) Receivables = $46,000
“Ending”
Note 6: Total assets = Total liabilies + Total equity = $338,000 (from Note 3) + $84,500 (from Note 3) = $422,500
Total assets = Current assets + Noncurrent assets $422,500 = Current assets + $280,000 (#)Current assets = $142, 500
Current assets = Cash + Receivables + InventoryCash (plug) = Total assets – Receivables – Inventory = $142,500 - $46,000 (from Note 4) - $86,250 (from Note 4) = $10,250
Note 5:
Note 7:
Note 8:
120
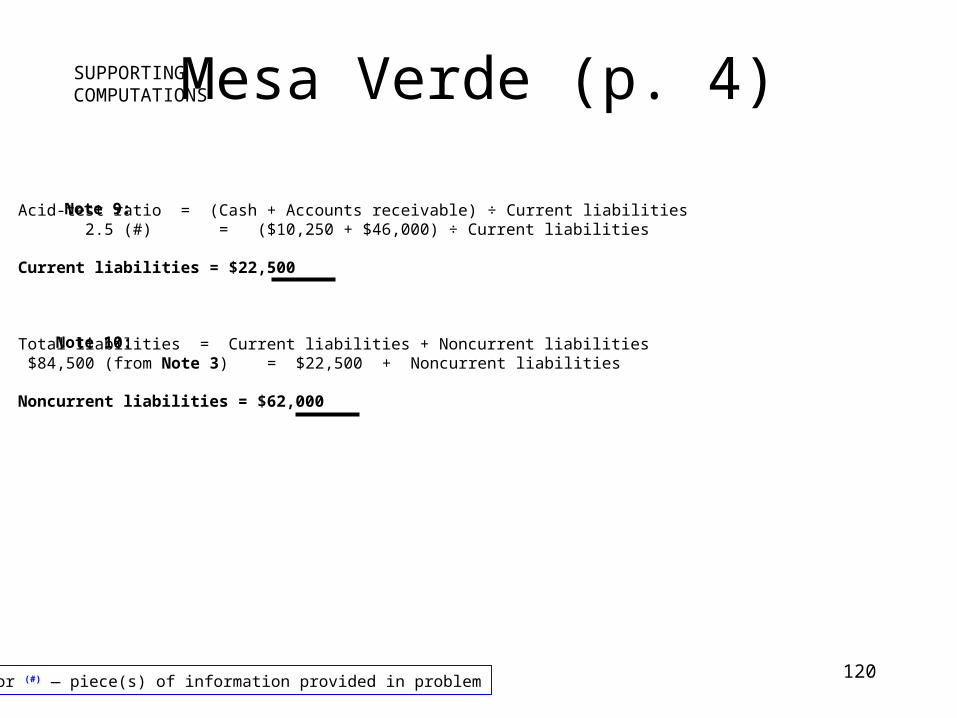
Mesa Verde (p. 4)SUPPORTINGCOMPUTATIONS
(#) or (#) — piece(s) of information provided in problem
Note 9: Acid-test ratio = (Cash + Accounts receivable) ÷ Current liabilities 2.5 (#) = ($10,250 + $46,000) ÷ Current liabilities
Current liabilities = $22,500
Total liabilities = Current liabilities + Noncurrent liabilities $84,500 (from Note 3) = $22,500 + Noncurrent liabilities
Noncurrent liabilities = $62,000
Note 10:
121
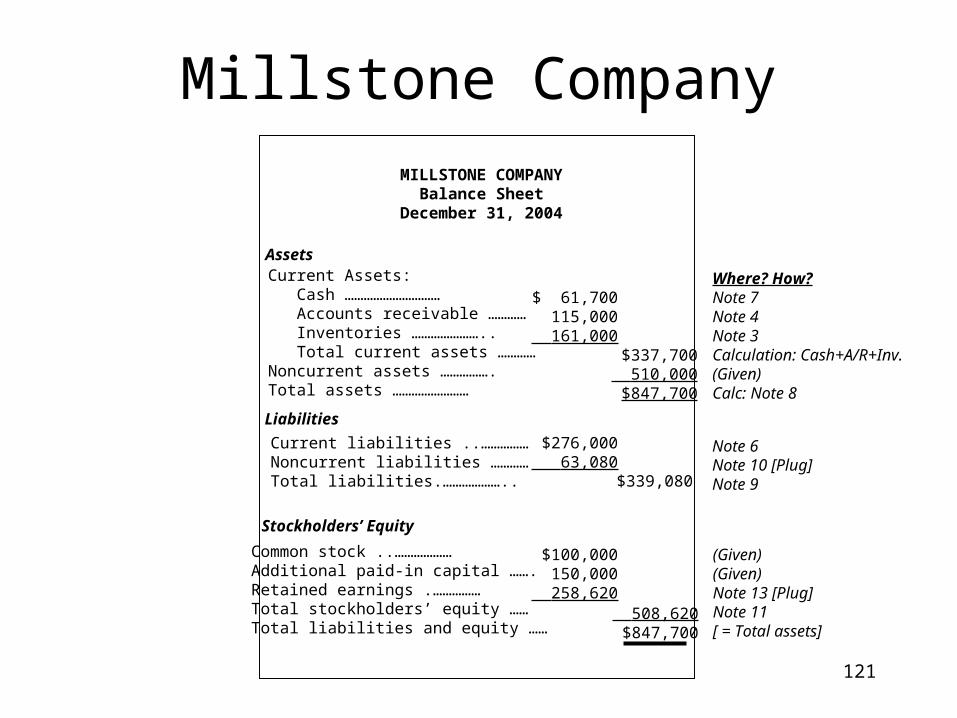
Millstone Company
MILLSTONE COMPANYBalance Sheet
December 31, 2004
AssetsCurrent Assets: Cash ………………………… Accounts receivable ………… Inventories ………………….. Total current assets …………Noncurrent assets …………….Total assets ……………………
Liabilities
Stockholders’ Equity
Current liabilities ..……………Noncurrent liabilities …………Total liabilities.………………..
Common stock ..………………Additional paid-in capital …….Retained earnings .……………Total stockholders’ equity ……Total liabilities and equity ……
$ 61,700115,000
161,000
$276,000 63,080
$337,700 510,000$847,700
$339,080
$100,000150,000
258,620 508,620
$847,700
Where? How?Note 7Note 4Note 3Calculation: Cash+A/R+Inv.(Given)Calc: Note 8
Note 6Note 10 [Plug]Note 9
(Given)(Given)Note 13 [Plug]Note 11[ = Total assets]
122
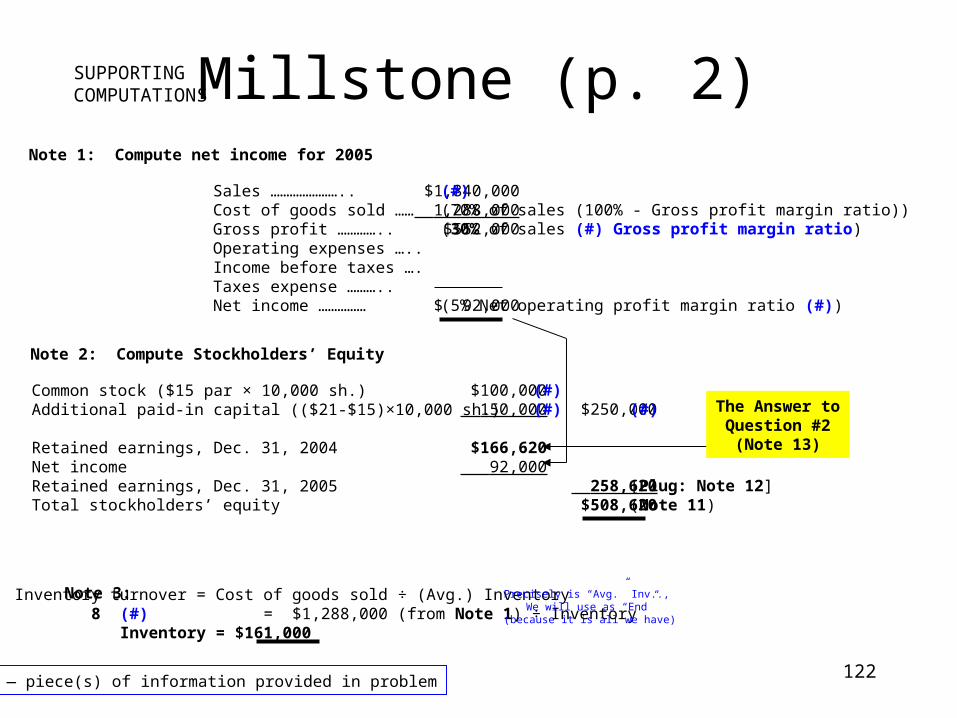
Millstone (p. 2)SUPPORTINGCOMPUTATIONS
Note 1: Compute net income for 2005
Sales …………………..Cost of goods sold ……Gross profit …………..Operating expenses …..Income before taxes ….Taxes expense ………..Net income ……………
$1,840,000 1,288,000
$552,000
$ 92,000
(#)(70% of sales (100% - Gross profit margin ratio))(30% of sales (#) Gross profit margin ratio)
(5% Net operating profit margin ratio (#))
Note 2: Compute Stockholders’ Equity
Common stock ($15 par × 10,000 sh.)Additional paid-in capital (($21-$15)×10,000 sh.)
Retained earnings, Dec. 31, 2004Net incomeRetained earnings, Dec. 31, 2005Total stockholders’ equity
$100,000 150,000
$166,620 92,000
(#) — piece(s) of information provided in problem
$250,000
258,620$508,620
(#)(#) (#)
[Plug: Note 12](Note 11)
The Answer toQuestion #2
(Note 13)
Note 3: Inventory turnover = Cost of goods sold ÷ (Avg.) Inventory 8 (#) = $1,288,000 (from Note 1) ÷ Inventory Inventory = $161,000
Precisely is “Avg.” Inv.., We will use as “End”
(because it is all we have)
123
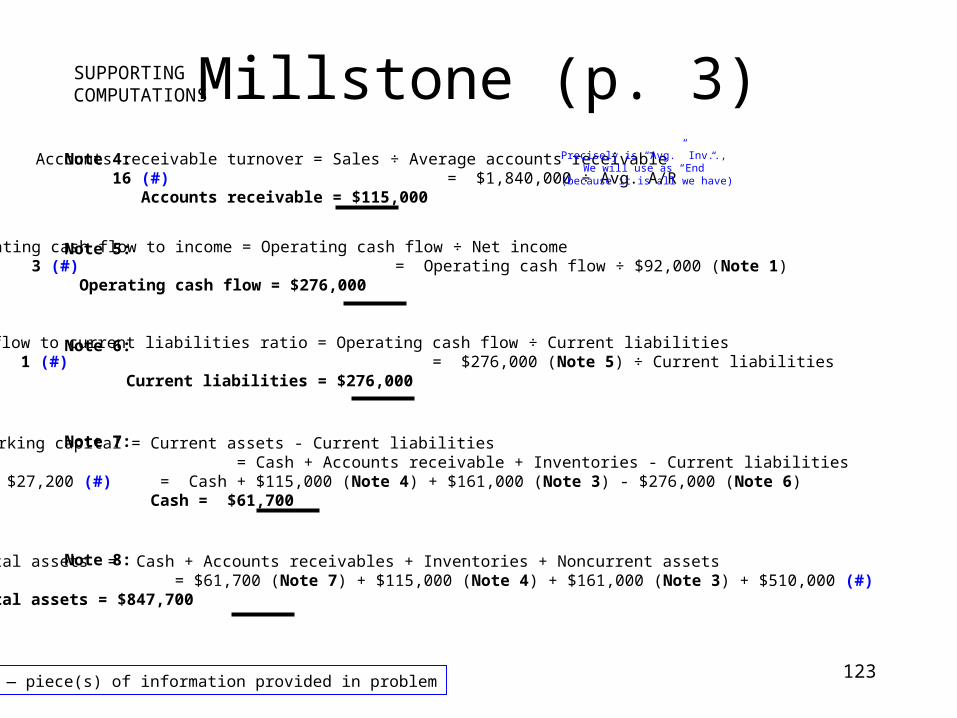
Millstone (p. 3)SUPPORTINGCOMPUTATIONS
(#) — piece(s) of information provided in problem
Accounts receivable turnover = Sales ÷ Average accounts receivable 16 (#) = $1,840,000 ÷ Avg. A/R Accounts receivable = $115,000
Note 5:
Working capital = Current assets - Current liabilities = Cash + Accounts receivable + Inventories - Current liabilities $27,200 (#) = Cash + $115,000 (Note 4) + $161,000 (Note 3) - $276,000 (Note 6) Cash = $61,700
Note 4:
Note 6:
Note 7:
Precisely is “Avg.” Inv.., We will use as “End”
(because it is all we have)
Operating cash flow to income = Operating cash flow ÷ Net income 3 (#) = Operating cash flow ÷ $92,000 (Note 1) Operating cash flow = $276,000
Cash flow to current liabilities ratio = Operating cash flow ÷ Current liabilities 1 (#) = $276,000 (Note 5) ÷ Current liabilities Current liabilities = $276,000
Note 8: Total assets = Cash + Accounts receivables + Inventories + Noncurrent assets = $61,700 (Note 7) + $115,000 (Note 4) + $161,000 (Note 3) + $510,000 (#)Total assets = $847,700
124
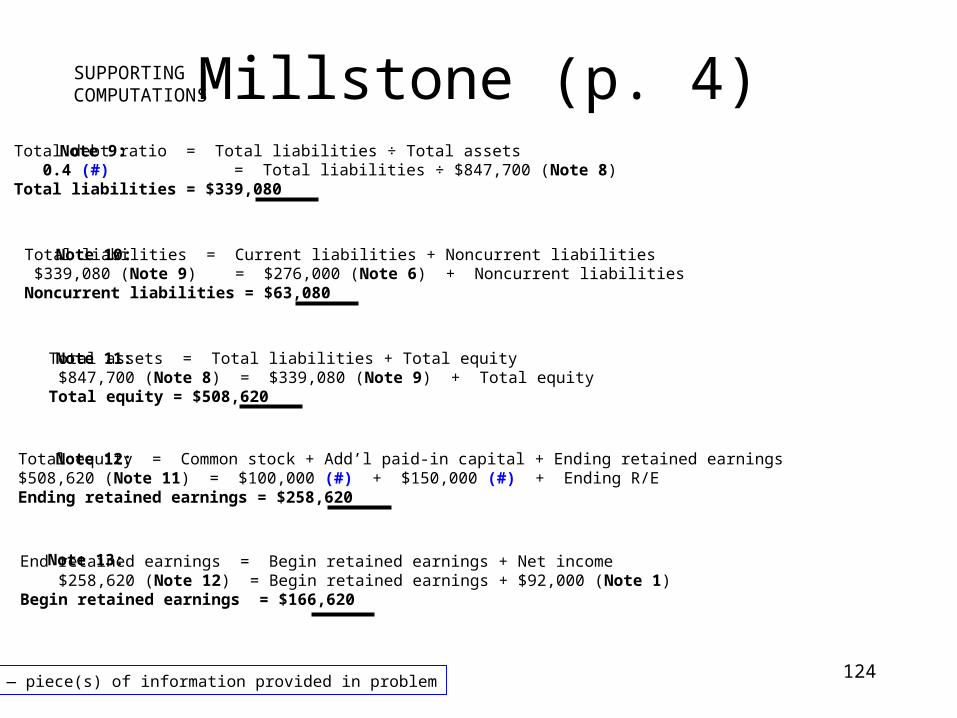
Total debt ratio = Total liabilities ÷ Total assets 0.4 (#) = Total liabilities ÷ $847,700 (Note 8)Total liabilities = $339,080
Millstone (p. 4)SUPPORTINGCOMPUTATIONS
(#) — piece(s) of information provided in problem
Note 9:
Note 10: Total liabilities = Current liabilities + Noncurrent liabilities $339,080 (Note 9) = $276,000 (Note 6) + Noncurrent liabilitiesNoncurrent liabilities = $63,080
Note 11: Total assets = Total liabilities + Total equity $847,700 (Note 8) = $339,080 (Note 9) + Total equityTotal equity = $508,620
Note 12: Total equity = Common stock + Add’l paid-in capital + Ending retained earnings$508,620 (Note 11) = $100,000 (#) + $150,000 (#) + Ending R/EEnding retained earnings = $258,620
Note 13: End retained earnings = Begin retained earnings + Net income $258,620 (Note 12) = Begin retained earnings + $92,000 (Note 1) Begin retained earnings = $166,620
125
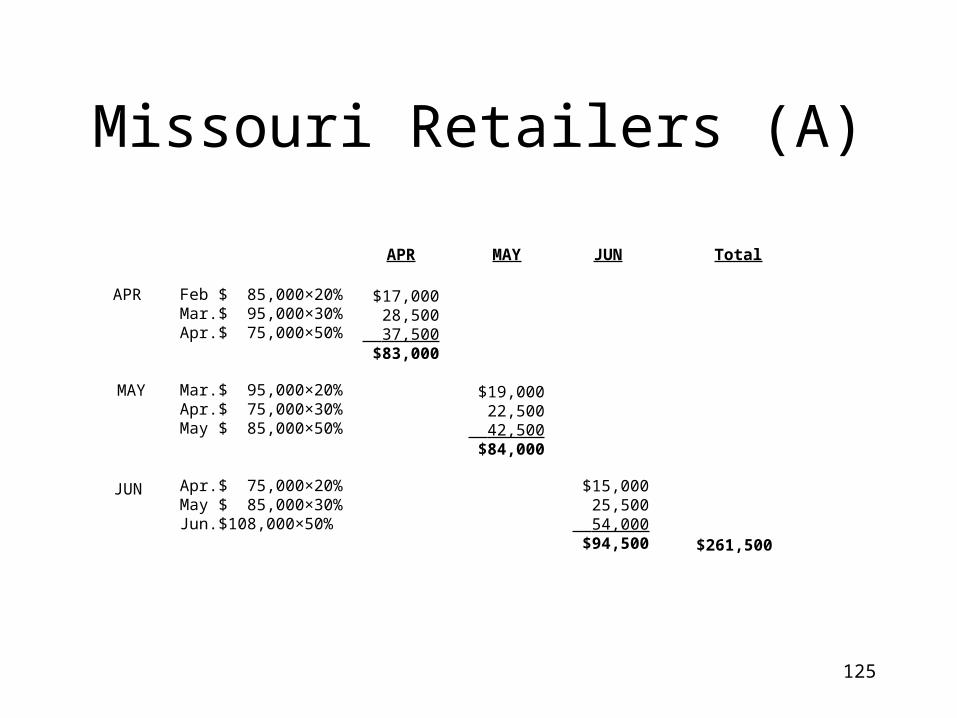
Missouri Retailers (A)
APR
MAY
JUN
FebMar.Apr.
Mar.Apr.May
Apr.MayJun.
$ 85,000×20%$ 95,000×30%$ 75,000×50%
$ 95,000×20%$ 75,000×30%$ 85,000×50%
$ 75,000×20%$ 85,000×30%$108,000×50%
$17,00028,500
37,500$83,000
$19,00022,500
42,500$84,000
$15,00025,500
54,000$94,500
APR MAY JUN Total
$261,500
126
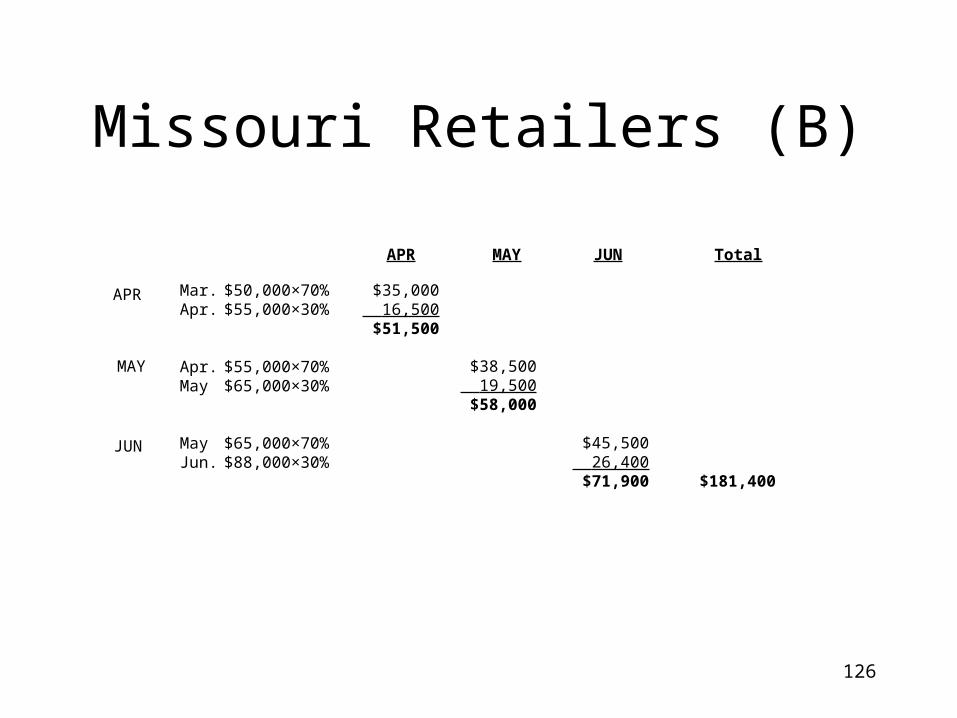
Missouri Retailers (B)
Mar.Apr.
Apr.May
MayJun.
$50,000×70%$55,000×30%
$55,000×70%$65,000×30%
$65,000×70%$88,000×30%
$35,000 16,500$51,500
$38,500 19,500$58,000
$45,500 26,400$71,900
Total
$181,400
APR
MAY
JUN
APR MAY JUN
127
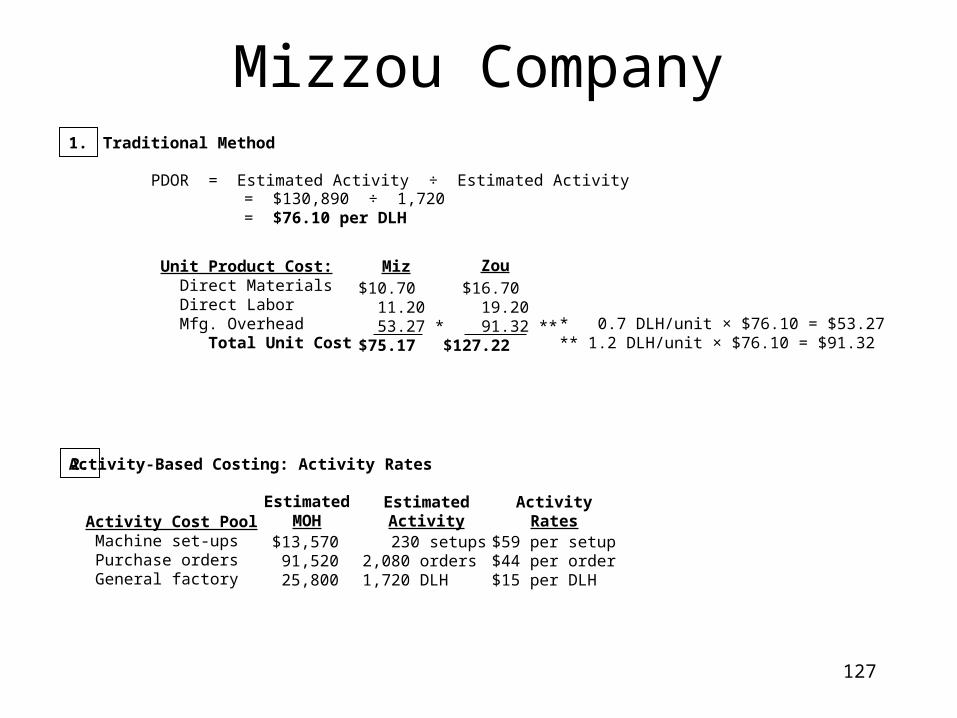
Mizzou Company1.
PDOR = Estimated Activity ÷ Estimated Activity= $130,890 ÷ 1,720= $76.10 per DLH
Unit Product Cost: Direct Materials Direct Labor Mfg. Overhead Total Unit Cost
Miz Zou
$10.70 11.20 53.27 *$75.17
$16.70 19.20 91.32 **$127.22
* 0.7 DLH/unit × $76.10 = $53.27** 1.2 DLH/unit × $76.10 = $91.32
2. Activity-Based Costing: Activity Rates
Activity Cost Pool Machine set-ups Purchase orders General factory
EstimatedMOH
EstimatedActivity
ActivityRates
$13,57091,52025,800
230 setups2,080 orders1,720 DLH
$59 per setup$44 per order$15 per DLH
Traditional Method
128
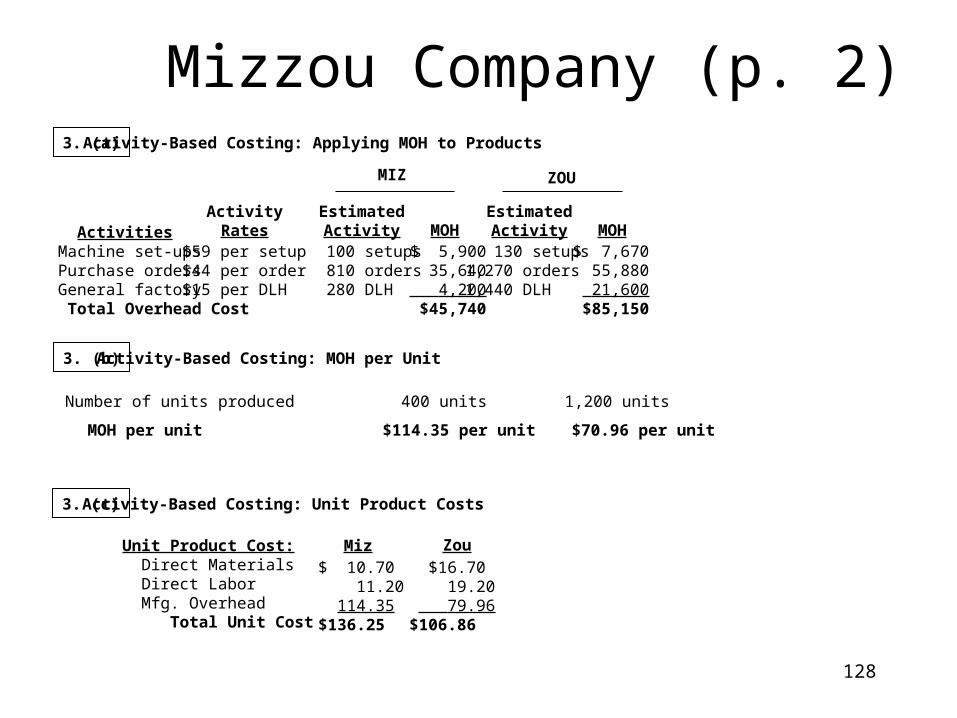
Mizzou Company (p. 2)
Activities Machine set-ups Purchase orders General factory Total Overhead Cost
3. (a)
ActivityRates
$59 per setup$44 per order$15 per DLH
EstimatedActivity
100 setups 810 orders 280 DLH
MOH$ 5,900
35,640 4,200$45,740
EstimatedActivity
130 setups1,270 orders1,440 DLH
MOH$ 7,670
55,880 21,600$85,150
MIZ ZOU
Activity-Based Costing: Applying MOH to Products
3. (b) Activity-Based Costing: MOH per Unit
Number of units produced 400 units 1,200 units
MOH per unit $114.35 per unit $70.96 per unit
Unit Product Cost: Direct Materials Direct Labor Mfg. Overhead Total Unit Cost
Miz Zou
$ 10.70 11.20 114.35$136.25
$16.70 19.20 79.96$106.86
3. (c) Activity-Based Costing: Unit Product Costs
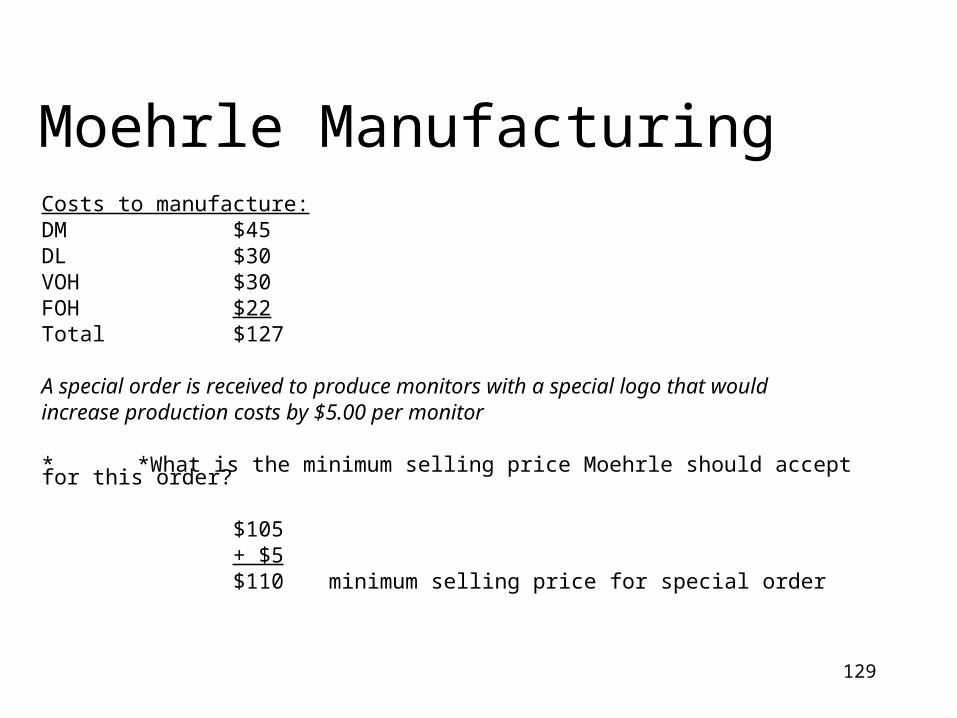
129
Moehrle ManufacturingCosts to manufacture:DM $45DL $30VOH $30FOH $22Total $127 A special order is received to produce monitors with a special logo that would increase production costs by $5.00 per monitor * *What is the minimum selling price Moehrle should accept for this order?
$105+ $5$110 minimum selling price for special order
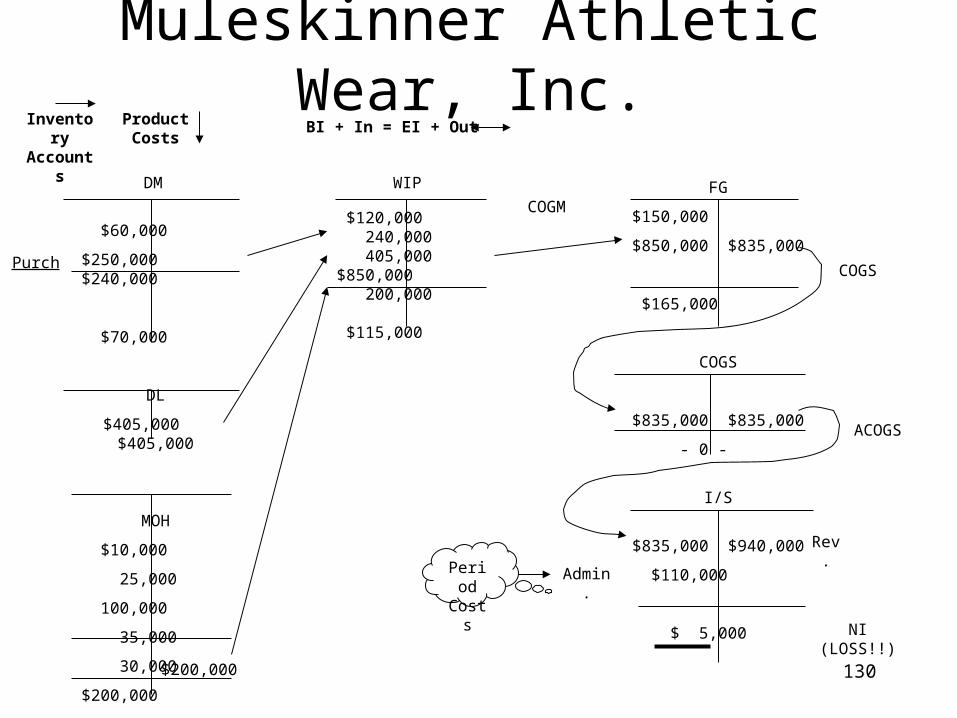
130
$60,000
$250,000 $240,000
$70,000
DL
$405,000 $405,000
MOH
$10,000
25,000
100,000
35,000
30,000
$200,000
- 0 -
Purch
Inventory Accounts
Product Costs
$120,000 240,000 405,000 $850,000 200,000
$115,000
FG
$150,000
$850,000 $835,000
$165,000
COGS
$835,000 $835,000
- 0 -
I/S
$835,000 $940,000
$110,000
$ 5,000
COGS
ACOGS
COGM
NI (LOSS!!)
Rev.
Admin.
BI + In = EI + Out
PeriodCosts
$200,000
DM WIP
Muleskinner Athletic Wear, Inc.
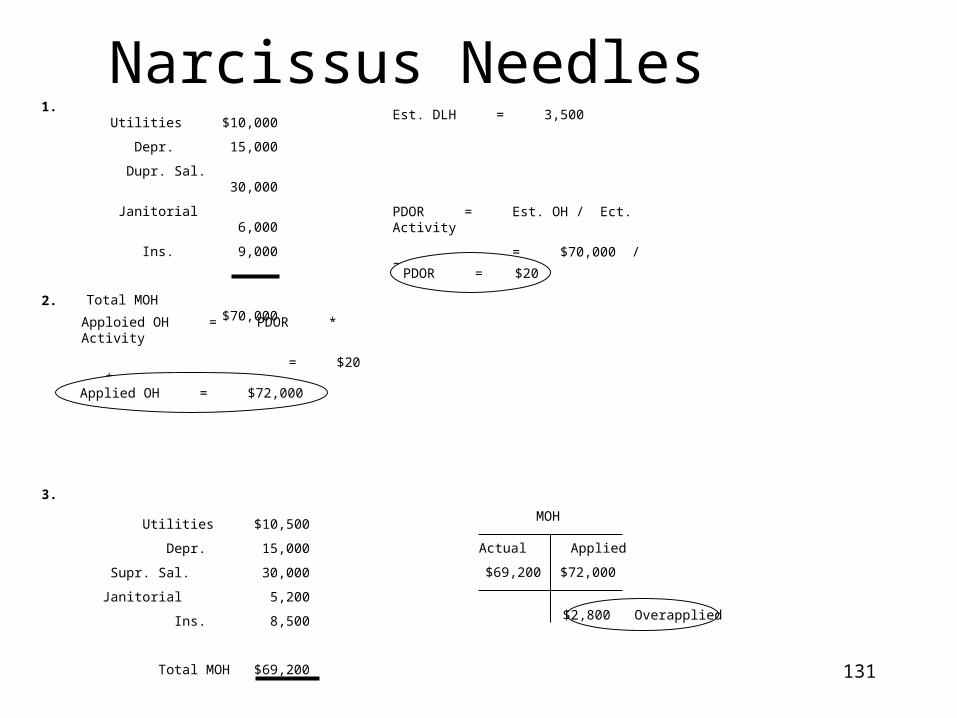
131
Narcissus Needles1.
2.
3.
Utilities $10,000
Depr. 15,000
Dupr. Sal. 30,000
Janitorial 6,000
Ins. 9,000
Total MOH $70,000
Est. DLH = 3,500
PDOR = Est. OH / Ect. Activity
= $70,000 / 3,500
PDOR = $20
Apploied OH = PDOR * Activity
= $20 * 3,600 DLH
Applied OH = $72,000
Utilities $10,500
Depr. 15,000
Supr. Sal. 30,000
Janitorial 5,200
Ins. 8,500
Total MOH $69,200
Actual
$69,200
Applied
$72,000
MOH
$2,800 Overapplied
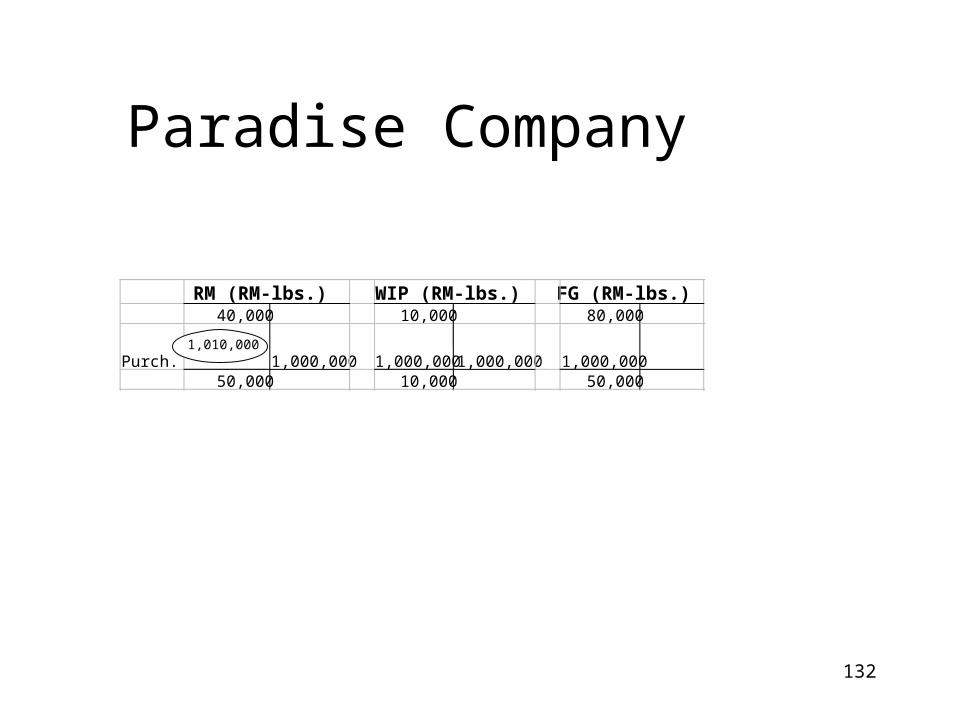
132
Paradise Company
40,000 10,000 80,000
Purch. 1,000,000 1,000,000 1,000,000 1,000,00050,000 10,000 50,000
RM (RM-lbs.) WIP (RM-lbs.) FG (RM-lbs.)
1,010,000
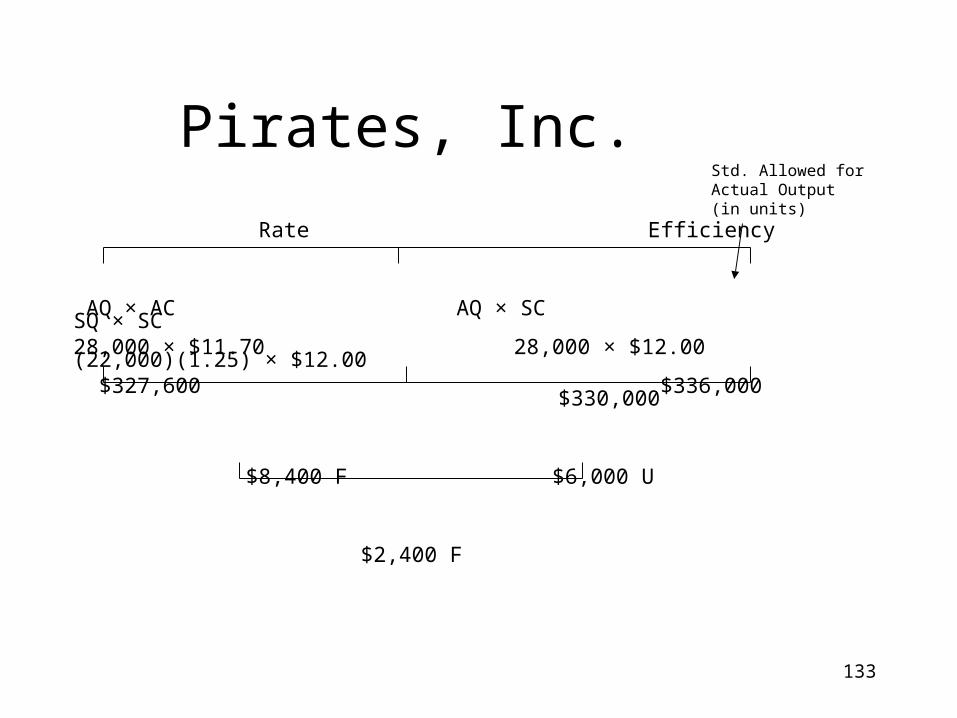
133
Pirates, Inc.
Rate Efficiency
AQ × AC AQ × SC SQ × SC28,000 × $11.70 28,000 × $12.00 (22,000)(1.25) × $12.00 $327,600 $336,000 $330,000
$8,400 F $6,000 U
$2,400 F
Std. Allowed forActual Output(in units)
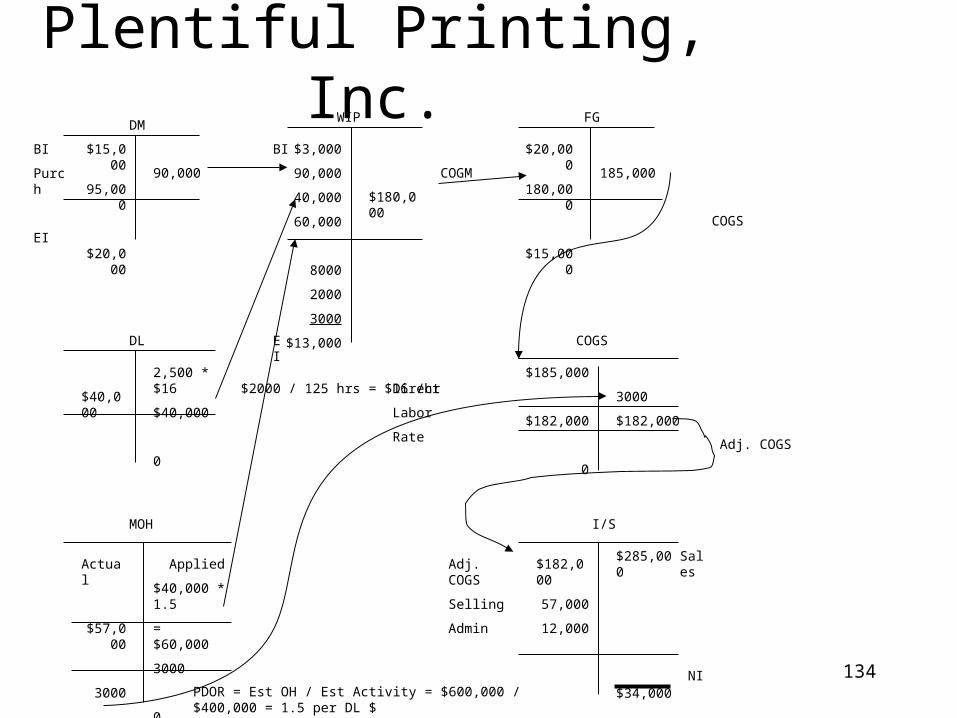
134
Plentiful Printing, Inc.$15,000
95,000
$20,000
90,000
DM
$3,000
90,000
40,000
60,000
8000
2000
3000
$13,000
$180,000
WIP
$20,000
180,000
$15,000
185,000
FG
$40,000
2,500 * $16
$40,000
0
DL
Actual
$57,000
3000
Applied
$40,000 * 1.5
= $60,000
3000
0
MOH
$185,000
$182,000
0
3000
$182,000
COGS
$182,000
57,000
12,000
$285,000
$34,000
I/S
PDOR = Est OH / Est Activity = $600,000 / $400,000 = 1.5 per DL $
$2000 / 125 hrs = $16 /hr Direct
Labor
Rate
BI
Purch
EI
BI
EI
Adj. COGS
Selling
Admin
Sales
NI
COGM
COGS
Adj. COGS
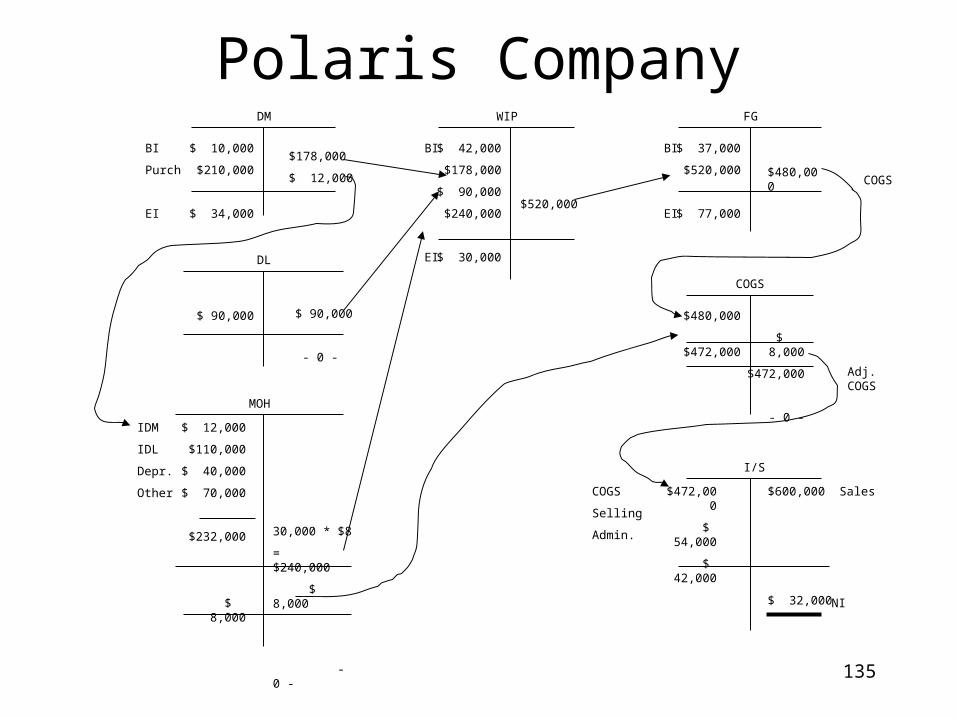
135
Polaris Company$ 10,000
$210,000
$ 34,000
$178,000
$ 12,000
DM
BI
Purch
EI
$ 42,000
$178,000
$ 90,000
$240,000
$ 30,000
$520,000
BI
EI
WIP
$ 37,000
$520,000
$ 77,000
$480,000
BI
EI
FG
$ 90,000 $ 90,000
- 0 -
DL
MOH
$ 12,000
$110,000
$ 40,000
$ 70,000
$232,000 30,000 * $8
= $240,000
$ 8,000
- 0 -
IDM
IDL
Depr.
Other
COGS
I/S
$472,000
$ 54,000
$ 42,000
$600,000
$ 32,000
COGS
Selling
Admin.
Sales
NI$ 8,000
$480,000
$472,000
Adj. COGS
COGS
$ 8,000
$472,000
- 0 -
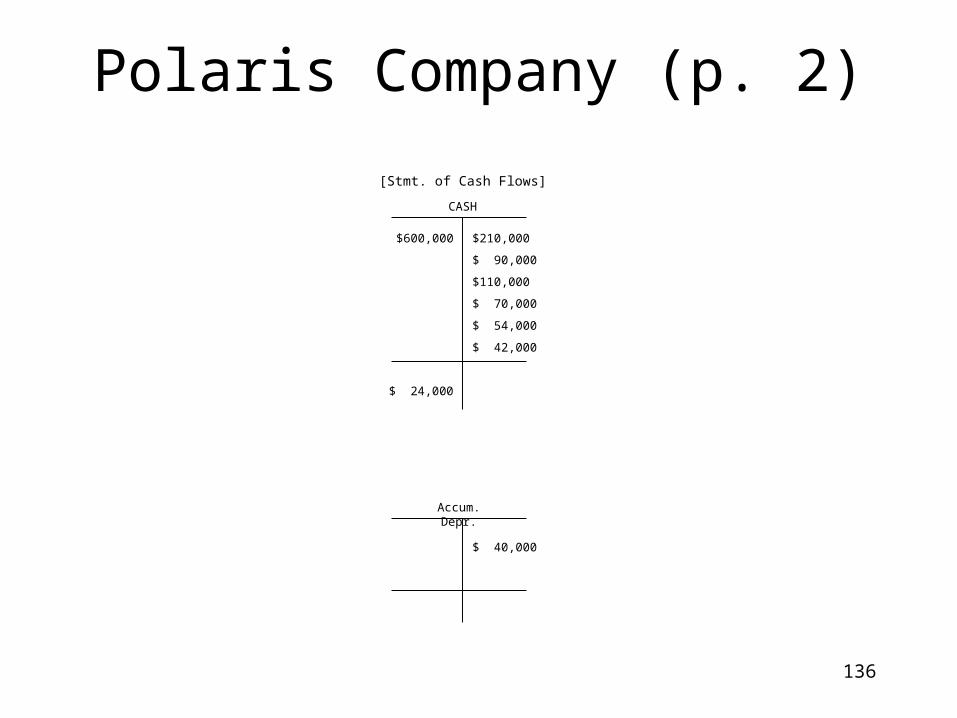
136
Polaris Company (p. 2)
$600,000
$ 24,000
$210,000
$ 90,000
$110,000
$ 70,000
$ 54,000
$ 42,000
CASH
$ 40,000
Accum. Depr.
[Stmt. of Cash Flows]
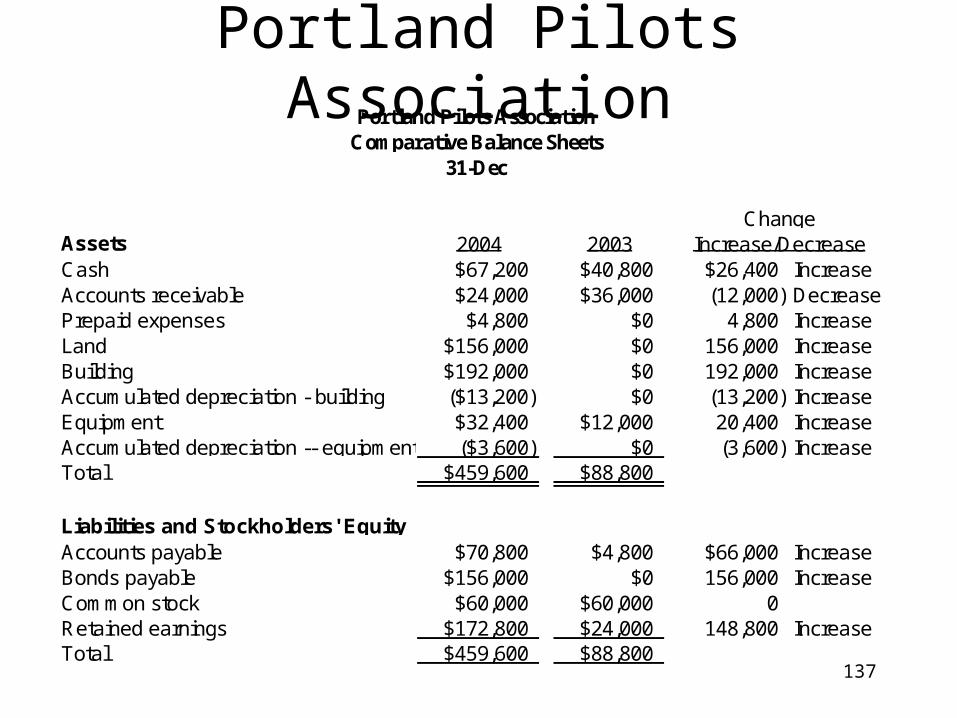
137
Portland Pilots Association
Assets 2004 2003Cash $67,200 $40,800 $26,400 IncreaseAccounts receivable $24,000 $36,000 (12,000) DecreasePrepaid expenses $4,800 $0 4,800 IncreaseLand $156,000 $0 156,000 IncreaseBuilding $192,000 $0 192,000 IncreaseAccumulated depreciation - building ($13,200) $0 (13,200) IncreaseEquipment $32,400 $12,000 20,400 IncreaseAccumulated depreciation -- equipment ($3,600) $0 (3,600) IncreaseTotal $459,600 $88,800
Liabilities and Stockholders' EquityAccounts payable $70,800 $4,800 $66,000 IncreaseBonds payable $156,000 $0 156,000 IncreaseCommon stock $60,000 $60,000 0Retained earnings $172,800 $24,000 148,800 IncreaseTotal $459,600 $88,800
Increase/DecreaseChange
31-Dec
Portland Pilots AssociationComparative Balance Sheets
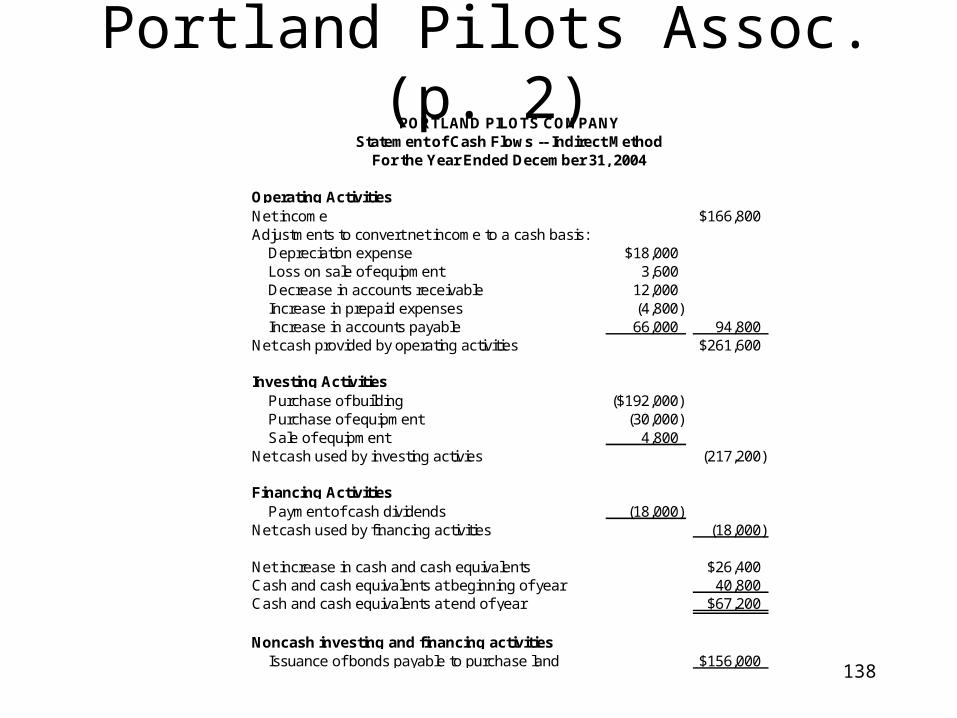
138
Portland Pilots Assoc. (p. 2)
Operating ActivitiesNet income $166,800Adjustments to convert net income to a cash basis: Depreciation expense $18,000 Loss on sale of equipment 3,600 Decrease in accounts receivable 12,000 Increase in prepaid expenses (4,800) Increase in accounts payable 66,000 94,800Net cash provided by operating activities $261,600
Investing Activities Purchase of building ($192,000) Purchase of equipment (30,000) Sale of equipment 4,800Net cash used by investing activies (217,200)
Financing Activities Payment of cash dividends (18,000)Net cash used by financing activities (18,000)
Net increase in cash and cash equivalents $26,400Cash and cash equivalents at beginning of year 40,800Cash and cash equivalents at end of year $67,200
Noncash investing and financing activities Issuance of bonds payable to purchase land $156,000
PORTLAND PILOTS COMPANYStatement of Cash Flows -- Indirect Method
For the Year Ended December 31, 2004
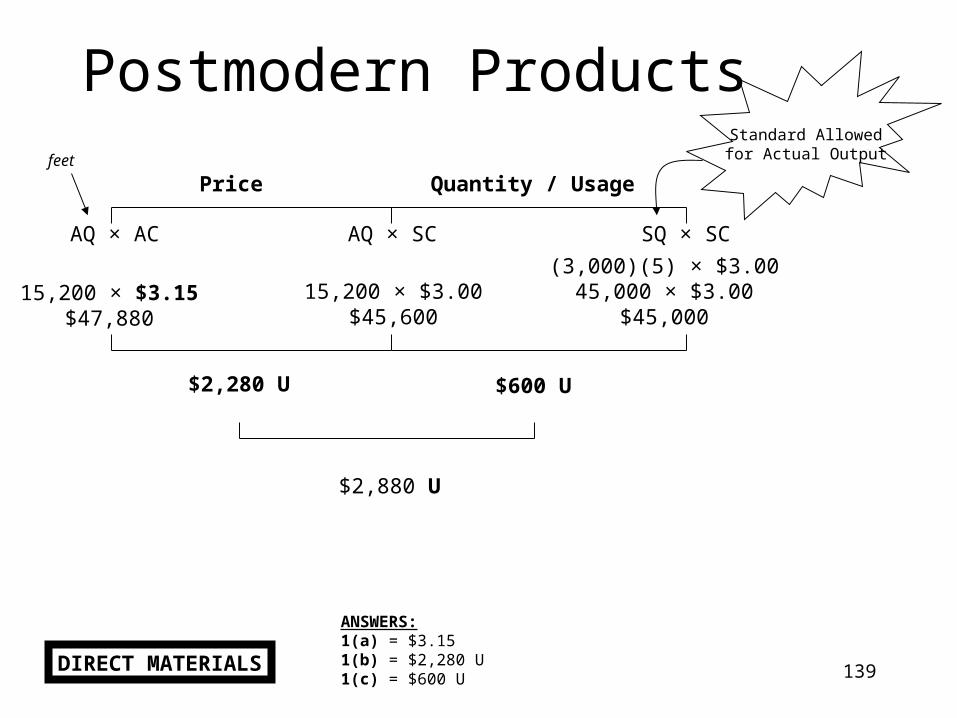
139
Postmodern ProductsStandard Allowedfor Actual Output
Price Quantity / Usage
AQ × AC AQ × SC SQ × SC
feet
15,200 × $3.15$47,880
(3,000)(5) × $3.0045,000 × $3.00
$45,00015,200 × $3.00
$45,600
$2,280 U $600 U
$2,880 U
DIRECT MATERIALS
ANSWERS:1(a) = $3.151(b) = $2,280 U1(c) = $600 U
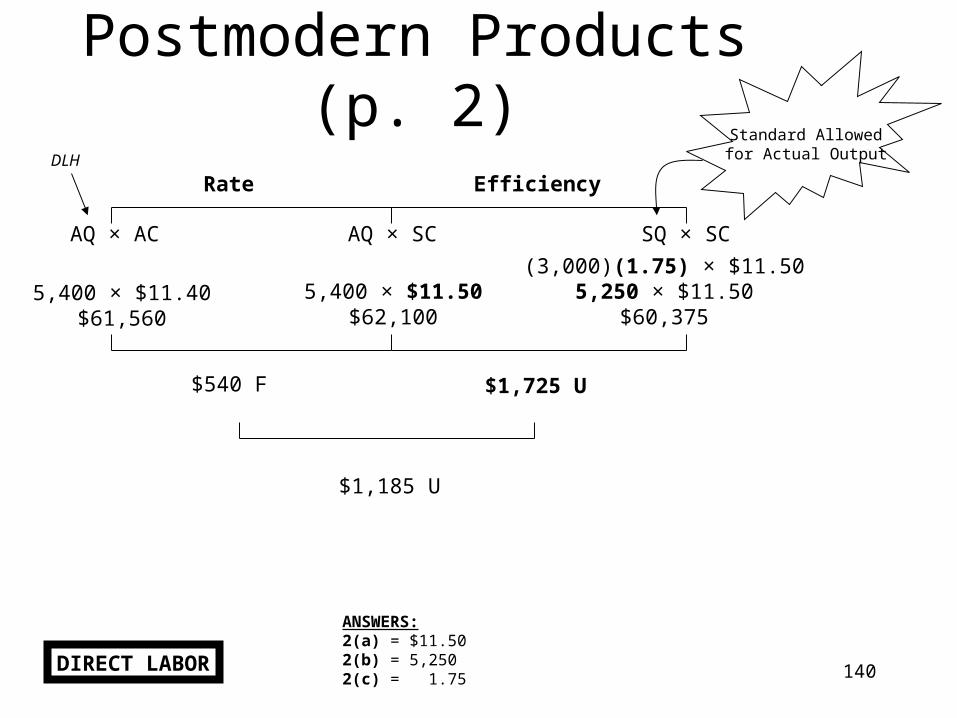
140
Postmodern Products (p. 2)Standard Allowedfor Actual Output
Rate Efficiency
AQ × AC AQ × SC SQ × SC
DLH
5,400 × $11.40$61,560
(3,000)(1.75) × $11.505,250 × $11.50
$60,3755,400 × $11.50
$62,100
$540 F $1,725 U
$1,185 U
DIRECT LABOR
ANSWERS:2(a) = $11.502(b) = 5,2502(c) = 1.75
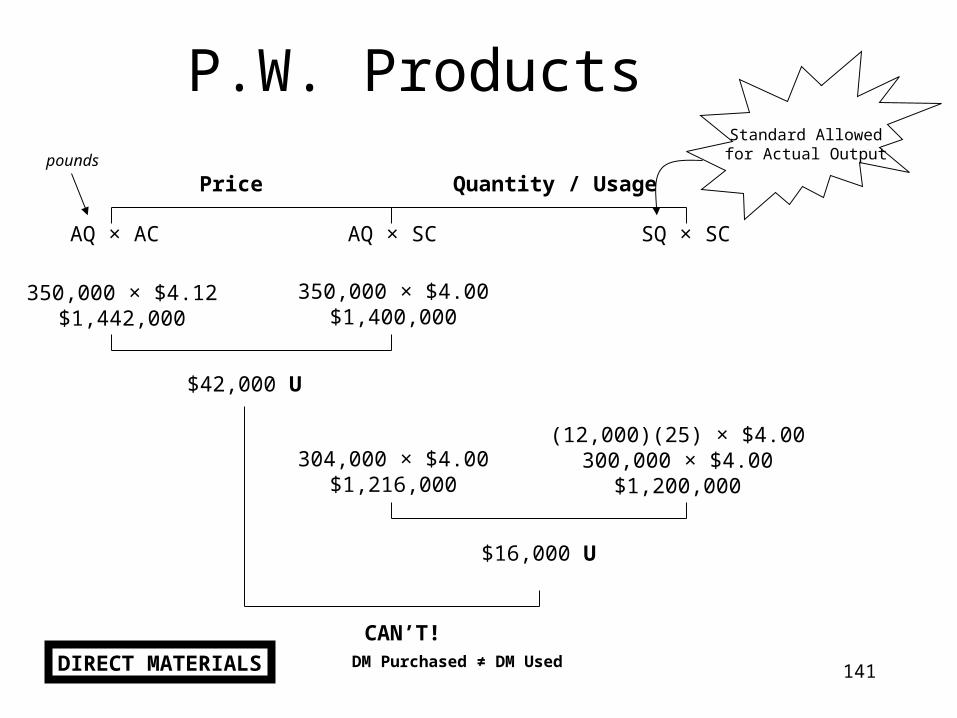
141
P.W. ProductsStandard Allowedfor Actual Output
Price Quantity / Usage
AQ × AC AQ × SC SQ × SC
pounds
350,000 × $4.12$1,442,000
(12,000)(25) × $4.00300,000 × $4.00
$1,200,000
350,000 × $4.00$1,400,000
$42,000 U
$16,000 U
CAN’T!
DIRECT MATERIALS
304,000 × $4.00$1,216,000
DM Purchased ≠ DM Used
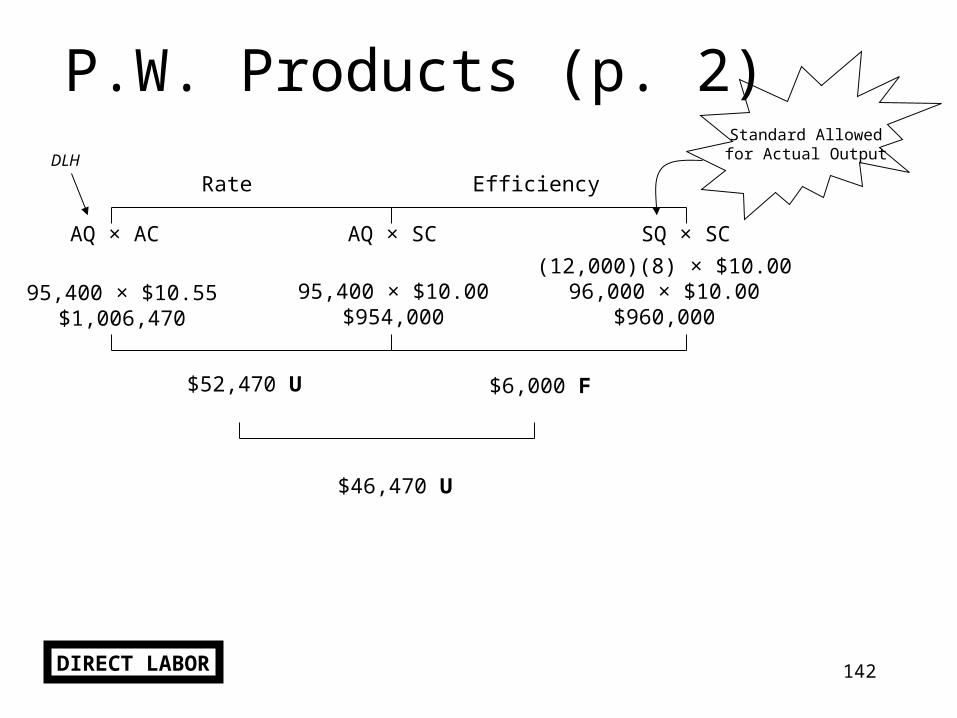
142
P.W. Products (p. 2)Standard Allowedfor Actual Output
Rate Efficiency
AQ × AC AQ × SC SQ × SC
DLH
95,400 × $10.55$1,006,470
(12,000)(8) × $10.0096,000 × $10.00
$960,00095,400 × $10.00
$954,000
$52,470 U $6,000 F
$46,470 U
DIRECT LABOR
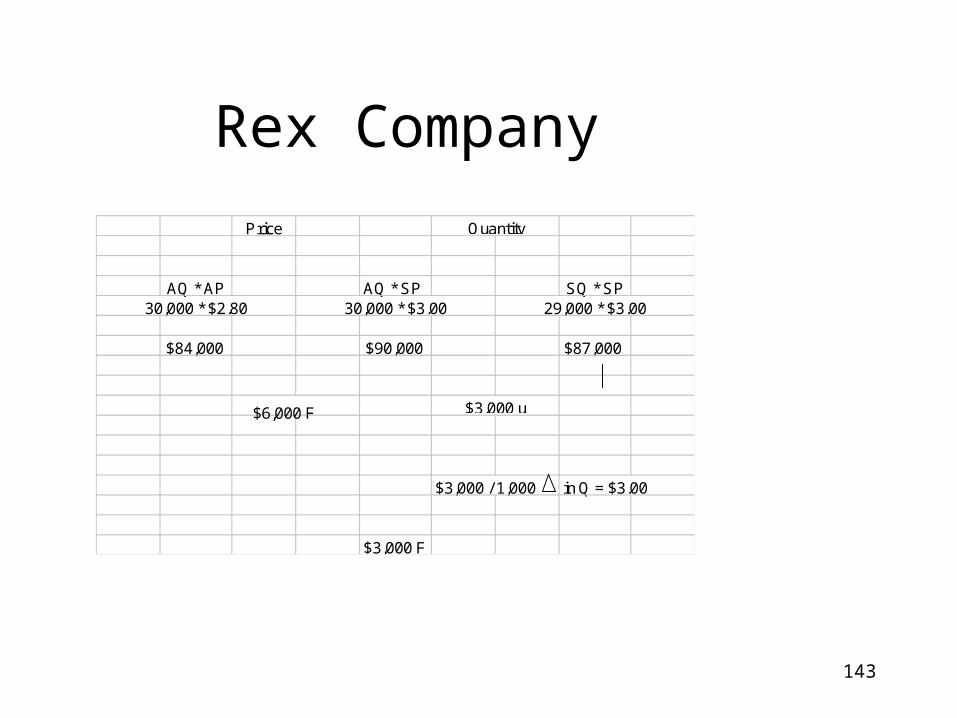
143
Rex Company
Price
AQ * AP AQ * SP SQ * SP30,000 * $2.80 30,000 * $3.00 29,000 * $3.00
$84,000 $90,000 $87,000
$3,000 / 1,000 in Q = $3.00
$3,000 F
Quantity
$3,000 u$6,000 F
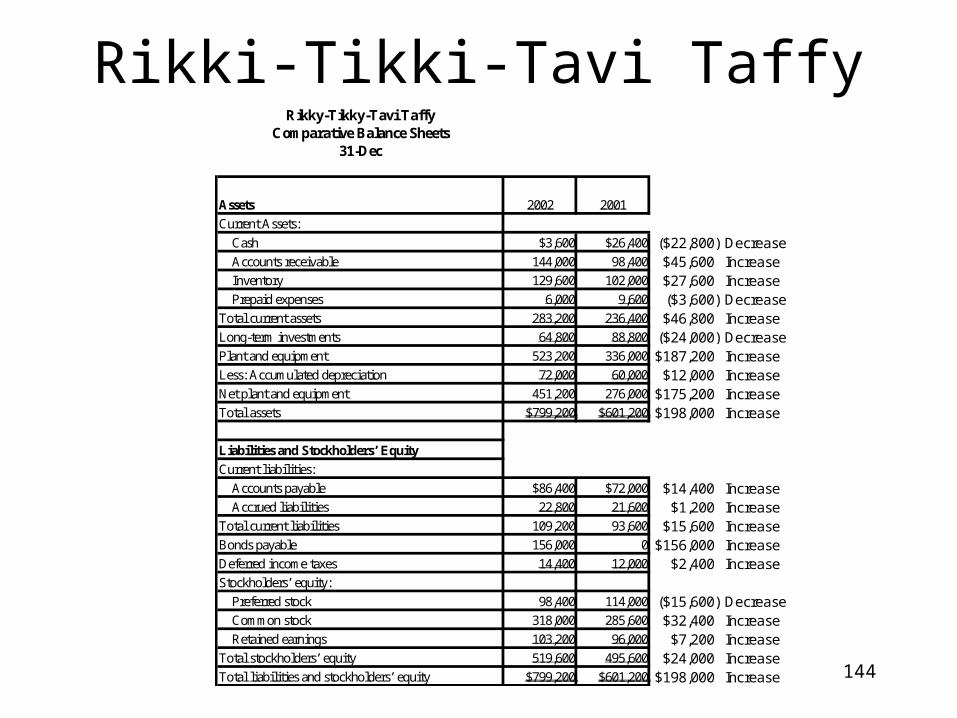
144
Rikki-Tikki-Tavi TaffyRikky-Tikky-Tavi Taffy
Comparative Balance Sheets31-Dec
Assets 2002 2001
Current Assets:
Cash $3,600 $26,400 ($22,800) Decrease Accounts receivable 144,000 98,400 $45,600 Increase Inventory 129,600 102,000 $27,600 Increase Prepaid expenses 6,000 9,600 ($3,600) DecreaseTotal current assets 283,200 236,400 $46,800 IncreaseLong-term investments 64,800 88,800 ($24,000) DecreasePlant and equipment 523,200 336,000 $187,200 IncreaseLess: Accumulated depreciation 72,000 60,000 $12,000 IncreaseNet plant and equipment 451,200 276,000 $175,200 IncreaseTotal assets $799,200 $601,200 $198,000 Increase
Liabilities and Stockholders’ Equity
Current liabilities:
Accounts payable $86,400 $72,000 $14,400 Increase Accrued liabilities 22,800 21,600 $1,200 IncreaseTotal current liabilities 109,200 93,600 $15,600 IncreaseBonds payable 156,000 0 $156,000 IncreaseDeferred income taxes 14,400 12,000 $2,400 IncreaseStockholders’ equity:
Preferred stock 98,400 114,000 ($15,600) Decrease Common stock 318,000 285,600 $32,400 Increase Retained earnings 103,200 96,000 $7,200 IncreaseTotal stockholders’ equity 519,600 495,600 $24,000 IncreaseTotal liabilities and stockholders’ equity $799,200 $601,200 $198,000 Increase
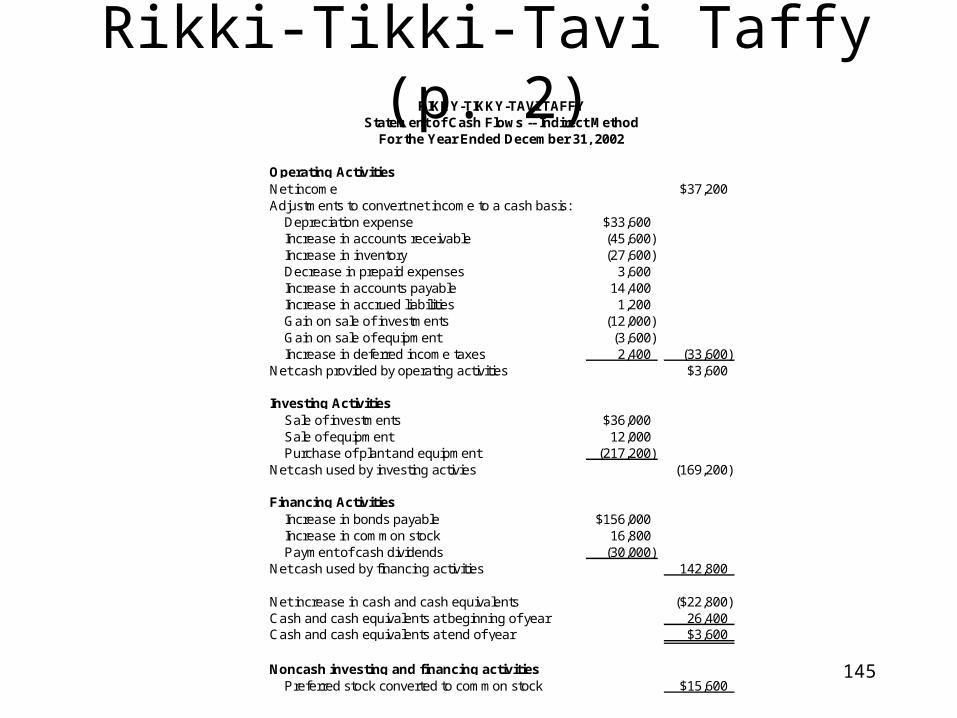
145
Rikki-Tikki-Tavi Taffy (p. 2)
Operating ActivitiesNet income $37,200Adjustments to convert net income to a cash basis: Depreciation expense $33,600 Increase in accounts receivable (45,600) Increase in inventory (27,600) Decrease in prepaid expenses 3,600 Increase in accounts payable 14,400 Increase in accrued liabilities 1,200 Gain on sale of investments (12,000) Gain on sale of equipment (3,600) Increase in deferred income taxes 2,400 (33,600)Net cash provided by operating activities $3,600
Investing Activities Sale of investments $36,000 Sale of equipment 12,000 Purchase of plant and equipment (217,200)Net cash used by investing activies (169,200)
Financing Activities Increase in bonds payable $156,000 Increase in common stock 16,800 Payment of cash dividends (30,000)Net cash used by financing activities 142,800
Net increase in cash and cash equivalents ($22,800)Cash and cash equivalents at beginning of year 26,400Cash and cash equivalents at end of year $3,600
Noncash investing and financing activities Preferred stock converted to common stock $15,600
RIKKY-TIKKY-TAVI TAFFYStatement of Cash Flows -- Indirect Method
For the Year Ended December 31, 2002
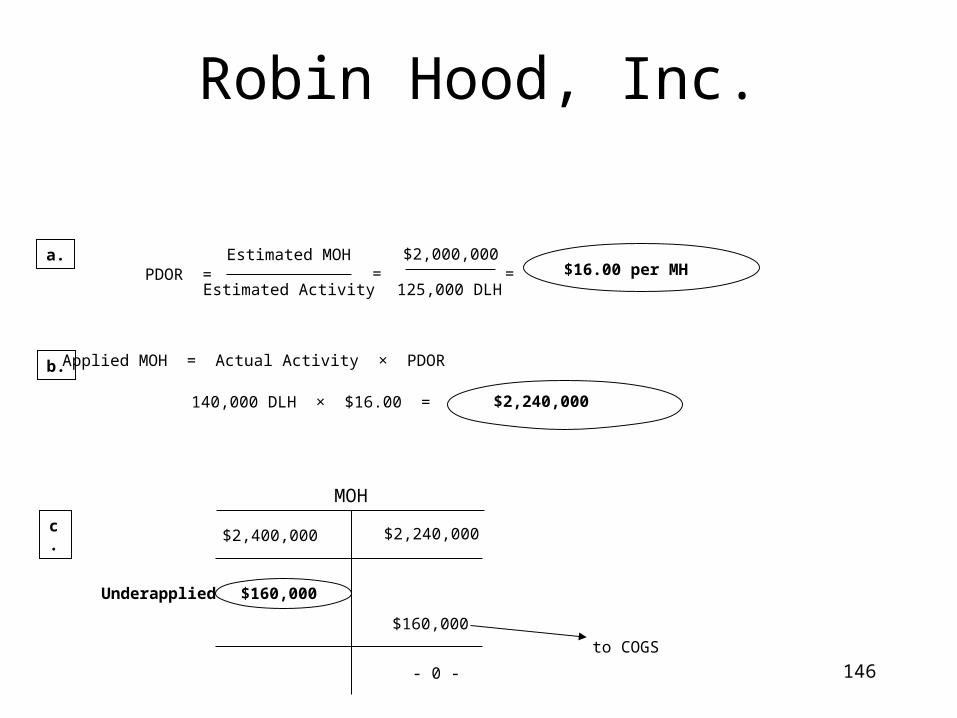
146
Robin Hood, Inc.
PDOR = Estimated MOH
Estimated Activity=
$2,000,000
125,000 DLH= $16.00 per MH
a.
b.
c.
Applied MOH = Actual Activity × PDOR
140,000 DLH × $16.00 = $2,240,000
MOH
$2,400,000 $2,240,000
$160,000
$160,000
- 0 -
to COGS
Underapplied
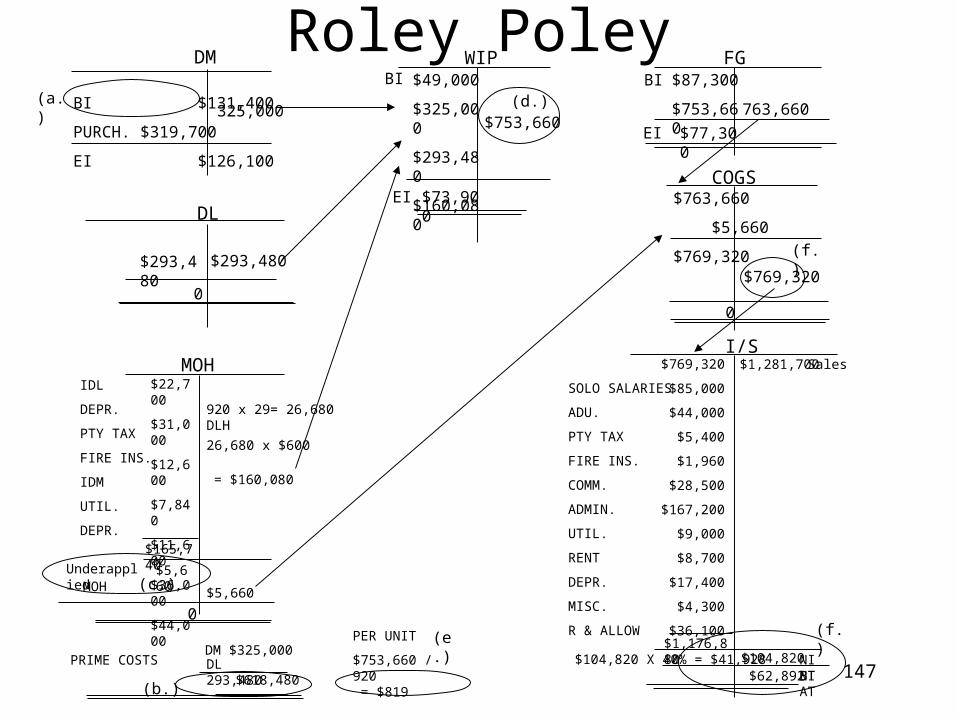
147
BI $131,400
PURCH. $319,700
EI $126,100
DM
(a.)325,000
$293,480
DL
$293,480
MOHIDL
DEPR.
PTY TAX
FIRE INS.
IDM
UTIL.
DEPR.
$22,700
$31,000
$12,600
$7,840
$11,600
$36,000
$44,000
920 x 29= 26,680 DLH
26,680 x $600
= $160,080
$165,740
UnderappliedMOH
$5,660(c.)
$5,660
PRIME COSTSDM $325,000DL 293,480
$618,480(b.)
WIPBI $49,000
$325,000
$293,480
$160,080
$73,900EI
$753,660(d.)
FG$87,300
$753,660
BI
763,660
$77,300EI
COGS$763,660
$5,660
$769,320 (f.)
$769,320
0
I/S
SOLO SALARIES
ADU.
PTY TAX
FIRE INS.
COMM.
ADMIN.
UTIL.
RENT
DEPR.
MISC.
R & ALLOW
$1,281,700 Sales$769,320
$85,000
$44,000
$5,400
$1,960
$28,500
$167,200
$9,000
$8,700
$17,400
$4,300
$36,100$1,176,880
$104,820 X 40% = $41,928 $104,820 $62,892
NI BT
(f.)
NI AT
0
0
Roley Poley
PER UNIT
$753,660 / 920 = $819
(e.)
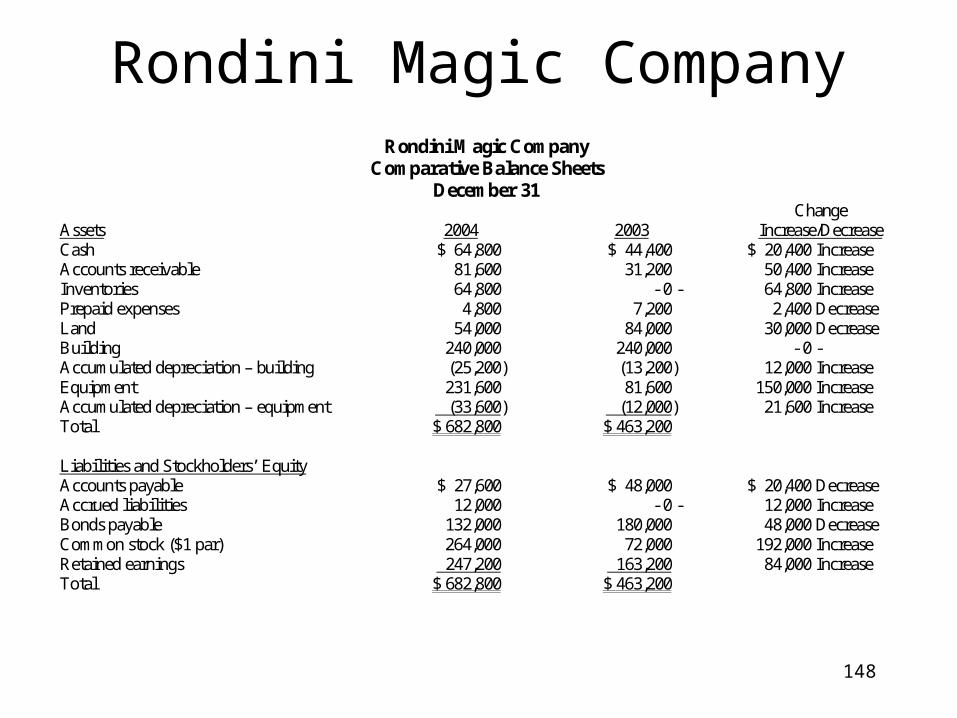
148
Rondini Magic CompanyRondini Magic Company
Comparative Balance Sheets December 31
Assets
2004
2003
Change Increase/Decrease
Cash $ 64,800 $ 44,400 $ 20,400 Increase Accounts receivable 81,600 31,200 50,400 Increase Inventories 64,800 - 0 - 64,800 Increase Prepaid expenses 4,800 7,200 2,400 Decrease Land 54,000 84,000 30,000 Decrease Building 240,000 240,000 - 0 - Accumulated depreciation – building (25,200) (13,200) 12,000 Increase Equipment 231,600 81,600 150,000 Increase Accumulated depreciation – equipment (33,600) (12,000) 21,600 Increase Total $ 682,800 $ 463,200 Liabilities and Stockholders’ Equity Accounts payable $ 27,600 $ 48,000 $ 20,400 Decrease Accrued liabilities 12,000 - 0 - 12,000 Increase Bonds payable 132,000 180,000 48,000 Decrease Common stock ($1 par) 264,000 72,000 192,000 Increase Retained earnings 247,200 163,200 84,000 Increase Total $ 682,800 $ 463,200
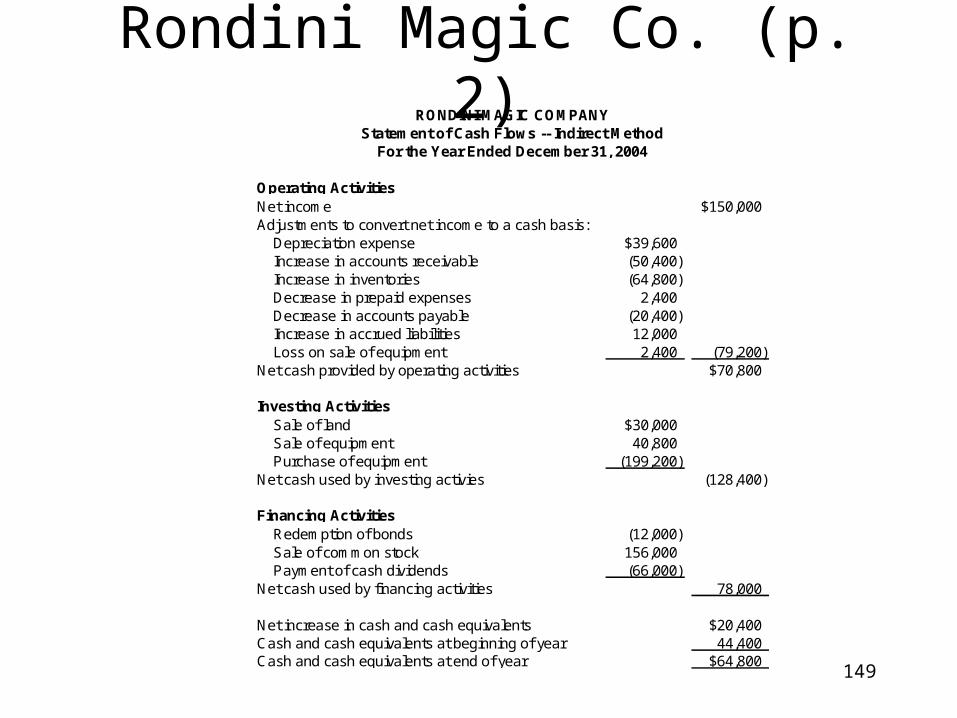
149
Rondini Magic Co. (p. 2)
Operating ActivitiesNet income $150,000Adjustments to convert net income to a cash basis: Depreciation expense $39,600 Increase in accounts receivable (50,400) Increase in inventories (64,800) Decrease in prepaid expenses 2,400 Decrease in accounts payable (20,400) Increase in accrued liabilities 12,000 Loss on sale of equipment 2,400 (79,200)Net cash provided by operating activities $70,800
Investing Activities Sale of land $30,000 Sale of equipment 40,800 Purchase of equipment (199,200)Net cash used by investing activies (128,400)
Financing Activities Redemption of bonds (12,000) Sale of common stock 156,000 Payment of cash dividends (66,000)Net cash used by financing activities 78,000
Net increase in cash and cash equivalents $20,400Cash and cash equivalents at beginning of year 44,400Cash and cash equivalents at end of year $64,800
RONDINI MAGIC COMPANYStatement of Cash Flows -- Indirect Method
For the Year Ended December 31, 2004
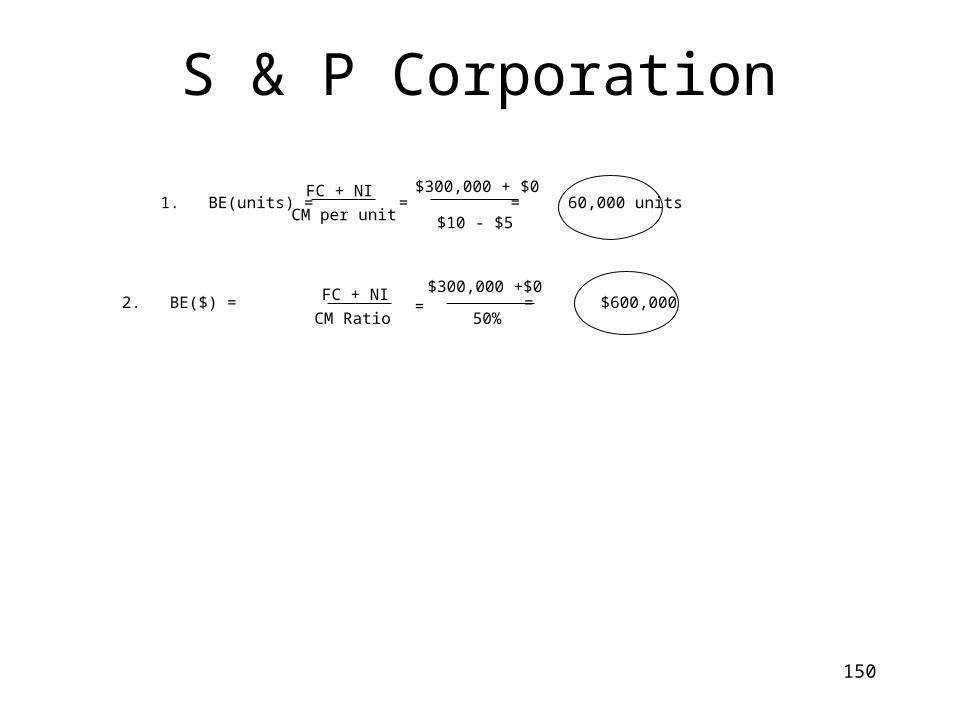
150
S & P Corporation
1. BE(units) =CM per unit
FC + NI=
$300,000 + $0
$10 - $5= 60,000 units
2. BE($) =CM Ratio
FC + NI=
$300,000 +$0
50%= $600,000
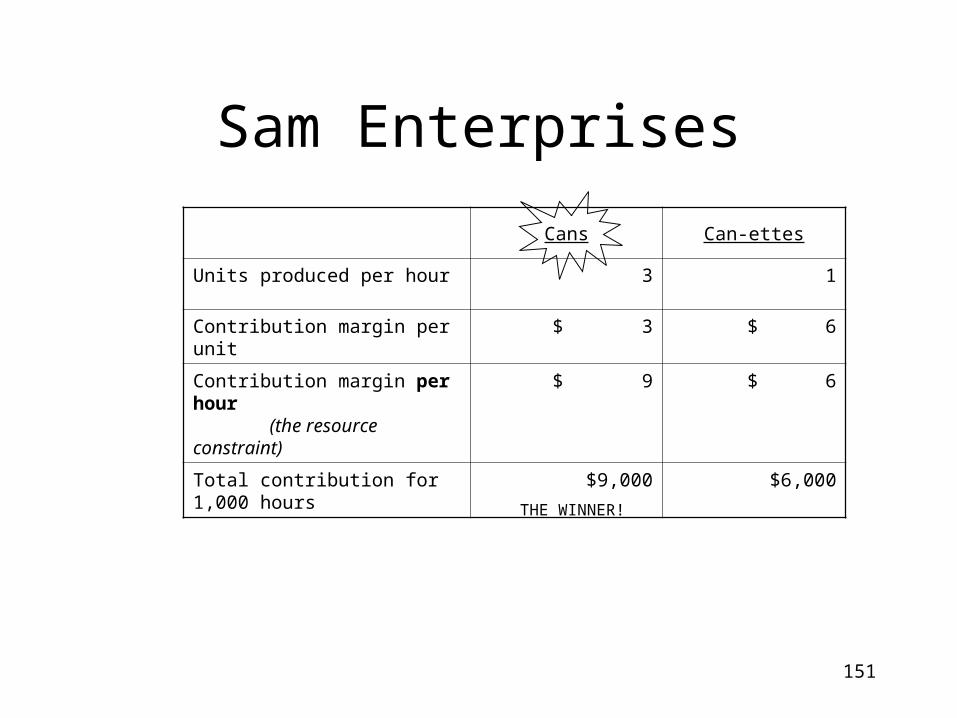
151
Sam Enterprises
Cans Can-ettes
Units produced per hour 3 1
Contribution margin per unit $ 3 $ 6
Contribution margin per hour (the resource constraint)
$ 9 $ 6
Total contribution for 1,000 hours $9,000 $6,000
THE WINNER!
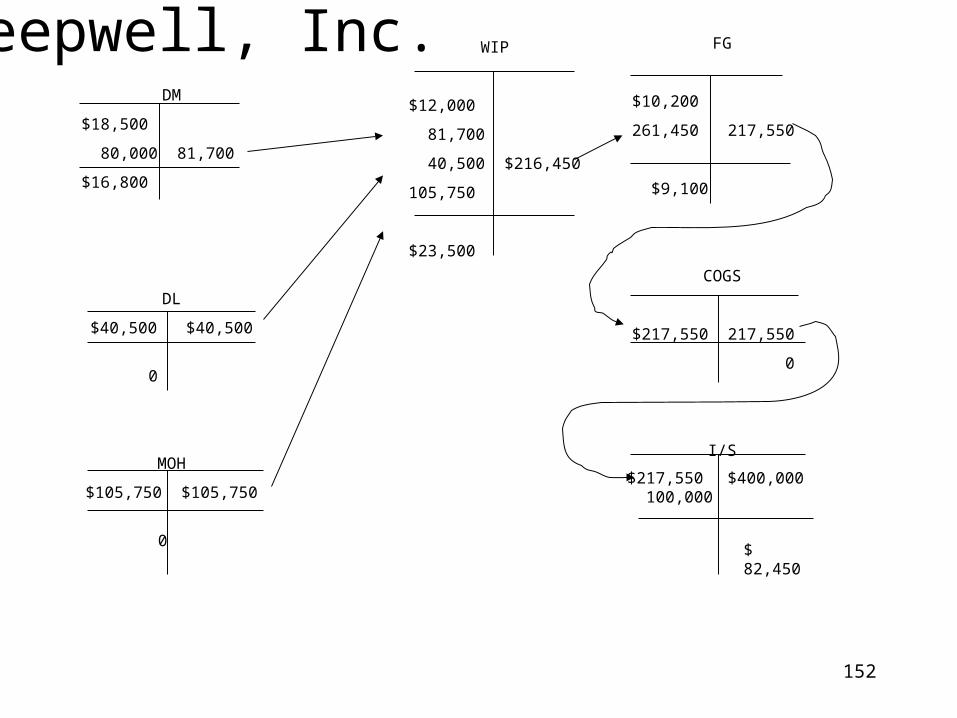
152
Sleepwell, Inc.DM
$18,500
80,000 81,700
$16,800
DL
$40,500 $40,500
0
MOH
$105,750 $105,750
0
WIP
$12,000
81,700
40,500 $216,450
105,750
$23,500
FG
$10,200
261,450 217,550
$9,100
COGS
$217,550 217,550
0
I/S
$ 82,450
$400,000$217,550 100,000
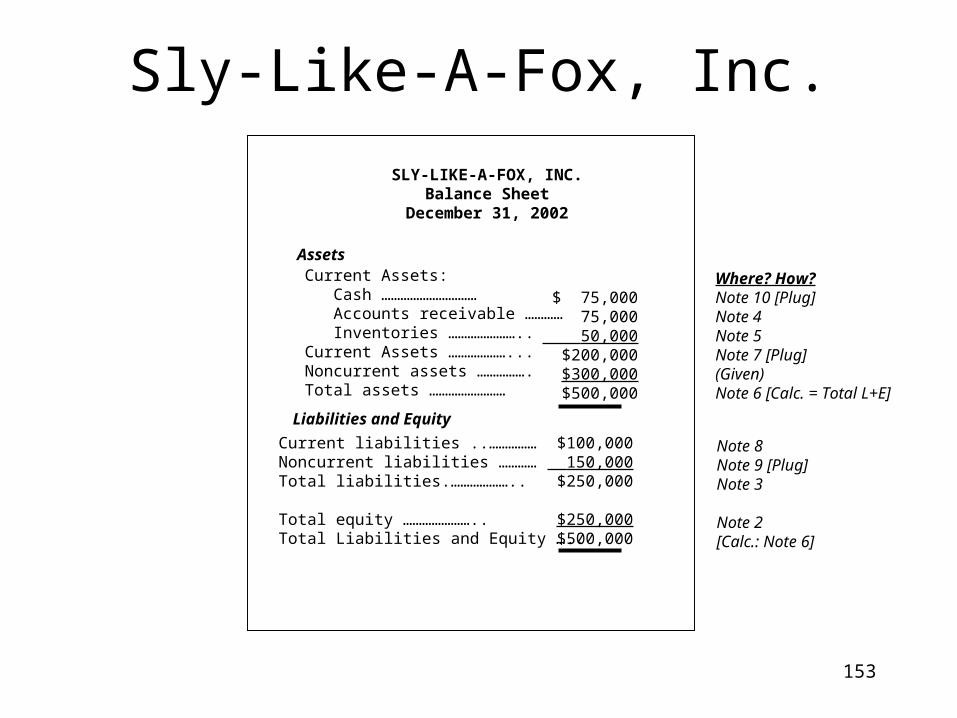
153
Sly-Like-A-Fox, Inc.
SLY-LIKE-A-FOX, INC.Balance Sheet
December 31, 2002
AssetsCurrent Assets: Cash ………………………… Accounts receivable ………… Inventories …………………..Current Assets ………………...Noncurrent assets …………….Total assets ……………………
Liabilities and Equity
Current liabilities ..……………Noncurrent liabilities …………Total liabilities.………………..
Total equity …………………..Total Liabilities and Equity …..
$ 75,00075,000
50,000$200,000$300,000$500,000
$100,000 150,000$250,000
$250,000$500,000
Where? How?Note 10 [Plug]Note 4Note 5Note 7 [Plug](Given)Note 6 [Calc. = Total L+E]
Note 8Note 9 [Plug]Note 3
Note 2[Calc.: Note 6]
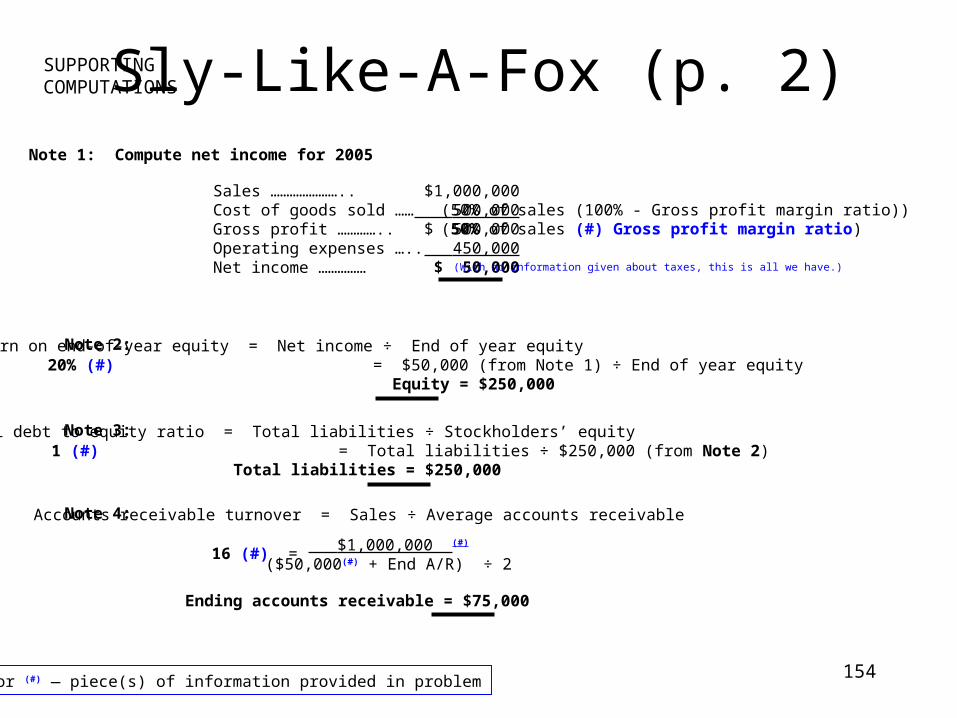
154
Sly-Like-A-Fox (p. 2)SUPPORTINGCOMPUTATIONS
Note 1: Compute net income for 2005
Sales …………………..Cost of goods sold ……Gross profit …………..Operating expenses …..Net income ……………
$1,000,000 500,000$ 500,000 450,000$ 50,000
(50% of sales (100% - Gross profit margin ratio))(50% of sales (#) Gross profit margin ratio)
(With no information given about taxes, this is all we have.)
Note 2: Return on end-of-year equity = Net income ÷ End of year equity 20% (#) = $50,000 (from Note 1) ÷ End of year equity Equity = $250,000
Note 3: Total debt to equity ratio = Total liabilities ÷ Stockholders’ equity 1 (#) = Total liabilities ÷ $250,000 (from Note 2) Total liabilities = $250,000
Note 4: Accounts receivable turnover = Sales ÷ Average accounts receivable
16 (#) = $1,000,000 (#)
($50,000(#) + End A/R) ÷ 2
(#) or (#) — piece(s) of information provided in problem
Ending accounts receivable = $75,000
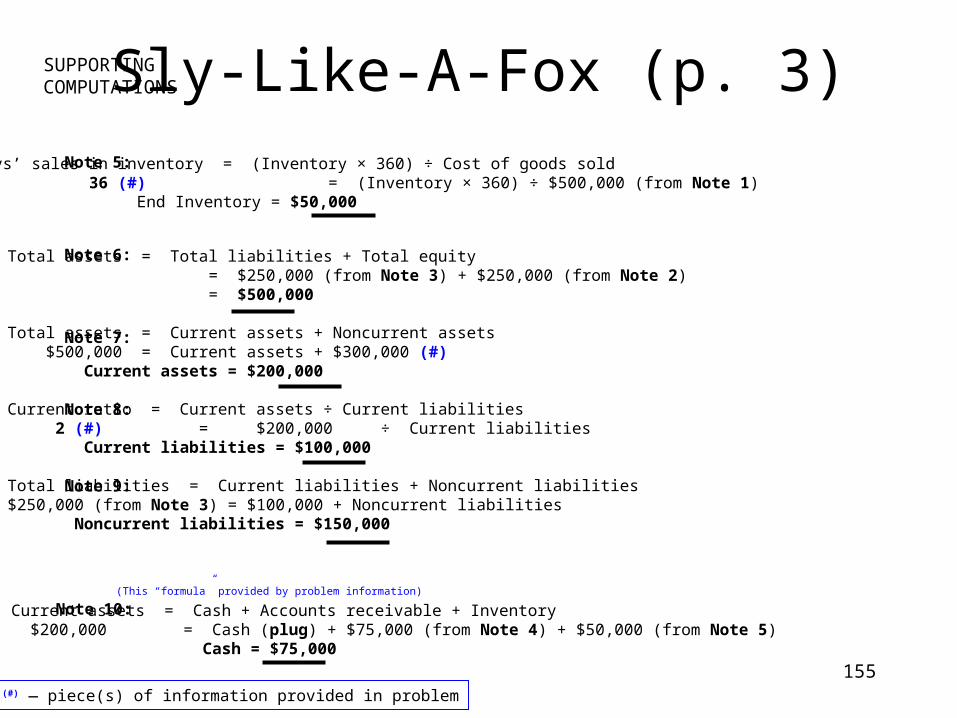
155
Sly-Like-A-Fox (p. 3)
Note 6: Total assets = Total liabilities + Total equity = $250,000 (from Note 3) + $250,000 (from Note 2) = $500,000
Total assets = Current assets + Noncurrent assets $500,000 = Current assets + $300,000 (#) Current assets = $200,000
Current ratio = Current assets ÷ Current liabilities 2 (#) = $200,000 ÷ Current liabilities Current liabilities = $100,000
Total liabilities = Current liabilities + Noncurrent liabilities$250,000 (from Note 3) = $100,000 + Noncurrent liabilities Noncurrent liabilities = $150,000
(#) or (#) — piece(s) of information provided in problem
SUPPORTINGCOMPUTATIONS
Note 10: Current assets = Cash + Accounts receivable + Inventory $200,000 = Cash (plug) + $75,000 (from Note 4) + $50,000 (from Note 5) Cash = $75,000
(This “formula” provided by problem information)
Note 5: Days’ sales in inventory = (Inventory × 360) ÷ Cost of goods sold 36 (#) = (Inventory × 360) ÷ $500,000 (from Note 1) End Inventory = $50,000
Note 9:
Note 8:
Note 7:
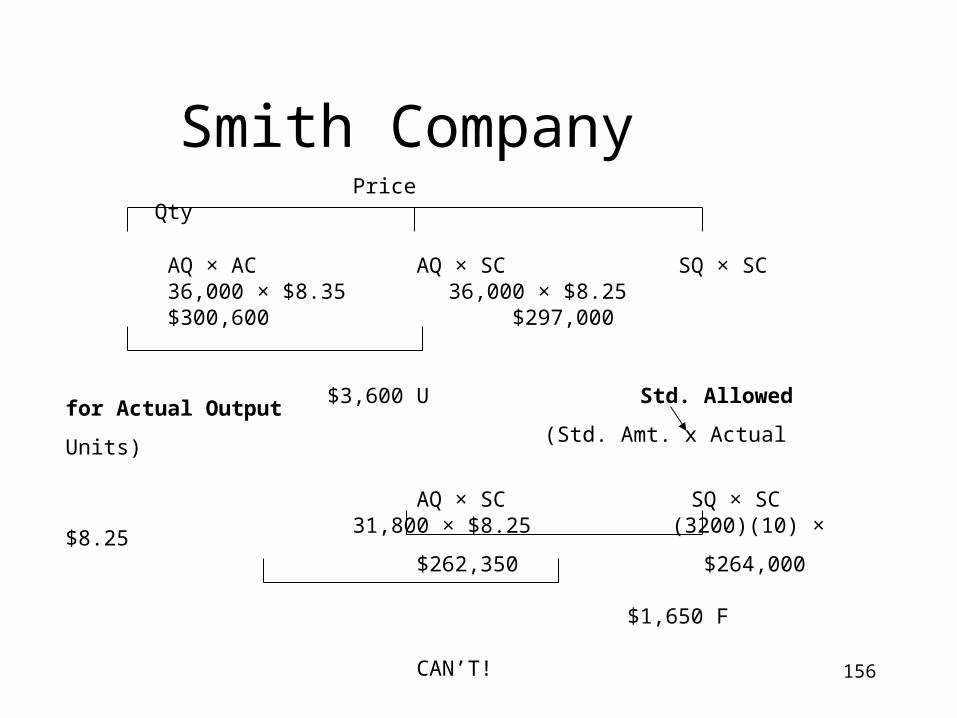
156
Smith Company Price Qty
AQ × AC AQ × SC SQ × SC 36,000 × $8.35 36,000 × $8.25 $300,600 $297,000
$3,600 U Std. Allowed for Actual Output(Std. Amt. x Actual Units)
AQ × SC SQ × SC31,800 × $8.25 (3200)(10) × $8.25 $262,350 $264,000
$1,650 F
CAN’T!
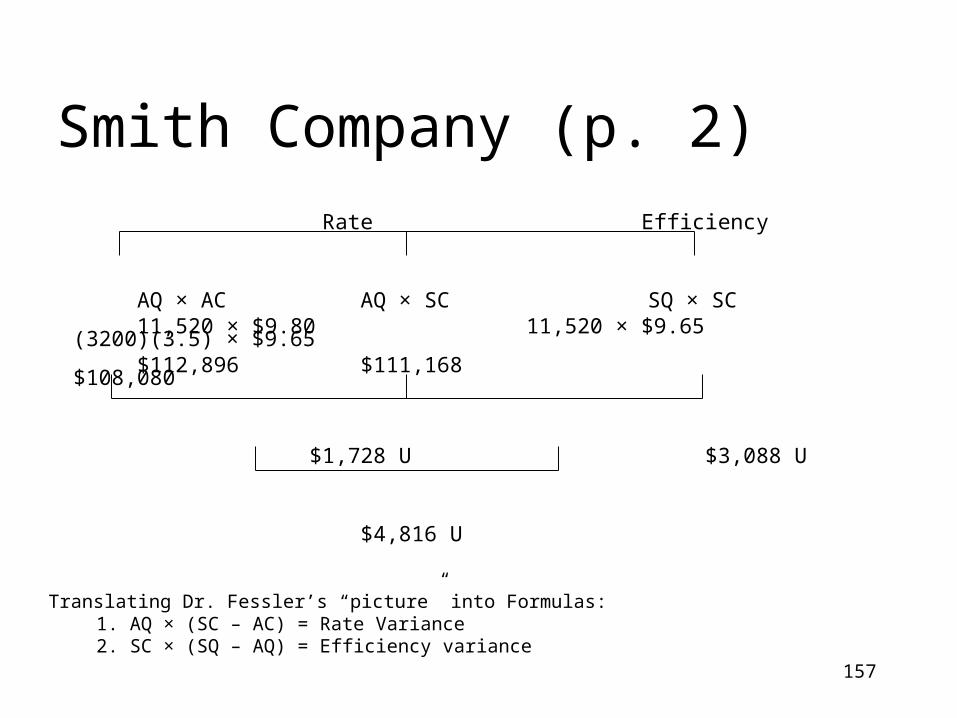
157
Smith Company (p. 2)
Rate Efficiency
AQ × AC AQ × SC SQ × SC 11,520 × $9.80 11,520 × $9.65 (3200)(3.5) × $9.65 $112,896 $111,168 $108,080
$1,728 U $3,088 U
$4,816 U
Translating Dr. Fessler’s “picture” into Formulas:1. AQ × (SC – AC) = Rate Variance2. SC × (SQ – AQ) = Efficiency variance
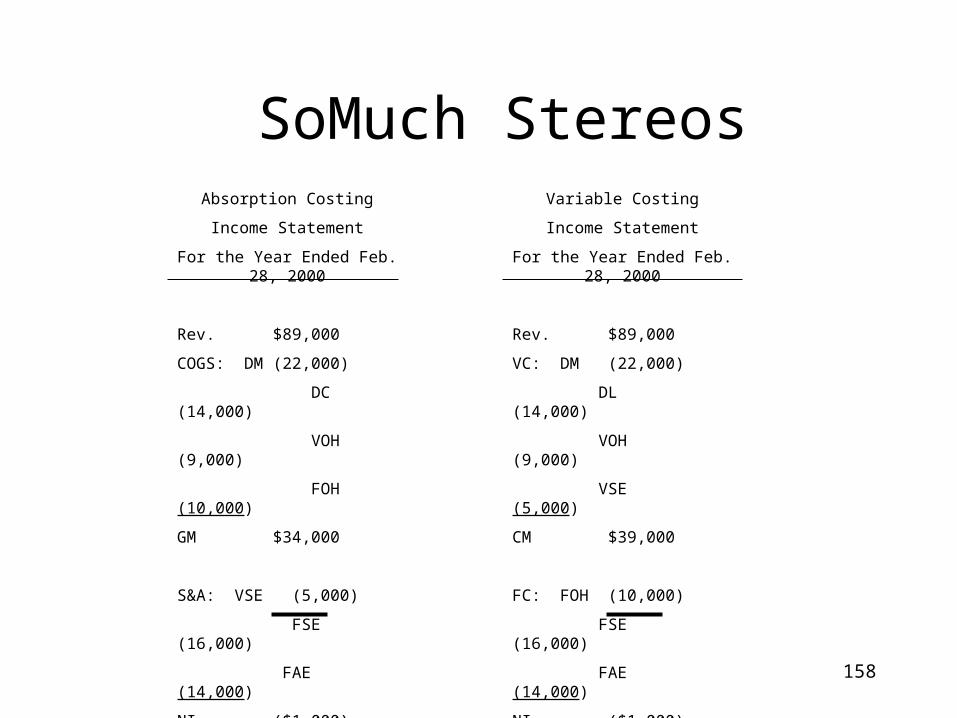
158
SoMuch StereosAbsorption Costing
Income Statement
For the Year Ended Feb. 28, 2000
Rev. $89,000
COGS: DM (22,000)
DC (14,000)
VOH (9,000)
FOH (10,000)
GM $34,000
S&A: VSE (5,000)
FSE (16,000)
FAE (14,000)
NI ($1,000)
Variable Costing
Income Statement
For the Year Ended Feb. 28, 2000
Rev. $89,000
VC: DM (22,000)
DL (14,000)
VOH (9,000)
VSE (5,000)
CM $39,000
FC: FOH (10,000)
FSE (16,000)
FAE (14,000)
NI ($1,000)
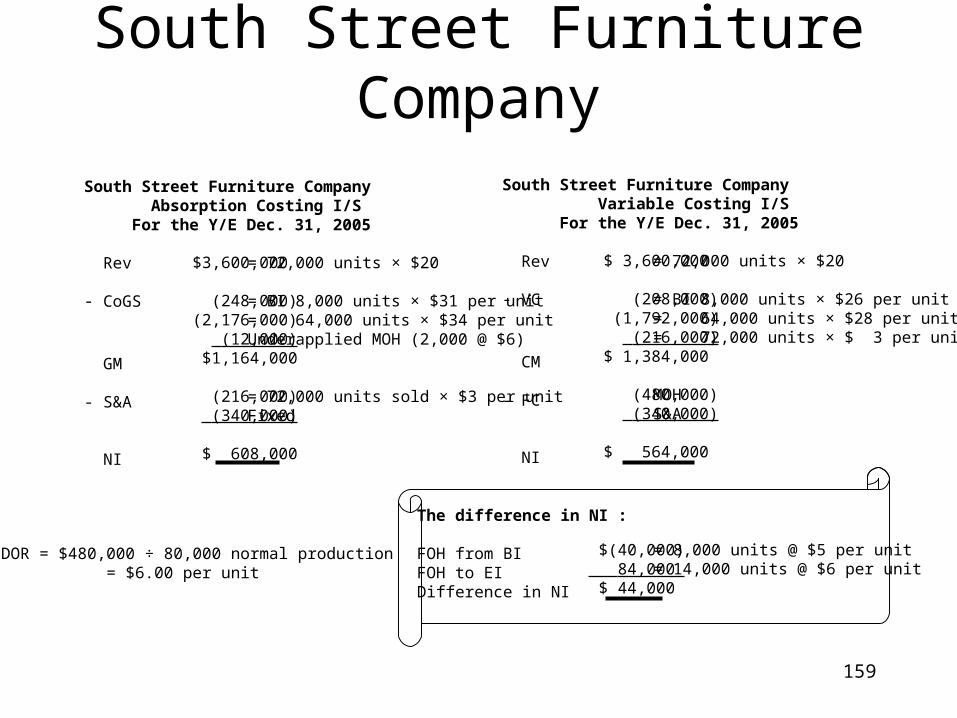
159
South Street Furniture Company
South Street Furniture Company Absorption Costing I/S For the Y/E Dec. 31, 2005
Rev
- CoGS
GM
- S&A
NI
$3,600,000
(248,000)(2,176,000) (12,000)$1,164,000
(216,000) (340,000)
$ 608,000
= 72,000 units × $20
= BI 8,000 units × $31 per unit= 64,000 units × $34 per unitUnderapplied MOH (2,000 @ $6)
= 72,000 units sold × $3 per unitFixed
South Street Furniture Company Variable Costing I/S For the Y/E Dec. 31, 2005
Rev
- VC
CM
- FC
NI
$ 3,600,000
(208,000)(1,792,000)
(216,000)$ 1,384,000
(480,000) (340,000)
$ 564,000
= 72,000 units × $20
= BI 8,000 units × $26 per unit= 64,000 units × $28 per unit= 72,000 units × $ 3 per unit
MOHS&A
The difference in NI :
FOH from BIFOH to EIDifference in NI
PDOR = $480,000 ÷ 80,000 normal production = $6.00 per unit
$(40,000) 84,000 $ 44,000
= 8,000 units @ $5 per unit = 14,000 units @ $6 per unit
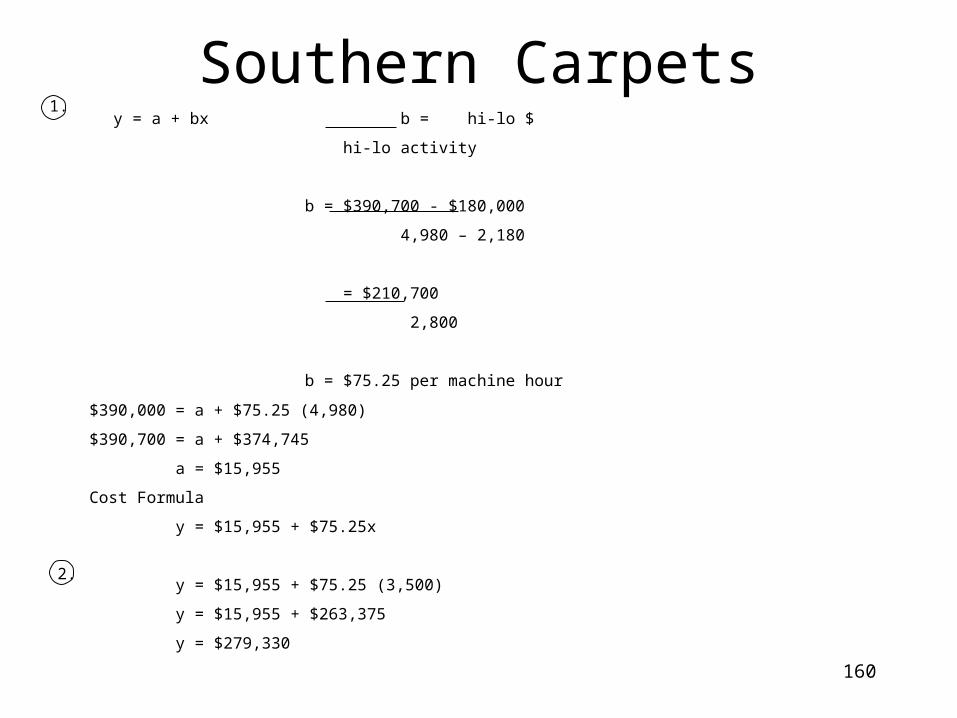
160
1.y = a + bx b = hi-lo $
hi-lo activity
b = $390,700 - $180,000
4,980 – 2,180
= $210,700
2,800
b = $75.25 per machine hour
$390,000 = a + $75.25 (4,980)
$390,700 = a + $374,745
a = $15,955
Cost Formula
y = $15,955 + $75.25x
y = $15,955 + $75.25 (3,500)
y = $15,955 + $263,375
y = $279,330
2.
Southern Carpets
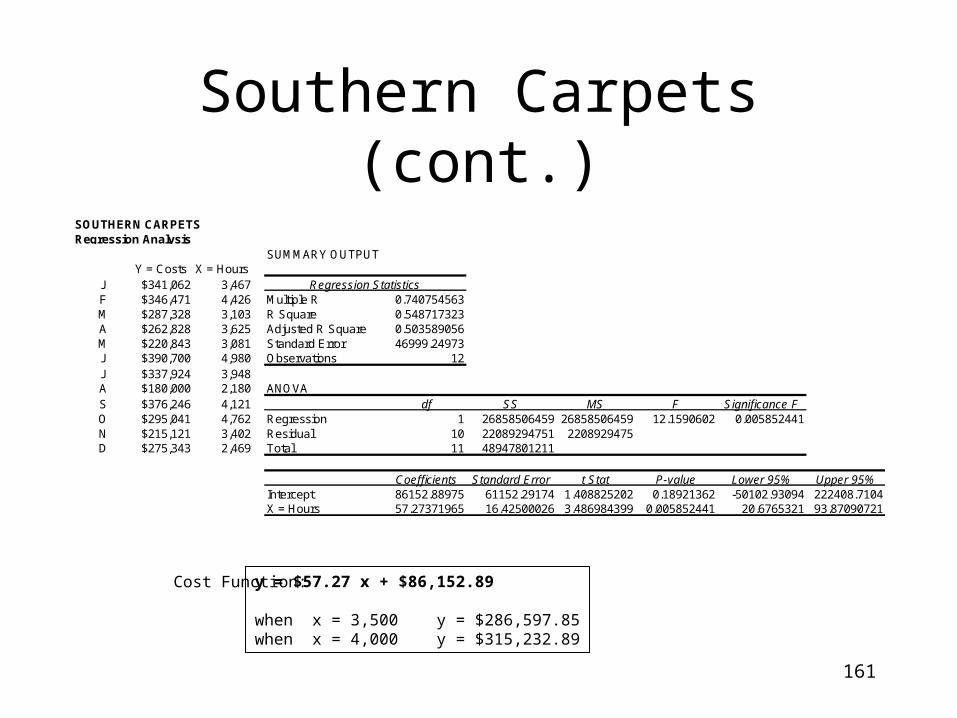
161
Southern Carpets (cont.)SOUTHERN CARPETSRegression Analysis
SUMMARY OUTPUTY = Costs X = Hours
J $341,062 3,467 Regression StatisticsF $346,471 4,426 Multiple R 0.740754563M $287,328 3,103 R Square 0.548717323A $262,828 3,625 Adjusted R Square 0.503589056M $220,843 3,081 Standard Error 46999.24973J $390,700 4,980 Observations 12J $337,924 3,948A $180,000 2,180 ANOVAS $376,246 4,121 df SS MS F Significance FO $295,041 4,762 Regression 1 26858506459 26858506459 12.1590602 0.005852441N $215,121 3,402 Residual 10 22089294751 2208929475D $275,343 2,469 Total 11 48947801211
Coefficients Standard Error t Stat P-value Lower 95% Upper 95%Intercept 86152.88975 61152.29174 1.408825202 0.18921362 -50102.93094 222408.7104X = Hours 57.27371965 16.42500026 3.486984399 0.005852441 20.6765321 93.87090721
y = $57.27 x + $86,152.89
when x = 3,500 y = $286,597.85when x = 4,000 y = $315,232.89
Cost Function:
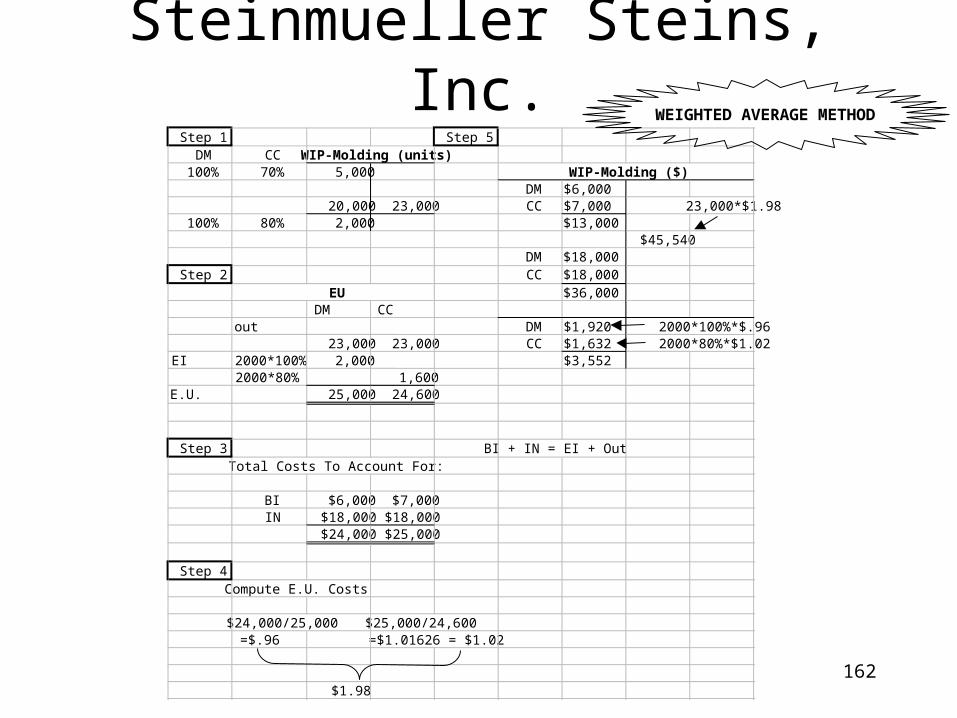
162
Steinmueller Steins, Inc.Step 1 Step 5
DM CC100% 70% 5,000
DM $6,00020,000 23,000 CC $7,000 23,000*$1.98
100% 80% 2,000 $13,000$45,540
DM $18,000Step 2 CC $18,000
$36,000DM CC
out DM $1,920 2000*100%*$.9623,000 23,000 CC $1,632 2000*80%*$1.02
EI 2000*100% 2,000 $3,5522000*80% 1,600
E.U. 25,000 24,600
Step 3 BI + IN = EI + Out
BI $6,000 $7,000IN $18,000 $18,000
$24,000 $25,000
Step 4Compute E.U. Costs
$24,000/25,000 $25,000/24,600 =$.96 =$1.01626 = $1.02
$1.98
WIP-Molding (units)
EU
Total Costs To Account For:
WIP-Molding ($)
WEIGHTED AVERAGE METHOD
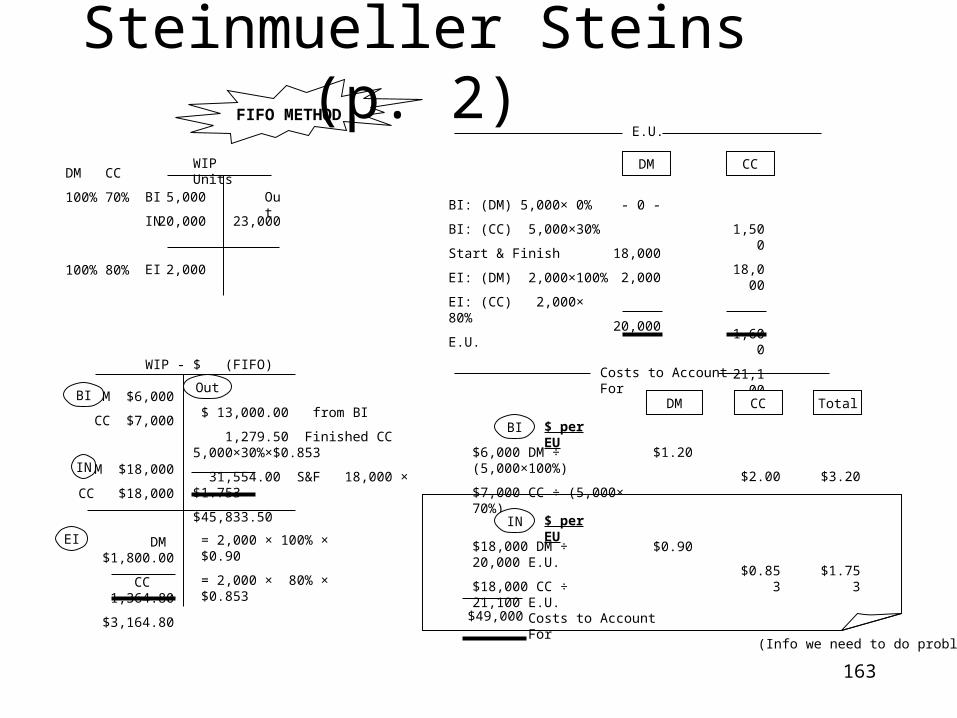
163
Steinmueller Steins (p. 2)
WIP Units
5,000
20,000
2,000
23,000
OutBI
IN
EI
DM
100%
100%
CC
70%
80%
WIP - $ (FIFO)
DM $6,000
CC $7,000
DM $18,000
CC $18,000
DM $1,800.00
CC 1,364.80
$3,164.80
$ 13,000.00 from BI
1,279.50 Finished CC 5,000×30%×$0.853
31,554.00 S&F 18,000 × $1.753
$45,833.50
= 2,000 × 100% × $0.90
= 2,000 × 80% × $0.853
OutBI
IN
EI
E.U.
DM CC
- 0 -
18,000
2,000
20,000
1,500
18,000
1,600
21,100
Costs to Account For
DM CC
$1.20
$2.00
$ per EU
BI: (DM) 5,000× 0%
BI: (CC) 5,000×30%
Start & Finish
EI: (DM) 2,000×100%
EI: (CC) 2,000× 80%
E.U.
FIFO METHOD
BI
$6,000 DM ÷ (5,000×100%)
$7,000 CC ÷ (5,000× 70%)
Total
$3.20
$0.90
$0.853
$ per EUIN
$18,000 DM ÷ 20,000 E.U.
$18,000 CC ÷ 21,100 E.U. $1.753
(Info we need to do problem)
$49,000 Costs to Account For
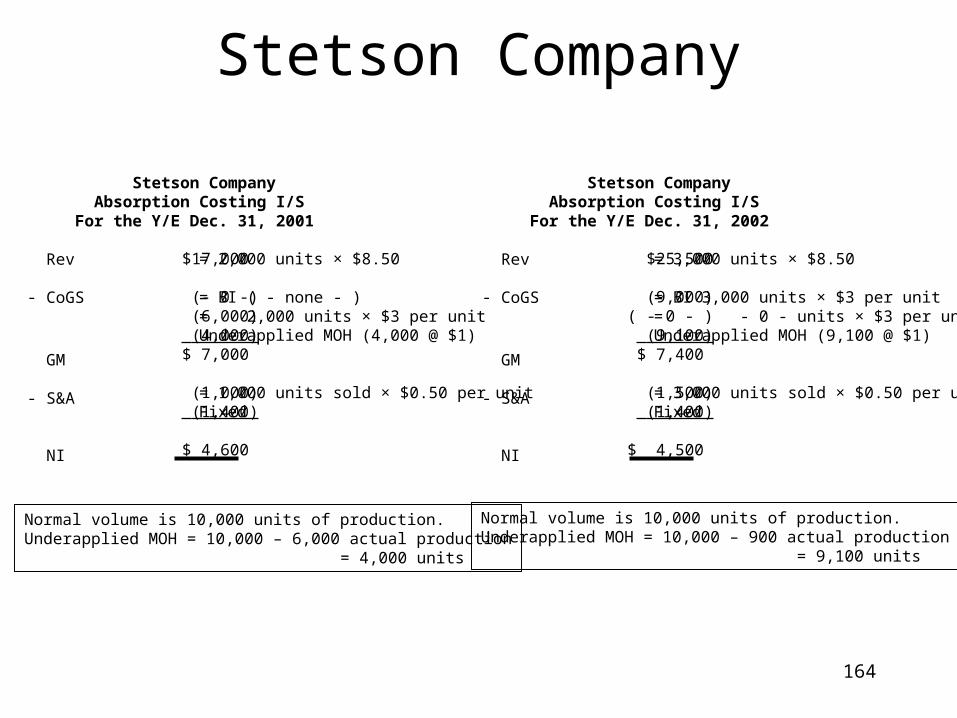
164
Stetson Company
Stetson Company Absorption Costing I/S For the Y/E Dec. 31, 2001
Rev
- CoGS
GM
- S&A
NI
$17,000
(- 0 -)(6,000)
(4,000)$ 7,000
(1,000) (1,400)
$ 4,600
= 2,000 units × $8.50
= BI ( - none - )= 2,000 units × $3 per unitUnderapplied MOH (4,000 @ $1)
= 1,000 units sold × $0.50 per unitFixed
Normal volume is 10,000 units of production.Underapplied MOH = 10,000 – 6,000 actual production = 4,000 units
Stetson Company Absorption Costing I/S For the Y/E Dec. 31, 2002
Rev
- CoGS
GM
- S&A
NI
$25,500
(9,000)( - 0 - )
(9,100)$ 7,400
(1,500) (1,400)
$ 4,500
= 3,000 units × $8.50
= BI 3,000 units × $3 per unit= - 0 - units × $3 per unitUnderapplied MOH (9,100 @ $1)
= 3,000 units sold × $0.50 per unitFixed
Normal volume is 10,000 units of production.Underapplied MOH = 10,000 – 900 actual production = 9,100 units
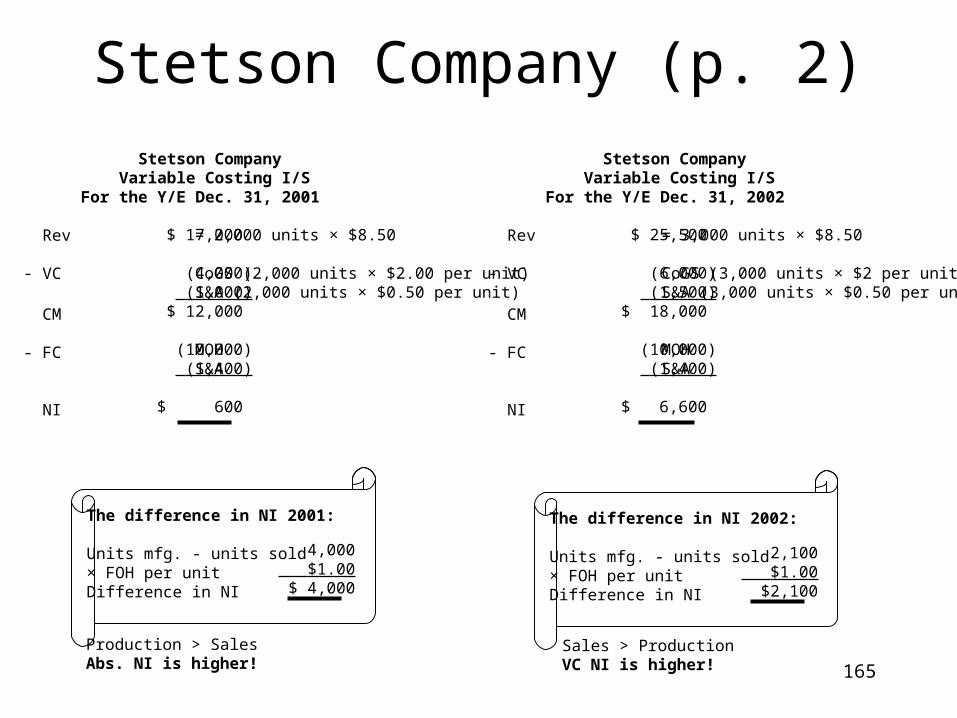
165
Stetson Company (p. 2)
Stetson Company Variable Costing I/S For the Y/E Dec. 31, 2002
Rev
- VC
CM
- FC
NI
= 3,000 units × $8.50
CoGS (3,000 units × $2 per unitS&A (3,000 units × $0.50 per unit)
MOHS&A
The difference in NI 2001:
Units mfg. - units sold× FOH per unitDifference in NI
4,000 $1.00$ 4,000
$ 25,500
(6,000) (1,500)$ 18,000
(10,000) (1,400)
$ 6,600
Stetson Company Variable Costing I/S For the Y/E Dec. 31, 2001
Rev
- VC
CM
- FC
NI
= 2,000 units × $8.50
CoGS (2,000 units × $2.00 per unit)S&A (2,000 units × $0.50 per unit)
MOHS&A
$ 17,000
(4,000) (1,000)$ 12,000
(10,000) (1,400)
$ 600
The difference in NI 2002:
Units mfg. - units sold× FOH per unitDifference in NI
2,100 $1.00$2,100
Production > SalesAbs. NI is higher!
Sales > ProductionVC NI is higher!
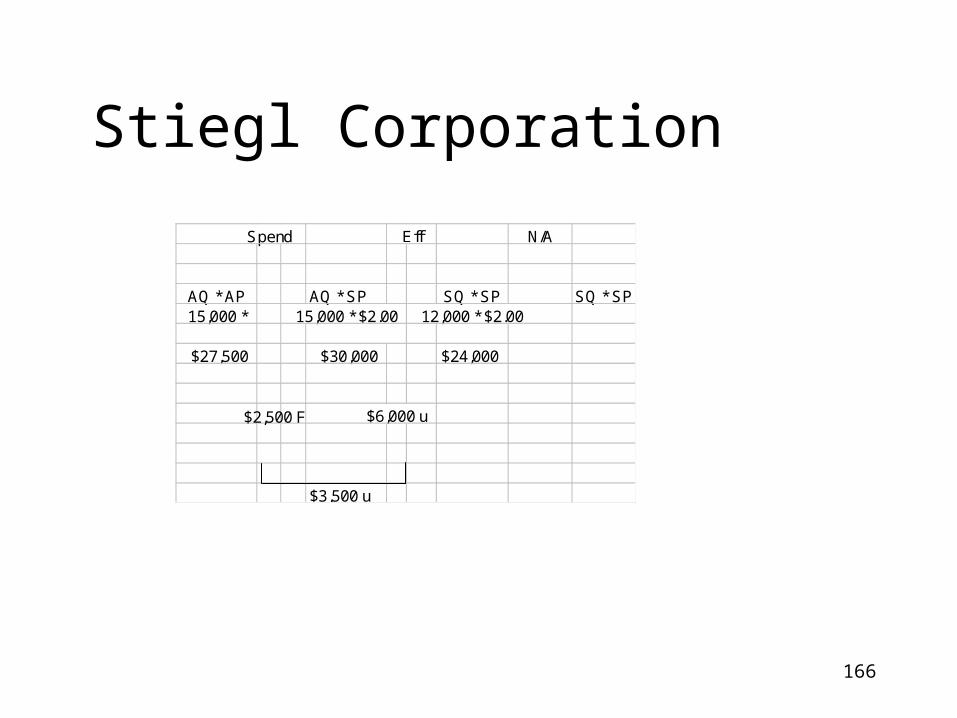
166
Stiegl Corporation
Spend N/A
AQ * AP AQ * SP SQ * SP SQ * SP15,000 * 15,000 * $2.00 12,000 * $2.00
$27,500 $30,000 $24,000
$6,000 u
$3,500 u
Eff
$2,500 F
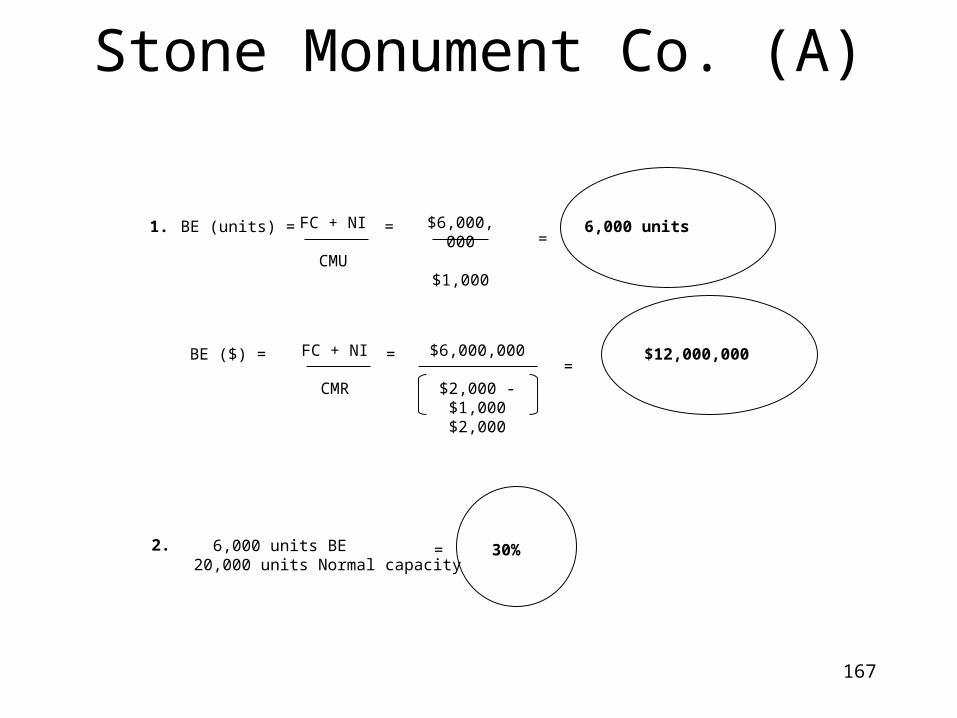
167
Stone Monument Co. (A)
1.
2.
BE (units) = FC + NI
CMU
= $6,000,000
$1,000
=6,000 units
BE ($) = FC + NI
CMR
= $6,000,000
$2,000 - $1,000$2,000
=$12,000,000
6,000 units BE20,000 units Normal capacity
= 30%
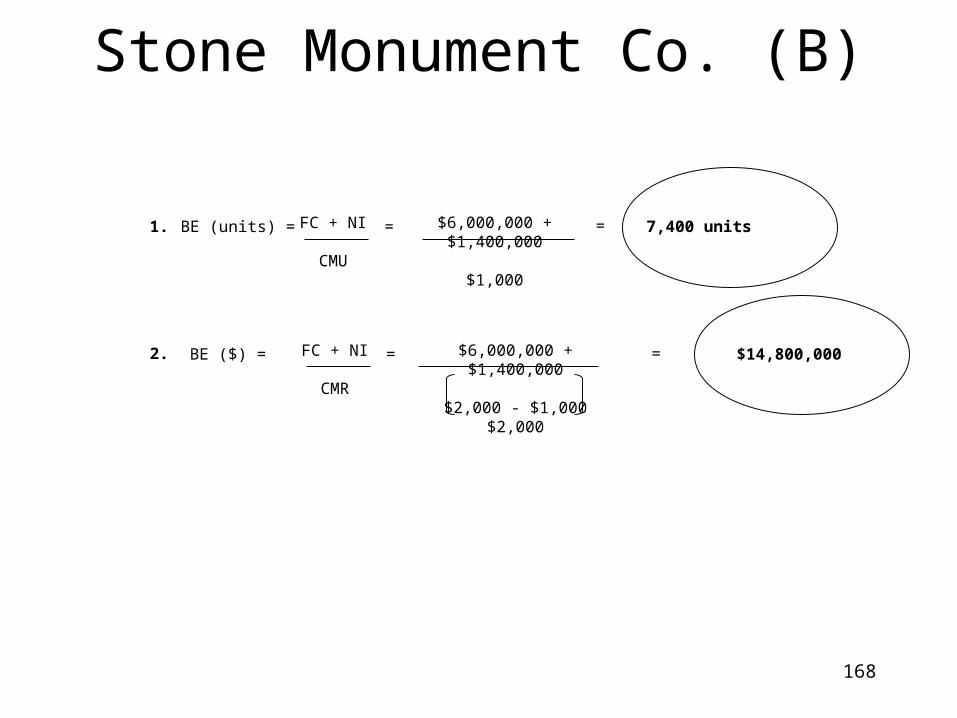
168
Stone Monument Co. (B)
1.
2.
BE (units) = FC + NI
CMU
= $6,000,000 + $1,400,000
$1,000
= 7,400 units
BE ($) = FC + NI
CMR
= $6,000,000 + $1,400,000
$2,000 - $1,000$2,000
= $14,800,000
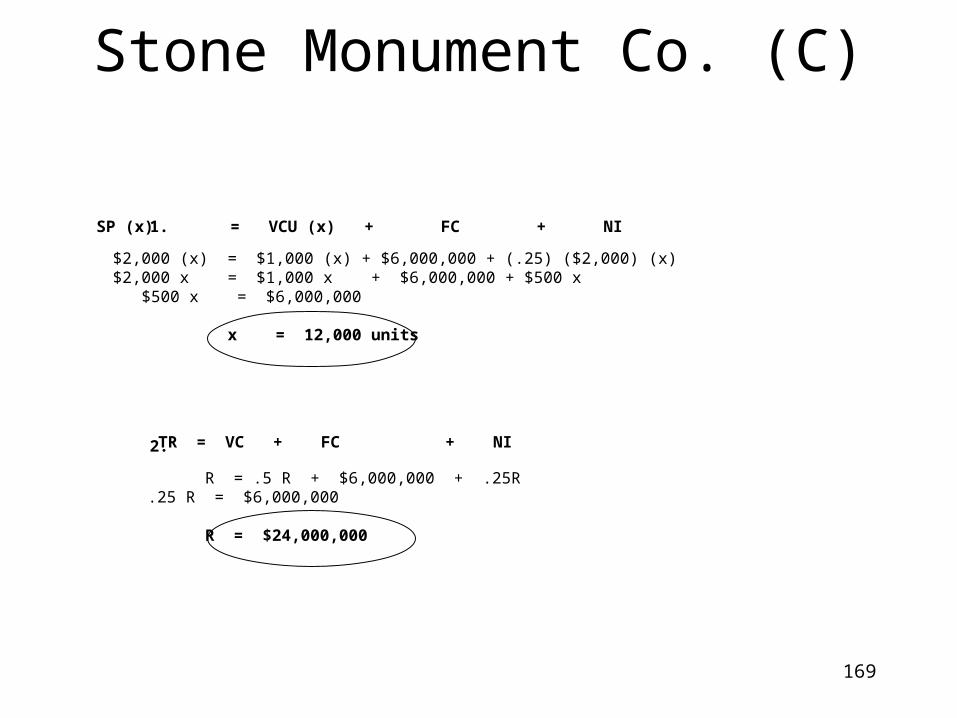
169
Stone Monument Co. (C)
1.
2.
SP (x) = VCU (x) + FC + NI
$2,000 (x) = $1,000 (x) + $6,000,000 + (.25) ($2,000) (x)$2,000 x = $1,000 x + $6,000,000 + $500 x $500 x = $6,000,000
x = 12,000 units
TR = VC + FC + NI
R = .5 R + $6,000,000 + .25R.25 R = $6,000,000
R = $24,000,000
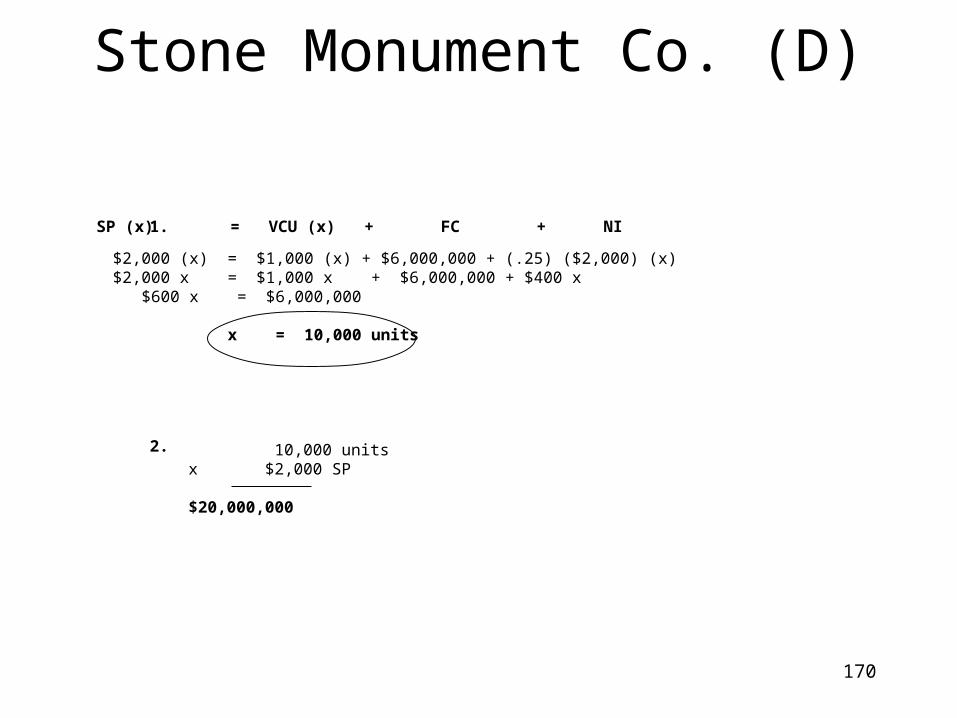
170
Stone Monument Co. (D)
1.
2.
SP (x) = VCU (x) + FC + NI
$2,000 (x) = $1,000 (x) + $6,000,000 + (.25) ($2,000) (x)$2,000 x = $1,000 x + $6,000,000 + $400 x $600 x = $6,000,000
x = 10,000 units
10,000 unitsx $2,000 SP
$20,000,000
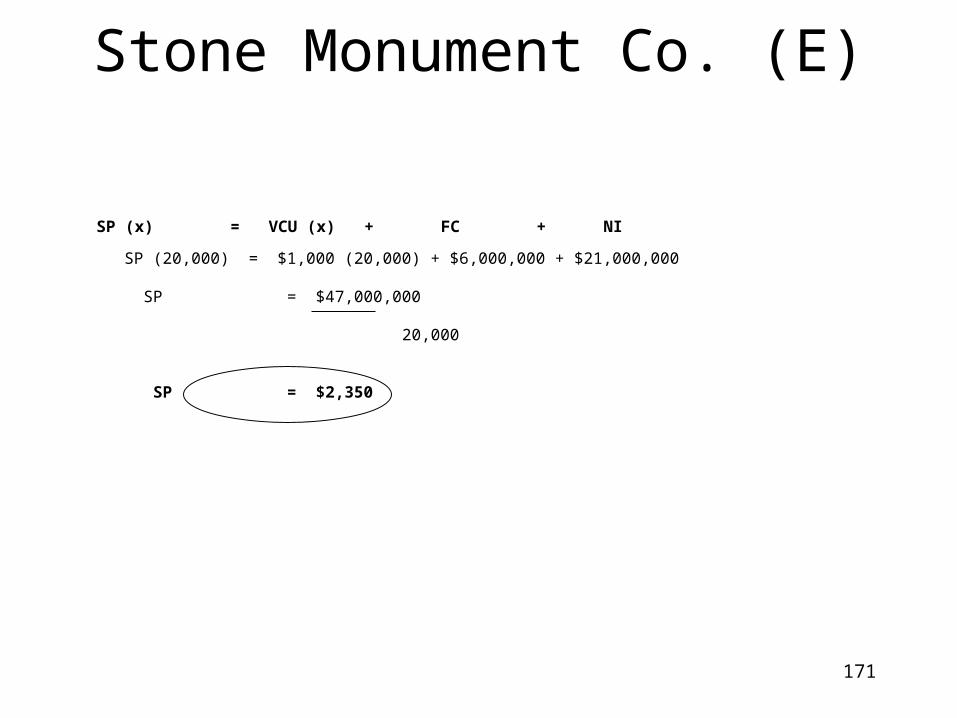
171
Stone Monument Co. (E)
SP (x) = VCU (x) + FC + NI
SP (20,000) = $1,000 (20,000) + $6,000,000 + $21,000,000
SP = $47,000,000
20,000
SP = $2,350
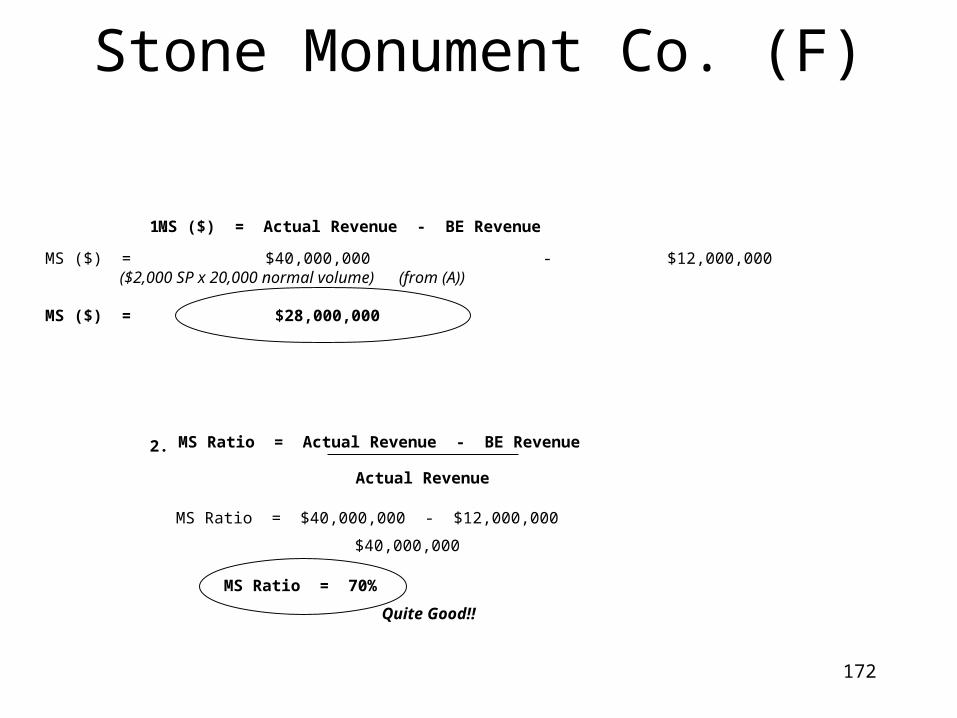
172
Stone Monument Co. (F)
1.
2.
MS ($) = Actual Revenue - BE Revenue
MS ($) = $40,000,000 - $12,000,000 ($2,000 SP x 20,000 normal volume) (from (A)) MS ($) = $28,000,000
MS Ratio = Actual Revenue - BE Revenue
MS Ratio = $40,000,000 - $12,000,000
Actual Revenue
$40,000,000
MS Ratio = 70%
Quite Good!!
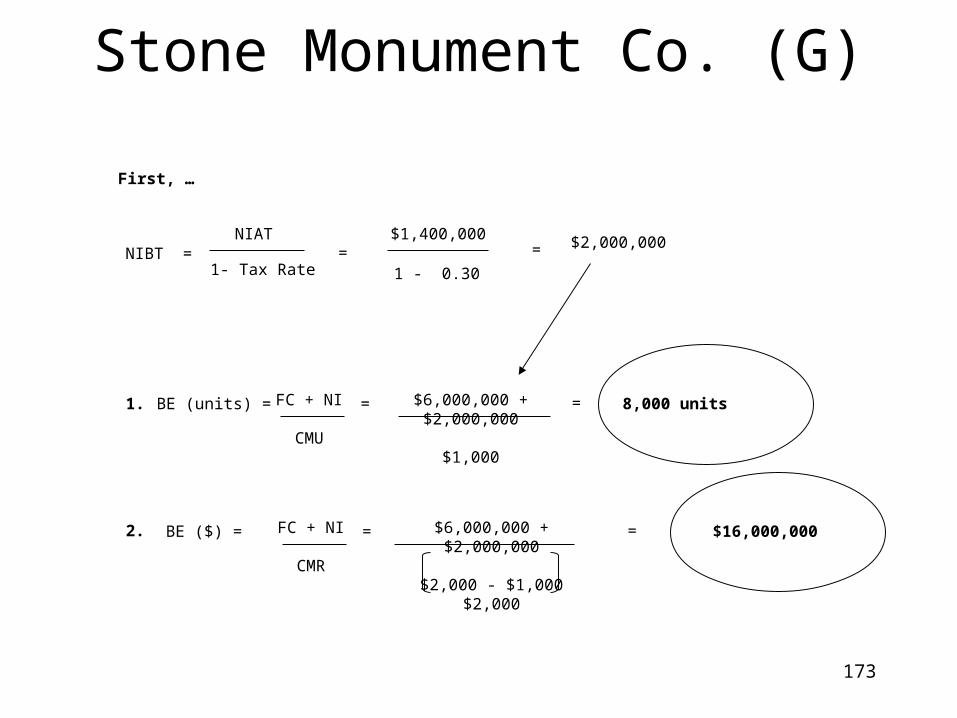
173
Stone Monument Co. (G)
1.
2.
BE (units) = FC + NI
CMU
= $6,000,000 + $2,000,000
$1,000
= 8,000 units
BE ($) = FC + NI
CMR
= $6,000,000 + $2,000,000
$2,000 - $1,000$2,000
= $16,000,000
NIBT = NIAT
1- Tax Rate=
$1,400,000
1 - 0.30
First, …
= $2,000,000
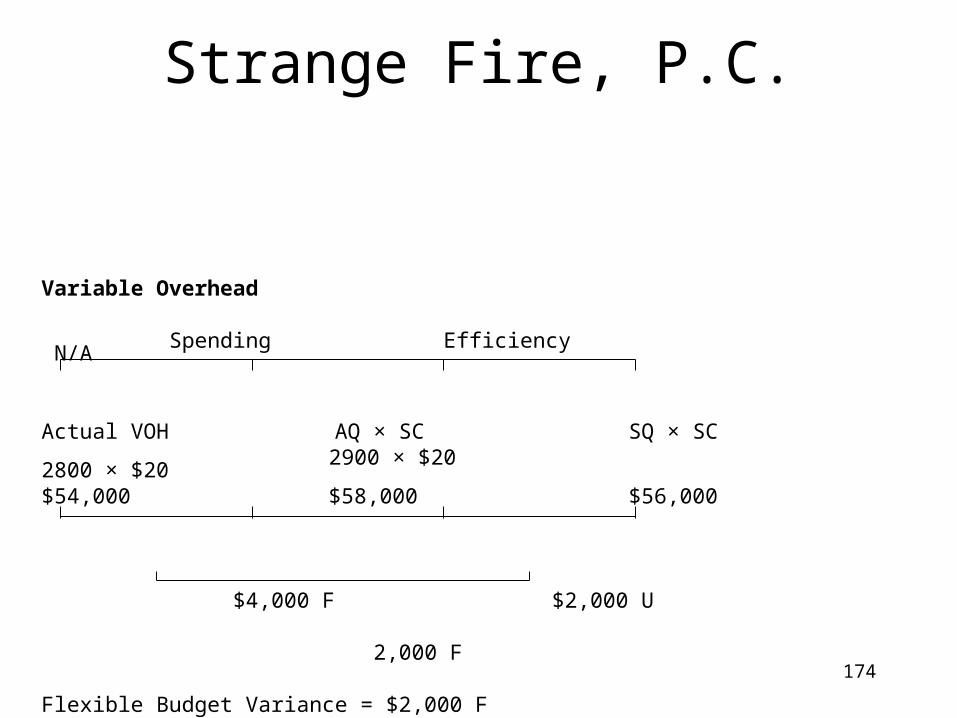
174
Strange Fire, P.C.
Variable Overhead
Spending Efficiency N/A
Actual VOH AQ × SC SQ × SC 2900 × $20 2800 × $20
$54,000 $58,000 $56,000
$4,000 F $2,000 U
2,000 F
Flexible Budget Variance = $2,000 F
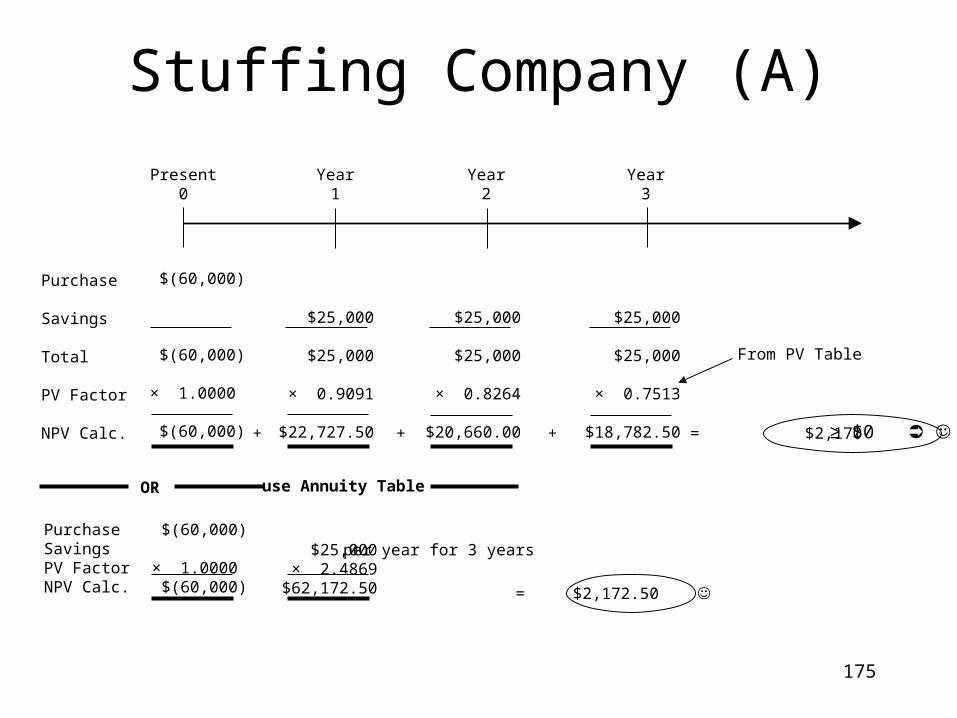
175
Stuffing Company (A)
Present0
Year1
Year2
Year3
Purchase
Savings
Total
PV Factor
NPV Calc.
$(60,000)
$(60,000)
× 1.0000
$(60,000)
$25,000
$25,000
× 0.9091
$22,727.50
$25,000
$25,000
× 0.7513
$18,782.50
$25,000
$25,000
× 0.8264
$20,660.00 = $2,170
From PV Table
≥ $0 ☺
OR use Annuity Table
PurchaseSavingsPV FactorNPV Calc.
$25,000× 2.4869
$62,172.50
per year for 3 years$(60,000)
× 1.0000 $(60,000) = $2,172.50 ☺
+ ++
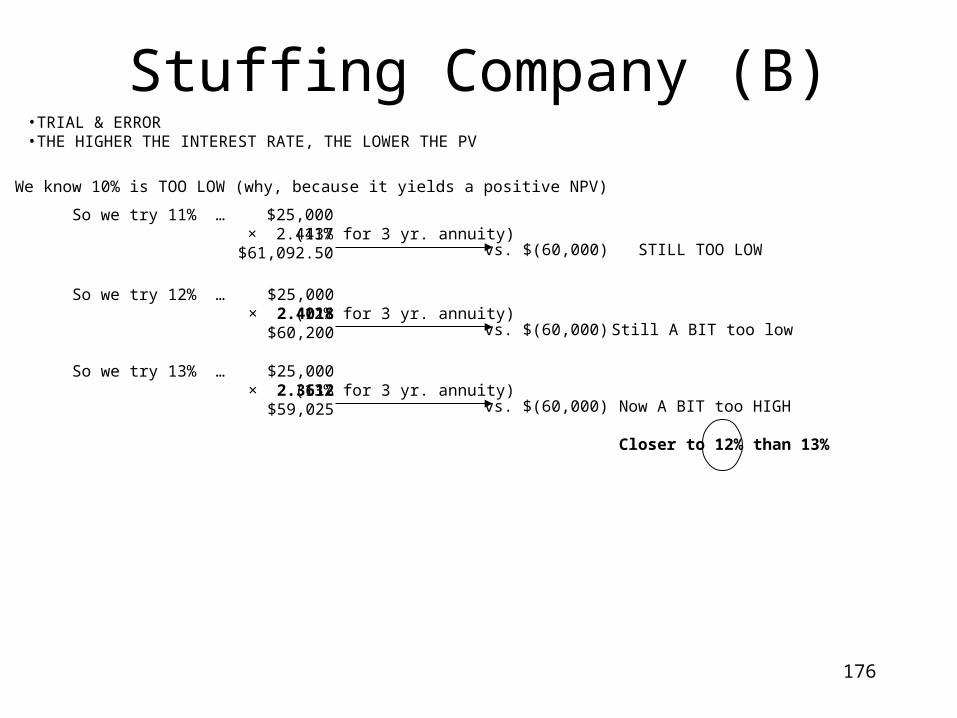
176
Stuffing Company (B)•TRIAL & ERROR•THE HIGHER THE INTEREST RATE, THE LOWER THE PV
We know 10% is TOO LOW (why, because it yields a positive NPV)
So we try 11% … $25,000× 2.4437
$61,092.50(11% for 3 yr. annuity)
vs. $(60,000) STILL TOO LOW
So we try 12% … $25,000× 2.4018
$60,200(12% for 3 yr. annuity)
vs. $(60,000) Still A BIT too low
So we try 13% … $25,000× 2.3612
$59,025(13% for 3 yr. annuity)
vs. $(60,000) Now A BIT too HIGH
Closer to 12% than 13%
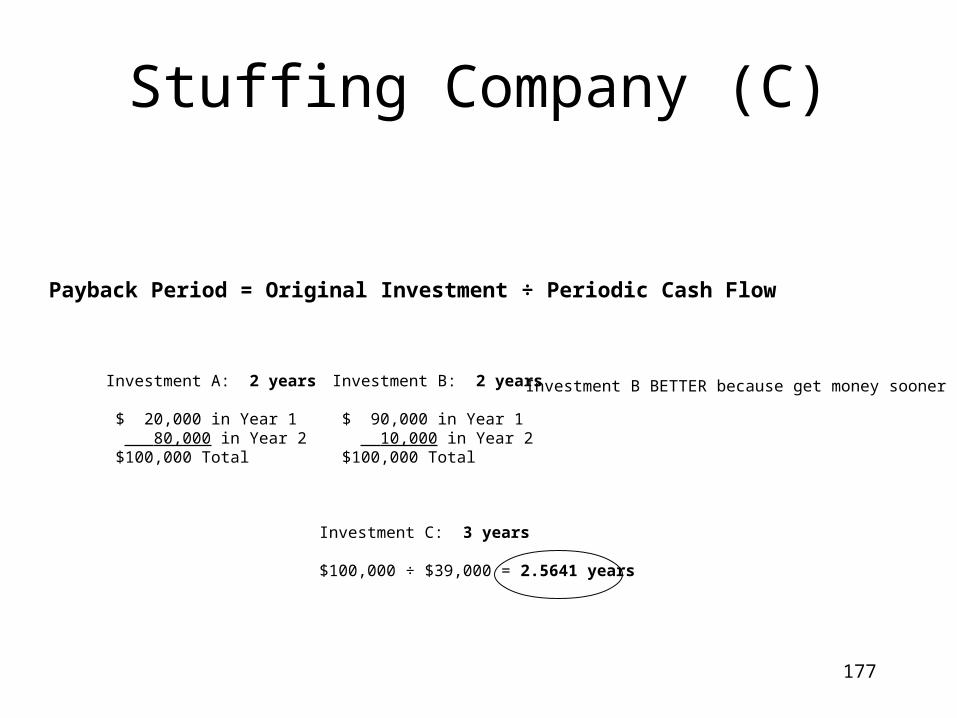
177
Stuffing Company (C)
Investment A: 2 years
$ 20,000 in Year 1 80,000 in Year 2 $100,000 Total
Investment B: 2 years
$ 90,000 in Year 1 10,000 in Year 2 $100,000 Total
Investment B BETTER because get money sooner
Payback Period = Original Investment ÷ Periodic Cash Flow
Investment C: 3 years
$100,000 ÷ $39,000 = 2.5641 years
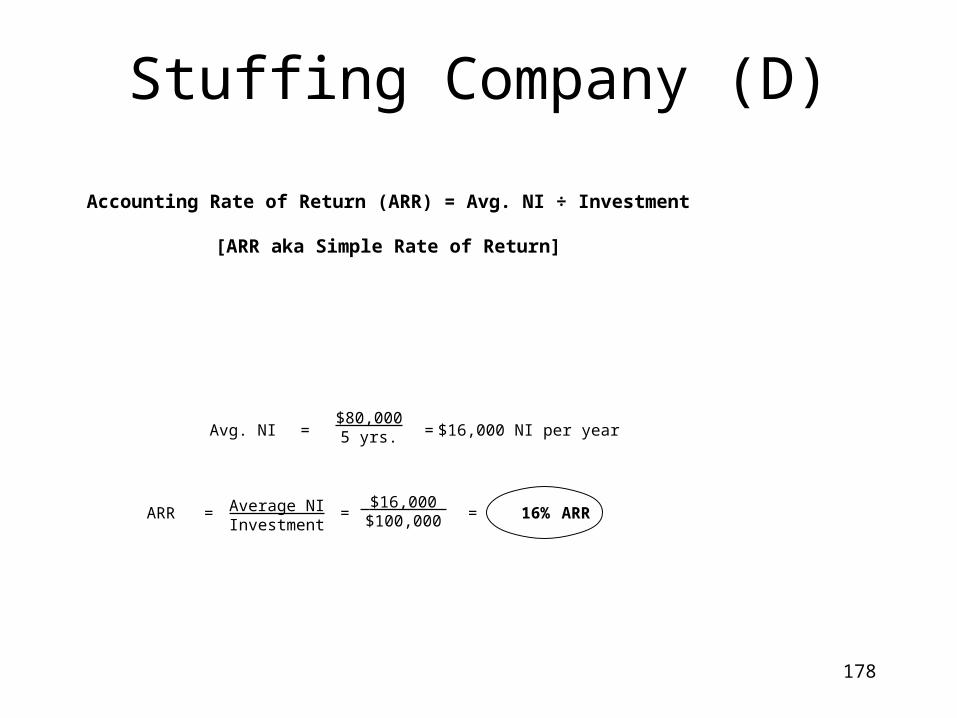
178
Stuffing Company (D)
Accounting Rate of Return (ARR) = Avg. NI ÷ Investment
[ARR aka Simple Rate of Return]
Avg. NI =$80,000
5 yrs. = $16,000 NI per year
Average NIInvestment
= $16,000 $100,000 = 16% ARRARR =
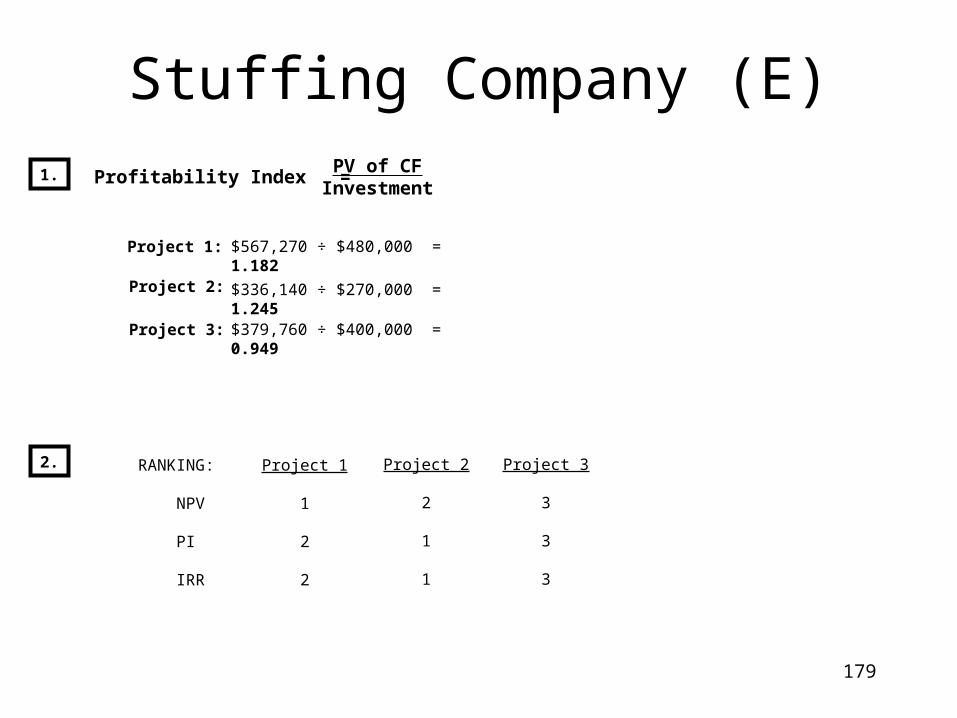
179
Stuffing Company (E)
Profitability Index = PV of CF
Investment
Project 1:
Project 2:
Project 3:
$567,270 ÷ $480,000 = 1.182
$336,140 ÷ $270,000 = 1.245
$379,760 ÷ $400,000 = 0.949
RANKING:
NPV
PI
IRR
Project 1
1
2
2
Project 2
2
1
1
Project 3
3
3
3
1.
2.
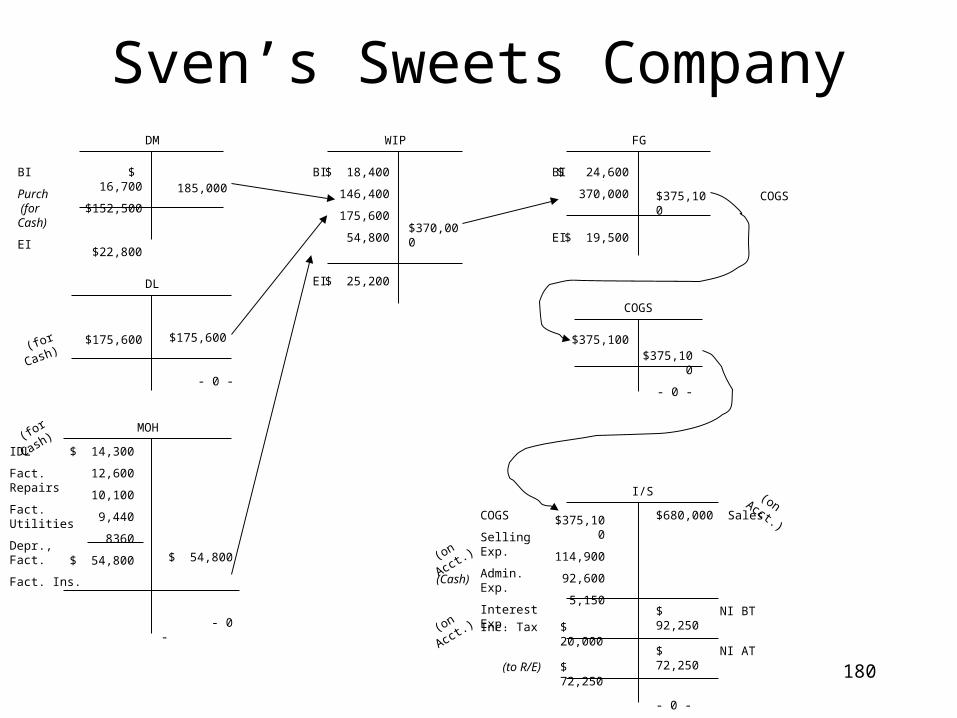
180
$ 16,700
$152,500
$22,800
185,000
DM
BI
Purch (for Cash)
EI
$ 18,400
146,400
175,600
54,800
$ 25,200
$370,000
BI
EI
WIP
$ 24,600
370,000
$ 19,500
$375,100
BI
EI
FG
$175,600 $175,600
- 0 -
DL
MOH
$ 14,300
12,600
10,100
9,440
8360
$ 54,800 $ 54,800
- 0 -
IDL
Fact. Repairs
Fact. Utilities
Depr., Fact.
Fact. Ins.
COGS
I/S
$375,100
114,900
92,600
5,150
$680,000COGS
Selling Exp.
Admin. Exp.
Interest Exp.
Sales
NI BT
$375,100
- 0 -
$375,100
COGS
Sven’s Sweets Company
(for Cash)
(for C
ash)
(on Acct.)
(on Acct.)
$ 92,250$ 20,000Inc. Tax (o
n Acct.)
NI AT$ 72,250$ 72,250
- 0 -
(Cash)
(to R/E)
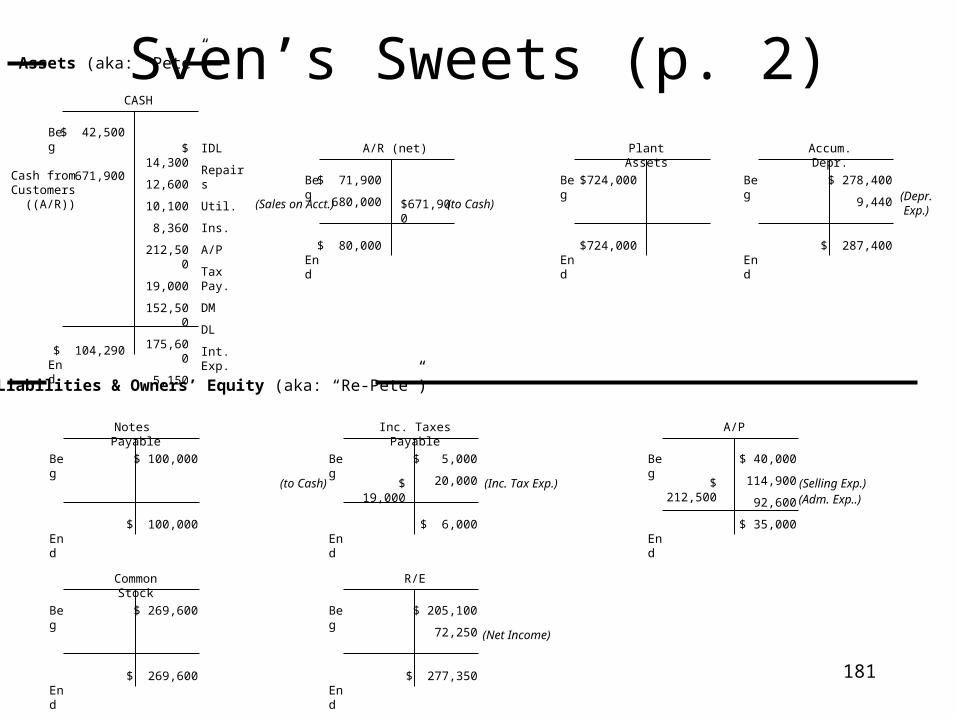
181
Sven’s Sweets (p. 2)$ 42,500
671,900
$ 104,290
$ 14,300
12,600
10,100
8,360
212,500
19,000
152,500
175,600
5,150
Beg
End
CASH
Assets (aka: “Pete”)
$ 71,900
680,000
$ 80,000
$671,900
Beg
End
A/R (net)
$724,000
$724,000
Beg
End
Plant Assets
$ 278,400
9,440
$ 287,400
Beg
End
Accum. Depr.
Cash fromCustomers
((A/R))
IDL
Repairs
Util.
Ins.
A/P
Tax Pay.
DM
DL
Int. Exp.
Liabilities & Owners’ Equity (aka: “Re-Pete”)
$ 100,000
$ 100,000
Beg
End
Notes Payable
$ 5,000
20,000
$ 6,000
Beg
End
Inc. Taxes Payable
$ 40,000
114,900
92,600
$ 35,000
Beg
End
A/P
$ 269,600
$ 269,600
Beg
End
Common Stock
$ 205,100
72,250
$ 277,350
Beg
End
R/E
$ 19,000 $ 212,500(Inc. Tax Exp.)(to Cash)
(to Cash)(Sales on Acct.)(Depr.Exp.)
(Net Income)
(Selling Exp.)(Adm. Exp..)
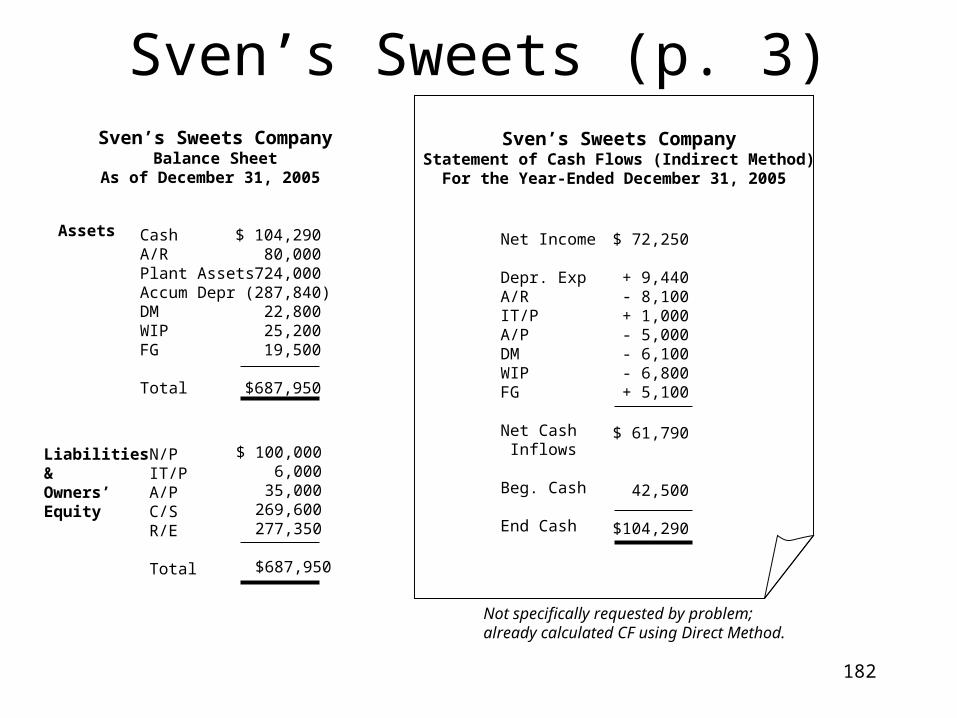
182
Sven’s Sweets (p. 3)Sven’s Sweets Company
Balance SheetAs of December 31, 2005
Assets CashA/RPlant AssetsAccum DeprDMWIPFG
Total
$ 104,290 80,000
724,000 (287,840)
22,800 25,200 19,500
$687,950
Liabilities& Owners’Equity
N/PIT/PA/PC/SR/E
Total
$ 100,000 6,000
35,000 269,600 277,350
$687,950
Sven’s Sweets CompanyStatement of Cash Flows (Indirect Method)
For the Year-Ended December 31, 2005
Net Income
Depr. ExpA/RIT/PA/PDMWIPFG
Net Cash Inflows
Beg. Cash
End Cash
$ 72,250
+ 9,440- 8,100+ 1,000- 5,000- 6,100- 6,800+ 5,100
$ 61,790
42,500
$104,290
Not specifically requested by problem;already calculated CF using Direct Method.
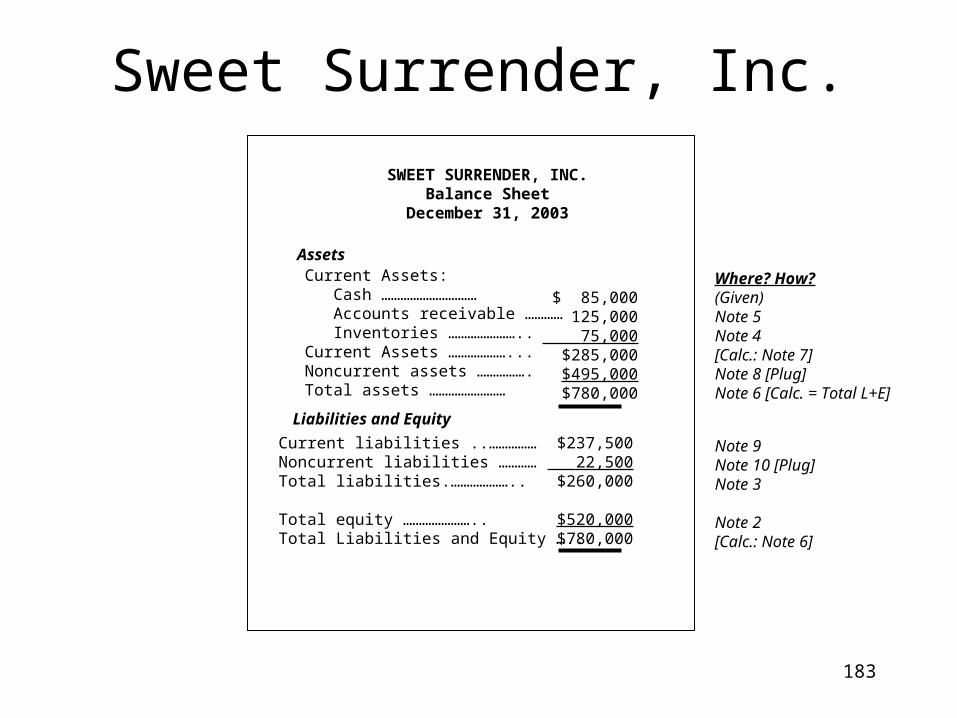
183
Sweet Surrender, Inc.
SWEET SURRENDER, INC.Balance Sheet
December 31, 2003
AssetsCurrent Assets: Cash ………………………… Accounts receivable ………… Inventories …………………..Current Assets ………………...Noncurrent assets …………….Total assets ……………………
Liabilities and Equity
Current liabilities ..……………Noncurrent liabilities …………Total liabilities.………………..
Total equity …………………..Total Liabilities and Equity …..
$ 85,000125,000
75,000$285,000$495,000$780,000
$237,500 22,500
$260,000
$520,000$780,000
Where? How?(Given)Note 5Note 4[Calc.: Note 7]Note 8 [Plug]Note 6 [Calc. = Total L+E]
Note 9Note 10 [Plug]Note 3
Note 2[Calc.: Note 6]
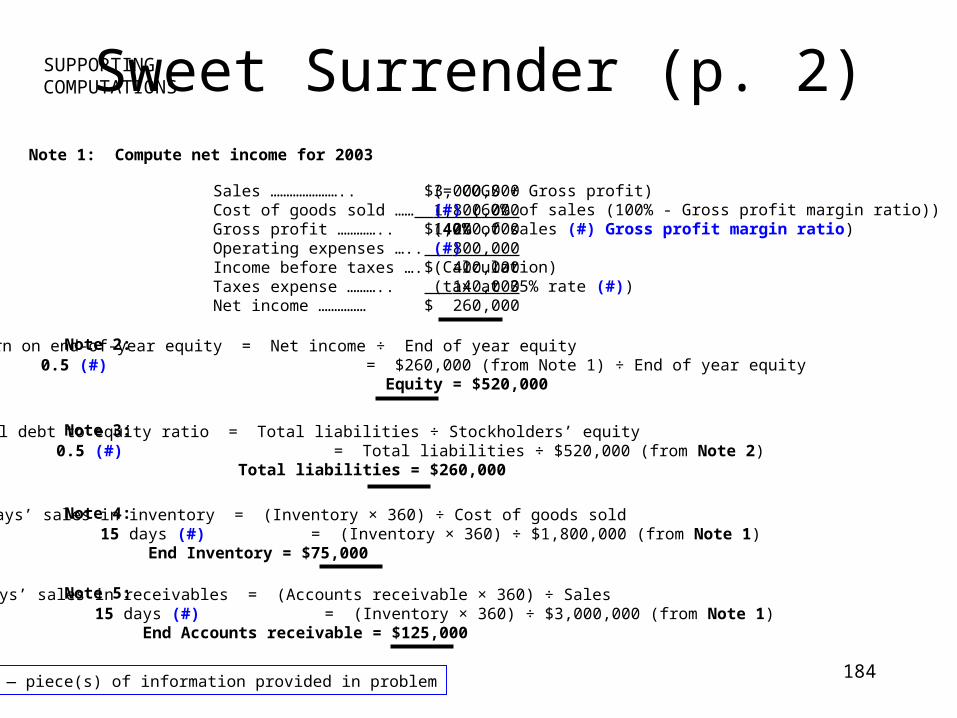
184
Return on end-of-year equity = Net income ÷ End of year equity 0.5 (#) = $260,000 (from Note 1) ÷ End of year equity Equity = $520,000
Total debt to equity ratio = Total liabilities ÷ Stockholders’ equity 0.5 (#) = Total liabilities ÷ $520,000 (from Note 2) Total liabilities = $260,000
Days’ sales in inventory = (Inventory × 360) ÷ Cost of goods sold 15 days (#) = (Inventory × 360) ÷ $1,800,000 (from Note 1) End Inventory = $75,000
Days’ sales in receivables = (Accounts receivable × 360) ÷ Sales 15 days (#) = (Inventory × 360) ÷ $3,000,000 (from Note 1) End Accounts receivable = $125,000
Note 1: Compute net income for 2003
Sales …………………..Cost of goods sold ……Gross profit …………..Operating expenses …..Income before taxes ….Taxes expense ………..Net income ……………
$3,000,000 1,800,000$1,200,000 800,000$ 400,000 140,000$ 260,000
(= COGS + Gross profit)(#) (60% of sales (100% - Gross profit margin ratio))(40% of sales (#) Gross profit margin ratio)(#)(Calculation)(tax at 35% rate (#))
Sweet Surrender (p. 2)SUPPORTINGCOMPUTATIONS
Note 2:
Note 3:
Note 4:
(#) — piece(s) of information provided in problem
Note 5:
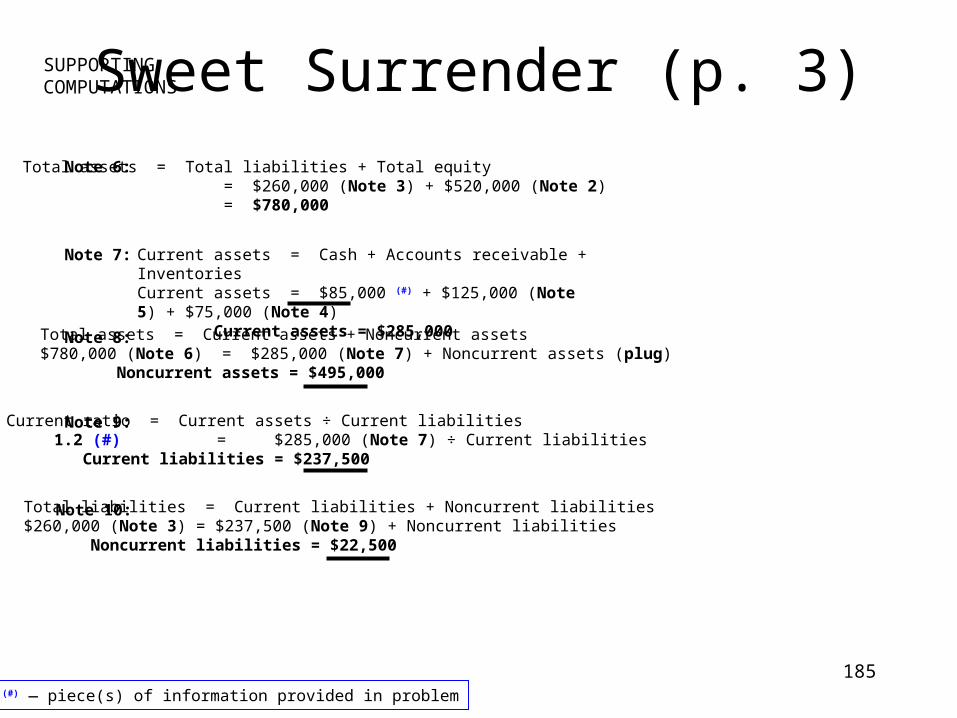
185
Note 10: Total liabilities = Current liabilities + Noncurrent liabilities$260,000 (Note 3) = $237,500 (Note 9) + Noncurrent liabilities Noncurrent liabilities = $22,500
Current assets = Cash + Accounts receivable + InventoriesCurrent assets = $85,000 (#) + $125,000 (Note 5) + $75,000 (Note 4) Current assets = $285,000
Current ratio = Current assets ÷ Current liabilities 1.2 (#) = $285,000 (Note 7) ÷ Current liabilities Current liabilities = $237,500
Sweet Surrender (p. 3)
Note 7:
Total assets = Current assets + Noncurrent assets$780,000 (Note 6) = $285,000 (Note 7) + Noncurrent assets (plug) Noncurrent assets = $495,000
SUPPORTINGCOMPUTATIONS
Note 9:
Note 8:
Total assets = Total liabilities + Total equity = $260,000 (Note 3) + $520,000 (Note 2) = $780,000
Note 6:
(#) or (#) — piece(s) of information provided in problem
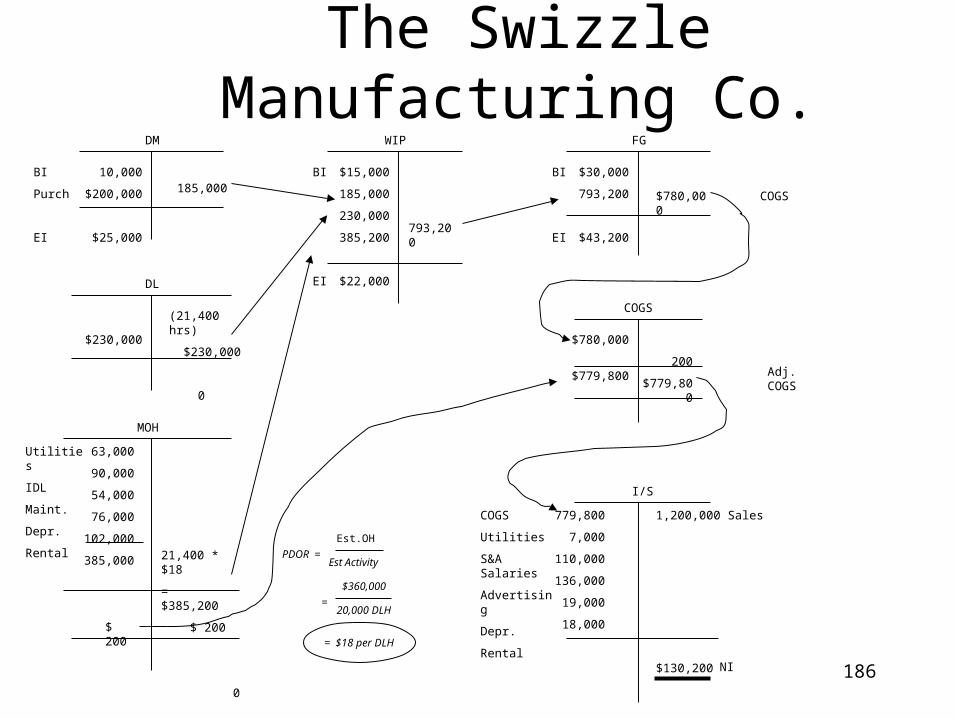
186
The Swizzle Manufacturing Co.
10,000
$200,000
$25,000
185,000
DM
BI
Purch
EI
$15,000
185,000
230,000
385,200
$22,000
793,200
BI
EI
WIP
$30,000
793,200
$43,200
$780,000
BI
EI
FG
$230,000
(21,400 hrs)
$230,000
0
DL
MOH
63,000
90,000
54,000
76,000
102,000
385,000 21,400 * $18
= $385,200
$ 200
0
Utilities
IDL
Maint.
Depr.
Rental
COGS
I/S
779,800
7,000
110,000
136,000
19,000
18,000
1,200,000
$130,200
COGS
Utilities
S&A Salaries
Advertising
Depr.
Rental
Sales
NI
Est.OH
Est Activity
$360,000
20,000 DLH
= $18 per DLH
200
$779,800
$ 200
$780,000
$779,800 Adj. COGS
PDOR =
=
COGS
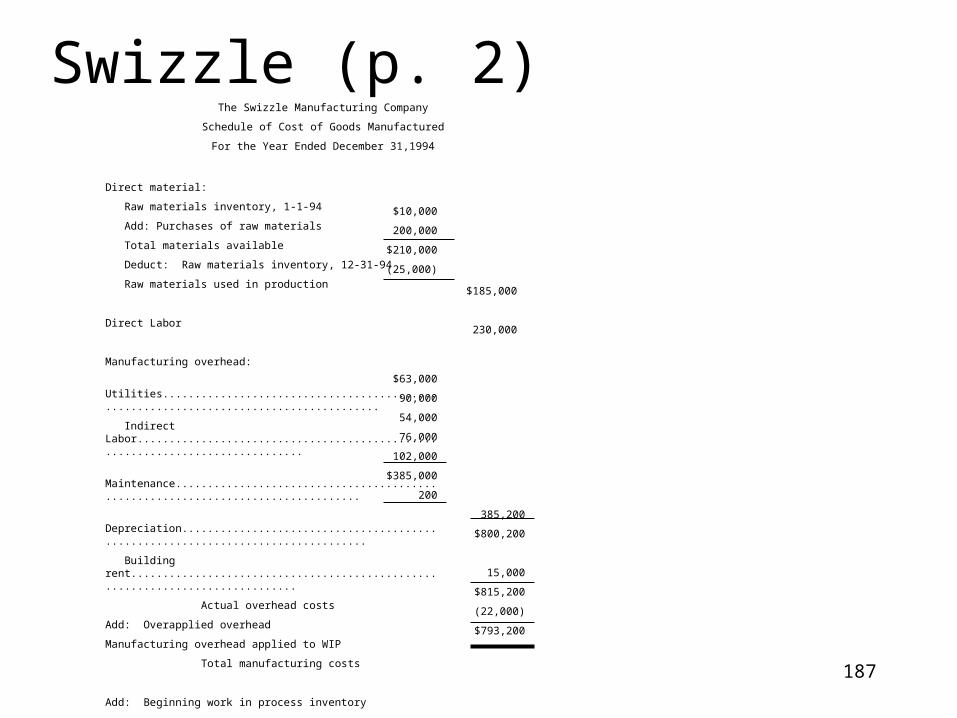
187
Swizzle (p. 2)The Swizzle Manufacturing Company
Schedule of Cost of Goods Manufactured
For the Year Ended December 31,1994
Direct material:
Raw materials inventory, 1-1-94
Add: Purchases of raw materials
Total materials available
Deduct: Raw materials inventory, 12-31-94
Raw materials used in production
Direct Labor
Manufacturing overhead:
Utilities......................................................................................
Indirect Labor..............................................................................
Maintenance.................................................................................
Depreciation.................................................................................
Building rent..............................................................................
Actual overhead costs
Add: Overapplied overhead
Manufacturing overhead applied to WIP
Total manufacturing costs
Add: Beginning work in process inventory
Deduct: Ending work in process inventory
Cost of Goods Manufactured
$10,000
200,000
$210,000
(25,000)
$185,000
230,000
$63,000
90,000
54,000
76,000
102,000
$385,000
200
385,200
$800,200
15,000
$815,200
(22,000)
$793,200
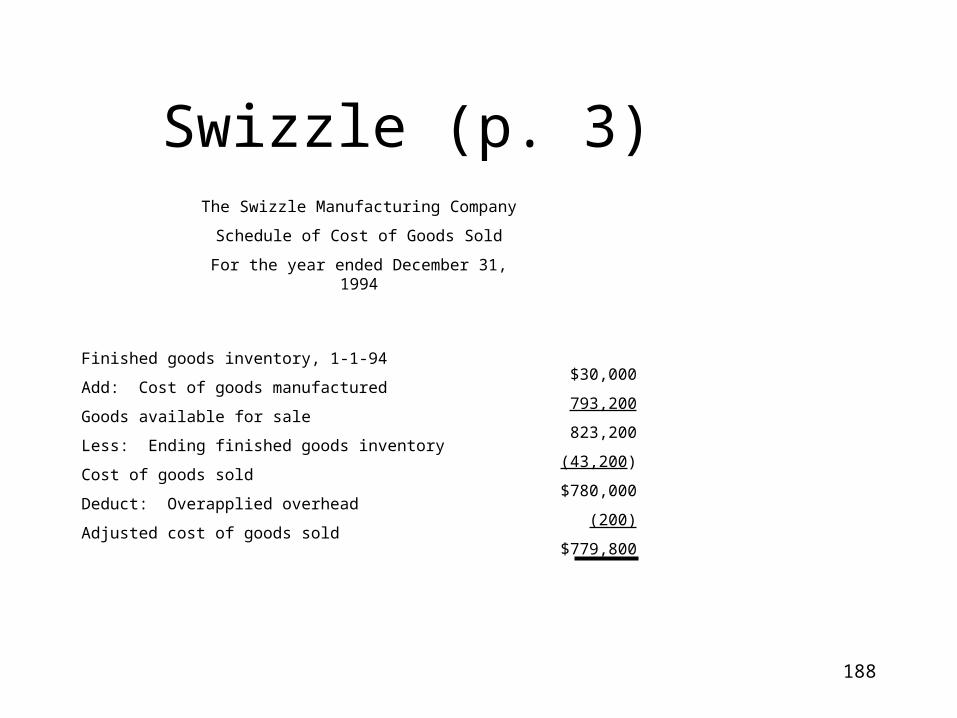
188
Swizzle (p. 3)The Swizzle Manufacturing Company
Schedule of Cost of Goods Sold
For the year ended December 31, 1994
Finished goods inventory, 1-1-94
Add: Cost of goods manufactured
Goods available for sale
Less: Ending finished goods inventory
Cost of goods sold
Deduct: Overapplied overhead
Adjusted cost of goods sold
$30,000
793,200
823,200
(43,200)
$780,000
(200)
$779,800
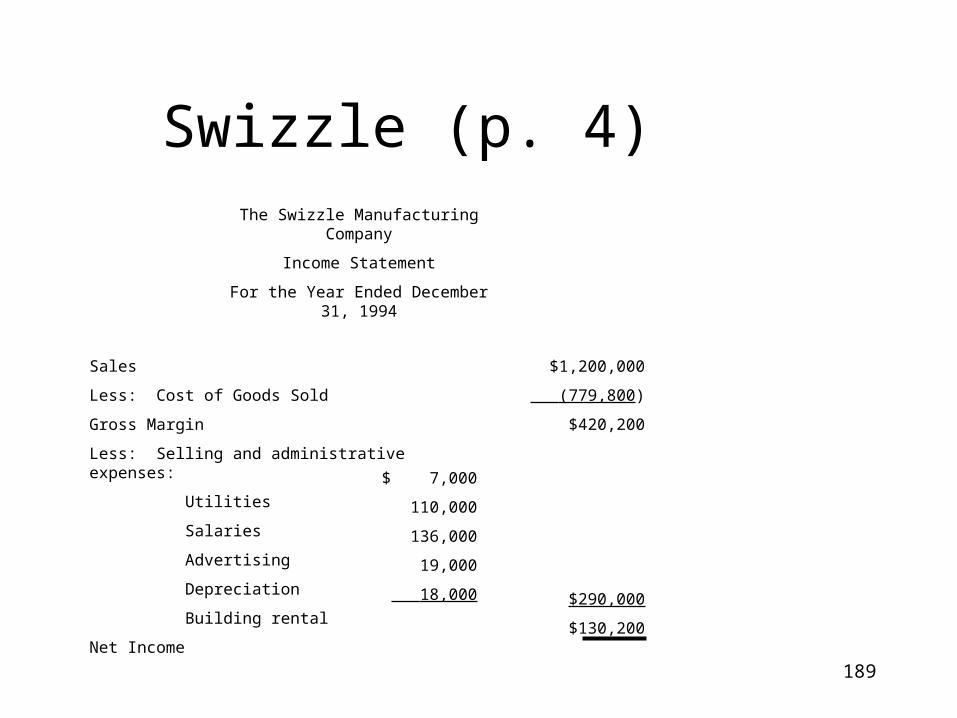
189
Swizzle (p. 4)The Swizzle Manufacturing Company
Income Statement
For the Year Ended December 31, 1994
Sales
Less: Cost of Goods Sold
Gross Margin
Less: Selling and administrative expenses:
Utilities
Salaries
Advertising
Depreciation
Building rental
Net Income
$1,200,000
(779,800)
$420,200
$290,000
$130,200
$ 7,000
110,000
136,000
19,000
18,000
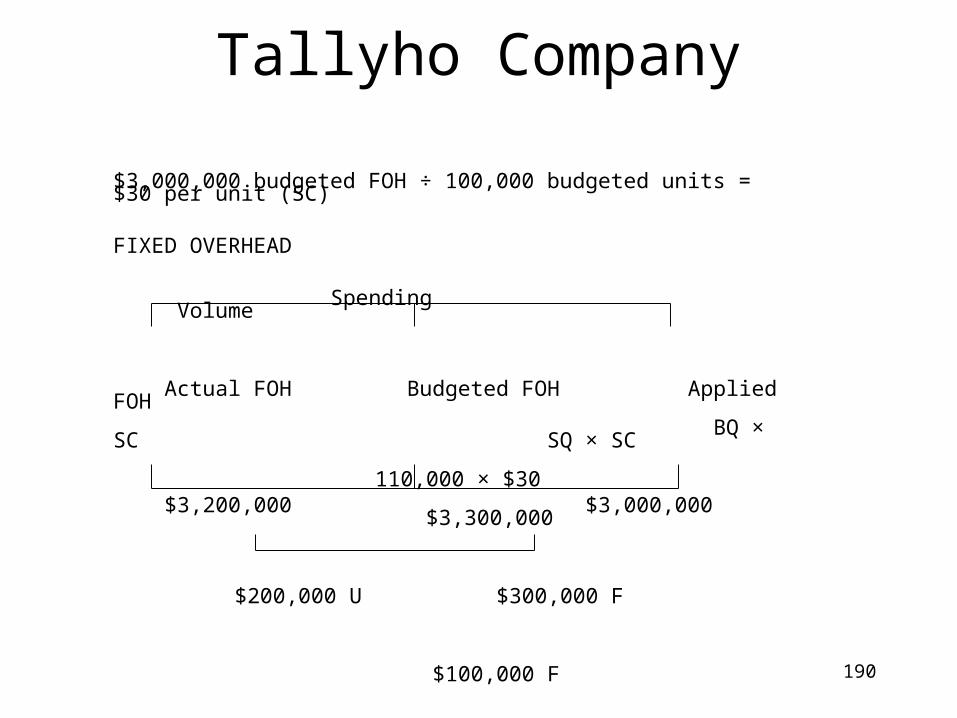
190
Tallyho Company
$3,000,000 budgeted FOH ÷ 100,000 budgeted units = $30 per unit (SC)
FIXED OVERHEAD Spending Volume Actual FOH Budgeted FOH Applied FOH BQ × SC SQ × SC 110,000 × $30 $3,200,000 $3,000,000 $3,300,000
$200,000 U $300,000 F
$100,000 F
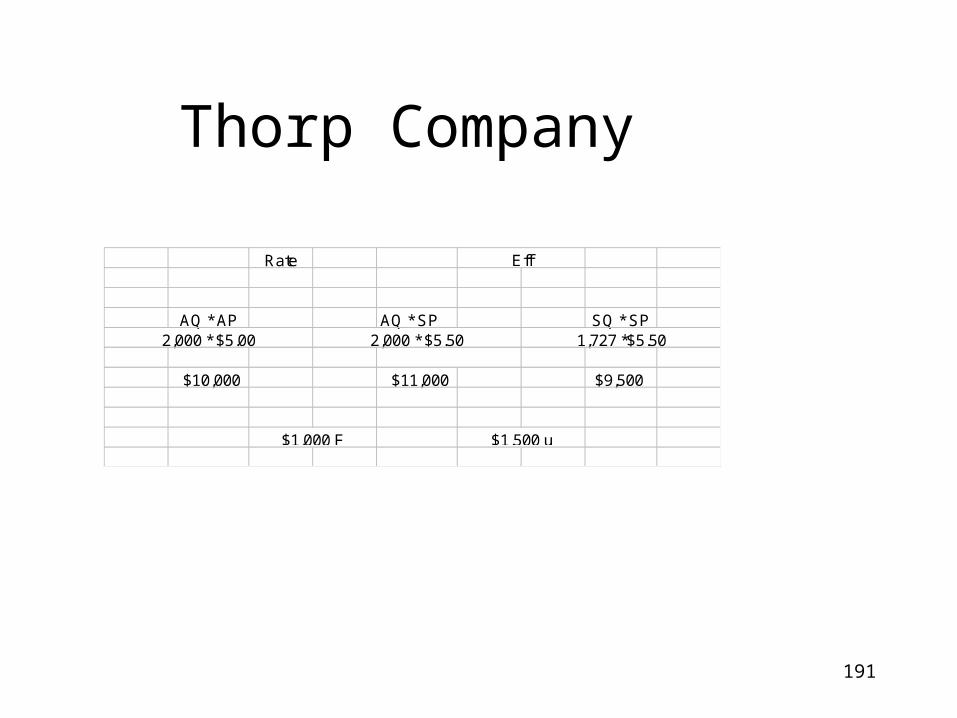
191
Thorp Company
Rate
AQ * AP AQ * SP SQ * SP2,000 * $5.00 2,000 * $5.50 1,727 *$5.50
$10,000 $11,000 $9,500
$1,000 F
Eff
$1,500 u
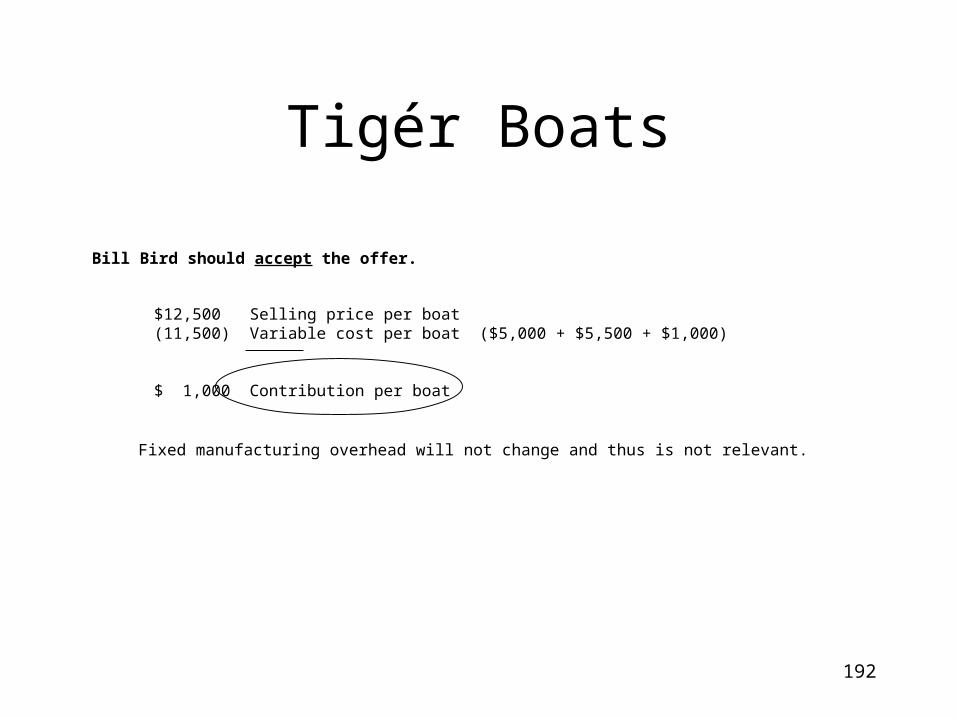
192
Tigér Boats
Bill Bird should accept the offer.
$12,500 Selling price per boat(11,500) Variable cost per boat ($5,000 + $5,500 + $1,000)
$ 1,000 Contribution per boat
Fixed manufacturing overhead will not change and thus is not relevant.

193
…can sell just milk, or can process the milk further into cheese, ice cream and yogurt Product: Cheese Ice Cream ButterSales value at split off (i.e., milk) $400,000 $500,000 $100,000Sales value if processed further $450,000 $679,000 $110,000Cost of further processing $ 17,000 $103,000 $ 14,000 Joint costs $150,000Joint costs are allocated by the sales value at split off Relevant!
Cost $400,000 $17,000 $450,000 Cheese :o)
Raw Milk - Joint Costs $150,000 $500,000 $103,000 $679,000 Ice Cream :o)
$100,000 $14,000 $110,000 Butter :o(
$1,000,000 revenue from selling product just as milk
Tillamook Cheese Co.
Cost to produce butter from milk higher than the increased revenue
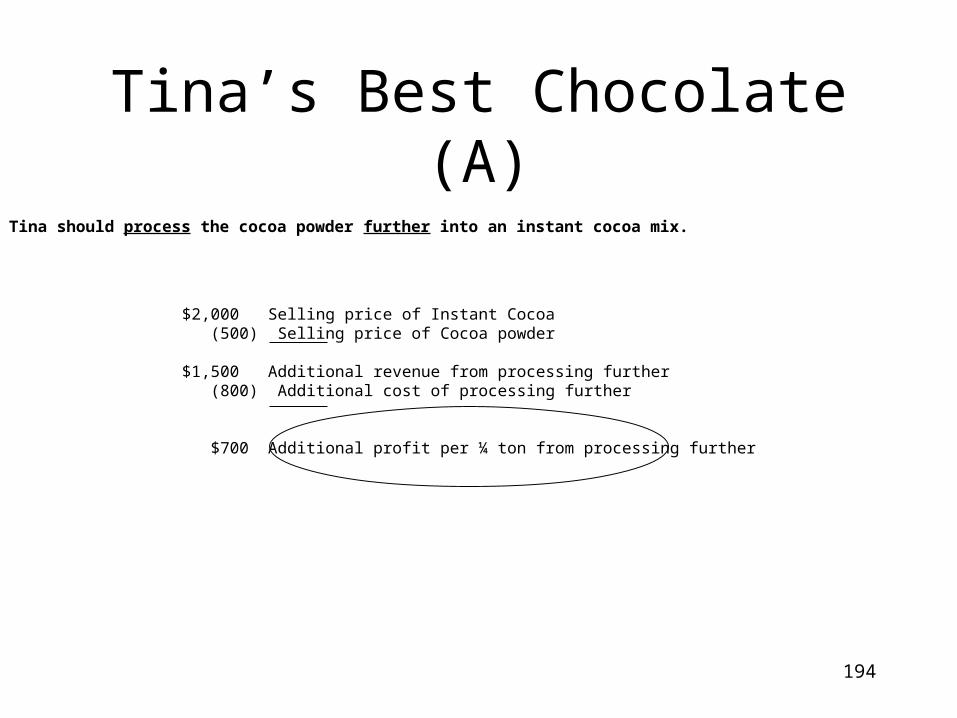
194
Tina’s Best Chocolate (A)
Tina should process the cocoa powder further into an instant cocoa mix.
$2,000 Selling price of Instant Cocoa (500) Selling price of Cocoa powder
$1,500 Additional revenue from processing further (800) Additional cost of processing further
$700 Additional profit per ¼ ton from processing further
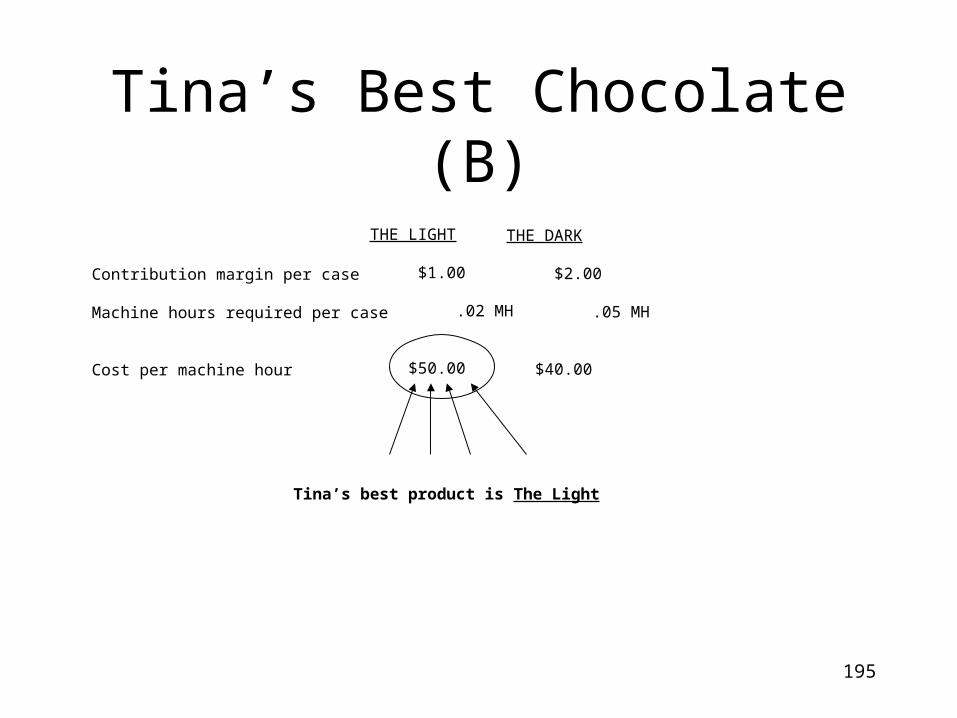
195
Tina’s Best Chocolate (B)
Contribution margin per case
Machine hours required per case
Cost per machine hour
THE LIGHT
$1.00
.02 MH
$50.00
THE DARK
$2.00
.05 MH
$40.00
Tina’s best product is The Light
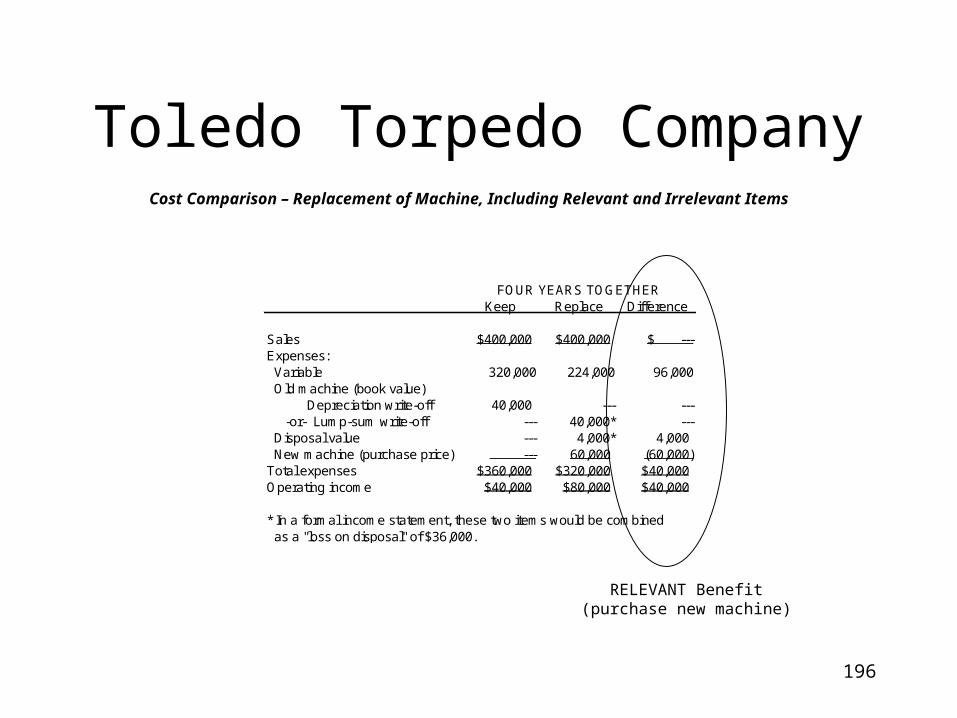
196
Toledo Torpedo CompanyCost Comparison – Replacement of Machine, Including Relevant and Irrelevant Items
Keep Replace Difference
Sales $400,000 $400,000 $ ---Expenses: Variable 320,000 224,000 96,000 Old machine (book value) Depreciation write-off 40,000 --- --- -or- Lump-sum write-off --- 40,000* --- Disposal value --- 4,000* 4,000 New machine (purchase price) --- 60,000 (60,000)Total expenses $360,000 $320,000 $40,000Operating income $40,000 $80,000 $40,000
* In a formal income statement, these two items would be combined as a "loss on disposal" of $36,000.
FOUR YEARS TOGETHER
RELEVANT Benefit(purchase new machine)
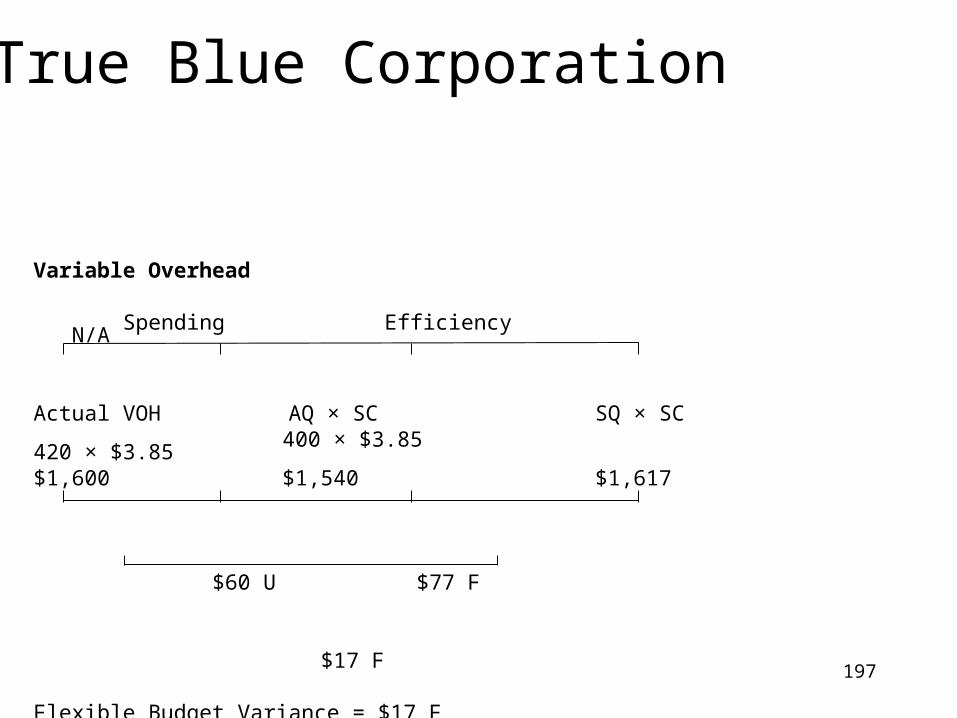
197
True Blue Corporation
Variable Overhead
Spending Efficiency N/A
Actual VOH AQ × SC SQ × SC 400 × $3.85 420 × $3.85
$1,600 $1,540 $1,617
$60 U $77 F
$17 F
Flexible Budget Variance = $17 F
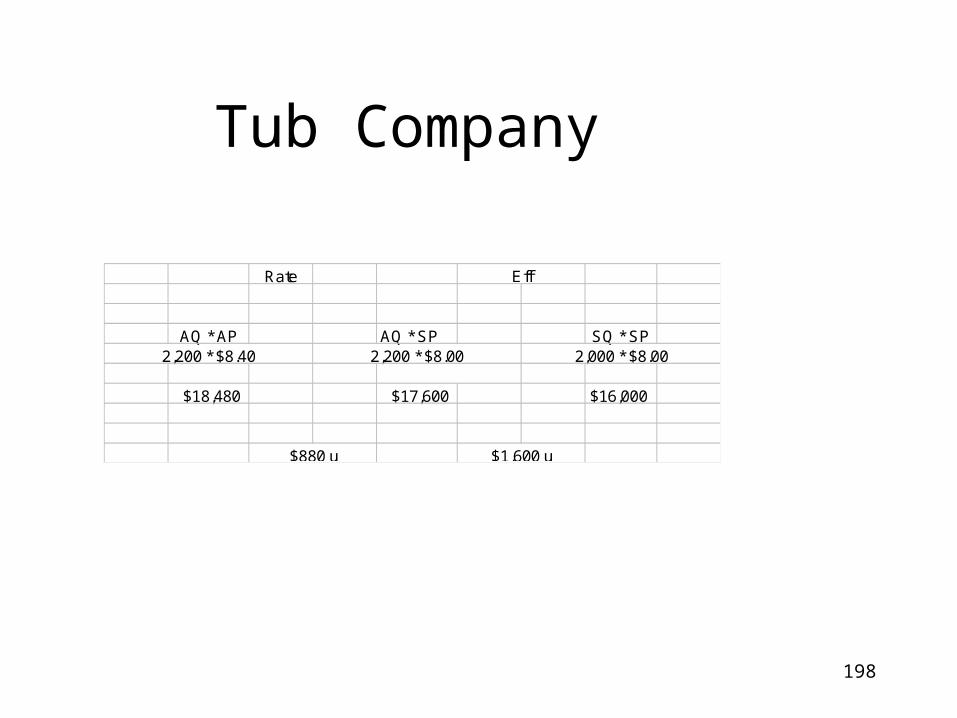
198
Tub Company
Rate
AQ * AP AQ * SP SQ * SP2,200 * $8.40 2,200 * $8.00 2,000 * $8.00
$18,480 $17,600 $16,000
$880 u
Eff
$1,600 u
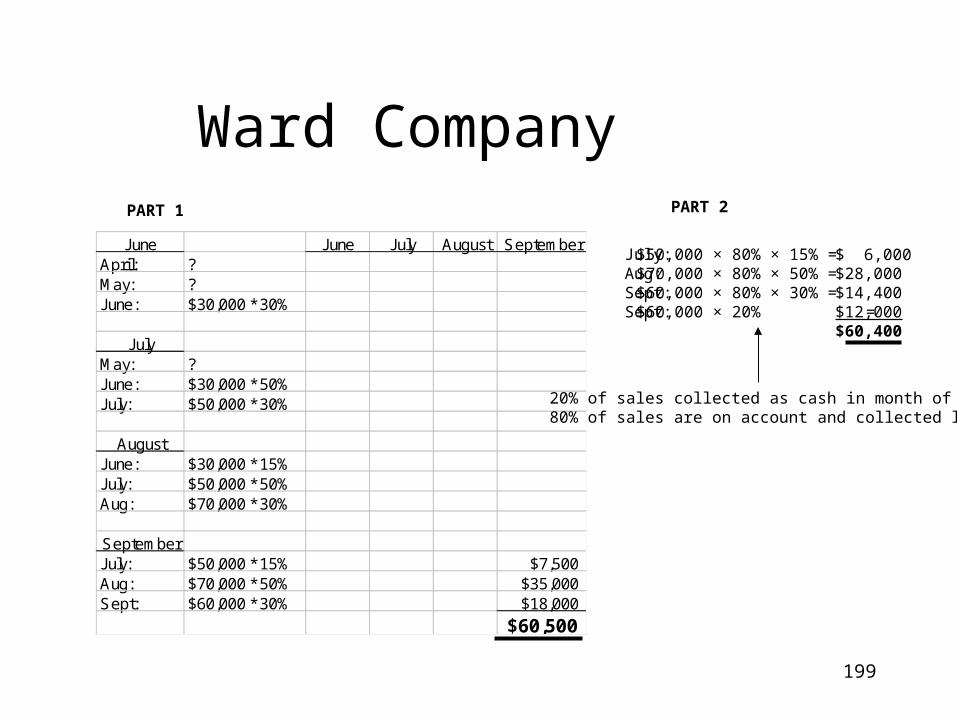
199
Ward Company
June June July August SeptemberApril: ?May: ?June: $30,000 * 30%
JulyMay: ?June: $30,000 * 50%July: $50,000 * 30%
AugustJune: $30,000 * 15%July: $50,000 * 50%Aug: $70,000 * 30%
SeptemberJuly: $50,000 * 15% $7,500Aug: $70,000 * 50% $35,000Sept: $60,000 * 30% $18,000
$60,500
PART 1 PART 2
July:Aug:Sept:Sept:
$50,000 × 80% × 15% =$70,000 × 80% × 50% = $60,000 × 80% × 30% =$60,000 × 20% =
$ 6,000$28,000$14,400$12,000$60,400
20% of sales collected as cash in month of sale80% of sales are on account and collected later
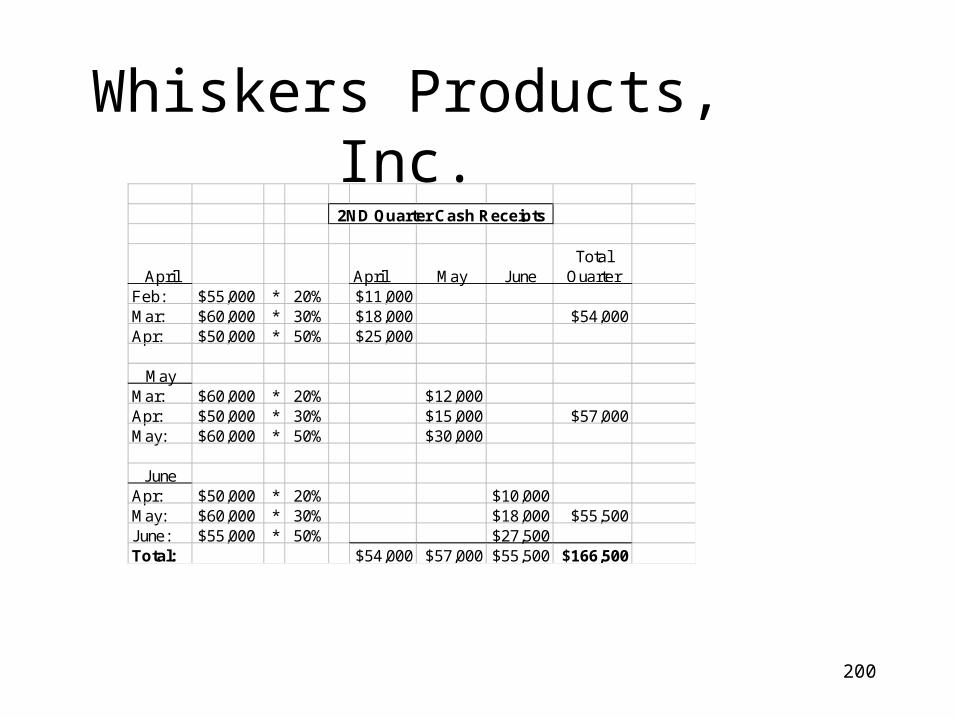
200
Whiskers Products, Inc.
April April May JuneTotal
QuarterFeb: $55,000 * 20% $11,000Mar: $60,000 * 30% $18,000 $54,000Apr: $50,000 * 50% $25,000
MayMar: $60,000 * 20% $12,000Apr: $50,000 * 30% $15,000 $57,000May: $60,000 * 50% $30,000
JuneApr: $50,000 * 20% $10,000May: $60,000 * 30% $18,000 $55,500June: $55,000 * 50% $27,500Total: $54,000 $57,000 $55,500 $166,500
2ND Quarter Cash Receipts
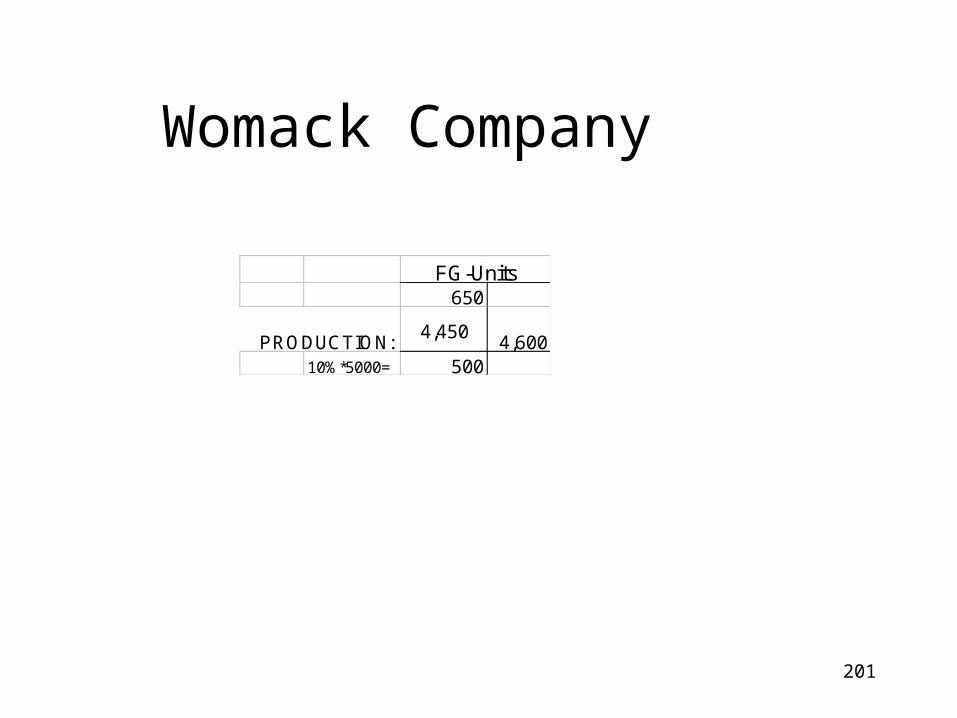
201
Womack Company
650
PRODUCTION: 4,60010%*5000= 500
FG-Units
4,450
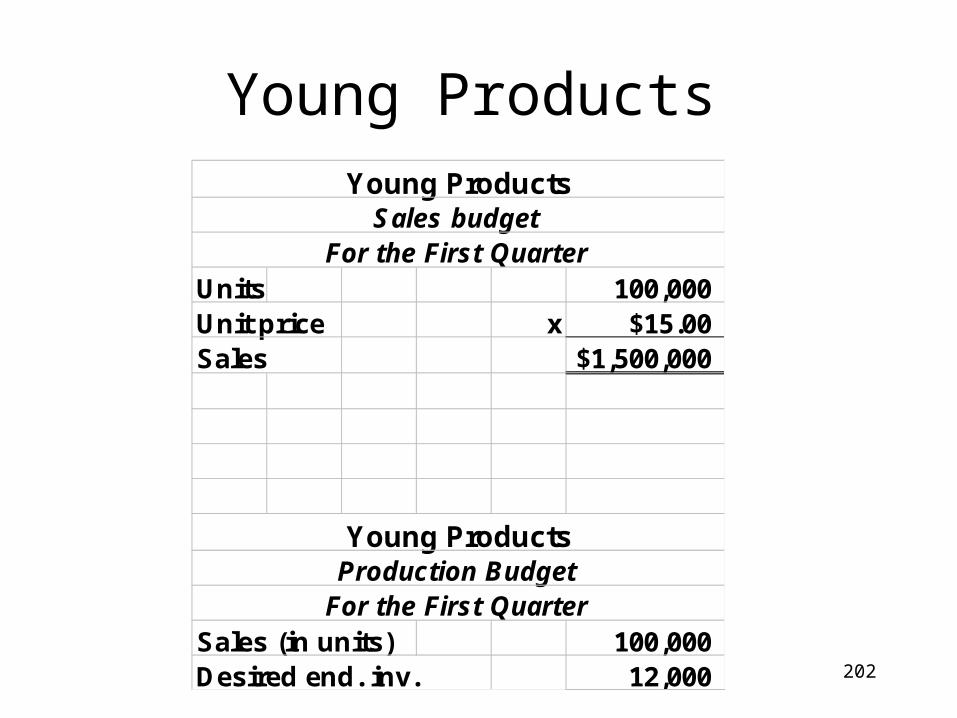
202
Young ProductsYoung Products
Sales budgetFor the First Quarter
Units 100,000Unit price x $15.00Sales $1,500,000
Young ProductsProduction Budget
For the First QuarterSales (in units) 100,000Desired end. inv. 12,000
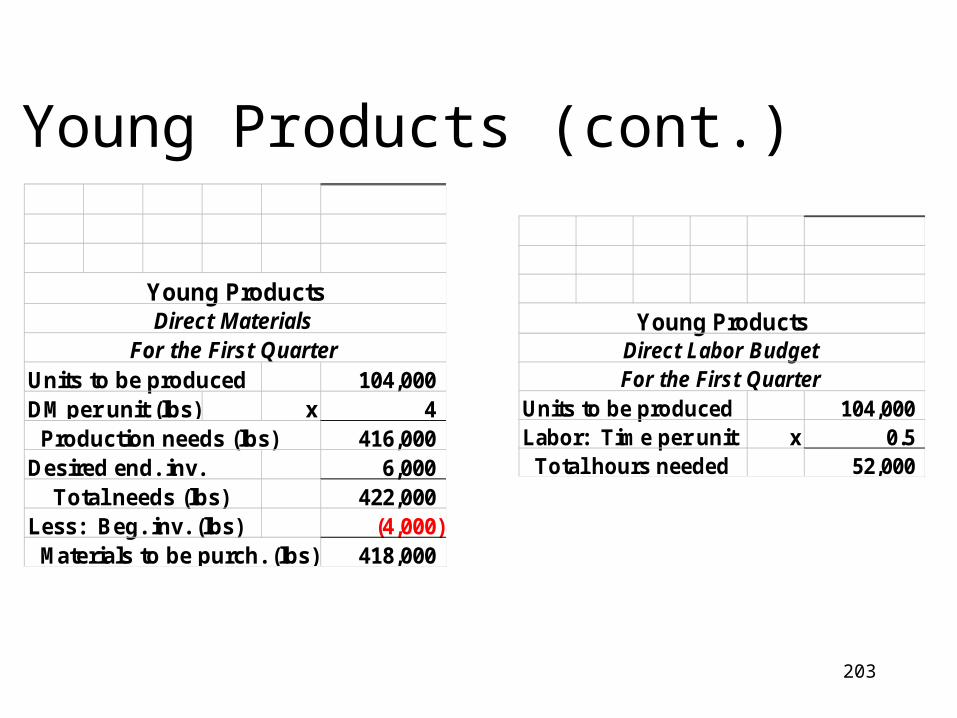
203
Young Products (cont.)
Young ProductsDirect Materials
For the First QuarterUnits to be produced 104,000DM per unit (lbs) x 4 Production needs (lbs) 416,000Desired end. inv. 6,000 Total needs (lbs) 422,000Less: Beg. inv. (lbs) (4,000) Materials to be purch. (lbs) 418,000
Young ProductsDirect Labor BudgetFor the First Quarter
Units to be produced 104,000Labor: Time per unit x 0.5 Total hours needed 52,000