Embed Size (px)
Citation preview
1
2-particle correlation at RHIC
Fabrice Retière, LBNL
for the STAR collaboration
2
Outlines
Hydro at RHIC Rather successful for spectra and elliptic flow
But, cannot describe pion HBT
A blast wave model?Very strong flow
Short emission duration
More constraints : new 2-particle correlations from STAR
Pion HBT with respect to the reaction plane
Kaon HBT
Kaon – pion correlations
3
R
t
RsideRout
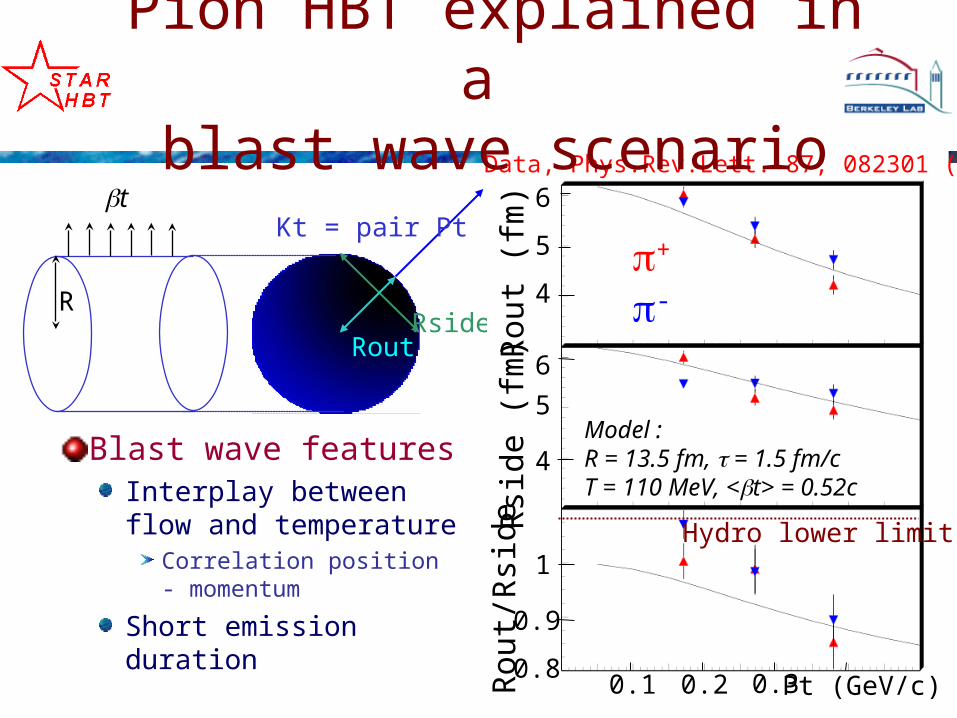
Kt = pair Pt
Blast wave featuresInterplay between flow and temperature
Correlation position - momentum
Short emission duration
Hydro lower limit
+
-
Rou
t (fm
) 6
0.2 0.3 Pt (GeV/c)
5
4
6
5
4
1
0.9
0.8
Model :R = 13.5 fm, = 1.5 fm/cT = 110 MeV, <t> = 0.52c
0.1
Rsi
de (
fm)
Rou
t/R
side
Data, Phys.Rev.Lett. 87, 082301 (2001)
Pion HBT explained in a blast wave scenario
4
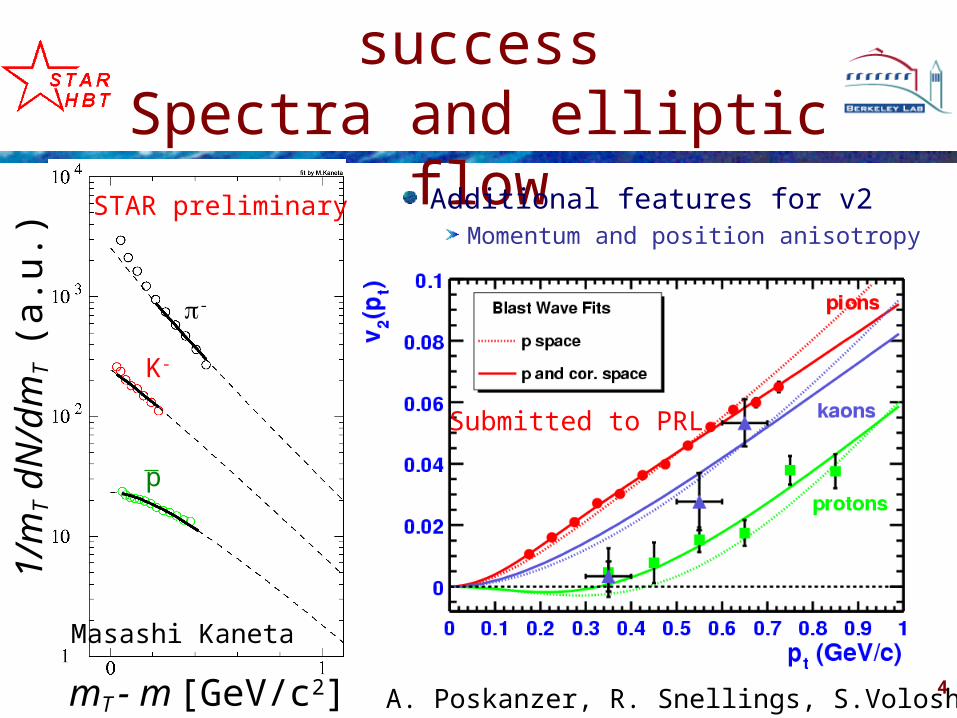
Other blast wave model successSpectra and elliptic flow
-
K-
p
1/m
T d
N/d
mT
(a
.u.)
mT - m [GeV/c2]
Additional features for v2Momentum and position anisotropy
STAR preliminary
Submitted to PRL
Masashi Kaneta
A. Poskanzer, R. Snellings, S.Voloshin
5
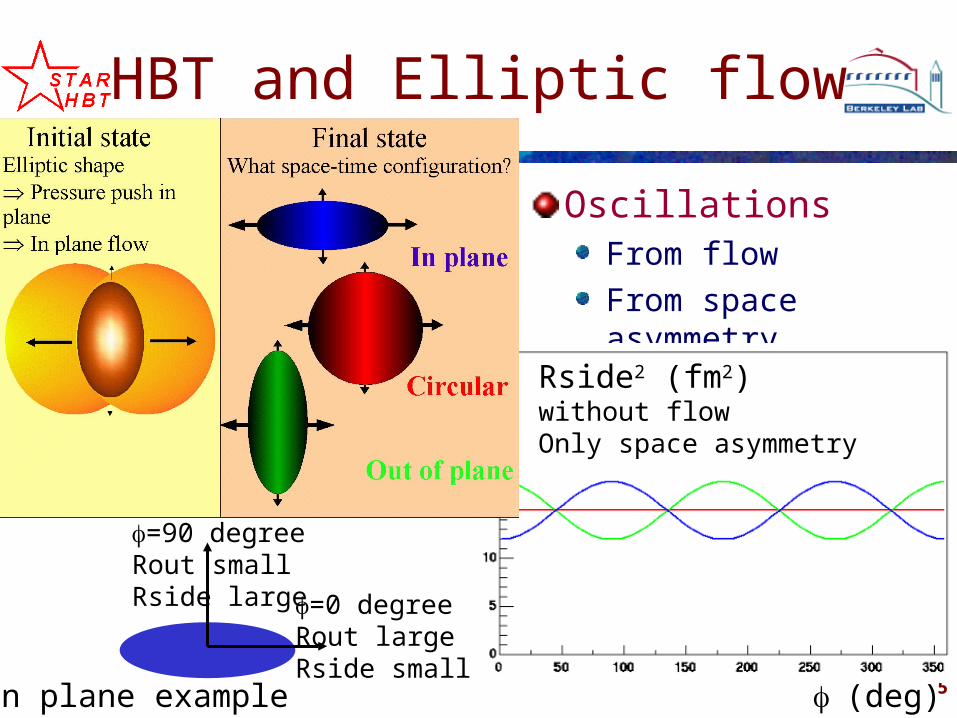
HBT and Elliptic flow
OscillationsFrom flow
From space asymmetry
Rside2 (fm2)without flowOnly space asymmetry
(deg)
=0 degreeRout largeRside small
=90 degreeRout smallRside large
In plane example
6
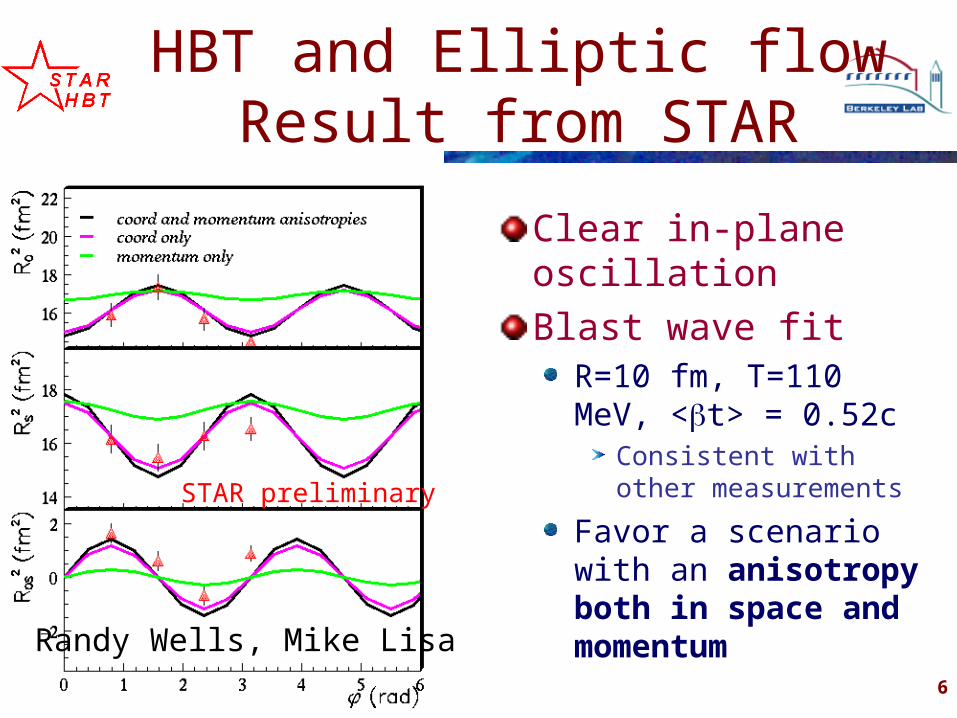
HBT and Elliptic flowResult from STAR
Clear in-plane oscillation
Blast wave fitR=10 fm, T=110 MeV, <t> = 0.52c
Consistent with other measurements
Favor a scenario with an anisotropy both in space and momentum
STAR preliminary
Randy Wells, Mike Lisa
7
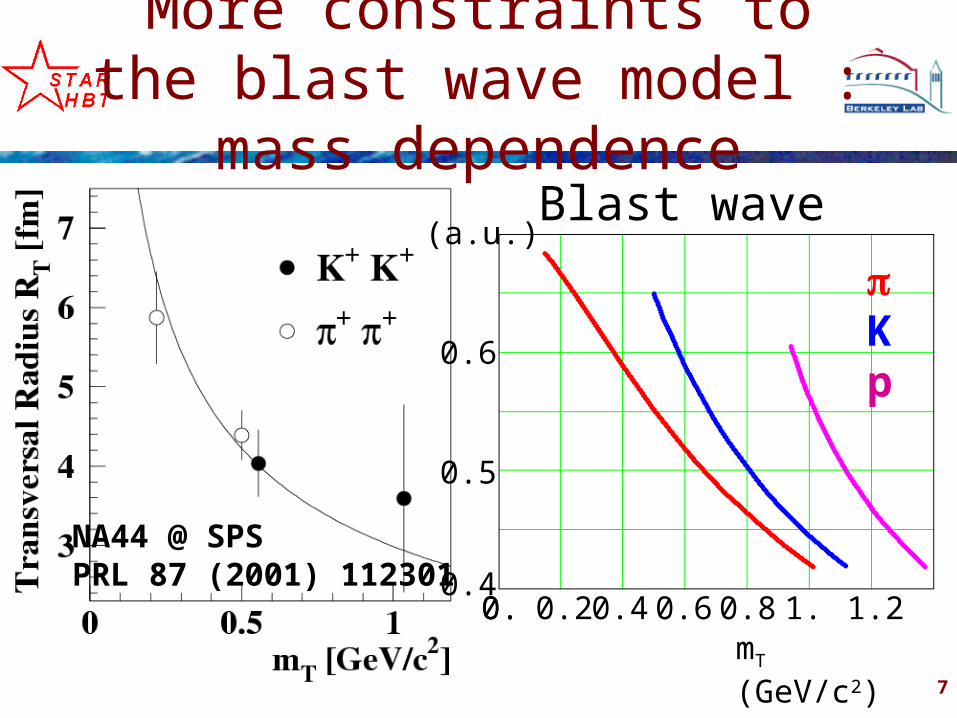
More constraints to the blast wave model : mass dependence
Kp
mT (GeV/c2)0.0. 0.2 0.4 0.6 0.8 1. 1.2
0.4
(a.u.)Blast wave
0.5
0.6
NA44 @ SPSPRL 87 (2001) 112301
8
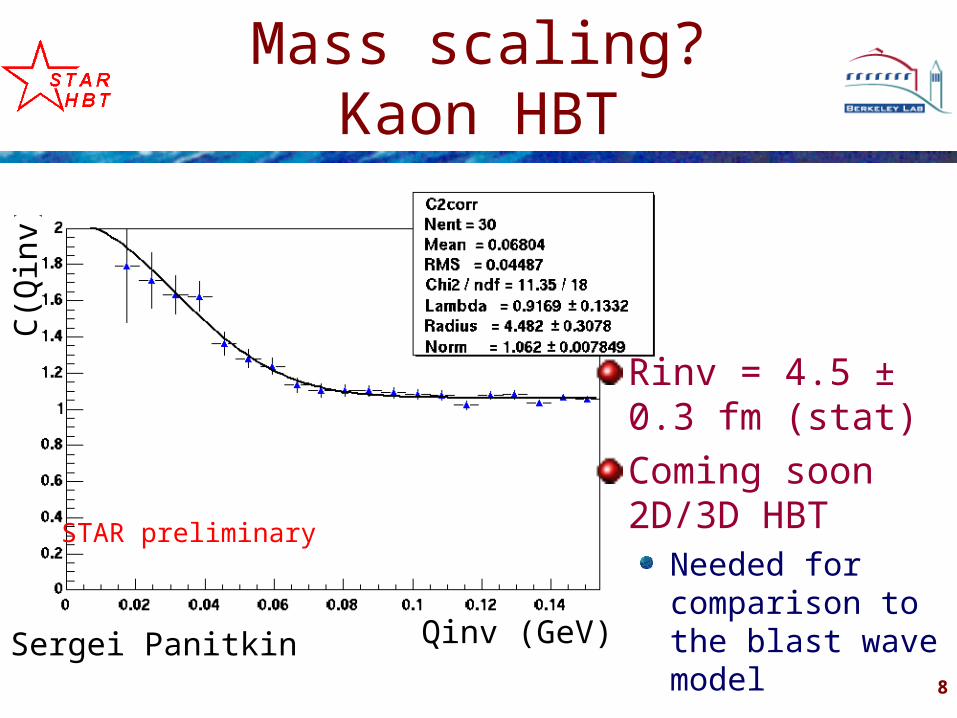
Mass scaling?Kaon HBT
STAR preliminary
Rinv = 4.5 ± 0.3 fm (stat)
Coming soon 2D/3D HBT
Needed for comparison to the blast wave modelQinv (GeV)
C(Q
inv)
Sergei Panitkin
9
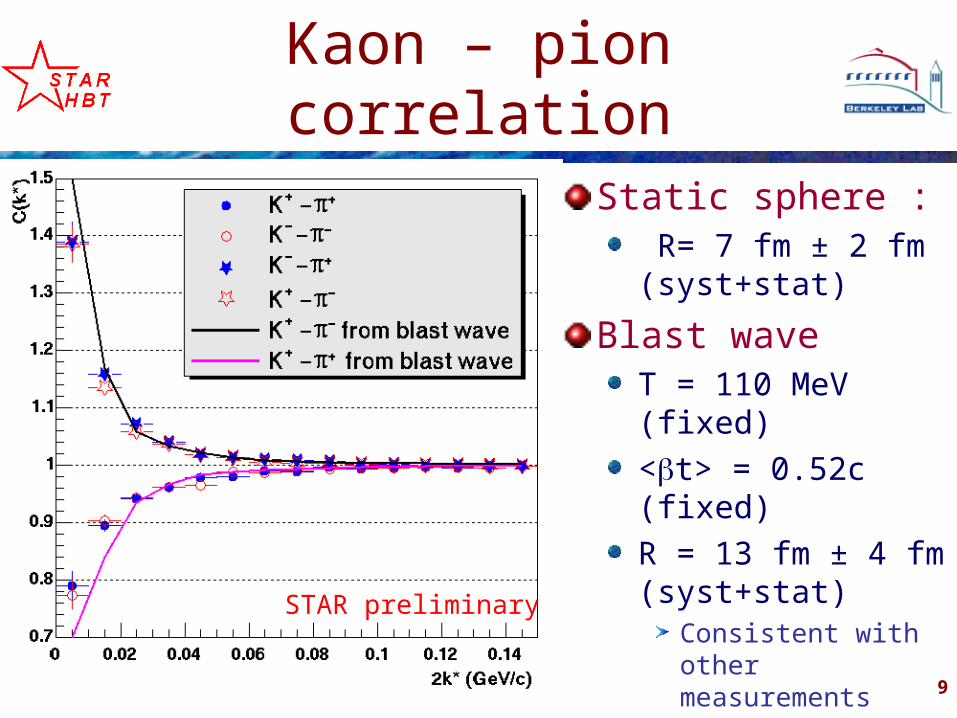
Kaon – pion correlation
Static sphere : R= 7 fm ± 2 fm (syst+stat)
Blast wave T = 110 MeV (fixed)
<t> = 0.52c (fixed)
R = 13 fm ± 4 fm (syst+stat)
Consistent with other measurements
STAR preliminary
10
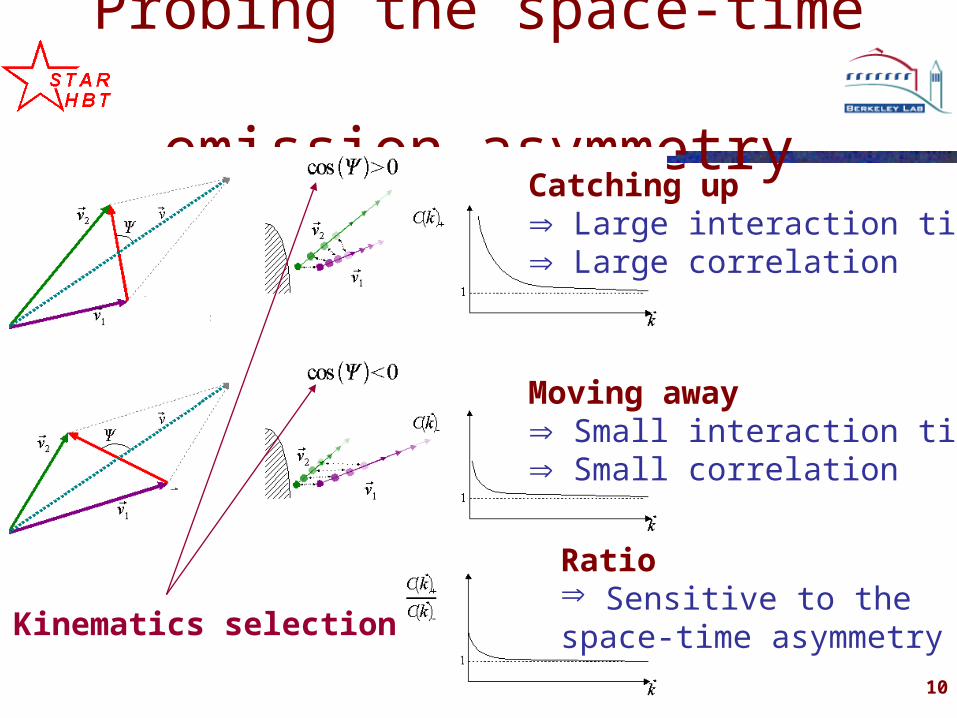
Probing the space-time emission asymmetry
Kinematics selection
Catching up Large interaction time Large correlation
Moving away Small interaction time Small correlation
Ratio Sensitive to the space-time asymmetry
11
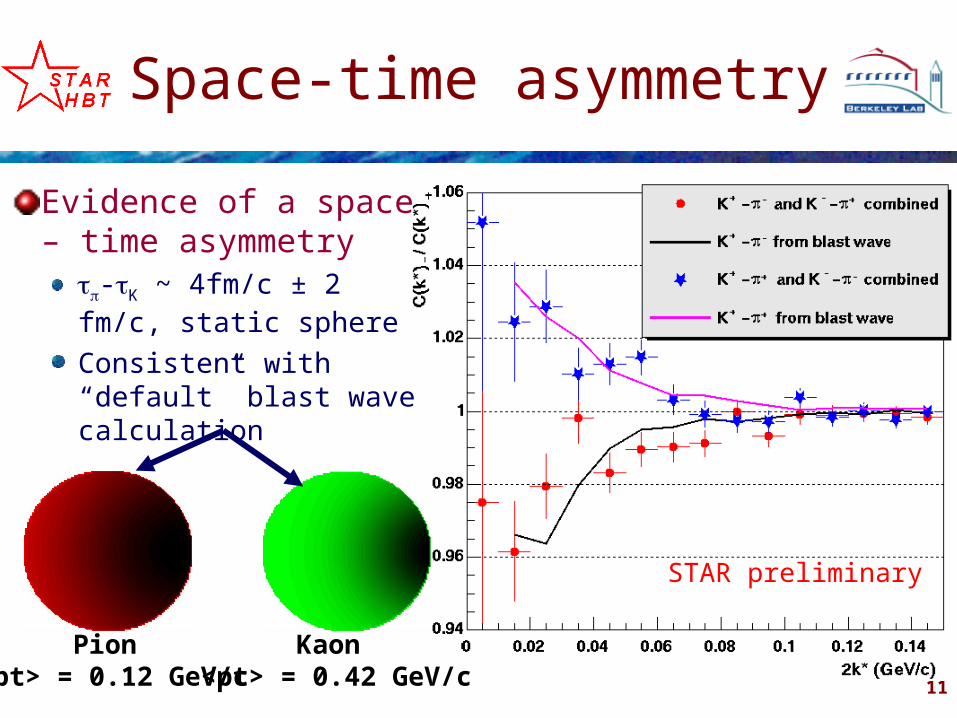
Space-time asymmetry
Evidence of a space – time asymmetry
-K ~ 4fm/c ± 2 fm/c, static sphere
Consistent with “default” blast wave calculation
Kaon <pt> = 0.42 GeV/c
Pion <pt> = 0.12 GeV/c
STAR preliminary
12
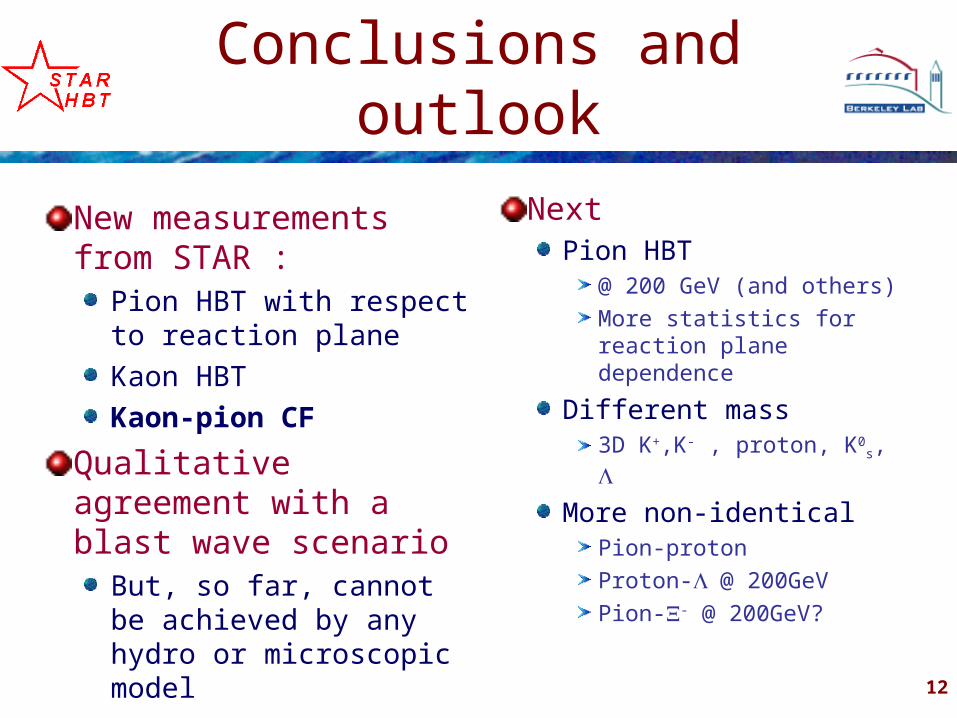
Conclusions and outlook
New measurements from STAR :
Pion HBT with respect to reaction plane
Kaon HBT
Kaon-pion CF
Qualitative agreement with a blast wave scenario
But, so far, cannot be achieved by any hydro or microscopic model
NextPion HBT
@ 200 GeV (and others)
More statistics for reaction plane dependence
Different mass3D K+,K- , proton, K0
s,
More non-identicalPion-proton
Proton-@ 200GeV
Pion-- @ 200GeV?
13
First sign of emission asymmetry @ RHIC
14
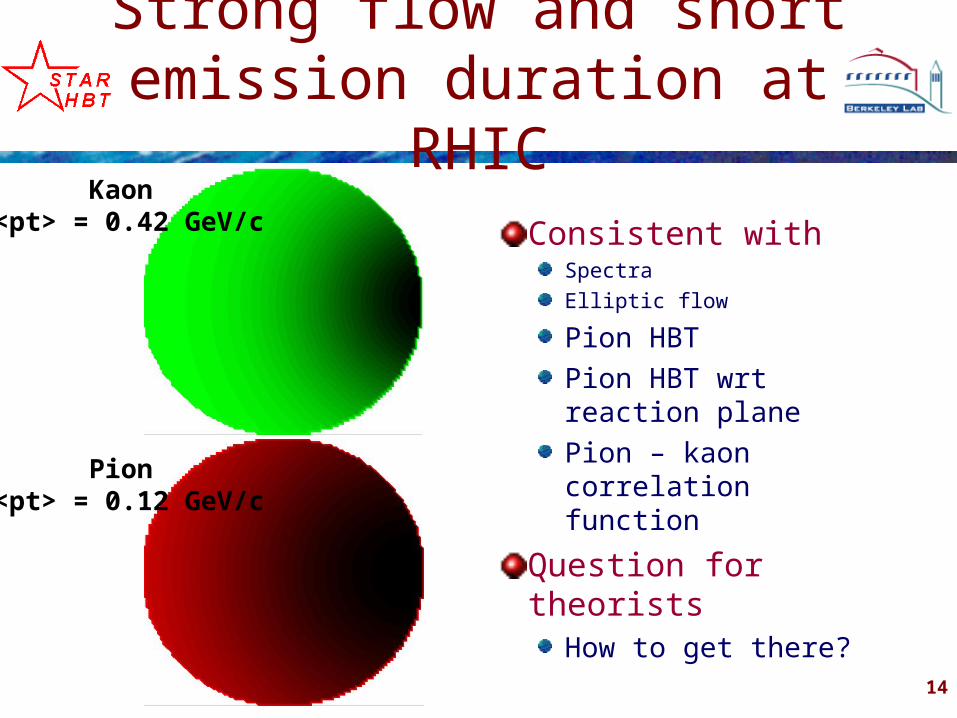
Strong flow and short emission duration at RHIC
Consistent with Spectra
Elliptic flow
Pion HBT
Pion HBT wrt reaction plane
Pion – kaon correlation function
Question for theoristsHow to get there?
Kaon <pt> = 0.42 GeV/c
Pion <pt> = 0.12 GeV/c
15
Back up
16
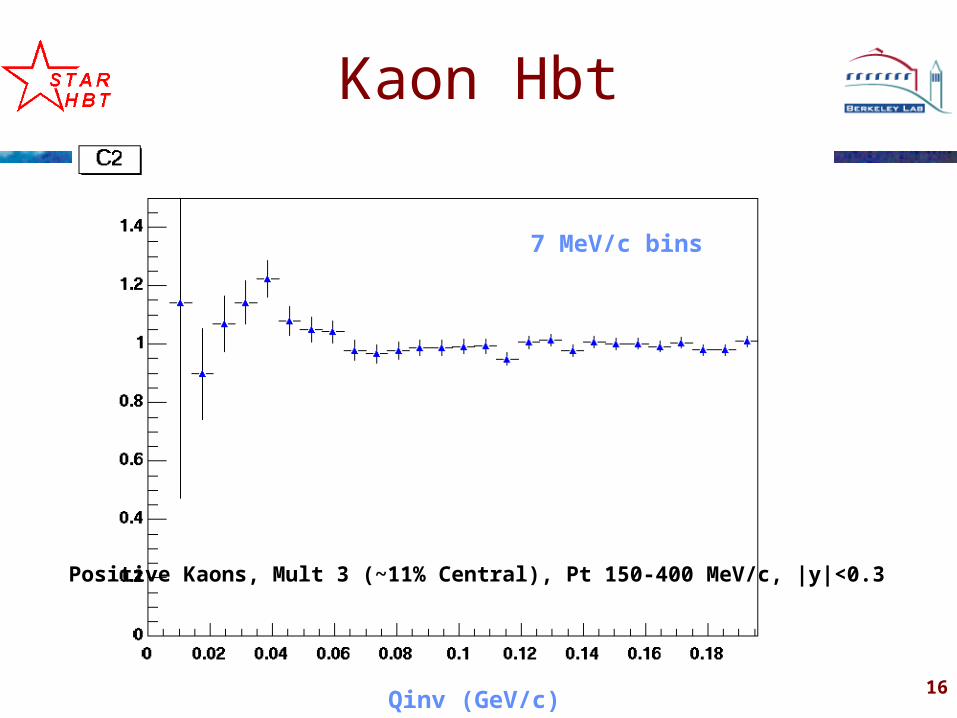
Kaon Hbt
7 MeV/c bins
Positive Kaons, Mult 3 (~11% Central), Pt 150-400 MeV/c, |y|<0.3
Qinv (GeV/c)
17
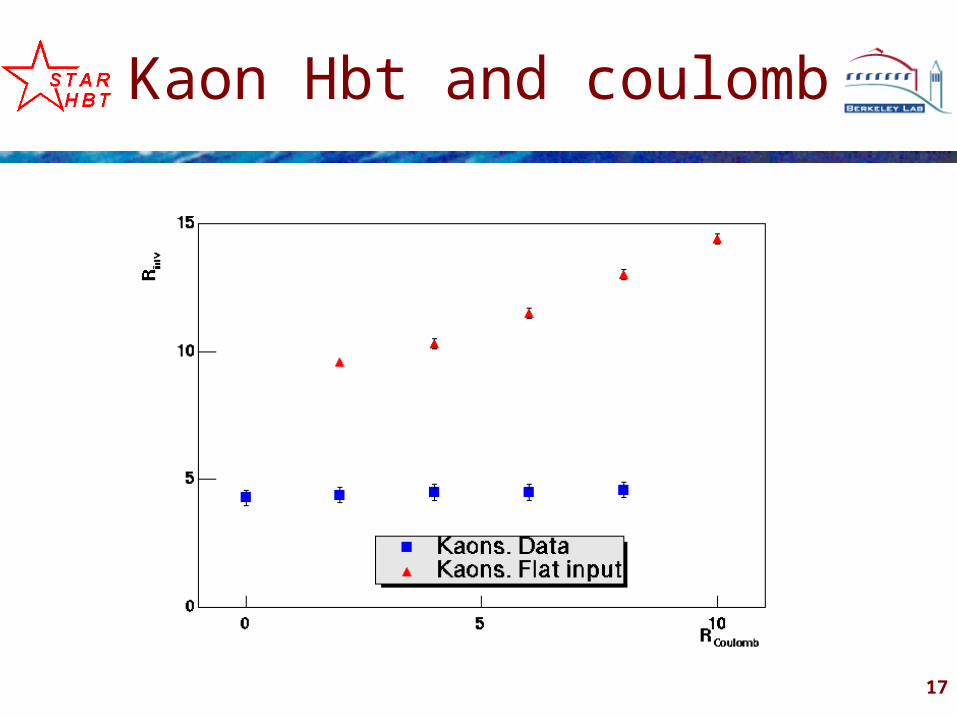
Kaon Hbt and coulomb
18
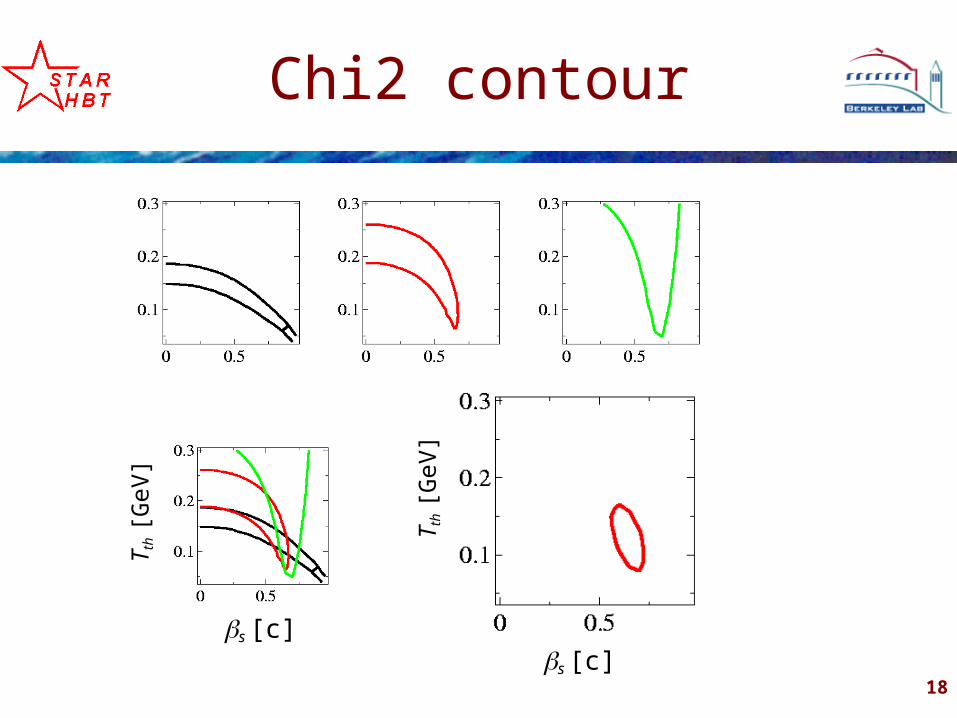
Chi2 contourT t
h [G
eV]
s [c]
T th [
GeV
]
s [c]
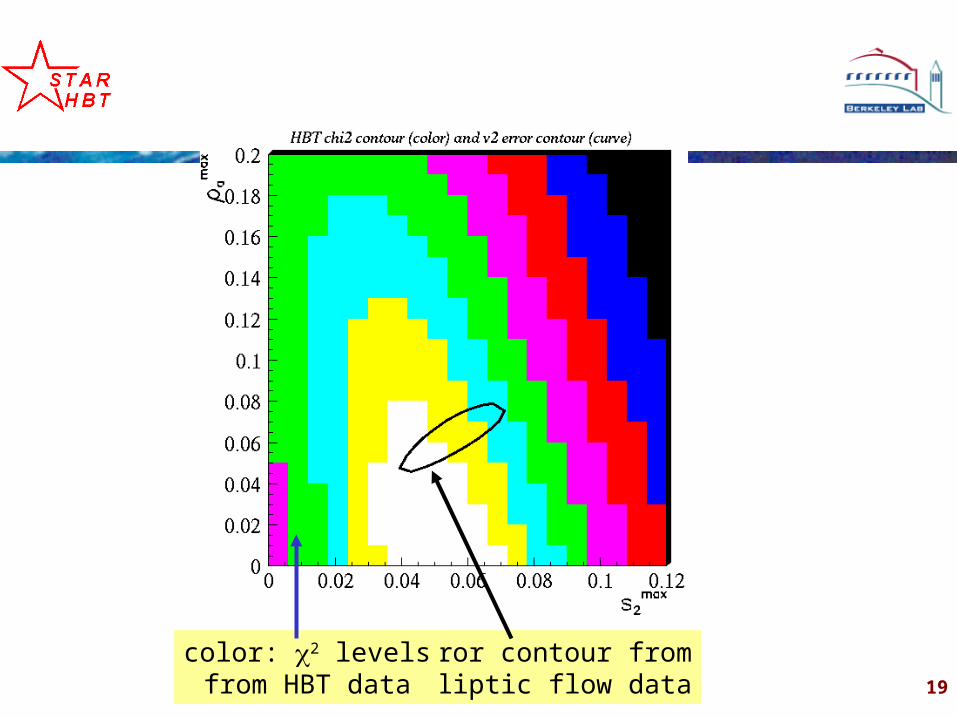
19
error contour fromelliptic flow data
color: 2 levelsfrom HBT data
20
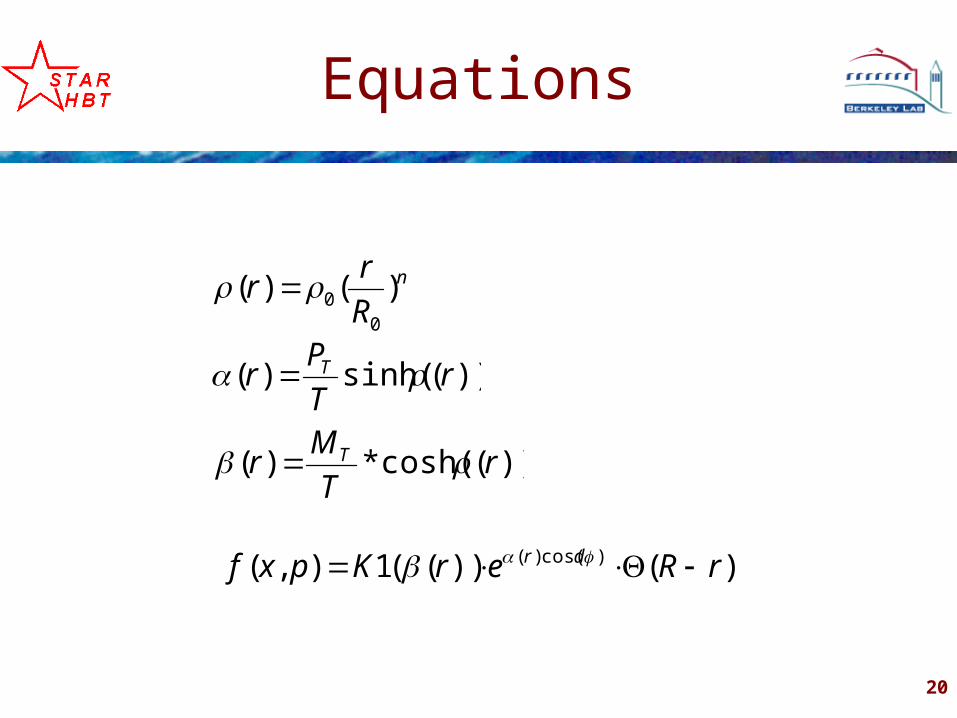
Equations
)())((1),( )cos()( rRerKpxf dr
))(cosh(*)( rT
Mr T
))(sinh()( rT
Pr T
n
R
rr )()(
00