Embed Size (px)
Citation preview

CITY OF KEIZER MISSION STATEMENT KEEP CITY GOVERNMENT COSTS AND SERVICES TO A MINIMUM BY PROVIDING CITY
SERVICES TO THE COMMUNITY IN A COORDINATED, EFFICIENT AND LEAST COST FASHION
A G E N D A KEIZER LONG RANGE PLANNING TASK FORCE
MEETING Monday, March 8, 2021
6:00 p.m. Via ZOOM
1. CALL TO ORDER 2. ROLL CALL 3. PRIOR YEAR MINUTES
a. Long Range Planning Task Force Meeting Minutes – March 9, 2020 4. DISCUSSION
a. Stormwater Long Range Plan
b. Water Long Range Plan
c. General Operating Fund Long Range Plan
1. Police Services Fee Update
d. Parks Long Range Plan
e. Items for Future Budget Consideration 5. OTHER BUSINESS
a. Budget Committee Meeting Timeline b. Next Year’s Long Range Planning Task Force Meeting – March 14, 2022
6. ADJOURN
The City of Keizer is committed to providing equal access to all public meetings and information per the requirements of the ADA and Oregon Revised Statutes (ORS). The Keizer Civic Center is wheelchair accessible. If you require any service that furthers inclusivity to participate, please contact the Office of the City Recorder at least 48 business hours prior to the meeting by email at [email protected] or phone at (503)390-3700 or (503)856-3412.
1

_____________________________________________________ General Fund Long Range Planning Task Force Minutes
Monday, March 9, 2020 - Page 1
MINUTES KEIZER GENERAL FUND LONG RANGE PLANNING TASK FORCE
Monday, March 9, 2020 Keizer Civic Center, Keizer, Oregon
CALL TO ORDER Mayor Clark called the meeting to order at 6:00 pm. Roll call follows:
ROLL CALL Present: Cathy Clark, Mayor Marlene Parsons, Councilor Kim Freeman, Councilor Laura Reid, Councilor Roland Herrera, Councilor Dan Kohler, Councilor Elizabeth Smith Councilor Don Clark Ali Rasouli J. D. Gillis Julia Sargent Jonathan Thompson Kevin Dial
Staff Chris Eppley, City Manager Bill Lawyer, Public Works Director Nate Brown, Community Development
Director John Teague, Police Chief Machell DePina, Human Resources
Director Tim Wood, Finance Director Tracy Davis, City Recorder
APPROVAL OF MINUTES
A correction was made to the minutes. Kim Freeman moved for approval of the March 11, 2019 Minutes as corrected. J.D. Gillis seconded. Motion passed as follows: Cathy Clark, Parsons, Freeman, Reid, Herrera, Smith, Kohler, Don Clark, Gillis, Thompson, Dial, Smith, Sargent and Rasouli in favor.
DISCUSSION
City Manager Chris Eppley gave an overview of why the Task Force exists and explained that the current financial situation for the city is still limited. Finance Director Tim Wood explained that this meeting is to provide a mid-year update, although nothing is locked in stone and focus will be on just some key areas and goals.
a. Stormwater Long Range Plan
Mr. Wood summarized his staff report noting that a rate increase is not anticipated and fielded questions regarding the cash supply forecast. Public Works Director Bill Lawyer provided additional information regarding video inspections and the Shoreline Drive project.
b. Water Long Range Plan
Mr. Wood summarized his staff report noting that the City’s goal is to provide low-cost water that meets all state and federal drinking water regulations and to be cost effective. He pointed out that water cost in Keizer is significantly lower than many comparable cities and explained that the City follows the Water Master Plan and in order to continue doing so a 4% rate increase for capital improvements: waterline replacement projects. He noted that debt will paid off in the 20-21 year and a water rate study will follow. He concluded stating that the City is maintaining the water quality with the
2

_____________________________________________________ General Fund Long Range Planning Task Force Minutes
Monday, March 9, 2020 - Page 2
lowest cost compared to other cities and is on track with the Master Plan. Mr. Lawyer and Mr. Eppley provided additional information and clarification regarding the importance of this service, fire hydrants and the water quality.
c. General Fund Long Range Plan
Mr. Wood explained that this is the chief operating fund for the City and is supported by property tax, fees and intergovernmental revenues so is therefore the most constrained fund and significantly impacted by population growth. He fielded questions and provided details and clarification of various items in his staff report. Mr. Eppley provided additional information regarding diversification strategies for revenue noting that general fund constraints will always be an issue because of Keizer’s low tax rate which keeps the City government constrained to provide a minimalist government. He added that the City works constantly to be more efficient and to provide services the community wants to fund. Discussion also took place regarding funding Diversity Training and an interpreter.
Police Services Fee Update: Mr. Wood reviewed the page in his staff report. Chief Teague provided detailed information about the vision of the Police Department and related staffing needs. Task Force requested a one-page summary of benefits realized over the past year from the Police and Parks fees.
d. Parks Long Range Plan
Mr. Wood summarized his staff report noting that parks are substantially supported by the Parks Fee rather than general fund revenues. Bill Lawyer reviewed items accomplished since the implementation of the fee noting that more has been done than originally planned and announced proposed improvements for the coming year. Mr. Eppley shared information regarding the ADA assessment and the Keizer Little League Park.
Mr. Wood indicated that Transient Occupancy Tax has been higher than anticipated and the Community Center has had a banner first two quarters. Recruitment is underway for an additional Community Center employee and money is being reinvested in the Center as well. Mr. Eppley provided additional information.
Regarding Volcano stadium Mr. Wood indicated that the City will lose about $50,000 in rent if the MLB pulls the Volcanos but this would give the City an opportunity to do something different there.
OTHER BUSINESS
a. Budget Committee Meeting Timelines Monday, May 11, 6 p.m. – Budget Committee Meeting Tuesday, May 12, 6 p.m. – Budget Committee Meeting Thursday, May 14, 6 p.m. – Budget Committee Meeting b. Monday, March 8, 2021, 6 p.m. – Long Range Planning Task Force
Adjourn Meeting adjourned at 8:08 p.m.
Minutes approved:
Debbie Lockhart, Deputy City Recorder
3
LONG RANGE PLANNING MEETING: March 8, 2021
AGENDA ITEM NUMBER: 4a
TO: LONG RANGE PLANNING COMMITTEE
THROUGH: CHRISTOPHER C. EPPLEY, CITY MANAGER
FROM: TIM WOOD, FINANCE DIRECTOR
SUBJECT: STORMWATER LONG RANGE PLAN
Overview of the Stormwater System
The Stormwater Fund is managed by the Public Works Department to meet the Federal Clean Water Act and Safe Drinking Water Act. The City’s stormwater regulatory programs are administered by the State of Oregon through the Department of Environmental Quality (DEQ).
The City has 3 regulatory programs which allow the City to manage stormwater through discharge to local waterways, overland flow, and injection into the ground. The City maintains compliance of the regulatory programs by implementing the requirements of state approved management plans for the municipal separate storm sewer system (MS4), the underground injection control (UIC) devices, and the Total Maximum Daily Load (TMDL) Implementation Plan.
The City is the permittee for the National Pollutant Discharge Elimination System (NPDES) permit #102904, the Water Pollution Control Facilities (WPCF) permit #103068, and is a designated management agency for the Willamette Basin TMDL.
The Stormwater Division operates and maintains:
79.6 Miles of Pipe, 89 Underground Injection Control Systems (UICs), 1,141 Manholes, 2,824 Catchbasins, 132 Outfalls, and 2.5 miles of Vegetated Stormwater Facilities.
The stormwater system can become clogged by trash, debris, sediment and mud, or other stormwater pollutants, however; the City’s maintenance plan of routinely inspecting, repairing, and cleaning the system can reduce local flooding, remove pollution carried by stormwater and protect our local streams and rivers.
The City’s goal is to provide a storm drainage system that is safe, clean and cost-effective.
4
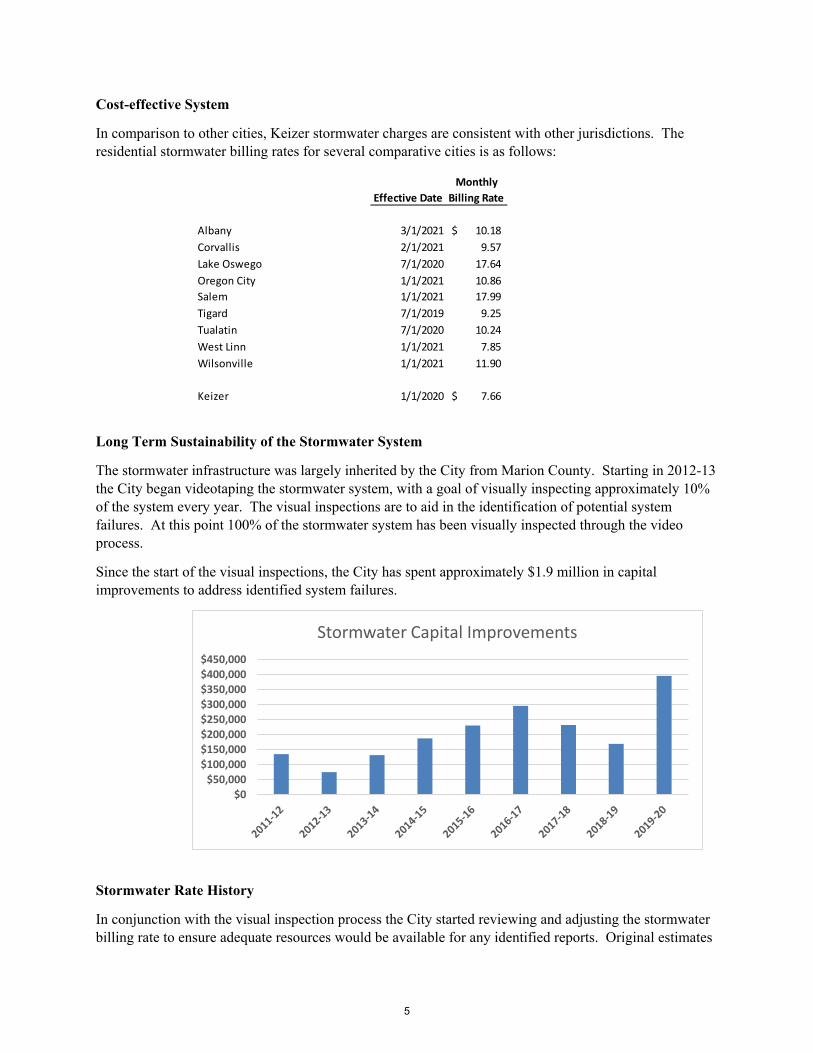
Cost-effective System
In comparison to other cities, Keizer stormwater charges are consistent with other jurisdictions. The residential stormwater billing rates for several comparative cities is as follows:
Long Term Sustainability of the Stormwater System
The stormwater infrastructure was largely inherited by the City from Marion County. Starting in 2012-13 the City began videotaping the stormwater system, with a goal of visually inspecting approximately 10% of the system every year. The visual inspections are to aid in the identification of potential system failures. At this point 100% of the stormwater system has been visually inspected through the video process.
Since the start of the visual inspections, the City has spent approximately $1.9 million in capital improvements to address identified system failures.
Stormwater Rate History
In conjunction with the visual inspection process the City started reviewing and adjusting the stormwater billing rate to ensure adequate resources would be available for any identified reports. Original estimates
Effective Date
Monthly
Billing Rate
Albany 3/1/2021 10.18$
Corvallis 2/1/2021 9.57
Lake Oswego 7/1/2020 17.64
Oregon City 1/1/2021 10.86
Salem 1/1/2021 17.99
Tigard 7/1/2019 9.25
Tualatin 7/1/2020 10.24
West Linn 1/1/2021 7.85
Wilsonville 1/1/2021 11.90
Keizer 1/1/2020 7.66$
$0
$50,000
$100,000
$150,000
$200,000
$250,000
$300,000
$350,000
$400,000
$450,000
Stormwater Capital Improvements
5

indicated that an increase of $0.40 - $0.60 per month per equivalent service unit would be necessary to support the system improvements. Consistent with those estimates the rate has consistently been adjusted between $0.40 and $0.55 each year. In response to the COVID-19 pandemic the City decided to forgo a rate increase during Fiscal Year 2020-21.
‐
0.10
0.20
0.30
0.40
0.50
0.60
Stormwater Rate Increases
6

PROJECTED2020-21 2021-22 2022-23 2023-24 2024-25 2025-26
1 RESOURCES:2 Beginning Balance: 996,600$ 810,600$ 546,400$ 501,400$ 441,400$ 431,400$ 3 Service Fees 2,113,000 2,113,000 2,136,000 2,244,000 2,353,000 2,463,000 4 Other Revenues 12,000 12,000 12,000 12,000 12,000 13,000 5 TOTAL RESOURCES 3,121,600$ 2,935,600$ 2,694,400$ 2,757,400$ 2,806,400$ 2,907,400$ 67 REQUIREMENTS:8 Expenditures:9 Personnel Services 740,200 929,400 957,000 1,053,000 1,085,000 1,194,000
10 Materials & Services 820,800 859,800 886,000 913,000 940,000 968,000 11 Capital Outlay 750,000 600,000 350,000 350,000 350,000 350,000 12 Total Expenditures 2,311,000 2,389,200 2,193,000 2,316,000 2,375,000 2,512,000 13 Fund Balance:14 Unrestricted Fund Balance 810,600 546,400 501,400 441,400 431,400 395,400 15 TOTAL REQUIREMENTS 3,121,600$ 2,935,600$ 2,694,400$ 2,757,400$ 2,806,400$ 2,907,400$
Day's Cash Supply at End of Year 140 94 86 72 67 59
Per ESU $ Increase % Increase 2020-21 $ - $ - 0.0% 2021-22 $ - $ - 0.0% 2022-23 $ 0.40 $ 0.40 5.2% 2023-24 $ 0.40 $ 0.40 5.2% 2024-25 $ 0.40 $ 0.40 5.0%
ESUs Current ProposedSingle Family Residential 1 15.32$ 15.32$ Commercial 86 1,317.52$ 1,317.52$ School 94 1,440.08$ 1,440.08$ Apartment 44 674.08$ 674.08$
ESUs Monthly Bi-Monthly Annual
Single Family Residential 1 -$ -$ -$ Commercial 86 -$ -$ -$ School 94 -$ -$ -$ Apartment 44 -$ -$ -$
In order to maintain at least a 60-day cash supply to correspond with the bi-monthly stormwater billings the following rate increase per ESU with a January 1st effective date is required:
Bi-Monthly Bill
Incremental Cost of Rate Increase
City of KeizerLong Range Plan - Stormwater System
Fiscal Year 2020-21
FORECASTED
Proposed 2021-22 Rate Increase Analysis
7

LONG RANGE PLANNING MEETING: March 8, 2021
AGENDA ITEM NUMBER: 4b
TO: LONG RANGE PLANNING COMMITTEE
THROUGH: CHRISTOPHER C. EPPLEY, CITY MANAGER
FROM: TIM WOOD, FINANCE DIRECTOR
SUBJECT: WATER SYSTEM LONG RANGE PLAN
Overview of the Water System
The City of Keizer’s Water Division operates under the Oregon Administrative Rules for Public Water Systems enforced by the Oregon Health Authority Drinking Water Services (DWS) who administer and enforce drinking water quality standards for public water systems in the state of Oregon.
The City of Keizer’s water system consists of:
3 reservoirs, 15 pump stations, and 126.7 miles of water line.
The water system produces approximately 187 million cubic feet of water annually with a storage capacity of 2.75 million gallons. Additionally the water system includes 907 public fire hydrants.
The water system serves approximately 11,100 metered accounts.
Low Cost Water
The City strives to provide low cost water while ensuring that the water system is maintained for long-term sustainability as outlined in the 2012 Water System Master Plan.
In comparison to other cities, Keizer residents benefit from the availability of local ground water that requires minimal processing to meet federal and state drinking water regulations. The residential water billing rates for several comparative cities is as follows:
8

Long Term Sustainability of the Water System
The 2012 Water System Master Plan outlines the requirements to ensure that the water system is able to meet the expected demand over the next 20 years. The plan outlines approximately $9.9 million in capital improvements. The majority of the improvements are to replace the existing steel waterlines throughout the City with ductile iron pipe ($6.1 million) and adding an additional reservoir and pump station ($1.8 million).
Since the effective date of the master plan, the City has spent approximately $4.0 million in capital improvements.
The only outstanding future capital projects are the additional reservoir and pump station ($1.8 million) and the ongoing steel waterline replacement ($3.6 million). The City has benefited over the last 10 years as the majority of the capital improvement projects have been completed below the original estimate, saving approximately $0.7 million.
Billing
Frequency Effective Date
Connection ‐
Flat Rate
Consumption ‐
Variable Rate
Average
Units
Total Per
Month
Salem Monthly 1/1/2021 11.72$ 2.62$ 6.00 27.44$
Albany Monthly 1/1/2021 20.64 4.60 6.00 48.24
Corvallis Monthly 2/1/2021 16.60 2.11 6.00 29.26
Lake Oswego Monthly 7/1/2020 28.23 2.97 6.00 46.05
McMinnville Monthly 1/1/2021 13.70 1.59 6.00 23.24
Oregon City Monthly 1/1/2021 17.55 1.94 6.00 29.19
Tigard Monthly 1/1/2021 30.31 3.92 6.00 53.83
Tualatin Monthly 7/1/2020 4.49 3.20 6.00 23.69
West Linn Monthly 7/1/2021 26.09 ‐ 6.00 26.09
Wilsonville Monthly 5/1/2021 17.09 4.23 4.00 34.01
Woodburn Monthly 7/1/2020 16.12 1.95 6.00 27.82
Keizer Bimonthly 1/1/2020 11.61$ 1.50$ 12.00 14.81$
$0
$100,000
$200,000
$300,000
$400,000
$500,000
$600,000
$700,000
Water System Capital Improvements
9

Water Rate History
In order to support the requirements of the 2012 Water System Master Plan the City utilizes a cost of service model that projects into the future, based on city growth and water consumption trends, the rate increases needed to complete the plan. The cost of service model has projected a 3-4% annual rate increase for the foreseeable future. Since the plan was adopted rate increases have ranged from 2-4.5%. In response to the COVID-19 pandemic the City elected to forgo a rate increase during the 2020-21 Fiscal Year. Prior to the adoption of the plan water rates had not been increased since August 1, 2008 or almost 3.5 years.
High Quality Drinking Water
The City of Keizer’s ground water comes from deep wells and is high in naturally occurring minerals. The City has a testing program in place to monitor the level of microorganisms, inorganic contaminants, volatile organic contaminants and radioactive contaminants. The results of the testing program are published annually in the Annual Drinking Water Quality Report that is available on the City’s website at www.keizer.org/annualwaterreport.
0.0%
0.5%
1.0%
1.5%
2.0%
2.5%
3.0%
3.5%
4.0%
4.5%
5.0%
Water Rate Increases
10
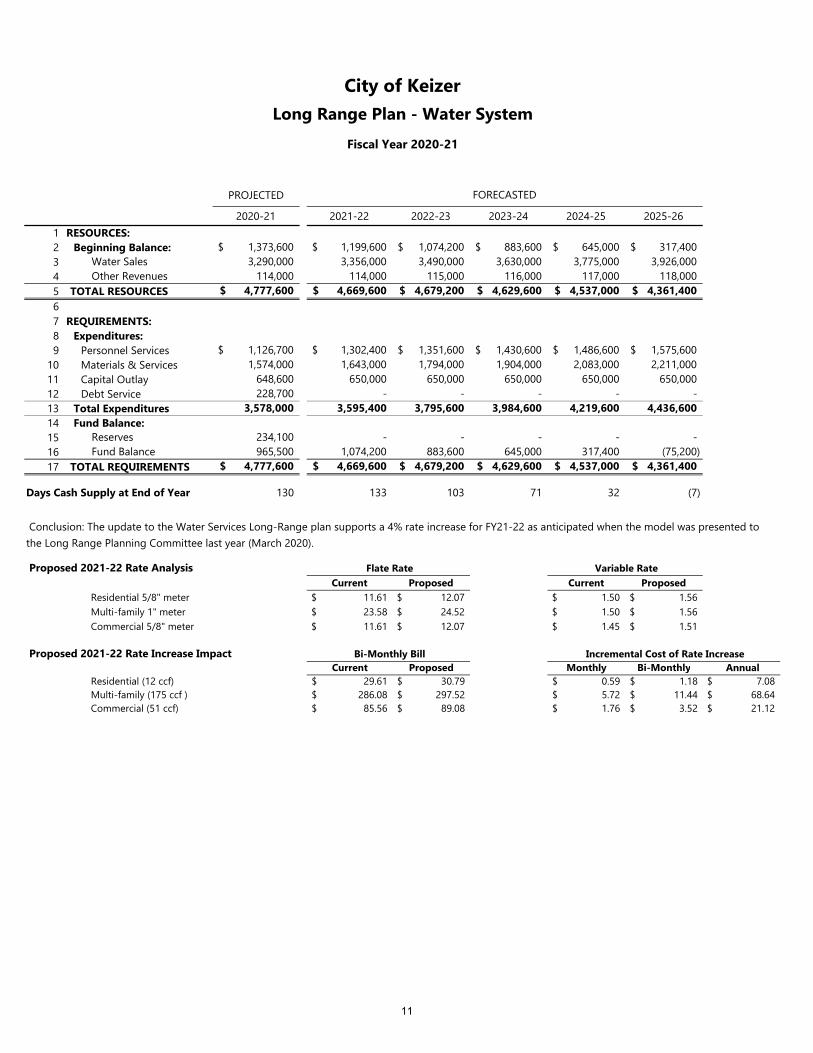
PROJECTED
2020-21 2021-22 2022-23 2023-24 2024-25 2025-26 2024-251 RESOURCES:2 Beginning Balance: 1,373,600$ 1,199,600$ 1,074,200$ 883,600$ 645,000$ 317,400$ (75,200)$ 3 Water Sales 3,290,000 3,356,000 3,490,000 3,630,000 3,775,000 3,926,000 4,044,000 4 Other Revenues 114,000 114,000 115,000 116,000 117,000 118,000 123,000 5 TOTAL RESOURCES 4,777,600$ 4,669,600$ 4,679,200$ 4,629,600$ 4,537,000$ 4,361,400$ #REF!6 7 REQUIREMENTS:8 Expenditures:9 Personnel Services 1,126,700$ 1,302,400$ 1,351,600$ 1,430,600$ 1,486,600$ 1,575,600$ 1,686,000$
10 Materials & Services 1,574,000 1,643,000 1,794,000 1,904,000 2,083,000 2,211,000 2,255,000 11 Capital Outlay 648,600 650,000 650,000 650,000 650,000 650,000 600,000 12 Debt Service 228,700 - - - - - - 13 Total Expenditures 3,578,000 3,595,400 3,795,600 3,984,600 4,219,600 4,436,600 #REF!14 Fund Balance:15 Reserves 234,100 - - - - - - 16 Fund Balance 965,500 1,074,200 883,600 645,000 317,400 (75,200) #REF!17 TOTAL REQUIREMENTS 4,777,600$ 4,669,600$ 4,679,200$ 4,629,600$ 4,537,000$ 4,361,400$ #REF!
Days Cash Supply at End of Year 130 133 103 71 32 (7) #REF!
Current Proposed Current Proposed Residential 5/8" meter $ 11.61 $ 12.07 $ 1.50 $ 1.56 Multi-family 1" meter $ 23.58 $ 24.52 $ 1.50 $ 1.56 Commercial 5/8" meter $ 11.61 $ 12.07 $ 1.45 $ 1.51
Current Proposed Monthly Bi-Monthly Annual Residential (12 ccf) 29.61$ 30.79$ 0.59$ 1.18$ $ 7.08 Multi-family (175 ccf ) 286.08$ 297.52$ 5.72$ 11.44$ $ 68.64 Commercial (51 ccf) 85.56$ 89.08$ 1.76$ 3.52$ $ 21.12
Flate Rate Variable Rate
Proposed 2021-22 Rate Increase Impact
Proposed 2021-22 Rate Analysis
City of KeizerLong Range Plan - Water System
Fiscal Year 2020-21
Conclusion: The update to the Water Services Long-Range plan supports a 4% rate increase for FY21-22 as anticipated when the model was presented to the Long Range Planning Committee last year (March 2020).
FORECASTED
Bi-Monthly Bill Incremental Cost of Rate Increase
11

LONG RANGE PLANNING MEETING: March 8, 2021
AGENDA ITEM NUMBER: 4c
TO: LONG RANGE PLANNING COMMITTEE
THROUGH: CHRISTOPHER C. EPPLEY, CITY MANAGER
FROM: TIM WOOD, FINANCE DIRECTOR
SUBJECT: GENERAL OPERATING FUND LONG RANGE PLAN
Overview of the General Operating Fund
The General Operating Fund is the chief operating fund of the City and accounts for all financial resources and expenditures except those required to be accounted for in another fund.
The General Operating Fund provides for:
Police Department, Municipal Court, Planning Parks Operation, and General Government
The primary sources of revenue are property taxes, licenses/fees and intergovernmental revenues such as Cigarette and Liquor Tax. The General Operating Fund is the City’s most constrained fund in relation to the level of services provided and highly dependent on ongoing City growth. The limited population growth has a direct impact on property taxes, franchise fees and the City’s per capita allocation of intergovernmental revenues.
Objective: Provide the most services possible given the available resources.
July 1, Total Increase % Increase
2011 36,295 75 0.2%
2012 36,715 420 1.2%
2013 36,735 20 0.1%
2014 36,795 60 0.2%
2016 36,985 190 0.5%
2016 37,505 520 1.4%
2017 38,345 840 2.2%
2018 38,505 160 0.4%
2019 38,580 75 0.2%
2020 38,585 5 0.0%
Population
$‐
$2,000,000
$4,000,000
$6,000,000
$8,000,000
$10,000,000
$12,000,000
$14,000,000
2011‐12 2012‐13 2013‐14 2014‐15 2015‐16 2016‐17 2017‐18 2018‐19 2019‐20 2020‐21
General Operating Fund Revenues vs Expenditures
Revenues Expenditures
12

General Fund Resources
Objective: Diversify General Fund
resources so as not to be dependent on
any one source.
The General Operating Fund continues to
be primarily funded by property taxes and
licenses and permits (franchise fees).
Property Taxes
Property taxes are assessed using a levy rate on each $1,000 of assessed valuation. They are classified into three types: permanent rate levy for general purpose operations, local option serial levies for specific purposes approved by voters, and bonded debt principal and interest. The City’s permanent rate levy is a function of its permanent tax rate applied to its assessed value. The City has no local option serial levies or bonded debt levies. The long-range plan projects the tax base levy by estimating the new assessed value and applying it to the City’s applicable tax rate. The estimation of the assessed value starts with the previous year’s assessed value and adds three factors: a growth factor (maximum allowed by law is 3%), an allowance for new construction, and an allowance for annexed property. The City’s permanent tax rate is $2.0838 per $1,000 assessed value.
For the last several years the City has estimated that assessed value would increase approximately 4%, 3% from the growth factor and 1% from new construction.
Going forward given the limited availability of buildable land for new construction within the City limits it is expected that the increase in assessed value will be closer to 3% reflecting only the annual growth factor. The difference between the 4% assumption and the 3% assumption is approximately $55,000 - $65,000 of lost property tax revenue on an annual basis.
$‐
$2,000,000
$4,000,000
$6,000,000
$8,000,000
$10,000,000
$12,000,000
$14,000,000
General Operating Fund Revenues
Taxes and Assessments Licenses and Permits Park Services Fee
Police Services Fee Intergovernmental Fines and Forfeitures
Miscellaneous
0.0%
1.0%
2.0%
3.0%
4.0%
5.0%
6.0%
$‐
$500,000
$1,000,000
$1,500,000
$2,000,000
$2,500,000
$3,000,000
$3,500,000
$4,000,000
$4,500,000
$5,000,000
Assessed Value Vs Real Market Value
AV (000's) RMV (000's) AV % Change
13

License and Fees
Franchise fees are received from several franchises currently operating within the City of Keizer. These fees are collected based upon rates applied to the gross operating revenues generated within the City. Franchise fee rates have been set at 5% for natural gas, electricity, garbage, cable and broadband, water, sewer and stormwater and at 7% for telephone.
Franchise fees are impacted by population growth, rate increases, energy efficient appliances, weather and lower cost alternatives. Overall franchise fees are growing approximately 1% per year primarily as the result of rate increases associated with water, sewer, stormwater and sanitation services. Electricity and natural gas fluctuate based on the weather. Telephone and cable continue to decrease as customers continue to “cut the cord.”
Intergovernmental
Intergovernmental revenues include federal, state, and local grant revenues and state-shared revenues received from the State of Oregon. All the grant revenues directly support specific programs that are reviewed annually and adjusted to incorporate any changes in funding levels. The State of Oregon collects gas, cigarette, and liquor taxes and shares these taxes with its political subdivision based upon a per capita distribution.
Intergovernmental revenues continue to increase in total with liquor taxes offsetting the decrease in cigarette taxes. To the extent that the City’s population growth is lower than the rest of the state the City’s proportion share of certain intergovernmental revenues will be less.
General Fund Expenditures
$‐
$200,000
$400,000
$600,000
$800,000
$1,000,000
$1,200,000
$1,400,000
Intergovernmental
Liquor Revenue Sharing Cigarette
$‐
$2,000,000
$4,000,000
$6,000,000
$8,000,000
$10,000,000
$12,000,000
$14,000,000
General Operating Fund Expenditures by Type
Personnel Service Materials and Services Capital Outlay
$‐
$500,000
$1,000,000
$1,500,000
$2,000,000
$2,500,000
$3,000,000
Franchise Fees
Electric Natural Gas Telephone Cable
Sanitation Water Sewer Stormwater
14

Personnel Services
Objective: Maintain full staffing as resources are available
City Wide Full Time Equivalents
Positions Directly and Indirectly Supported by the General Operating Fund
Objective: Provide compensation that is consistent with comparative agencies.
By policy the City performs a salary survey at least
every four years for non‐represented positions to
ensure that wages are consistent with comparable
agencies. For represented employees the salary
survey is performed each time a contract is negotiated.
The City strives to be within 5% of the comparable
cities average for each classification. If the results of
the salary survey indicates that the classificiation is
above or below the comparable cities the range is
adjusted accordingly.
Department 2011‐12 2012‐13 2013‐14 2014‐15 2015‐16 2016‐17 2017‐18 2018‐19 2019‐20 2020‐21
Direct
Police 45.00 44.25 45.00 45.17 44.42 43.46 45.33 47.67 47.33 47.17
Planning 3.84 3.84 3.84 3.84 3.84 3.42 3.84 3.84 3.76 2.84
Code Enforcement ‐ ‐ ‐ 0.25 0.85 0.85 0.85 0.85 0.85 0.85
Parks 1.90 1.90 1.48 1.90 1.90 1.90 2.73 3.73 3.90 3.90
Municipal Court 1.58 1.00 1.00 1.00 1.00 1.00 1.00 1.00 1.00 1.00
Indirect
Finance 1.98 2.00 1.92 1.94 1.69 1.36 1.60 1.56 1.56 1.30
Information Technology 0.67 0.66 0.66 1.05 1.36 1.31 1.31 1.36 1.35 1.35
City Recorder 1.31 1.17 1.46 1.44 1.44 1.38 1.38 1.39 1.39 1.39
City Attorney 1.61 1.67 1.74 1.74 1.71 1.64 1.64 1.60 1.60 1.60
Human Resources 1.35 0.99 1.32 1.33 1.36 1.31 1.31 1.36 1.35 1.35
City Manager 0.94 0.81 0.76 0.77 0.77 0.74 0.74 0.74 0.74 0.74
Facilities 0.67 0.66 0.66 0.66 0.68 0.66 0.65 0.68 0.68 0.68
Public Works Administration 0.07 0.07 0.07 0.07 0.07 0.07 0.07 0.07 0.07 0.07
Total 60.93 59.02 59.91 61.16 61.08 59.11 62.46 65.84 65.57 64.23
Fiscal
Year CPI‐W* Unrep KPA Local 737
2011‐12 1.8% 0.0% 0.0% 0.0%
2012‐13 3.0% 2.5% 2.5% 2.5%
2013‐14 2.0% 2.0% 2.5% 2.5%
2014‐15 2.3% 2.5% 2.5% 2.5%
2015‐16 2.3% 1.5% 2.5% 2.0%
2016‐17 0.4% 1.5% 2.5% 2.0%
2017‐18 1.7% 1.5% 2.5% 2.0%
2018‐19 3.9% 3.0% 3.0% 3.0%
2019‐20 3.0% 2.5% 2.5% 3.0%
2020‐21 2.4% 2.5% 2.5% 2.4%
* changed from CPI‐W Portland‐Salem to
CPI‐W West Class B/C as index ended December 2017.
Cost of Living (non‐represented)
Years of
Service # Employees
% of Total
Employees
0‐5 29 30%
5‐10 12 13%
10‐15 15 16%
15‐20 13 14%
20‐25 16 17%
25‐30 9 9%
30+ 2 2%
96 100%
Average Years of Service 12.50
75
80
85
90
95
100
105
Budgeted to Actual Full Time Equivalents
Actual Full Time Equivalents Budgeted Full Time Equivalents
15

During the 2016‐17 non‐represented salary survey 9 classifications were adjusted as compared to 28 classificiations
during the 2013‐14 survey. The 2020‐21 survey is in process.
In order to reduce the impact of salary surveys the City provides a cost of living adjustment annually based on the CPI‐
Urban Wage Earners and Clerical Workers: West – Size Class B/C adjusted for trends from comparable agencies. The
2021‐22 CPI is approximately 1.7%. Represented employees are provided cost of living adjustments based on
negotiated collective bargaining agreements.
Health Insurance
The City provides health insurance to all permanent status employees. Employees from the City’s two labor groups, Keizer Police Association and the Local 737 contribute 5% to their health insurance while non-represented contribute 10%. The City in conjunction with a third party broker aggressively negotiate any rate increases. It is expected that the historical increases will continue into the near future.
Retirement
The City participates in the Public Employer Retirement System (PERS) in lieu of contributing to Social Security. PERS contributions are actuarially calculated and assessed to the City as a percentage of gross compensation. The contribution rates are for a two-year period. Starting in 2015-16 the rates increased significantly in response to poor stock market performance.
The City’s historical PERS experience is as follows.
The City has been notified that the employer contribution rates effective July 1, 2021 are 24.18%, 19.40% and 15.04% for Tier ½, OPSRP Police and Fire, and OPSRP General respectively. The increases in these rates will have a significant impact on the City’s personnel services costs.
Employees
Covered
Contribution
Rate
Annual
Expense
Employees
Covered
Contribution
Rate
Annual
Expense
Employees
Covered
Contribution
Rate
Annual
Expense
Employer
Match
Total
Expense
2011‐12 37 10.62% 312,939 7 5.57% 27,628 39 2.86% 60,926 335,131 736,624
2012‐13 36 10.62% 316,147 9 5.57% 30,613 36 2.86% 58,443 334,199 739,402
2013‐14 37 10.69% 320,062 8 4.92% 30,031 40 2.19% 47,758 347,040 744,891
2014‐15 37 10.69% 336,046 10 4.92% 33,133 42 2.19% 52,612 373,164 794,955
2015‐16 35 14.09% 464,154 10 10.30% 83,421 44 6.19% 165,492 406,660 1,119,727
2016‐17 34 14.09% 429,374 12 10.30% 88,832 44 6.19% 166,739 396,210 1,081,155
2017‐18 32 17.72% 544,473 12 12.07% 123,277 45 7.30% 202,751 412,285 1,282,786
2018‐19 27 17.72% 537,382 17 12.07% 156,973 48 7.30% 227,458 446,963 1,368,776
2019‐20 24 20.65% 544,591 20 14.12% 225,372 50 9.49% 315,488 451,052 1,536,503
2020‐21 ‐ Est 21 20.65% 570,759 23 14.12% 277,925 50 9.49% 376,458 515,727 1,740,869
Tier 1/2 OPSRP Police & Fire OPSRP General
Fiscal Year
Health
Insurance FTE
Avg Cost Per
Employee
% Percent
Increase
2011‐12 1,303,357$ 89.42 14,576$ 9.3%
2012‐13 1,396,776 87.17 16,024 9.9%
2013‐14 1,522,282 89.42 17,024 6.2%
2014‐15 1,655,572 92.42 17,914 5.2%
2015‐16 1,722,945 92.92 18,542 3.5%
2016‐17 1,785,752 90.71 19,686 6.2%
2017‐18 1,990,213 94.42 21,078 7.1%
2018‐19 2,207,114 98.08 22,503 6.8%
2019‐20 2,274,729 98.17 23,171 3.0%
2020‐21 (Est) 2,366,427 96.58 24,502 5.7%
16

Materials and Services
Materials and services represent approximately 19% of the General Operating Funds budget. Included in materials and services is 911 Call Center costs of approximately $550,000 per year. This amount is the net amount after the City’s share of 911 tax, approximately $225,000, is applied against the balance.
In addition to 911 call center costs other individually significant costs include property and liability insurance, information technology costs and municipal court assessments.
During 2015-16 there was a significant increase in materials and services cost as the result of contractual payments to the overlapping tax jurisdictions associated with amending the Urban Renewal District.
During 2020-21 there is a significant increase in materials and services cost as the result of the City receiving the CARES Act Grant from the State of Oregon. The Grant was to provide resources to mitigate the COVID-19 pandemic.
Looking to the future it is anticipated that materials and services costs will continue to increase 1-3% per year due to inflation.
Capital Outlay
Capital Outlay represents approximately 6% of the General Operating Funds budget. Capital outlay consists of park improvements outlined in the Parks Master Plan and ongoing Police Department Vehicle purchases. It is anticipated that capital outlay will remain consistent for the foreseeable future.
$‐
$500,000
$1,000,000
$1,500,000
$2,000,000
$2,500,000
$3,000,000
$3,500,000
Materials and Services
General Government Parks Planning Police Municipal Court
17

PROJECTED2020-21 % of Rev 2021-22 % of Rev 2022-23 % of Rev 2023-24 % of Rev 2024-25 % of Rev 2025-26 % of Rev
12 Taxes & Assessments 6,054,000 47% 6,270,600 48% 6,450,700 48% 6,644,200 48% 6,843,500 47% 7,048,800 47%3 Licenses & Fees 2,913,400 22% 2,952,900 23% 2,975,400 22% 3,005,200 22% 3,035,300 21% 3,065,700 21%4 Intergovernmental 2,079,900 16% 1,395,400 11% 1,444,500 11% 1,516,700 11% 1,592,500 11% 1,672,100 11%5 Fines & Forfeitures 387,300 3% 387,300 3% 390,700 3% 394,600 3% 398,500 3% 402,500 3%6 Other 196,800 2% 196,000 2% 220,100 2% 221,000 2% 221,900 2% 222,800 1%7 New Revenues - 0% 60,000 0% 120,000 1% 123,600 1% 127,300 1% 131,100 1%8 TOTAL NET REVENUES 11,631,400 89% 11,262,200 87% 11,601,400 86% 11,905,300 85% 12,219,000 85% 12,543,000 84%9 Police Services Fee 693,000 5% 1,020,000 8% 1,189,300 9% 1,359,300 10% 1,529,200 11% 1,700,400 11%
10 Park Services Fee 680,000 5% 680,000 5% 680,000 5% 680,000 5% 680,000 5% 680,000 5%11 TOTAL REVENUES 13,004,400$ 100% 12,962,200$ 100% 13,470,700$ 100% 13,944,600$ 100% 14,428,200$ 100% 14,923,400$ 100%12
13 % of Exp % of Exp % of Exp % of Exp % of Exp % of Exp
14 General Government 2,980,200$ 23% 2,477,200$ 18% 2,342,500$ 17% 2,412,800$ 17% 2,485,200$ 17% 2,559,800$ 17%15 Planning 512,700 4% 511,400 4% 551,900 4% 575,900 4% 614,200 4% 641,300 4%16 Municipal Court 220,500 2% 228,400 2% 225,300 2% 230,600 2% 238,600 2% 244,500 2%17 Parks 1,157,700 9% 1,173,600 9% 1,169,600 9% 1,221,700 9% 1,244,800 8% 1,203,100 8%18 Police 8,079,300 62% 9,094,000 67% 9,355,900 69% 9,834,300 69% 10,254,500 69% 10,789,800 70%19 Interfund Loan Repayment 15,700 0% 30,000 0% 30,000 0% 30,000 0% 30,000 0% 30,000 0%20 TOTAL EXPENDITURES 12,950,400$ 100% 13,484,600$ 100% 13,645,200$ 100% 14,275,300$ 100% 14,837,300$ 100% 15,438,500$ 100%2122 REVENUES IN EXCESS OF EXPENDITURES 54,000 (522,400) (174,500) (330,700) (409,100) (515,100) 2324 BEGINNING FUND BALANCE 3,159,800 3,213,800 2,691,400 2,516,900 2,186,200 1,777,100 2526 ENDING FUND BALANCE 3,213,800$ 2,691,400$ 2,516,900$ 2,186,200$ 1,777,100$ 1,262,000$
21% 19% 16% 12% 8%
EXPENDITURES:
City of KeizerGeneral Fund Long Range Forecast
Fiscal Year 2020-21
FORECASTED
REVENUES:
18

PROJECTED2020-21 2021-22 2022-23 2023-24 2024-25 2025-26
1 REVENUES:2 Police Service Fees 693,000$ 1,020,000$ 1,189,300$ 1,359,300$ 1,529,200$ 1,700,400$ 3 General Fund Support 7,236,600 7,727,400 7,809,600 8,110,900 8,353,900 8,710,600 4 Other Existing Revenues 160,300 346,600 357,000 364,100 371,400 378,800 56 TOTAL REVENUES 8,089,900$ 9,094,000$ 9,355,900$ 9,834,300$ 10,254,500$ 10,789,800$ 78 EXPENDITURES:9 Personnel Services 6,820,300$ 7,722,700$ 8,063,200$ 8,519,700$ 8,917,600$ 9,430,200$
10 Materials & Services 1,029,300 1,071,300 1,092,700 1,114,600 1,136,900 1,159,600 11 Capital Outlay 229,700 300,000 200,000 200,000 200,000 200,000 1213 TOTAL EXPENDITURES 8,079,300$ 9,094,000$ 9,355,900$ 9,834,300$ 10,254,500$ 10,789,800$ 1415 REVENUES IN EXCESS OF EXPENDITURES 10,600$ -$ -$ -$ -$ -$
Fiscal YearPolice Fee Revenue
Increase from PY Monthly Fee
Monthly Increase Annual Fee
2020-21 $ 680,000 $ - $ 4.00 $ - 48.00$ 2021-22 1,020,000 340,000 6.00 2.00 72.002022-23 1,189,300 169,300 7.00 1.00 83.952023-24 1,359,300 170,000 8.00 1.00 95.952024-25 1,529,200 169,900 9.00 1.00 107.942025-26 1,700,400 171,200 10.00 1.01 120.03
FORECASTED
The fee is currently $4.00 per month for single family residences and non-residential locations and $3.45 per unit per month for multi-family dwellings. In addition age related and low income discounts are available.
Based on the current analysis the fee amount will need to be adjusted to maintain the overall Police Department level of service as follows:
City of KeizerPolice Services Fee Update
Fiscal Year 2021-22
19

LONG RANGE PLANNING MEETING: March 8, 2021
AGENDA ITEM NUMBER: 4d
TO: LONG RANGE PLANNING COMMITTEE
THROUGH: CHRISTOPHER C. EPPLEY, CITY MANAGER
FROM: TIM WOOD, FINANCE DIRECTOR
SUBJECT: PARK SYSTEM LONG RANGE PLAN
Overview of the Park System
The goal of the Public Works Department Park Division is to provide the community with a diversified program to meet the recreational, educational and leisure needs of the citizens through a blend of pleasing landscapes, open spaces, parks and recreational facilities for both passive and active interests. The Park System is governed by 2008 Parks & Recreation Master Plan. The Park System master plan is being reviewed and updated during fiscal year 2020-21.
The Park System consists of:
15 Neighborhood parks covering 65.5 acres, 2 Community parks covering 27 acres, 1 Region park covering 148 acres 1 Landscape area covering 0.5 acres, and 1 Historical area covering 0.5 acres.
Park System Funding
The Park System is funded by three primary sources:
General Fund Revenue, Parks Fee Revenue, and Other Income which includes park reservation fees and property rental income
$‐
$200,000
$400,000
$600,000
$800,000
$1,000,000
$1,200,000
$1,400,000
Park System Funding
General Fund Revenue Parks Fee Revenue Other Income
20

Long Term Sustainability of the Park System
The Parks Division has four full-time employees and supplements staffing in the summer months through a temporary agency. The primary focus of Parks Staff is on maintenance of the Parks system with emphasis on mowing, garbage collection, and maintenance of the various park amenities as well as repair or replacement of broken and/or damaged play structures, drinking fountains and other park amenities.
In addition to the ongoing maintenance and repair requirements, the Park System has or will be completing the following capital improvements:
Year 1 – FY 19/20
Skate Park Update Willamette Manor Sport Court Replacement Northview Swing Set Replacement Replace 2000 F-250 Tree Work System Wide Demo Charge House and Gravel Pad for Food Trucks
Year 2 – FY 20/21
Replace Claggett Play Structure Replace Northview Stairs Power and Water for Food Truck Pads Resurface and Expand North Parking Lot at Claggett Creek Repair Backstops/Fences at Claggett Creek & Other Parks Master Plan/SDC Methodology Update Tree Work System Wide Create Equipment Access to Lower Portion of Wallace House Paint Gazebo at Chalmers Park (completed by an Eagle Scout)
Year 3 – FY21/22
New Pathway Lighting at Bair Park and Additional Lighting at Country Glen Tree Work System Wide Replace Kubota Tractor Big Toy Picnic Shelters (2) ADA Compliance Work in Various Parks
Year 4 – FY 22/23
Picnic Shelter by the River at Keizer Rapids Replace Play Structure at Bob Newton Expand Trail/Road to Boat In Camp Site in Keizer Rapids Replace Play Structure at Ben Miller Tree Work System Wide
Year 5 – FY 23/24
New Sports Court at Keizer Rapids
21

Expand Parking Lot by Dog Park at Keizer Rapids Replace 2 Zero Turn Mowers
22
PROJECTED2020-21 2021-22 2022-23 2023-24 2024-25 2025-26
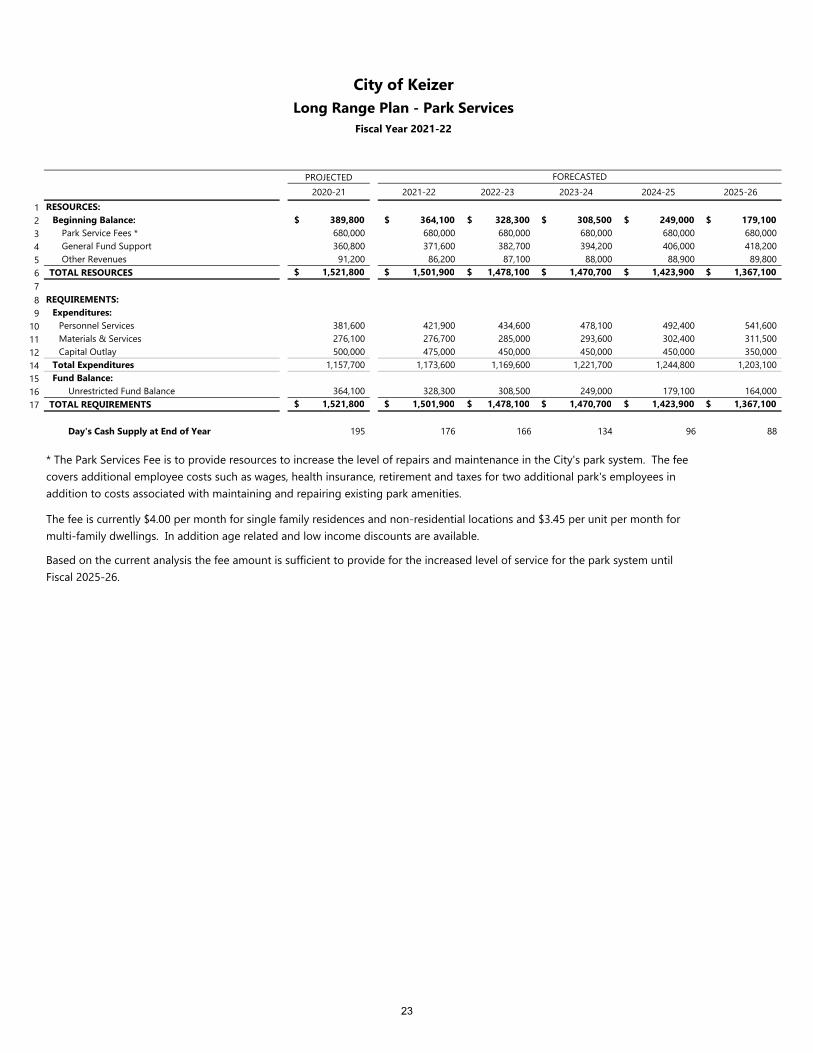
1 RESOURCES:2 Beginning Balance: 389,800$ 364,100$ 328,300$ 308,500$ 249,000$ 179,100$ 3 Park Service Fees * 680,000 680,000 680,000 680,000 680,000 680,000 4 General Fund Support 360,800 371,600 382,700 394,200 406,000 418,200 5 Other Revenues 91,200 86,200 87,100 88,000 88,900 89,800 6 TOTAL RESOURCES 1,521,800$ 1,501,900$ 1,478,100$ 1,470,700$ 1,423,900$ 1,367,100$ 78 REQUIREMENTS:9 Expenditures:
10 Personnel Services 381,600 421,900 434,600 478,100 492,400 541,600 11 Materials & Services 276,100 276,700 285,000 293,600 302,400 311,500 12 Capital Outlay 500,000 475,000 450,000 450,000 450,000 350,000 14 Total Expenditures 1,157,700 1,173,600 1,169,600 1,221,700 1,244,800 1,203,100 15 Fund Balance:16 Unrestricted Fund Balance 364,100 328,300 308,500 249,000 179,100 164,000 17 TOTAL REQUIREMENTS 1,521,800$ 1,501,900$ 1,478,100$ 1,470,700$ 1,423,900$ 1,367,100$
Day's Cash Supply at End of Year 195 176 166 134 96 88
FORECASTED
* The Park Services Fee is to provide resources to increase the level of repairs and maintenance in the City's park system. The fee covers additional employee costs such as wages, health insurance, retirement and taxes for two additional park's employees in addition to costs associated with maintaining and repairing existing park amenities.
The fee is currently $4.00 per month for single family residences and non-residential locations and $3.45 per unit per month for multi-family dwellings. In addition age related and low income discounts are available.
Based on the current analysis the fee amount is sufficient to provide for the increased level of service for the park system until Fiscal 2025-26.
City of KeizerLong Range Plan - Park Services
Fiscal Year 2021-22
23

LONG RANGE PLANNING MEETING: March 8, 2021
AGENDA ITEM NUMBER: 4e
TO: LONG RANGE PLANNING COMMITTEE
THROUGH: CHRISTOPHER C. EPPLEY, CITY MANAGER
FROM: TIM WOOD, FINANCE DIRECTOR
SUBJECT: ITEMS FOR FUTURE BUDGET CONSIDERATION
Below is a status update on previously identified budget priorities:
Annual CostStaffing High Priority Code Enforcement Staff ing $100,000 Community Services Officer 100,000
Medium Priority Legal Department Staff ing 150,000 Human Resources Staff ing 100,000 Low Priority Economic development Manager 150,000 Emergency Management Manager 100,000 Public Information/Community and Cultural Outreach Position 150,000
Initial OngoingOther Cost Cost High Priority HRIS Software - In Process 15,000 $5,000
Live Scan - Finger Print System - In Process 25,000 4,000 PowerDMS Software - Complete 6,000 5,800 Pergola 100,000 - Fullcourt Municipal Court Software - In Process 25,000 7,000 Medium Priority Codification Software - starting Request for Proposal Process 20,000 3,000 Recruitment Softw are if not included in HRIS 10,000 3,000
Springbrook Financial Software Upgrade - Complete 47,000 34,000 Automated Timesheet Software - In process 15,500 4,000 Conversational Spanish Class 15,000 - Implicit/Explicit Bias and Diversity Training 15,000 -
Low Priority Plotter - Complete 10,000 - Scheduling Softw are 10,300 4,000 Skate Park Security Camera 10,000 1,000
Total $1,173,800 $70,800
24

Budget Calendar
Friday, April 16 & Friday, April 23
Notice of Budget Committee meeting on City Budget posted to website and for publication for purpose of receiving proposed budget, and a public hearing to be held on Monday, May 4th on the proposed budget and state revenue sharing.
Friday, April 23 Budget documents to be distributed to Budget Committee
Tuesday, May 4
6:00 p.m. City Budget Committee Meeting Election of City of Keizer Budget Committee Chair Approval of Budget Calendar Public Testimony Presentation of City of Keizer Budget Message Staff presentations & discussions
Thursday, May 6
6:00 p.m. City Budget Committee Meeting Public Testimony Continuation of presentations and discussion
Monday, May 10
6:00 p.m. City Budget Committee Meeting Continuation of discussion from Thursday, May 6th as needed Budget recommendations to City Council
Friday, May 21 Financial Summaries and notice of budget hearings for publication
Monday June 7 7:00 p.m.
Public hearing on City Budget. Council adoption of City Budget, if approved.
Monday June 21 7:00 p.m.
Alternate public hearing on City Budget (if needed). Council adoption of City Budget.
25