Embed Size (px)
Citation preview

1 / 31
Relationship Between SDS and SCN in Commercial Soybean Fields in WisconsinDavid Marburger1, John Gaska1, Shawn Conley1, Paul Esker3, Ann MacGuidwin2, and Damon Smith2
(1)Agronomy, University of Wisconsin-Madison, Madison, WI(2)Plant Pathology, University of Wisconsin-Madison, Madison, WI(3)Universidad de Costa Rica, San Jose, Costa Rica
2014 Wisconsin Crop Management Conference, Madison, WIJanuary 16, 2014

2 / 31
Outline
• Introduction to SCN and SDS• Cross Relationships• WI Study• Management Recommendations• Questions

3 / 31
SCN
• Soybean cyst nematode (Heterodera glycines)
• Non-segmented roundworm in the soil
• Females form cysts which contain eggs
• 1 cyst may contain 40 to 700 eggs
Image Sources: University of Missouri Extension, Iowa St. University Extension, University of Maryland

4 / 31
SCN
• Symptoms• Stunting• Chlorosis• Uneven canopy closure• Early maturity
• Symptoms might not always be visible!!!
Image sources: University of Nebraska-Lincoln Extension, Purdue University Extension

5 / 31
SCN in Wisconsin• First found in Racine
County in 1981
• Has spread to >90% of soybean producing counties in the state

6 / 31
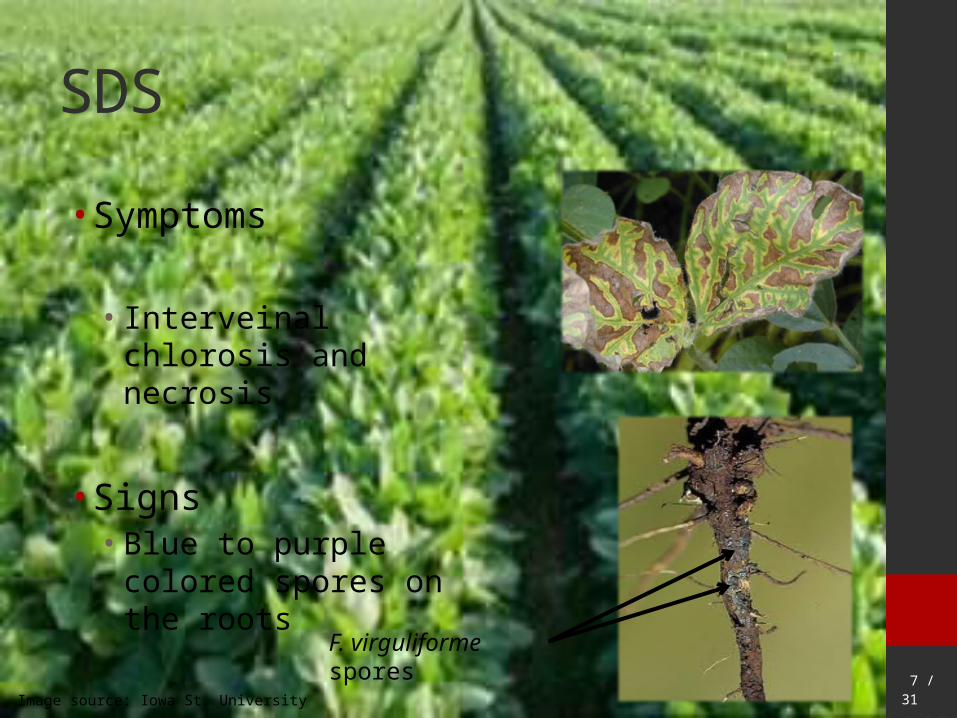
SDS
• Sudden death syndrome (SDS)
• Causal agent: • Fusarium virguliforme• Fungus which inhabits the soil
7 / 31
SDS
• Symptoms
• Interveinal chlorosis and necrosis
• Signs• Blue to purple colored
spores on the roots
F. virguliforme spores
Image source: Iowa St. University

8 / 31
SDS in Wisconsin• Soybean plants with
typical SDS symptoms collected in 6 counties
• SDS confirmed in 5 counties (Bernstein et al. 2007)
?

9 / 31
Cross Relationships
• Relationship between SCN and SDS has been examined for about 30 years• Survey found SCN was associated with 70-80% of SDS
infected plants in 30 fields across 4 states (Hirrel, 1983)
• Studies have shown positive correlation between populations of SCN and SDS foliar symptoms • For example, McLean and Lawrence (1993) showed SDS
symptoms occurred 3 to 7 days earlier and were more severe in plots infested with SCN and F. virguliforme than plots infested with F. virguliforme alone

10 / 31
Cross Relationships
• On the other hand…..
• Weak to no correlation between SCN and SDS• Gao et al. (2006) reported the presence of both pathogens
reduced soybean growth, but SCN did not increase SDS symptoms
• Sherm et al. (1998) did not always observe significant correlations between SCN and F. virguliforme population densities

11 / 31
Wisconsin Study
• Relationship Between Fusarium virguliforme and Heterodera glycines in Commercial Soybean (Glycine max) Fields in Wisconsin• Recently accepted in Plant Health Progress• Authors: Marburger, D., Conley, S., Esker, P., MacGuidwin, A., and
Smith, D.

12 / 31
Objectives
1. Determine the incidence of SCN and F. virguliforme (SDS fungus) in commercial soybean fields in WI
2. Determine if establishment of these pathogens is interrelated
Source: Marburger et al. (in press)

13 / 31
Materials and Methods
• Study was possible through the check-off funded Wisconsin Soybean Marketing Board (WSMB) program which offers FREE SCN soil testing for Wisconsin growers
• Soil samples that were voluntarily submitted during 2011 and 2012 were tested for SCN and F. virguliforme
Source: Marburger et al. (in press)

14 / 31
Materials and Methods
• SCN screening
• 100 cm3 subsample
• Wet-sieving and centrifugal-flotation methods
• Counted the number of eggs
Source: Marburger et al. (in press) Image source: UW-Madison and Iowa St. University

15 / 31
Materials and Methods
• F. virguliforme screening• Used real-time quantitative polymerase chain reaction
(qPCR)
• Selected a F. virguliforme-specific primer set from the literature (Mbofung et al., 2011)
• Spores g soil-1 = [10((Cq value – 45.721) / -3.393)] * 2.
Source: Marburger et al. (in press)

16 / 31
Statistical Analyses
• Divided our data into two sets1. Samples where neither pathogen was found
(n=311)2. Samples where at least 1 or both pathogens
were detected (n=124)
• Used the second data set to measure the correlation between presence of both pathogens (Kendall tau rank correlation)
Source: Marburger et al. (in press)

17 / 31
2011 Results
• 135 samples submitted
• 56 positive for SCN
• 10 positive for F. virguliforme
H. glycines F. virguliformeCounty #Samples #Detected Populationa #Detected Populationb
Jefferson 18 11 50 – 9,300 3 32,140 – 401,252Rock 17 6 100 – 1,250 2 DDunn 12 7 75 – 1,375 0 0Barron 10 0 0 N/A N/ADane 10 3 900 – 2,450 1 DDodge 9 8 150 – 10,050 1 DUnknownc 7 7 5 – 1,050 0 0St Croix 6 0 0 N/A N/AWalworth 6 3 100 – 7,475 0 0Grant 5 2 125 – 1,775 0 0Iowa 5 1 6 1 DPolk 4 0 0 N/A N/ATrempealeau 4 0 0 N/A N/AFond du Lac 3 0 0 N/A N/ALafayette 3 0 0 N/A N/AOutagamie 3 3 975 – 4,000 2 D – 15,761Sheboygan 3 0 0 N/A N/AWashington 3 3 5 0 0Waukesha 3 0 0 N/A N/ASauk 2 0 0 N/A N/ABuffalo 1 1 4,550 0 0Eau Claire 1 1 5 0 0Totals 135 56 0 – 10,050 10 D – 401,252 aCounty-wide range in number of eggs/100 cc soil from samples where H. glycines was detectedbCounty-wide range of estimated number of spores/g soil from detected samples; D: detected but not quantifiable; N/A: sample not screened for F. virguliformecSoil samples submitted to the laboratory without site information
Table modified from Marburger et al. (in press)Figure from Marburger et al. (in press)

18 / 31
2012 Results
• 318 samples submitted
• 64 positive for SCN
• 13 positive for F. virguliforme
Table modified from Marburger et al. (in press)Figure from Marburger et al. (in press)
H. glycines F. virguliformeCounty #Samples #Detected Populationb #Detected Populationb
Brown 45 14 5 – 20,500 3 D – 10,778Fond du Lac 36 12 5 – 37,200 0 0Dodge 34 6 5 – 3,650 0 0Rock 27 4 5 - 825 4 D – 11,226Sheboygan 22 1 5 1 DManitowoc 21 0 0 1 DGreen 14 5 5 – 3,375 2 DChippewa 11 1 5 0 0Outagamie 11 3 5 - 75 0 0Jackson 8 1 5 0 0Trempealeau 8 1 200 0 0Waupaca 8 0 0 1 DCalumet 7 1 10 0 0Dunn 6 4 5 - 275 0 0Jefferson 6 2 5 - 150 0 0Walworth 6 3 5 – 3,250 1 10,705Eau Claire 5 0 0 0 0Grant 5 1 5,025 0 0Pierce 5 0 0 0 0Oconto 4 1 5 0 0St Croix 4 0 0 0 0Winnebago 4 1 200 0 0Columbia 3 0 0 0 0Green Lake 3 0 0 0 0Pepin 3 0 0 0 0Adams 2 2 4,450 – 15,000 0 0Dane 2 0 0 0 0Richland 2 0 0 0 0Vernon 2 0 0 0 0Barron 1 0 0 0 0Clark 1 0 0 0 0La Crosse 1 1 1,275 0 0Lafayette 1 0 0 0 0Totals 318 64 0 – 37,200 13 0 – 11,226aCounty-wide range in number of eggs/100 cc soil from samples where H. glycines was detectedbCounty-wide range of estimated number of spores/g soil from detected samples; D: detected but not quantifiable; N/A: sample not screened for F. virguliforme

19 / 31
Where has F. virguliforme spread?
20122011

20 / 31
Is establishment interrelated?
• Percentage of counties where both pathogens were found (orange and yellow crosshatch)• ~30% in 2011• ~15% in 2012
• Number of soil samples where both pathogens were found in the same sample was low
• Found a negative association between SCN and F. virguliforme (-0.59, P < 0.01, n=124)
• Presence of F. virguliforme most often corresponds to the absence of SCN in the same soil sample and vice versa
Source: Marburger et al. (in press)

21 / 31
Is establishment interrelated?
• Suggested SCN and F. virguliforme do not rely on each other for colonizing fields
Source: Marburger et al. (in press)
Predicted probabilities are based on the logistic model: Probability of Heterodera glycines in a 100 cc soil sample= exp (5.31 – 4.89 Fusarium virguliforme) / [1 + exp (5.31 – 4.89 Fusarium virguliforme)]; Max-rescaled R2 = 0.56; Area under the receiver operator curve (ROC) = 0.94; n=124.

22 / 31
Conclusions from WI Study• Counties testing positive for SCN were representative of the SCN-
confirmed counties in the state• F. virguliforme has spread farther north, east, and west than the area
from which it was originally found in the state• Counties where both pathogens were found occurred infrequently• Number of soil samples where both pathogens were found in the
same sample was low• Found a negative correlation between detecting SCN and F.
virguliforme• As the odds of detecting F. virguliforme in soil approach 100%, the
likelihood of finding SCN in Wisconsin soybean fields is estimated at just 60%.
• This negative correlation suggested that SCN and F. virguliforme do not rely on each other to colonize fields.
Source: Marburger et al. (in press)

23 / 31
Future plans
• Continue this work to include the 2013 season
• Over 700 samples collected thus far
• Where else has F. virguliforme spread to?
• Is there still a negative relationship?

24 / 31
Management Recommendations
• First thing to do?
•Soil sample!!
Image source: University of Kentucky

25 / 31
SCN Management• Begins with the 3 R’s• Rotate crops• Rotate with resistant
varieties• Rotate the resistant
varieties you use• Some seed treatments are
available• Maintain good cultural
practices• Managing weeds• Adequate fertility• Soil pH
Source: coolbean.info
Table from: Soybean Cyst Nematode Sampling and Testing in Wisconsin

26 / 31
SDS Management
• SDS-resistant varieties
• Avoid planting into cool, wet soils• Delay planting?
• Improve soil drainage
• Reduce compaction
• Crop rotationx

27 / 31
What if both are present?
• Choose variety with the best resistance/tolerance to both pathogens
• Continue maintaining good cultural practices
• http://fyi.uwex.edu/fieldcroppathology/

28 / 31
Acknowledgements
• Dr. Shawn Conley’s program
• Dr. Damon Smith’s program
• Dr. Ann MacGuidwin’s program
• Funding

29 / 31
Questions?

30 / 31
References
• Bernstein, E.R., Atallah, Z.K., Koval, N.C., Hudelson, B.D., and Grau, C.R. 2007. First report of sudden death syndrome of soybean in Wisconsin. Plant Dis. 91:9, 1201-1201.
• Gao, X., Jackson, T.A., Hartman, G.L., and Niblack, T.L. 2006. Interactions between the soybean cyst nematode and Fusarium solani f. sp. glycines based on greenhouse factorial experiments. Phytopathology 96: 1409-1415.
• Hirrel, M.C. 1983. Sudden death syndrome of soybean: A disease of unknown etiology. (Abstr.) Phytopathology 73: 501-502.
• Marburger, D., Conley, S., Esker, P., MacGuidwin, A., and Smith, D. Relationship between Fusarium virguliforme and Heterodera glycines in commercial soybean (Glycine max) Fields in Wisconsin. Plant Health Progress. In press.
• Mbofung, G.C.Y, Fessehaie, A., Bhattacharyya, M.K., and Leandro, L.F.S. 2011. A new TaqMan real-time polymerase chain reaction assay for quantification of Fusarium virguliforme in soil. Plant Dis. 95: 1420-1426.
• McLean, K.S. and Lawrence, G.W. 1993. Interrelationship of Heterodera glycines and Fusarium solani in sudden death syndrome of soybean. J. Nematology 25(3): 434-439.
• Scherm, H., Yang, X.B., and Lundeen, P. 1998. Soil variables associated with sudden death syndrome in soybean fields in Iowa. Plant Dis. 82: 1152-1157.