Embed Size (px)
DESCRIPTION
six sigma
Citation preview
1
The 12 Steps of the Breakthrough Strategy
2
Module Objectives
By the end of this module, the participant will:• Know the 12 Steps of the Breakthrough Process• Understand how the 12 Steps of the Breakthrough Strategy provide
the backbone for six sigma DMAIC projects• Understand the value of the 12 Steps
3
Why Learn About the Breakthrough Strategy?
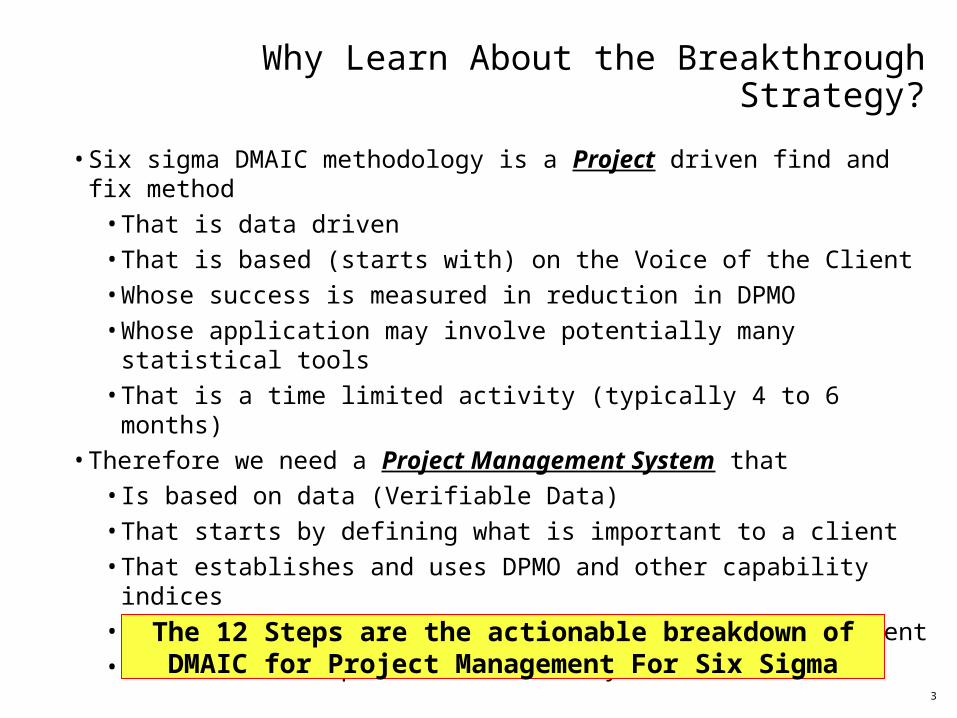
• Six sigma DMAIC methodology is a Project driven find and fix method• That is data driven• That is based (starts with) on the Voice of the Client• Whose success is measured in reduction in DPMO• Whose application may involve potentially many statistical tools• That is a time limited activity (typically 4 to 6 months)
• Therefore we need a Project Management System that• Is based on data (Verifiable Data)• That starts by defining what is important to a client• That establishes and uses DPMO and other capability indices• That keeps the use of the tools organized and efficient• That drives completion on a timely basis
The 12 Steps are the actionable breakdown of DMAIC for Project Management For Six Sigma
4
What is the Breakthrough Strategy?
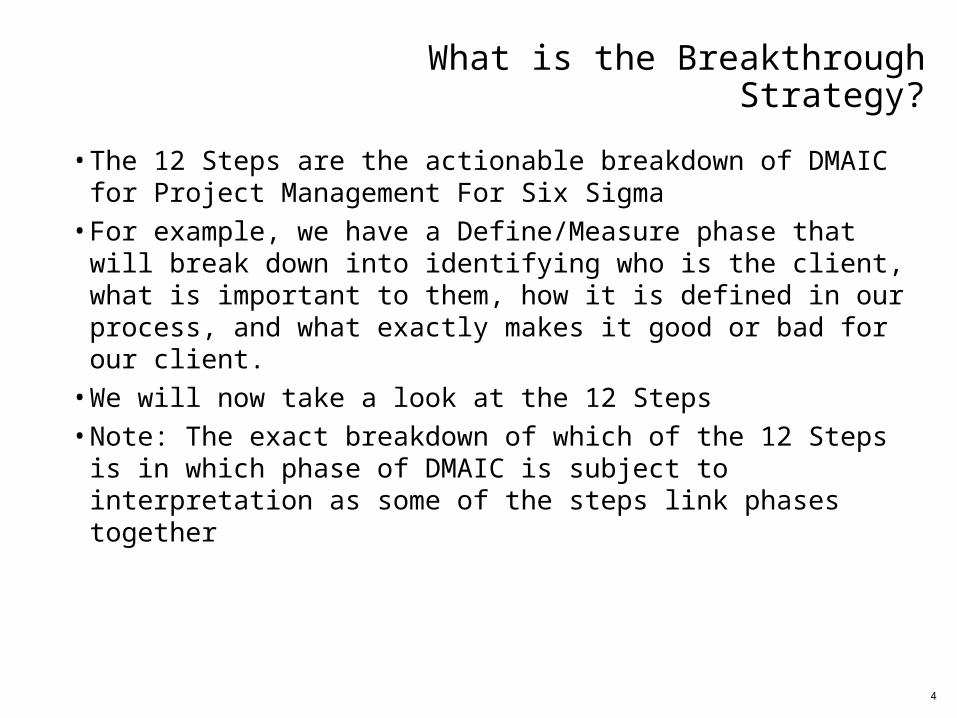
• The 12 Steps are the actionable breakdown of DMAIC for Project Management For Six Sigma
• For example, we have a Define/Measure phase that will break down into identifying who is the client, what is important to them, how it is defined in our process, and what exactly makes it good or bad for our client.
• We will now take a look at the 12 Steps• Note: The exact breakdown of which of the 12 Steps is in which phase
of DMAIC is subject to interpretation as some of the steps link phases together
5
The Breakthrough Strategy
6
12 Steps of the Breakthrough Strategy
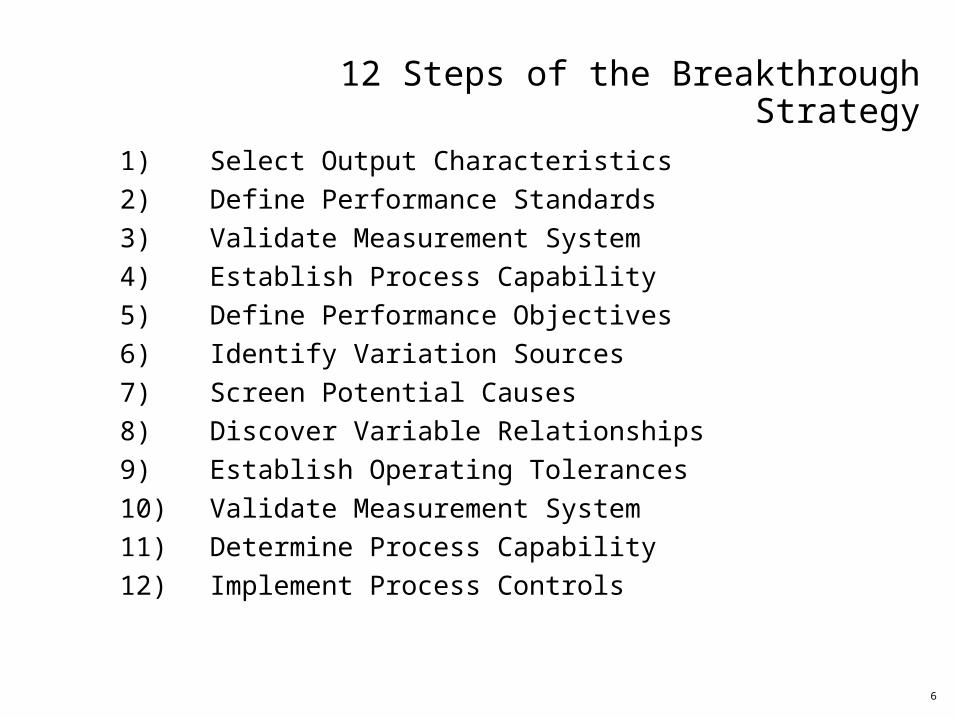
1) Select Output Characteristics
2) Define Performance Standards
3) Validate Measurement System
4) Establish Process Capability
5) Define Performance Objectives
6) Identify Variation Sources
7) Screen Potential Causes
8) Discover Variable Relationships
9) Establish Operating Tolerances
10) Validate Measurement System
11) Determine Process Capability
12) Implement Process Controls
7
Step 1- Select Output Characteristic
The Big Y • You have to have a reason to do a project and that reason should be
something that is bothering a client, either internal or external. There must be clear line of sight to the key issues of the business. If you can’t identify what is important to work on, don’t work on anything• What is Critical to Satisfaction (CTS)? - $$$, Cycle, Defects,
Safety, etc.• If you can’t put a name on it, you can’t do it• If you can’t define the units of measure - be careful! You will end up
having to:• define the units of measure
AND• create a measuring system for the issue at the beginning of your
project
Start of Y = f(?)
8
Step 2 – Define Performance Characteristics
The Spec • If you don’t know what makes something good or bad, how can you
measure the problem in terms of defects (DPMO)?• If the definition of what makes a defect (the specification) is not in
the same units of measure as the selected CTS from step 1, you have the wrong spec
• The definition needs to be crystal clear and brief• Does your client agree with your spec?
What is a “good” Y? What is a “bad” Y?
9
Step 3 –Validate Measurement System
Can I See?• If you can’t measure something, how do you know where you are,
where you have been, or where you are going?• If your measuring system is incapable, STOP and FIX IT before
proceeding• Note: MSA must be done on any and all defects you wish to count
(watch out if you have a visual inspection of 6 characteristics)
Is it really Y?
10
Step 4 –Establish Product Capability
Baseline• I know what needs to be fixed (step1), what defines it as good or
bad (step 2), and I can accurately measure it (step 3) so:• Now I can say how my process is performing in terms of long
and short term Z and DPMO• I improve from here
• Common tools: 6 Sigma “Process Report” for continuous data & “Product Report” for discrete data
What is your ability to make “good” Y’s?
11
Step 5 – Define Performance Objectives
My Goal • Where do I want to be at the end of my project?
• The goal should be a stretch• Use logic when setting goals• Do I need to Benchmark?• Is the goal aligned with the business strategy?• Where do I want to be and when do I want to be there?• Does achieving the project goal also achieve entitlement?
What does your ability to make “good” Y’s need to be?
12
Step 6 –Identify Variation Sources
What makes it tick?• List all potential inputs (PIV, X) that could effect my output
(KPOV,Y)• This is filling the top of the funnel• Some tools include fishbone, C&E matrix, FMEA, detailed process
maps• Think outside the box - if you fix it the same way you did last year,
you will have the same problem you have now
Potential X’s for Y = f(X1, X2, …, Xn)
13
Step 7 – Screen Potential Causes
Narrow it Down • Screening is done using Graphical Tools, Experiments, and
Hypothesis Tests to identify and prove which are the vital X’s • This is the middle of the funnel for most projects (multiple X’s or
with variable relationships between X’s)• for some simpler projects with a single X, this is the bottom of
the funnel, the final vital X
Important X’s for Y = f(X1, X2, …, Xn) – we still need to determine “f”
14
Step 8 – Discover Variable Relationships
How the X’s affect Y
• Evaluate how my Vital X’s affect Y, either independently or in combination with other Vital X’s. This is primarily done through the use of DOE (Regression)
• This is the bottom of the funnel, I know which X’s affect my Y and I know how they affect Y
• The function Y = f(X1, X2,…, Xn) is called a “transfer function” – it describes how a change in one or more of the X’s transfers to a change in Y
We now know what Y = f(X1, X2, …, Xn) is
15
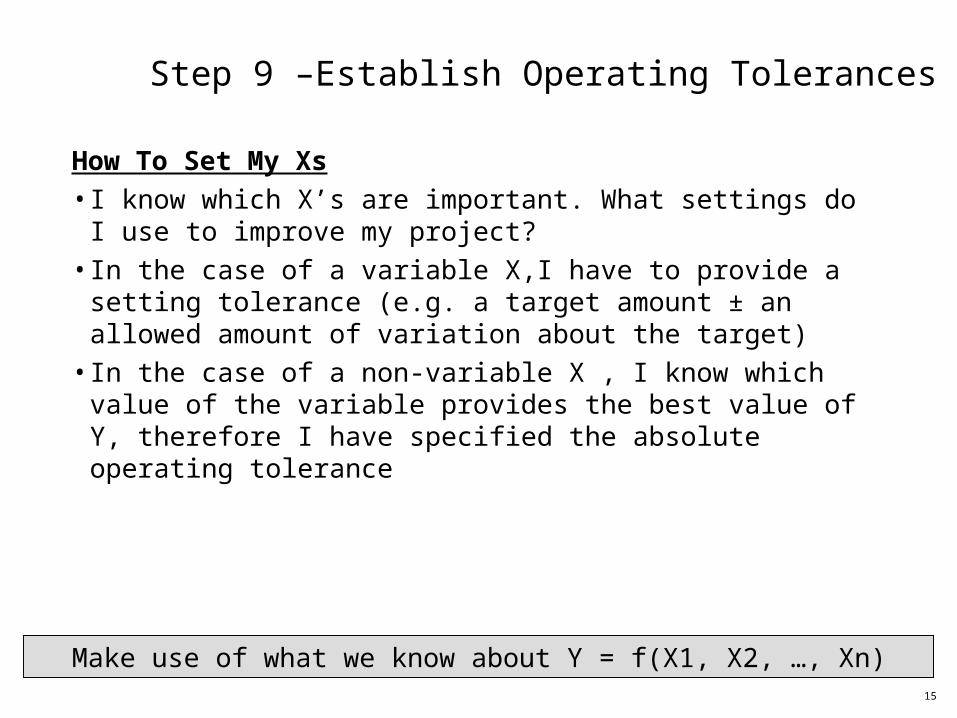
Step 9 –Establish Operating Tolerances
How To Set My Xs• I know which X’s are important. What settings do I use to improve
my project?• In the case of a variable X,I have to provide a setting tolerance
(e.g. a target amount ± an allowed amount of variation about the target)
• In the case of a non-variable X , I know which value of the variable provides the best value of Y, therefore I have specified the absolute operating tolerance
Make use of what we know about Y = f(X1, X2, …, Xn)
16
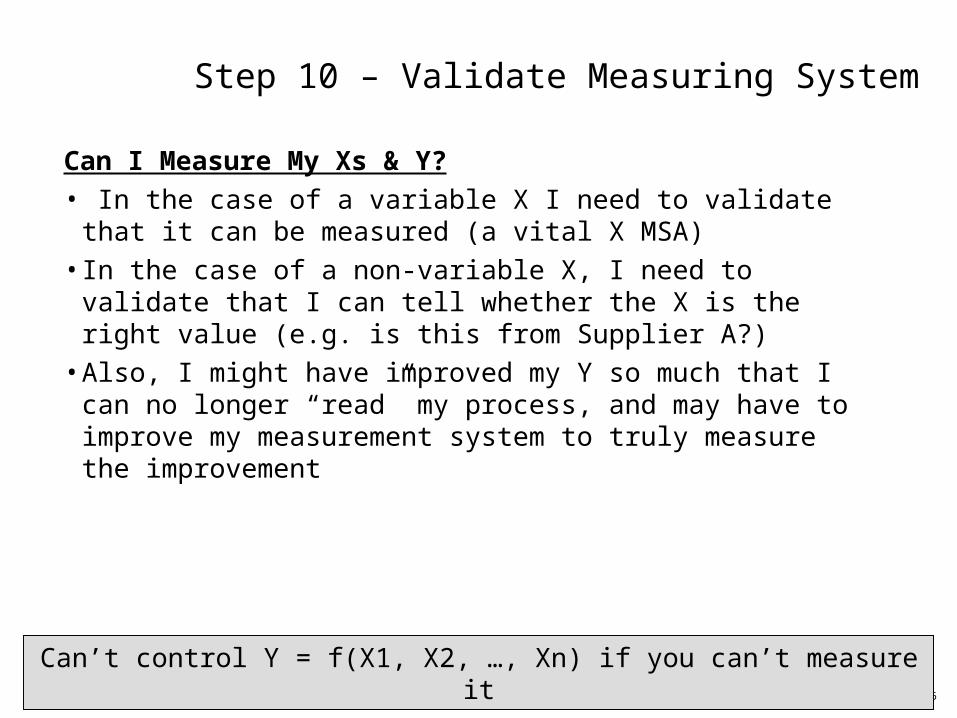
Step 10 – Validate Measuring System
Can I Measure My Xs & Y?• In the case of a variable X I need to validate that it can be
measured (a vital X MSA)• In the case of a non-variable X, I need to validate that I can tell
whether the X is the right value (e.g. is this from Supplier A?)• Also, I might have improved my Y so much that I can no longer
“read” my process, and may have to improve my measurement system to truly measure the improvement
Can’t control Y = f(X1, X2, …, Xn) if you can’t measure it
17
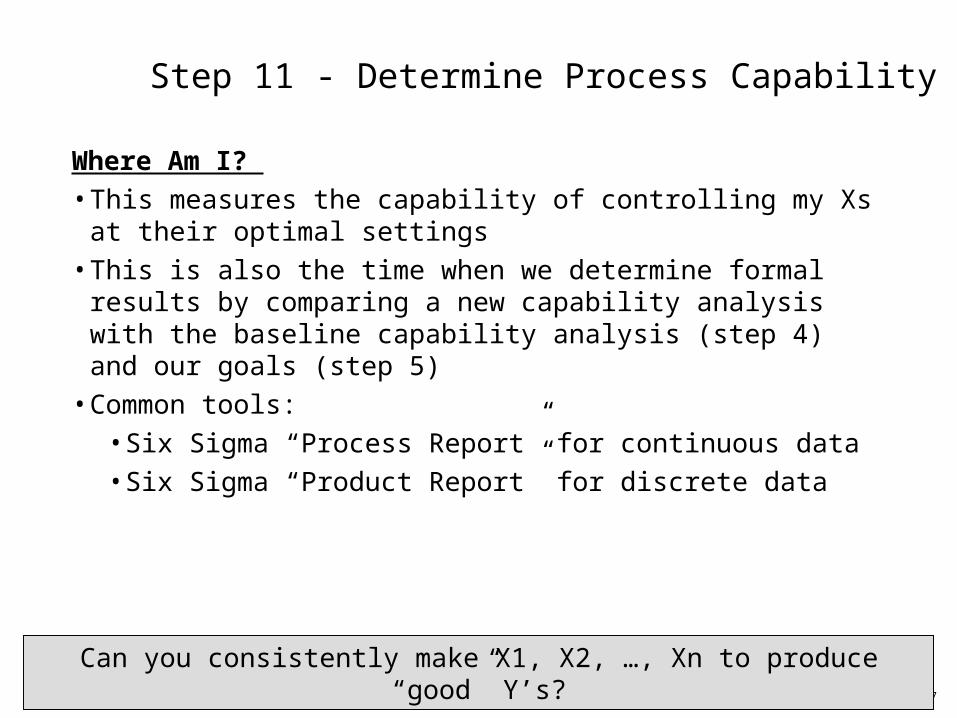
Step 11 - Determine Process Capability
Where Am I? • This measures the capability of controlling my Xs at their optimal
settings• This is also the time when we determine formal results by
comparing a new capability analysis with the baseline capability analysis (step 4) and our goals (step 5)
• Common tools:• Six Sigma “Process Report” for continuous data• Six Sigma “Product Report” for discrete data
Can you consistently make X1, X2, …, Xn to produce “good” Y’s?

18
Step 12 - Implement Process Controls
Let’s Not Do This Again • The X’s you have determined as vital, their settings, and other
actions you have taken to make the improvement must be:• nailed down• set in concrete• fully implemented (NOT just agreed to)• put into a rigorous audit schedule• Documented in a Control Plan
BEFORE you can say a project is closed!
How do you control X1, X2, …, Xn to always produce “good” Y’s?
19
Benefits of Following the 12 Steps
• It is a logical and proven method for achieving success• Would you want to give a baseline DPMO (step4) if you did not trust
your data (step 3)?• Would you put 6 months into fixing a client’s problem and then not
bother to control it to assure ongoing value (step 12)?• Etc.
• It provides a roadmap for your activities• It prevents “jumping to conclusions” and “firefighting”• It forces data to be evaluated before it is used• It provides a skeleton upon which to hang the various analytical and
statistical tools in the six sigma toolbox
20
Module Summary
The participant should:• Know the 12 Steps of the Breakthrough Process• Understand how the 12 Steps of the Breakthrough Strategy provide
the backbone for six sigma DMAIC projects• Understand the value of the 12 Steps
21
ML Six Sigma Roadmaps
22
Module Learning Objectives
• By end of this module participants will have reviewed:
• An introduction, via 3 roadmaps, to the 5 phases of ML Six Sigma (Define, Measure, Analyze, Improve & Control). A 5th week of focused training on DFSS will be available in the future – This training is optional. You will be advised of training dates.
• Roadmap 1 - High level guideline project path. • Roadmap 2 - 5 phases without detailed tools • Roadmap 3 - Detailed phases with applicable tools
Note:• Roadmaps are included throughout the training and will intentionally be repeated daily to orient specific
training sections to the 5 phase methodology.
• Roadmaps 1, 2 and 3 (applicable phase only) are shown at beginning of each week. Additionally, Roadmap 3 (applicable phase) is shown at the beginning and end (use Display Roadmap 3) of each day of training.
• Display Maps (put on wall) – Roadmaps 1, 2 and 3 (applicable phase). Instructor to close each day (with Roadmap 3 only) and week using Display Maps. Close Day 5 with review of Roadmap 3 for previous and next phase.
23
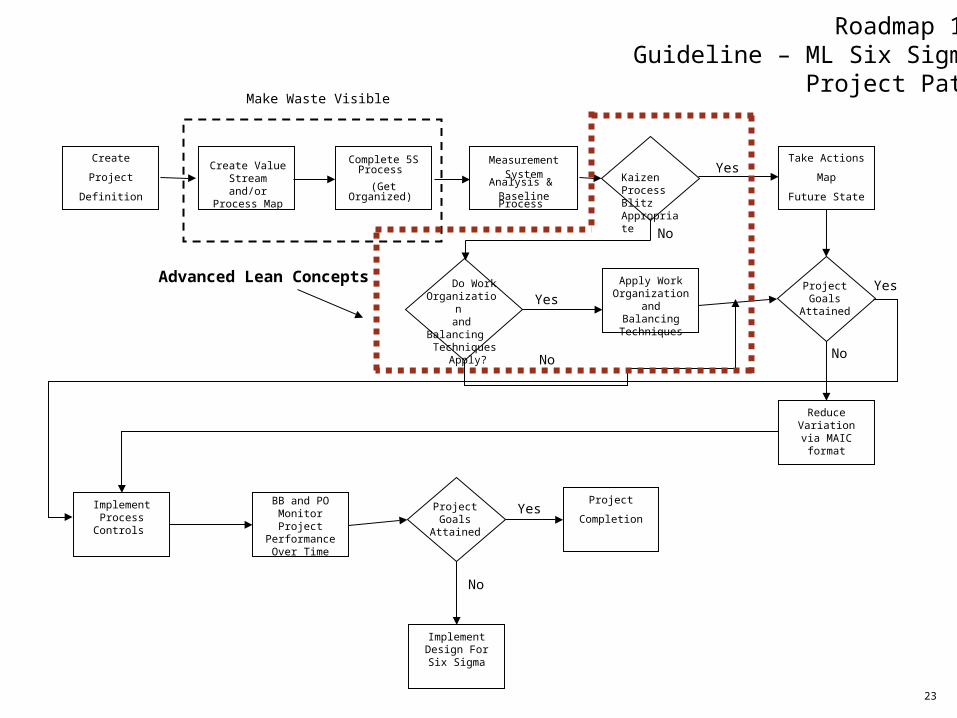
Roadmap 1:Guideline – ML Six Sigma
Project Path
BB and PO Monitor Project Performance Over Time
Apply Work Organization
and Balancing Techniques
Implement Process Controls
Take Actions
Map
Future State
Complete 5S Process
(Get Organized)
Create Value Stream and/or Process Map
Reduce Variation via MAIC format
Create
Project
Definition
Kaizen Process BlitzAppropriate
Yes
Project Goals
Attained
Yes
No
No
Make Waste Visible
Project Goals
Attained
Project
CompletionYes
Implement Design For Six
Sigma
No
MeasurementSystem Analysis
& Baseline Process
Do WorkOrganization
and Balancing Techniques
Apply?
Yes
No
Advanced Lean Concepts
24
Monitor Project
Performance
Over Time
Implement
Process
Controls
Determine Capability for
Improved Process
Validate Measurement Systems and Improvements
Establish
Operating
Tolerances
Discover
Variable
Relationships
Identify Vital
Few X’s from
Trivial many
Graphical Analysis of Families of Variation
Establish
Baseline
Capability
Validate
Measurement
Systems
Identify Actions
Map
Future State
Define
Performance
Standard(Y)
Make Waste Visible & Prioritize
Opportunities
Select
CTQ
Characteristic
Screen
Potential
Causes
Statistical Analysis of Families of Variation
Create
Project
Definition
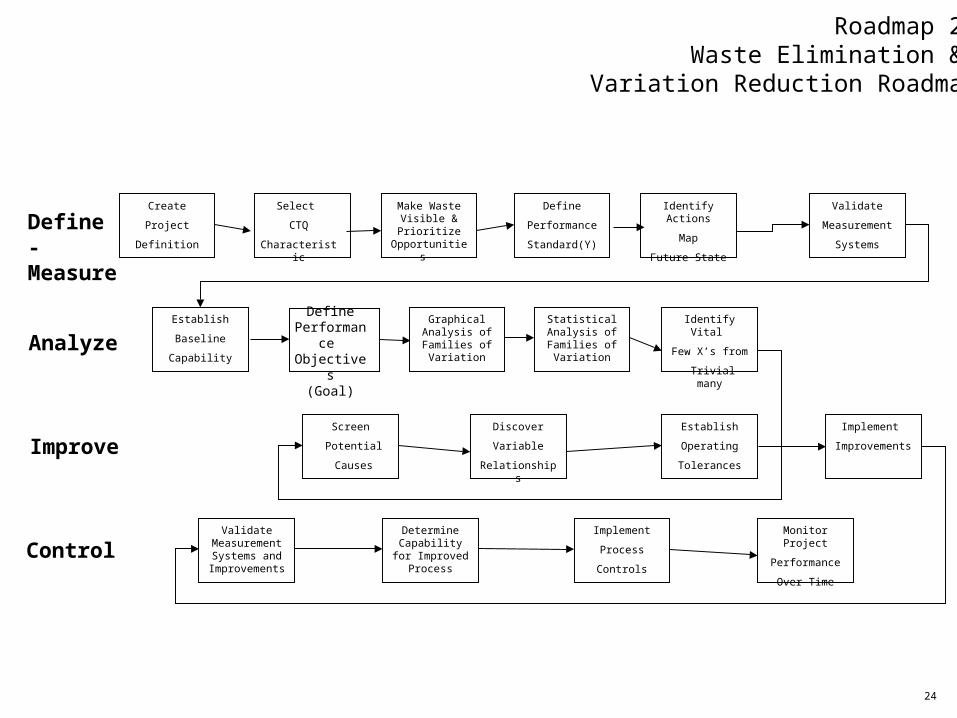
Define - Measure
Analyze
Improve
Control
Roadmap 2:Waste Elimination &
Variation Reduction Roadmap
Implement
Improvements
DefinePerformance Objectives
(Goal)
25
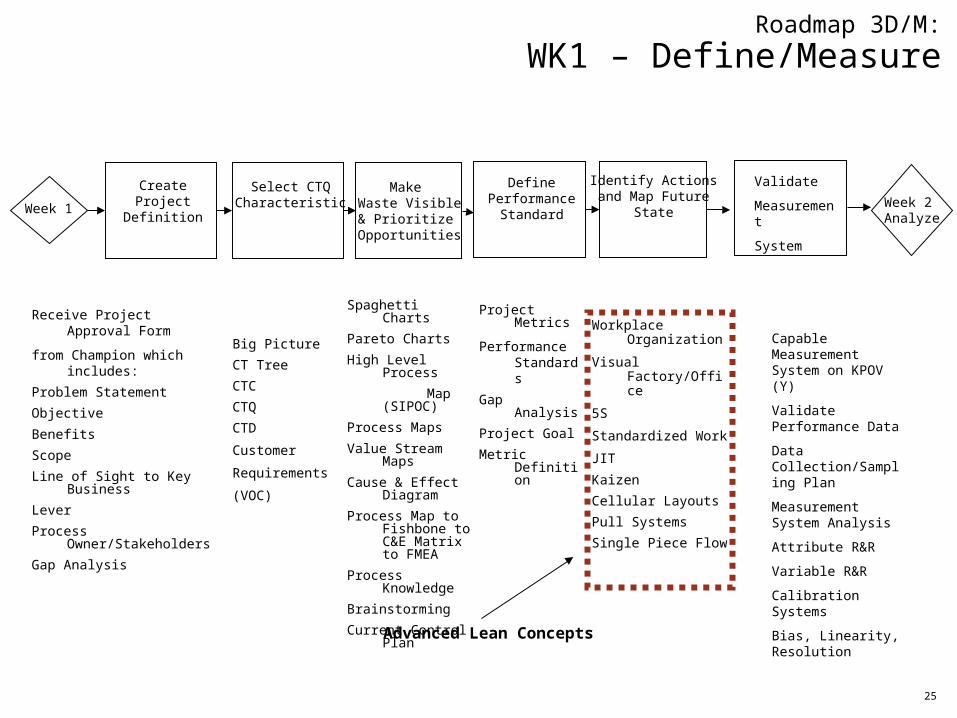
Roadmap 3D/M:
WK1 – Define/Measure
Receive Project Approval Form
from Champion which includes:
Problem Statement
Objective
Benefits
Scope
Line of Sight to Key Business
Lever
Process Owner/Stakeholders
Gap Analysis
Big Picture
CT Tree
CTC
CTQ
CTD
Customer
Requirements
(VOC)
Project Metrics
Performance Standards
Gap Analysis
Project Goal
Metric Definition
Spaghetti Charts
Pareto Charts
High Level Process
Map (SIPOC)
Process Maps
Value Stream Maps
Cause & Effect Diagram
Process Map to Fishbone to C&E Matrix to FMEA
Process Knowledge
Brainstorming
Current Control Plan
Week 1
CreateProject
Definition
Make Waste Visible &
Prioritize Opportunities
Identify Actionsand Map Future
StateWeek 2Analyze
Select CTQCharacteristic
DefinePerformance
Standard
Workplace Organization
Visual Factory/Office
5S
Standardized Work
JIT
Kaizen
Cellular Layouts
Pull Systems
Single Piece Flow
Advanced Lean Concepts
Validate
Measurement
System
Capable Measurement System on KPOV (Y)
Validate Performance Data
Data Collection/Sampling Plan
Measurement System Analysis
Attribute R&R
Variable R&R
Calibration Systems
Bias, Linearity, Resolution
26
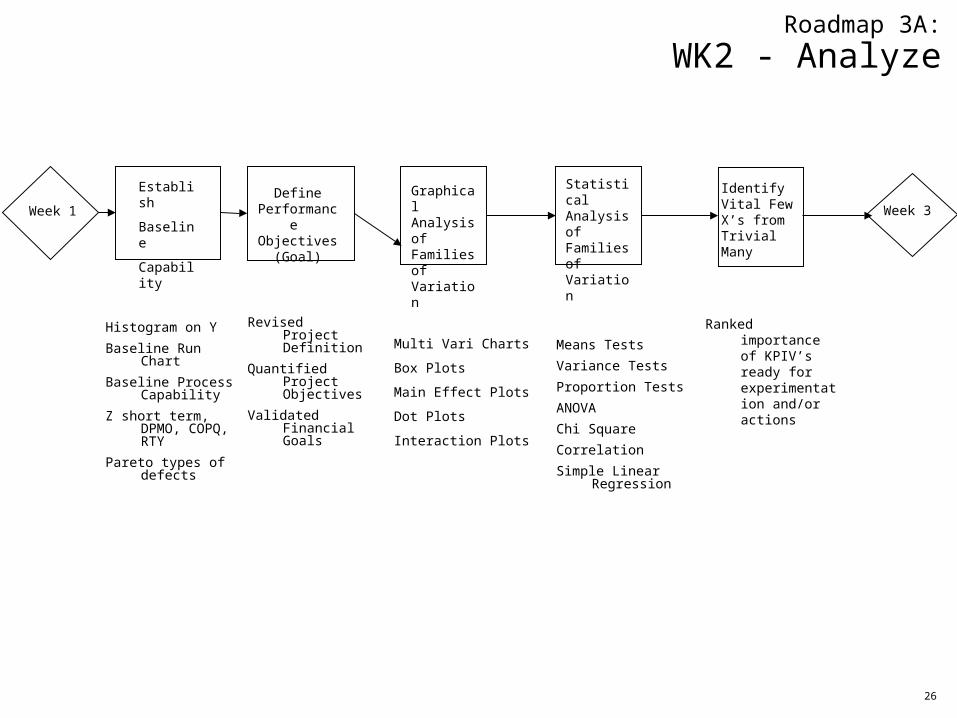
Histogram on Y
Baseline Run Chart
Baseline Process Capability
Z short term, DPMO, COPQ, RTY
Pareto types of defects
Revised Project Definition
Quantified Project Objectives
Validated Financial Goals
Week 1Define
Performance Objectives
(Goal)
Week 3
Roadmap 3A:
WK2 - Analyze
Establish
Baseline
Capability
Graphical Analysis of Families of Variation
Statistical Analysis of Families of Variation
Identify Vital Few X’s from Trivial Many
Multi Vari Charts
Box Plots
Main Effect Plots
Dot Plots
Interaction Plots
Means Tests
Variance Tests
Proportion Tests
ANOVA
Chi Square
Correlation
Simple Linear Regression
Ranked importance of KPIV’s ready for experimentation and/or actions
27
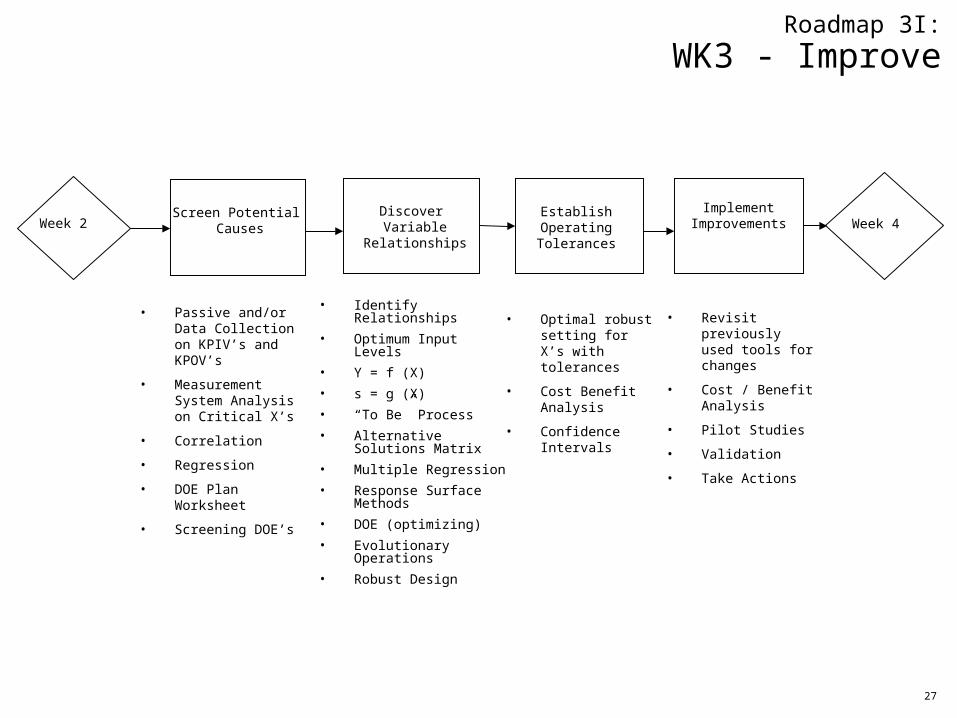
• Passive and/or Data Collection on KPIV’s and KPOV’s
• Measurement System Analysis on Critical X’s
• Correlation
• Regression
• DOE Plan Worksheet
• Screening DOE’s
• Identify Relationships
• Optimum Input Levels
• Y = f (X)
• s = g (X)
• “To Be” Process
• Alternative Solutions Matrix
• Multiple Regression
• Response Surface Methods
• DOE (optimizing)
• Evolutionary Operations
• Robust Design
• Optimal robust setting for X’s with tolerances
• Cost Benefit Analysis
• Confidence Intervals
Week 2Screen Potential
CausesEstablish Operating
Tolerances
Week 4Discover Variable
Relationships
Roadmap 3I:
WK3 - Improve
ImplementImprovements
• Revisit previously used tools for changes
• Cost / Benefit Analysis
• Pilot Studies
• Validation
• Take Actions
28
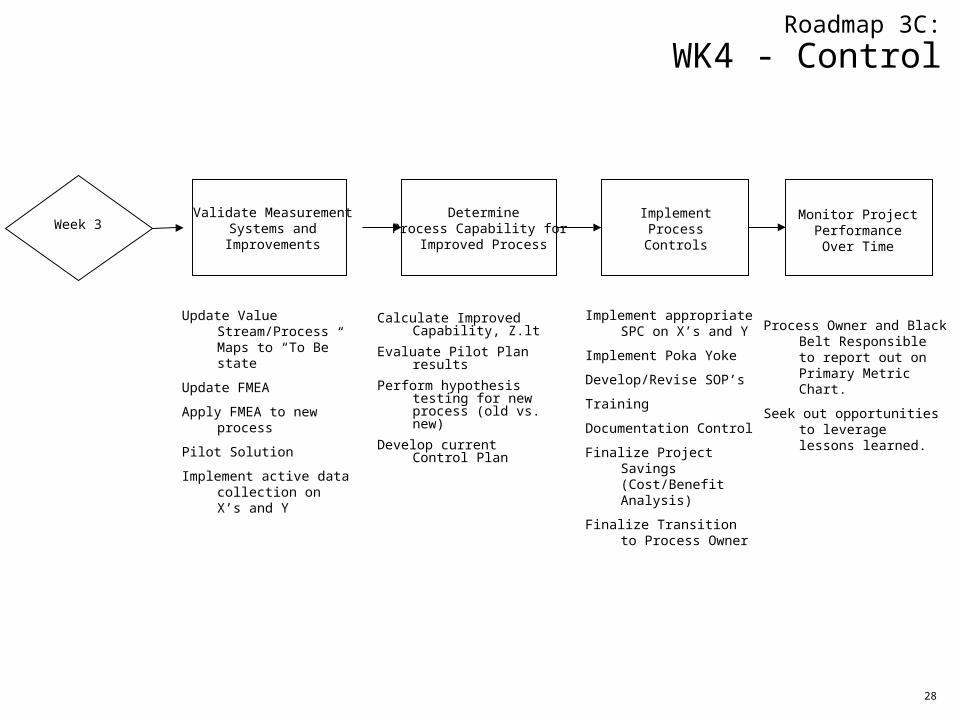
Update Value Stream/Process Maps to “To Be” state
Update FMEA
Apply FMEA to new process
Pilot Solution
Implement active data collection on X’s and Y
Calculate Improved Capability, Z.lt
Evaluate Pilot Plan results
Perform hypothesis testing for new process (old vs. new)
Develop current Control Plan
Implement appropriate SPC on X’s and Y
Implement Poka Yoke
Develop/Revise SOP’s
Training
Documentation Control
Finalize Project Savings (Cost/Benefit Analysis)
Finalize Transition to Process Owner
Process Owner and Black Belt Responsible to report out on Primary Metric Chart.
Seek out opportunities to leverage lessons learned.
Week 3Validate Measurement
Systems andImprovements
ImplementProcessControls
DetermineProcess Capability for
Improved Process
Monitor ProjectPerformanceOver Time
Roadmap 3C:
WK4 - Control

29
Module Learning Objectives
• By end of this module participants will have reviewed:
• An introduction, via 3 roadmaps, to the 5 phases of ML Six Sigma (Define, Measure, Analyze, Improve & Control). A 5th week of focused training on DFSS will be available in the future – This training is optional. You will be advised of training dates.
• Roadmap 1 - High level guideline project path. • Roadmap 2 - 5 phases without detailed tools • Roadmap 3 - Detailed phases with applicable tools
Note:• Roadmaps are included throughout the training and will intentionally be repeated daily to orient specific
training sections to the 5 phase methodology.
• Roadmaps 1, 2 and 3 (applicable phase only) are shown at beginning of each week. Additionally, Roadmap 3 (applicable phase) is shown at the beginning and end (use Display Roadmap 3) of each day of training.
• Display Maps (put on wall) – Roadmaps 1, 2 and 3 (applicable phase). Instructor to close each day (with Roadmap 3 only) and week using Display Maps. Close Day 5 with review of Roadmap 3 for previous and next phase.

Trademarks and Service Marks
Six Sigma is a federally registered trademark of Motorola, Inc.
Breakthrough Strategy is a federally registered trademark of Six Sigma Academy.
ESSENTEQ is a trademark of Six Sigma Academy.
METREQ is a trademark of Six Sigma Academy.
Weaving excellence into the fabric of business is a trademark of Six Sigma Academy.
FASTART is a trademark of Six Sigma Academy.
Breakthrough Design is a trademark of Six Sigma Academy.
Breakthrough Lean is a trademark of Six Sigma Academy.
Design with the Power of Six Sigma is a trademark of Six Sigma Academy.
Legal Lean is a trademark of Six Sigma Academy.
SSA Navigator is a trademark of Six Sigma Academy.
SigmaCALC is a trademark of Six Sigma Academy.
SigmaFlow is a trademark of Compass Partners, Inc.
SigmaTRAC is a trademark of DuPont.
MINITAB is a trademark of Minitab, Inc.