Embed Size (px)
Citation preview

12345678901112131415161718192021222324252627282930313233343536373839404142434445
9 The Decline of the DeathPenaltyHow Media Framing Changed Capital Punishment in America
Frank R. Baumgartner, Suzanna Linn, and Amber E. Boydstun1
Introduction
A majority of Americans has long supported the death penalty and, on moralgrounds, most still do. However, like any issue under the right circumstances,even capital punishment is subject to framing effects. In this chapter we drawfrom a larger book project (Baumgartner, De Boef, and Boydstun 2008) toexplore the impact of framing on public policy—specifically, on the number ofhuman beings sentenced to death each year.
We document the dramatic rise of a new way of thinking about the deathpenalty in America the “innocence frame.” This frame rests on the notion thatthe American criminal justice system, dealing as it does with thousands of cases,is not immune from mistakes. Attention to the possibility of error in theparticular case of the death penalty raises concerns among even those whosupport capital punishment in the abstract, as most Americans do. As theinnocence frame has become more prominent in public discussion, the morality-based and constitutionality-based frames that have traditionally dominated thedeath-penalty debate have declined in relative importance. The result of thisshift in framing has been a marked shift in aggregate public opinion and, evenmore strikingly, a dramatic decline in the willingness of juries to impose deathsentences across the country.
Yet while the importance of framing has been well-documented (in theprevious eight chapters of this book, for instance!) and, as we will show, the riseof the innocence frame in the death-penalty debate has been especially dramatic,we must consider the null hypothesis that capital punishment policy is drivennot by media coverage but by underlying phenomena in the criminal justicesystem alone. Our analyses refute this null hypothesis. We demonstrate thepowerful effects of framing on death sentences even while controlling for the crime rate and the number of individuals exonerated from death row. Mediaframing in the case of the death penalty has a profound influence on publicpolicy above and beyond these real-world cues.
The link between framing and public policy is well established. Shifts in theframing of nuclear power, pesticides, tobacco, and, we demonstrate here, the
Winning-01-main text.qxd 2/6/09 09:53 Page 159
FIRST PROOFS - NOT FOR PUBLICATION

death penalty, have dramatic effects on policy (Baumgartner and Jones 1993;Schneider and Ingram 1993; Riker 1986). Framing drives policy makingthrough a number of different channels, and key among these is public opinion.As many authors have shown, the way an issue is defined can powerfully affectthe audience’s perception of the issue (see Chapters 6 and 7; see also Druckman2001; Jacoby 2000; Nelson, Clawson, and Oxley 1997; Nelson and Oxley 1999;Pollock 1994; Terkildsen and Schnell 1997; Tversky and Kahneman 1986).
Sometimes the effects that framing has on public opinion and policy makingserve to augment events, sometimes they trump events, and sometimes framingeffects can set in motion a social cascade—the rapid spread of information, likewildfire, throughout and between social networks. Such is the case in the recenthistory of the death penalty. Arguments that the system is broken—that theprocess, run by bureaucrats, is inevitably prone to errors—have resulted in adramatic reduction in the number of death sentences handed down by juries inthe United States, beyond that explained by the empirical evidence that mistakesare made. Further, as we show in greater detail in the larger project from whichthis chapter is drawn (Baumgartner, De Boef, and Boydstun 2008), initialsuccess in drawing attention to the new innocence frame contributed to thesystem of positive feedback, promoting the mobilization of student-led“innocence projects” in many journalism and law schools throughout thecountry. These innocence projects have uncovered more examples of innocentson death row, which in turn have led to greater attention to the problem. Thepositive-feedback mechanism we note here is typical of many social cascadesand in this case explains a dramatic explosion in attention to the concept ofinnocence since the late 1990s.
Here, we expand on our previous analyses, tracing framing of the death-penalty debate and its impact on public policy and building a statistical modelthat predicts an important measure of policy outcomes and shows strong framingeffects even while controlling for relevant real-world indicators. Our focus is onthe rise of the appeal of innocence-based arguments against the death penaltyand their effect on the annual number of death sentences in the United States.Our emphasis here is on aggregate, national-level framing effects, public opinion,and policy change.
We begin by documenting and measuring the rise of the innocence frame,presenting evidence that public discussion of the death penalty has been alteredby a new and unprecedented focus on the possibility of errors in the system, an eventuality with which no one is comfortable. The “innocence frame” has resonated more than previous arguments, bringing together a cluster ofpreviously existing, but distinct, arguments into a single frame likely to havegreater effect on public discourse than the same arguments considered sepa-rately. More broadly, we show attention has focused on different dimensions ofthe debate during different historical periods. Through a comprehensive analysisof the content of nearly four thousand stories relating to the death penalty inthe past 45 years, we trace these substantive shifts in the nature of the debate.And against the backdrop of this shifting debate we demonstrate the unprece-
12345678901112131415161718192021222324252627282930313233343536373839404142434445
160 Impact
Winning-01-main text.qxd 2/6/09 09:53 Page 160
FIRST PROOFS - NOT FOR PUBLICATION
dented power of the new “innocence frame” in influencing public policy,measured here by the annual number of death sentences issued in the UnitedStates over this same time period.
A Theory of Dynamic Framing and a Method of Measurement
Many have noted the importance of issue-framing, or issue-definition, in publicpolicy making. From Schattschneider (1960) to Cobb and Elder (1972) toKingdon (1984) to Baumgartner and Jones (1993), such a focus has been astaple in studies of agenda-setting. Baumgartner and Jones were arguably themost systematic in tracing the level and tone of news coverage to particularissues over time. They showed for example that news coverage toward thepesticides and nuclear industries was sometimes overwhelmingly positive, butlater switched to be overwhelmingly negative. Public policy, they argued, wasclosely related to these shifting foci of public discussion—where there were“waves of enthusiasm,” government actions supported the development of theindustry; where “waves of criticism” were apparent, officials attacked andregulated those same industries (Baumgartner and Jones 1993, p. 84). “Goodnews” and “bad news” have policy consequences.
Policy issues are much more complex than only positive and negative, goodand bad, or any other single dimension; more recently the focus in the empiricalstudy of issue-definition has moved to the analysis of how multidimensionalissues are simplified in public debate so that only a few dimensions are the objectof significant discussion. The multidimensional nature of policy debates hasbeen the object of attention from dozens of scholars ranging from Riker (1986)to Schneider and Ingram (1993) to Stone (1989, 2002) to Poole and Rosenthal(1991), who note that, no matter how complex the underlying set of issues,congressional responses can be arrayed along one or two dimensions. BryanJones discussed these issues in some detail in developing a model of decisionmaking based on multidimensional choice (2001). In their most recent work,Jones and Baumgartner (2005) have developed a model focusing on theimplications of bounded rationality and the implications of “attention-shifting,”which is when individuals or organizations move their focus from one dimensionof a debate to another (we could also call this process “frame-shifting”). Theyargue that attention-shifts are inevitable in any complex decision-makingenvironment and that these shifts explain the punctuated-equilibrium nature ofpublic policy response. Most policies, most of the time, follow a strongly inertial,status-quo-oriented track, but are occasionally up-ended through fundamentalreconsiderations of how to approach the issue: attention-shifts.
We believe that the death penalty has undergone such a transformation inrecent years, and hence we study it in considerable detail here. The death penalty,of course, in many ways represents a “most difficult case” for framing effects,since for most people it has been so strongly associated with deeply felt religiousor moral views. These views do not change lightly. Thus, the shift that we
12345678901112131415161718192021222324252627282930313233343536373839404142434445
The Decline of the Death Penalty 161
Winning-01-main text.qxd 2/6/09 09:53 Page 161
FIRST PROOFS - NOT FOR PUBLICATION
document is all the more remarkable because it reorients the debate away fromthe morality dimension to an entirely different way of thinking of the issue. Ifit can happen on such a morally charged issue as capital punishment, it canhappen to virtually any issue.
The death penalty itself is the object of a voluminous literature and we do notpropose a comprehensive analysis of the topic (see Banner 2002 for an excellentrecent overview; see also Bedau 1997; Haines 1996; Jost 2001). We focus hereon demonstrating quantitatively the important shifts in attention that haveoccurred in media coverage of the death penalty, the impact of these shifts onthe overall tone of coverage, and finally the impact of the tone of discussion on public policy outcomes. We begin with a simple content analysis of NewYork Times coverage of the topic since 1960 using abstracts archived in the New York Times Index.2 Our comprehensive coding system allows us to go intomuch greater detail than others have done before to show the shifting topics ofpublic attention, and in doing so we show how feasible it is to incorporatemultidimensional coding into content analysis.
Media Coverage of the Death Penalty
The death penalty has long been understood and discussed in the media in termsof constitutionality and morality. Since the mid-1990s, however, a new issuedefinition has arisen, and dramatically so. The innocence frame rests on the ideathat, no matter what one thinks about the morality of capital punishment, weshould ask whether the justice system is capable of administering the penaltyacross thousands of individual judicial proceedings with no errors. The idea offlaws in the system, of innocent people being on death row, of the wrong peoplepossibly being executed, has transformed the debate. In 1996, thirty storiesappeared in the New York Times concerning capital punishment; the bulk ofthese reported opinions, news, or events leading toward the application of thedeath penalty. In 2000, 235 stories appeared, and the overwhelming majorityof them were highly critical of capital punishment. In just a few short years, theissue was reframed to focus on errors, mistakes, and the possibility of executingthe wrong person.
In Chapter 6, Druckman explains how the effectiveness of a frame can bealtered not only by the quality of the frame but also by the amount of competitionamong distinct frames in the debate. His discussion helps to explain the profoundeffect of the innocence frame on capital punishment policy that we willdemonstrate in this chapter. Not only is the innocence frame highly compelling—even the staunchest death-penalty supporters have to agree that the state shouldnot execute innocent people—but it has virtually drowned out all competingdefinitions of the issue. As we document here, the death-penalty debate of thelate 1990s and early 2000s was dominated, saturated in fact, by this single frame.
Figure 9.1 shows the number of stories in the New York Times relating tocapital punishment from 1960 to 2005.3 A total of 3,939 stories appeared duringthis time, with substantial peaks of coverage in 1976–77, just after the Supreme
12345678901112131415161718192021222324252627282930313233343536373839404142434445
162 Impact
Winning-01-main text.qxd 2/6/09 09:53 Page 162
FIRST PROOFS - NOT FOR PUBLICATION

Court’s Gregg v. Georgia ruling reinstating the death penalty (following the 1972Furman v. Georgia decision invalidating state capital punishment laws), and thenagain in 2000. During these two peaks, the newspaper carried over 150 storiesper year: more than three stories per week. The figure makes clear that the deathpenalty emerged onto the media agenda in the 1970s; there was little coverage,less than one story per week, before 1972. Attention to the death penaltyremained high through the 1980s and 1990s, with the exception of a brief dipin 1996–98. Most notably, since 1999 coverage has grown substantially, eventhough there has been no monumental Supreme Court decision such as thoseof 1972 and 1976. Rather, more recent coverage, especially the unprecedentedlevel of coverage in 2000, has related to various challenges to the system basedon juvenile offenders, the mentally handicapped, and the concept of innocence.The number of front-page stories has grown as well: From just one in 1960,there were two in 1970, four in 1980, eight in 1990, and 19 in 2000.
Capital punishment contains many different dimensions of debate, fromconstitutionality to morality to efficacy and others. We coded each New YorkTimes abstract for the presence of a comprehensive list of 65 different arguments,or frames, clustered into seven main themes, or frame dimensions: efficacy,morality, fairness, constitutionality, cost, mode of execution, and internationalconcerns. We show in this section how the component arguments have waxedand waned over time, how the frame dimension, or topic, of discussion issystematically related to the tone of the debate, and specifically how the tone ofthe debate has shifted in response to the shifting dimensions of discussion. Webegin in Figure 9.2 with a simple presentation of the number of stories usingeach frame dimension.
12345678901112131415161718192021222324252627282930313233343536373839404142434445
The Decline of the Death Penalty 163
1960
250
1965 1970 1975 1980 1985 1990 1995 2000 2005
200
150
100
50
0
Num
ber
of
sto
ries
Figure 9.1 The Number of Stories on Capital Punishment in the New York TimesIndex, 1960–2005
Winning-01-main text.qxd 2/6/09 09:53 Page 163
FIRST PROOFS - NOT FOR PUBLICATION

12345678901112131415161718192021222324252627282930313233343536373839404142434445
140
120
100
80
60
40
20
01960 1970 1980
Fairness
1990 2000
140
120
100
80
60
40
20
01960 1970 1980
Constitutionality
1990 2000
140
120
100
80
60
40
20
01960 1970 1980
Morality
1990 2000
140
120
100
80
60
40
20
01960 1970 1980
Mode
1990 2000
140
120
100
80
60
40
20
01960 1970 1980
Cost
1990 2000
140
120
100
80
60
40
20
01960 1970 1980
Efficacy
1990 2000
140
120
100
80
60
40
20
01960 1970 1980
International
1990 2000
Figure 9.2 The Number of Stories on Each Topic, or Dimension, of Attention in theNew York Times Index, 1960–2005
Winning-01-main text.qxd 2/6/09 09:53 Page 164
FIRST PROOFS - NOT FOR PUBLICATION
Issues of constitutionality are the single most common theme in New YorkTimes coverage over most of this period; over 1,467 stories mentioned discussionsof this type, with peaks coming in 1972, 1976 and the years following that, inthe mid- to late-1980s, and finally in the early twenty-first century as theconstitutionality of capital punishment for juveniles and the mentally handicappedbecame important controversies. Morality issues have been less prominent overtime, with a total of 622 stories focusing on these. Discussion of morality has beenprominent since 1972, especially from 1972 to 1978 when the constitutionalityof the entire death penalty was hotly debated. Since the 1970s, moral issues havenever completely disappeared from the media agenda, but they have beensignificantly less prevalent. The fairness dimension, of which the innocence frameis one part, was not prominent before the 1980s, but grew rapidly beginning in1983. It reached a peak in 2000 with 134 stories in that year alone; over theentire period there were 1,099 stories with fairness arguments. Many stories fitinto other categories focusing on international comparisons, efficacy (whether thepenalty serves as a deterrent or not, for example), cost, mode of execution, or“other” topics. None of these categories was used in more than 241 stories acrossthe entire period. In general, we can see from Figure 9.2 that constitutionality isa perennial theme; that morality has been an important theme as well; and thatthe fairness dimension (driven primarily by the innocence frame) has shown adramatic increase from virtually no coverage before the 1980s to constitutingmore than half of the entire amount of coverage annually in many recent years.
Some topics, such as the heinousness of a crime, are almost always associatedwith an overall pro-death-penalty theme of coverage. Others, such as internationalcomparisons, lead almost always to an anti-death-penalty story. In fact, knowingthe topic, or frame dimension, of the story allows us to make a good predictionof the tone, as Figure 9.3 shows.
Stories mentioning morality issues may mention arguments on either side of the death-penalty debate, of course. These stories in fact are quite evenly split between pro- and anti-death-penalty tones. Similarly, stories mentioningconstitutionality questions may focus on issues favoring the defendant or thosefavoring the state; here too the tone is quite split (though with a net anti-death-penalty tendency of 60 to 40 percent). When the topic shifts to fairness, however,the vast majority of the coded stories are anti-death-penalty. Internationalcomparisons, while less common, similarly have a powerful anti-death-penaltybias. The various tendencies present in Figure 9.3 make clear that the shiftingattention to various topics that we demonstrated in Figure 9.2 can be expectedto relate to powerful changes in the overall tone of media coverage over time.
In coding New York Times coverage of the death penalty, we also notedwhether the abstract mentioned anything about the victim(s) or the defendant.Figure 9.4 shows that this simple question goes far in determining the overalltone of the story.
Most stories mention neither a victim nor a defendant, discussing instead suchthings as the general implications of Supreme Court decisions or state legislativedebates about revising capital punishment laws and procedures. In fact, more than
12345678901112131415161718192021222324252627282930313233343536373839404142434445
The Decline of the Death Penalty 165
Winning-01-main text.qxd 2/6/09 09:53 Page 165
FIRST PROOFS - NOT FOR PUBLICATION

two-thirds of the stories (2,817 abstracts) mentioned neither a victim nor adefendant, and, of the 2,159 stories in this group that were given either a pro-or anti-death-penalty tone, about 40 percent were coded pro-death-penalty, verysimilar to the overall total. Over 570 stories mentioned something about thevictim with no discussion of the defendant; of the 505 stories among this groupthat were toned pro- or anti- approximately 71 percent had a pro-death-penaltytone. Similarly, 392 stories mentioned something about the defendant withoutmentioning the victim; of the 308 toned stories in this group only 21 percentwere coded pro-death-penalty. Those stories that mentioned both the victimand the defendant were similar to the stories mentioning neither in their overalltone. Clearly, something about discussing the defendant either humanizes himor her, raises questions about imperfections or problems in the trial, or both.Similarly, a focus on the victims of crime typically corresponds with pro-death-penalty stories. Whereas stories that mention the defendant tend to focus on thetime period after the crime (the trial, the defendant’s rehabilitation, etc.), storiesthat mention the victim tend to focus on the crime itself, usually highlighting theheinousness of the incident.4
Combined, the data in Figures 9.3 and 9.4 make clear why proponents andopponents of the death penalty have different foci. While certainly not all of those
12345678901112131415161718192021222324252627282930313233343536373839404142434445
166 Impact
52%
48%
Mor
al(5
25)
48%
52%
Mod
e(1
95)
40%
60%
Con
stitu
tiona
l(1
,200
)31%
69%
Effi
cacy
(176
)
20%
80%
Cos
t(1
5)
19%
81%
Faire
ness
(920
)
16%
84%
Inte
rnat
iona
l(9
1)
Pro-death penalty Anti-death penalty
Figure 9.3 The Topic Determines the Tone
Note: The figure shows the percentage of stories on each topic that were coded pro- oranti-death penalty, 1960–2005. Number of stories (with pro or anti tone) given inparentheses. Stories that were neutral or uncodeable by tone are not included.
Winning-01-main text.qxd 2/6/09 09:53 Page 166
FIRST PROOFS - NOT FOR PUBLICATION

close to the victims of violent crime support the death penalty, attention to victimsis clearly associated with more stories favorable to the application of the deathpenalty. Thus, the subject matter of the story goes far in determining the tone.Since, as shown in Figure 9.2, the frame dimensions that dominate the debatechange over time, we should expect the tone of the debate to shift as well. InFigure 9.5 we trace relative attention to the victim and the defendant since 1960.
Figure 9.5 shows the increased discussion of the victims of capital crimes duringthe 1970s (associated with significantly more pro-death-penalty discussion ingeneral during that time), some decline in these numbers after the reinstatementof the death penalty in 1976, a steady rise in attention to the victims of crime indiscussions of death-penalty issues until 1993, and then a dramatic and sustainedreversal after that date. Since 1993, attention has increasingly focused onquestions relating to the defendants in criminal trials rather than to victims. Thischange, of course, is strongly associated with the increased concern withinnocence, fairness, and the accuracy of judicial proceedings.
12345678901112131415161718192021222324252627282930313233343536373839404142434445
The Decline of the Death Penalty 167
64%
36%
Pro-death penalty Anti-death penalty
The victim (640)
27%
73%
The defendant (443)
Figure 9.4 Tone and Mention of Victim and Defendant
Note: The figure shows the percentage of stories mentioning either the victim or thedefendant that were coded pro- or anti-death penalty, 1960–2005. The number of stories (with pro or anti tone) is shown in parentheses. Stories that were neutral oruncodeable by tone are not included.
Winning-01-main text.qxd 2/6/09 09:53 Page 167
FIRST PROOFS - NOT FOR PUBLICATION

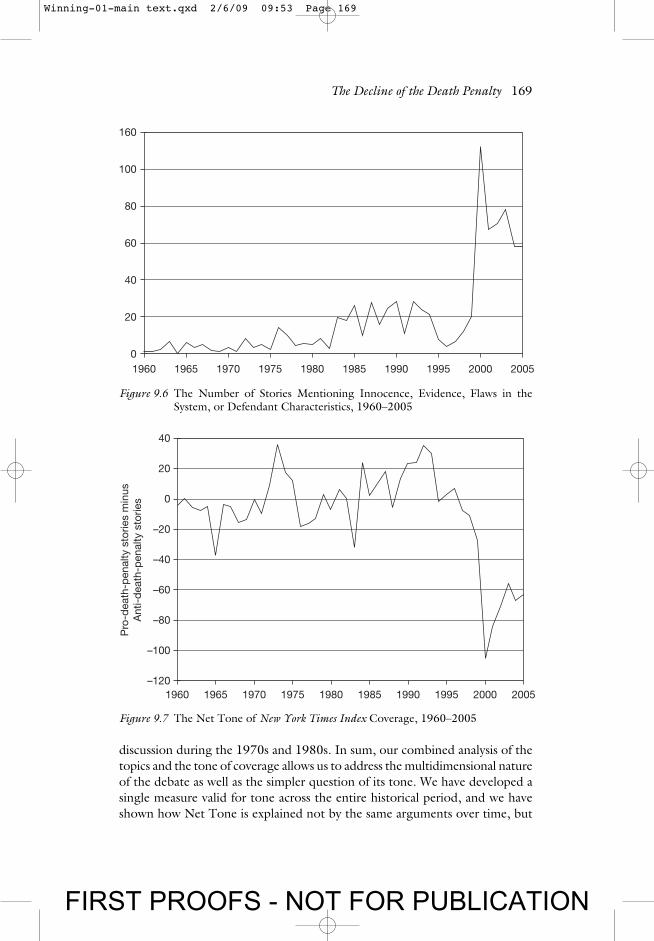
We can see the dramatic rise of the innocence frame in particular by examiningthe number of stories each year presenting any of the following: (1) claims ofinnocence; (2) problems relating to evidence used in trial; (3) problems orimperfections in the justice system; or (4) characteristics of the defendant.
This cluster of considerations, ranging from simple humanization of thedefendant to demonstrations of actual innocence through exonerations, hasalways been present in the death-penalty debate, as Figure 9.6 shows. However,none of these issues was a prominent aspect of media coverage of the deathpenalty until they collectively surged to unprecedented levels of coverage in2000. From 1960 to the mid-1980s there was trivial coverage of these questions,typically fewer than ten stories mentioning them each year. Coverage grew fromthe 1980s to the 1990s, then rocketed to new levels in 2000.
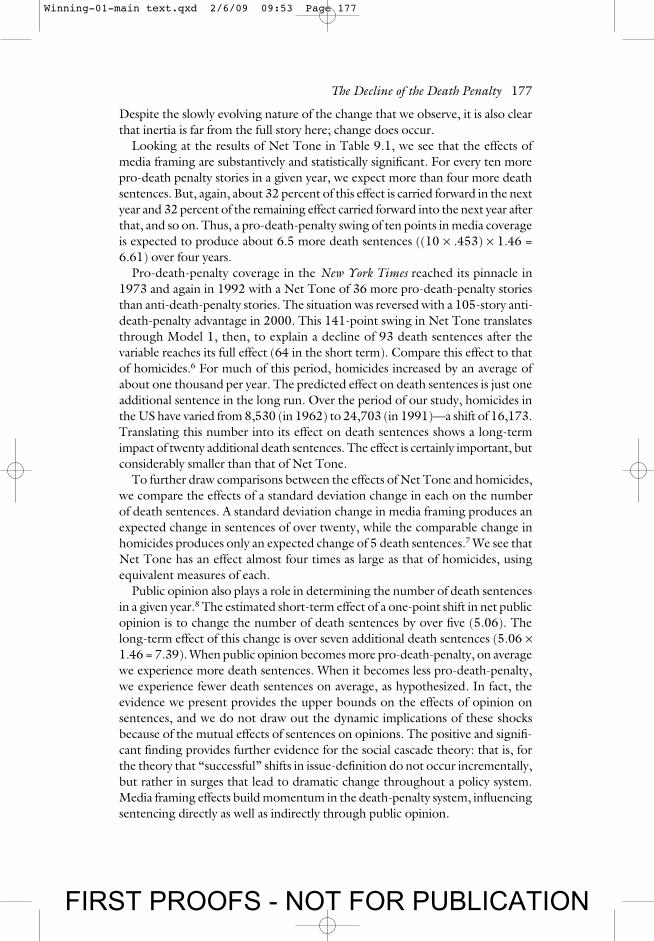
We have shown how the nature of this debate has been transformed over thelast 45 years. The shifting foci of attention have caused systematic variations inthe overall tone of attention over time. Figure 9.7 shows these trends, summa-rized in the “Net Tone” of New York Times coverage: the number of pro- minusthe number of anti-death-penalty stories.
The data in Figure 9.7 capture the net results of all the shifting foci of debatewe have examined. As attention has moved from the victims to the defendants,from morality and constitutionality to the possible imperfections in the justicesystem itself, the net result has been a movement towards greater anti-death-penalty reporting. Of course, the data also show the rise of the pro-death-penalty
12345678901112131415161718192021222324252627282930313233343536373839404142434445
168 Impact
2005200019951990198519801975197019651960
60
50
40
30
20
10
0
Victim Defendant
Figure 9.5 The Number of Stories Mentioning the Victim and the Defendant,1960–2005
Winning-01-main text.qxd 2/6/09 09:53 Page 168
FIRST PROOFS - NOT FOR PUBLICATION
discussion during the 1970s and 1980s. In sum, our combined analysis of thetopics and the tone of coverage allows us to address the multidimensional natureof the debate as well as the simpler question of its tone. We have developed asingle measure valid for tone across the entire historical period, and we haveshown how Net Tone is explained not by the same arguments over time, but
12345678901112131415161718192021222324252627282930313233343536373839404142434445
The Decline of the Death Penalty 169
2005200019951990198519801975197019651960
160
100
80
60
40
20
0
Figure 9.6 The Number of Stories Mentioning Innocence, Evidence, Flaws in theSystem, or Defendant Characteristics, 1960–2005
2005200019951990198519801975197019651960
40
20
0
–20
–40
–60
–80
–100
–120
Pro
-dea
th-p
enal
tyst
orie
sm
inus
Ant
i-d
eath
-pen
alty
stor
ies
Figure 9.7 The Net Tone of New York Times Index Coverage, 1960–2005
Winning-01-main text.qxd 2/6/09 09:53 Page 169
FIRST PROOFS - NOT FOR PUBLICATION

by different arguments and shifting attention during different historical periods.The topics of discussion explain the tone, and the tone explains the public policyresponse (as we show in the next section). Shifting attention from one topic toanother therefore can be linked clearly to important policy shifts, reversinglongstanding policy equilibria.
The Rise of the Innocence Frame
Why the sudden surge in attention to innocence around the year 2000? Was itbecause the notion that there could be innocent individuals on death row hadnot previously occurred to anyone? Certainly not. As Figure 9.6 shows, storiesfeaturing questions of innocence appeared in the New York Times as early as1960, and probably decades earlier. Publicized instances of wrongful convictionand exonerations in the United States date back at least to 1819 (Banner 2002,p. 122). And in modern times especially, Americans are no strangers to theconcept of wrongful conviction. While the rate of exonerations from death rowhas increased in recent years (to an average of 6.7 each year between 1999 and2006), 76 of the 123 people exonerated from death row as of 2006 wereexonerated before the surge in attention to innocence began in the year 1999,at an average rate of about three each year between 1973 and 1998 (DeathPenalty Information Center 2006).
In other words, whatever flaws exist in the capital punishment system, theyare not new. The underlying phenomena of capital punishment policy have notchanged. Attention has. Indeed, even controlling for the increase in theexoneration rate, individuals exonerated between 1999 and 2005 received anaverage of 40 news stories in major US newspapers, as opposed to an averageof three stories devoted to individuals exonerated between 1973 and 1991(Baumgartner, De Boef, and Boydstun 2008).
So why all the recent fuss about innocence? There are, of course, many reasons.Some would point to individual factors, such as the actions of George Ryan—previously a staunch supporter of the death penalty—who as Governor of Illinoisin 2000 placed a moratorium on that state’s death penalty and then in 2003commuted the sentences of all death row inmates to life in prison; to thepresidential campaign between Al Gore and George W. Bush in 2000, whichbrought many national journalists to Texas and led to significant scrutiny of thecandidates’ views on the death penalty; to the decline in violent crime starting inthe 1990s; or to other factors. Some would argue that the innocence frame tookhold only because of new scientific technologies, chief among these forensicDNA profiling, developed in 1984 and first used in a criminal conviction in 1988,which provides overwhelming evidence of innocence in particular criminal cases.Yet, again, the facts of the death penalty have changed very little over time. Ofthe 130 individuals exonerated from death row between 1973 and 2008 (and ofthe 82 exonerations since the first exoneration based on DNA evidence in 1993),DNA evidence played a substantial factor in proving the individual’s innocencein only 19 cases (Death Penalty Information Center 2006).
12345678901112131415161718192021222324252627282930313233343536373839404142434445
170 Impact
Winning-01-main text.qxd 2/6/09 09:53 Page 170
FIRST PROOFS - NOT FOR PUBLICATION

Perhaps more important than actual advancements in DNA testing is thenewfound (or renewed) public fascination with scientific evidence, and DNAevidence in particular, as captured and fueled by popular television shows like CSI and popular events like the O.J. Simpson trial. A growing popularcultural awareness of the complexities of evidence collection and testing incriminal cases has certainly led to public awareness of the myriad of human errors(or intentional falsifications) that can happen anywhere along the chain ofevidence. Yet a broad cultural awareness of the possibility of wrongful convictionis not enough by itself to explain the pronounced surge in news attention toinnocence we have chronicled.
In our view, it is impossible to pinpoint any single cause of the rise of the innocence frame; indeed it is unimportant to do so. As we discuss in more detail in the book from which this study is drawn, the sudden and dra-matic rise of the innocence frame represents a collective attention-shift; a cascadeof attention produced by multiple independent yet mutually reinforcing fac-tors operating in a positive-feedback system. Legal scholars, judges, andjournalists began focusing their attention on issues of innocence in the 1970sand 1980s, not coincidentally in the wake of Watergate and the result-ing wave of government distrust. This academic and legal work led to thecreation of the first university-based “innocence projects”—pro-bono legal aid clinics, wherein law and journalism students and their professors work to uncover evidence of wrongful convictions. Yet despite the beginnings of the innocence projects in the years shortly after the reinstatement of the death penalty, it would be more than a decade before the innocence frame wouldgrab hold. Attention, after all, is not proportional to urgency. Public focusshifted to the question of innocence only after a nexus of political forces,including media coverage, pushed it in that direction. Before the innocenceframe would penetrate social consciousness, it would take the establishment of another eighty legal aid clinics under the Innocence Project model, theexonerations of another two dozen innocent defendants from death row, theconcerted efforts of DC lobbyists, several more academic publications, andmany, many national news stories. At some point in the mid-1990s, however,these elements coalesced. And once past a critical threshold, the innocence frametook public attention by storm, exploding onto the agenda and dominating the debate.
In short, events, organizational efforts, governmental actions, and mediaframing have moved in unintended tandem to break the death-penalty debatewide open, exposing a new dimension of innocence and redefining the policyissue. In a positive-feedback system, each event makes the next event more likely.No single event can be said to be the one that caused the others; they allreciprocally have influenced one anther, each reinforcing the trend towardgreater attention to questions of innocence. The fascination with glamorousTV portrayals of DNA evidence surely contributed to the rise of the innocenceframe, but so did the unglamorous academic publications of the 1970s and1980s; for that matter, so did Watergate.
12345678901112131415161718192021222324252627282930313233343536373839404142434445
The Decline of the Death Penalty 171
Winning-01-main text.qxd 2/6/09 09:53 Page 171
FIRST PROOFS - NOT FOR PUBLICATION

Most importantly, this pattern of attention-shifting—whereby a series ofindependent forces lead, via a long-winding system of positive feedback, to anabrupt reframing of an issue and a sharp change in policy—is not unique to thedeath penalty. Observing how a morally charged issue like capital punishmentcan be redefined through the forces of positive feedback tells us that virtuallyevery policy debate is susceptible to these same forces; virtually every debatecan be reframed. And given what we know about the give and take betweenpositive and negative feedback dynamics in the political system, when“successful” reframing occurs it is likely to be both sudden and dramatic, justas we have documented in the case of capital punishment.
The Impact of Framing on Capital Sentencing
The number of Americans sentenced to death has varied quite substantially overtime. From 1961 until the 1972 moratorium approximately one hundredAmericans were sentenced to death annually. A substantial drop in numbersfollowed the moratorium, but death sentences quickly began to rise inanticipation of the reinstatement of the death penalty, hitting nearly threehundred in 1975. The number of yearly sentences dropped after this reinstate-ment surge, but to levels higher than the pre-moratorium years. And for twodecades the number of sentences continued to rise, growing from 137 in 1977to 317 in 1996. Then, in 1997, the trend began a dramatic reversal that con-tinues today; only 128 Americans were sentenced to death in 2005, less thanone-half the number of nine years before and a lower number than in any yearsince the moratorium. Figure 9.8 shows the annual numbers of capital sentences,executions, death row inmates, and homicides over time.
The number of executions has always been substantially lower than thenumber of death sentences, of course. In fact, a substantial majority of deathsentences are overturned on appeal, often after many years of the inmate livingon death row. While overturned convictions are not exonerations, they doindicate serious flaws in the original trial or sentencing phase: serious enoughthat an appeals court orders the initial decision vacated and sent back for a newtrial. Executions peaked in the US in 1935 and declined regularly from thatdate until the late 1960s, when they reached zero, where the series stayed until1977 when Gary Graham became the first modern executionee. Executionsgrew substantially in the 1990s until they reached 100; since then they havedeclined by almost half.
Figure 9.8 also shows the size of the various death rows across the country;cumulatively over 3,500 individuals were on death row in the late 1990s, anumber which had grown steadily from fewer than five hundred in the 1950s,1960s, and 1970s. Both the number of executions and the number of peopleon death row are driven largely by the number of individuals sentenced to death,and this number as we have mentioned has fluctuated widely over the pastdecades. There was particularly wild variation in the period immediatelysurrounding the constitutional ban and subsequent reinstatement of the death
12345678901112131415161718192021222324252627282930313233343536373839404142434445
172 Impact
Winning-01-main text.qxd 2/6/09 09:53 Page 172
FIRST PROOFS - NOT FOR PUBLICATION

penalty in 1972 and 1976, respectively. As discussed above, the number of deathsentences increased steadily each year from 1977 until a peak of 317 in 1996before declining to less than one-half that number just a few years later.
What explains the variation in the number of death sentences issued byjuries? Certainly media coverage plays a large part. In particular, attention to the innocence argument and the attendant anti-death-penalty tone should reducesupport for the death penalty and prime jurors to resist meting it out. We haveshown that different topics lead to different tone in media coverage and expectthat the tone of media coverage directly influences the number of death sentencesjuries hand down. But there is more to this story. We assess the responsivenessof death sentences to media framing, but also to homicides (shown in Figure 9.8),public opinion (i.e., the percentage of US survey respondents in favor of thedeath penalty in the case of murder), and the objective evidence that the systemis prone to error (i.e., the number of individuals exonerated of the crimes forwhich they were sentenced to death). We also control for the effects of theconstitutional ban on executions.
We test the hypothesis that media framing influences death sentences using a simple multivariate time-series regression. Drawing on previous work, wehypothesize that, as violent crime rates increase, the number of death sentencesshould increase. Not only do the numbers of potential capital cases before juries increase with the number of murders, but also concern about crime
12345678901112131415161718192021222324252627282930313233343536373839404142434445
The Decline of the Death Penalty 173
400
350
300
250
200
150
100
50
Sentences (left axis)
0
1930 1940 1950 1960 1970 1980 1990 2000
4000
3500
3000
2500
2000
1500
1000
500
0
Sen
tenc
esan
dex
ecut
ions
Ho
mic
ides
(in10
s)an
dD
eath
Ro
wp
op
ulat
ion
Death Row (right axis)
Executions (left axis)
Homicides in tens (right axis)
Figure 9.8 Capital Sentences, Executions, and the Death Row Population
Primary sources: Snell 2005 and Fox and Zawitz 2006.
Winning-01-main text.qxd 2/6/09 09:53 Page 173
FIRST PROOFS - NOT FOR PUBLICATION

increases with crime rates, leading to the view that more should be done to betough on crime—namely sentence more people to death. We use the annualnumber of homicides (measured in thousands, but shown in Figure 9.8 in tensfor purposes of scaling) as reported in the FBI Uniform Crime Reports as ourindicator of violent crime rates.
Public opinion has been linked to political behavior and public policy in avariety of settings (Erikson et al. 2002; Page and Shapiro 1983). Public sentimentwith regard to the death penalty is historically both supportive and stable. Yetrecent years have seen a small but steady and sustained drop in support. Thehypothesized effect on the number of death sentences takes two forms. The firstis simple and direct. As more Americans come to oppose the death penalty, thenumber of death sentences is expected to drop; displeasure with the policy amongcitizens selected for jury duty should result in fewer death sentences. The secondeffect is indirect. As opinion becomes less supportive, prosecutors become lessinclined to pursue the death penalty—the costs, in both dollars and politicalcapital become too high—resulting in fewer capital trials and, thus, fewer deathsentences. Our measure of public opinion is an annual time-series created bycombining information from all available survey data pertaining to the deathpenalty using Stimson’s (1999) dimensional analysis algorithm.
The constitutional ban on the death penalty also had a predictable anddramatic effect on the annual number of death sentences, of course. With the1973 Furman v Georgia decision to abolish the death penalty, the number ofdeath sentences fell. Prior to Gregg v Georgia, strong anticipation of the deathpenalty’s reinstatement explains the jump in death sentences in 1975 as pent-up demand for the policy was realized. We thus account for the beginning andthe end of the moratorium period with variables measured 1 in 1973, the firstyear of the moratorium, and 1 in 1975, the year that by all historical accountsthe reversal was socially anticipated, and 0 in all other time periods.
Much of the variation in the number of death sentences has come in the lastdecade, the period in which the innocence frame has risen and grown. It isreasonable to ask whether mounting evidence of the flaws in the system, ratherthan media coverage, explains the drop in death sentences. We test whether thenumber of exonerations alone or in conjunction with media coverage can explainthe drop. We perform this test by including a measure of the number ofindividuals exonerated in each year, beginning with the reinstatement of capitalpunishment in 1976. By including in our model a measure of exonerationsalongside the Net Tone measure of media framing from Figure 9.7, we candetermine empirically whether it is the direct evidence of innocence itself (theprevalence of exonerations) or the media coverage of this concept of innocencethat explains the shifts in death sentences that we observe.
In fact, as mentioned earlier and demonstrated in more detail elsewhere(Baumgartner, De Boef, and Boydstun 2008), individual exonerations generatewidely divergent amounts of news coverage, with much more coverage of recentexonerations than those occurring in previous years. There are marginally moreexonerations today than thirty years ago, but on average much more news
12345678901112131415161718192021222324252627282930313233343536373839404142434445
174 Impact
Winning-01-main text.qxd 2/6/09 09:53 Page 174
FIRST PROOFS - NOT FOR PUBLICATION

coverage of those exonerations that have occurred since the innocence frame came to dominate media discussion of the death penalty. The averagenumber of stories an individual exonerated from death row today is likely to get is more than 13 times the number that someone exonerated in the pre-innocence-frame era could expect. Something changed, and it was notthe facts. Exonerees are simply more newsworthy today than before the inno-cence movement began.
Our analysis covers the time period from 1961 to 2005, giving us 45 years ofdata with which to work in testing our hypotheses. For each year, we want toknow whether we can predict the number of death sentences and the relativerole of each of the variables in explaining the number of death sentences. Themodel we estimate is a simple regression analysis of the number of deathsentences as a function of the number in the previous year—recognizing theinertial nature of the number of death sentences—and the previous year’s mediaframing (Net Tone), homicide level, and opinion, accounting as well for boththe beginning and end of the moratorium period.5 Analyses that includeexonerations of necessity begin in 1976.
Analysis
Our results are presented in Table 9.1. We focus our attention on the influenceof media framing, comparing the magnitude of the estimated effects with thoseof the number of homicides. The entries in the table show the expected changein annual death sentences for a one-unit change in each of the row variables.
The results show strong and robust framing effects. Our model of deathsentences shows significant inertia, here directly assessed by the size of thecoefficient of the number of sentences in the previous year. Looking first atModel 1, the first coefficient tells us that when large numbers of people weresentenced to death last year, it is likely that a large number will be sentenced todeath this year. The number of sentences in the previous year propagates forwardat the rate of 0.316, meaning that every death sentence in a given year is by itselfstatistically responsible for one-third of a death sentence in the following year.Obviously, death sentences cannot occur in thirds, but the point is that, evenholding all other factors in the system constant, death sentences beget moredeath sentences at a rate of 0.316.
This inertia has two important implications. First, it makes clear that we shouldnot expect dramatic shifts in death sentences in any given year; the series has asignificant bias toward the status quo. The value in one year is a major predictorof the value of the series in the subsequent year. Second, and obviously relatedto the first, it takes several years for the effect of new information to enter thesystem and reach its full impact. To calculate the full effect of any variable inthe system, consider that it will have an impact in the first year equal to the coef-ficient listed, but in each subsequent year it will continue to affect the system atthe rate of nearly 32 percent of its initial impact, then 32 percent of that numberin the following year, and so on. This dynamic means that the long-term impact
12345678901112131415161718192021222324252627282930313233343536373839404142434445
The Decline of the Death Penalty 175
Winning-01-main text.qxd 2/6/09 09:53 Page 175
FIRST PROOFS - NOT FOR PUBLICATION

of shifts in any of the independent variables is about 1.5 times as great as itsimmediate impact, and that it takes about four years for effects to reach theirfull impact. So we have modeled a slowly evolving system; the first coefficientin the system shows the degree of inertia, in Model 1 about 32 percent (withvery similar numbers for Models 2 and 3).
Why might this inertia occur? As we noted above, death sentences varysubstantially in number over time, and yet these changes evolve slowly from yearto year. We can think of at least two reasons this might be the case. First, theprosecutors making decisions about whether to pursue the death penalty tendto be the same from one year to another; only slowly are prosecutors replaced.Second, standard operating procedures in the justice system mean that the processis sticky and, thus, change is very slow to occur. These two facts contribute tothe likelihood that the number of death sentences handed down in a given yearwill look something like that in the previous year. Finally, to the degree that theprocesses we describe affect public opinion and juries across the country, it isclear that all people would not become aware of changes instantaneously; it takestime for new information to filter through the system. Media coverage shiftingfrom positive to negative in tone is filtered through conversations and from onemedia outlet to another; nothing in this process is necessarily expected to occurinstantaneously or to affect public opinion and individual thinking immediately.
12345678901112131415161718192021222324252627282930313233343536373839404142434445
176 Impact
Table 9.1 Explaining the Number of Annual Death Sentences
Model 1 Model 2 Model 3(1961–2005) (1973–2005) (1973–2005)
Sentencest–1 0.316+ 0.339+ 0.327+
(0.097) (0.109) (0.108)Net Tonet–1 0.453+ 0.361# 0.432#
(0.137) (0.210) (0.240)Opiniont–1 5.059* 5.007+ 4.906+
(1.069) (0.137) (1.423)Homicidest–1 (thousands) 0.817 2.423 2.747
(1.437) (2.708) (2.727)Exonerationst–1 –0.966
(1.721)Cumulative Exonerationst 0.069
(0.197)1973 –67.80+
(25.80)1975 129.49* 129.68* 131.29*
(25.34) (28.21) (28.24)Constant 22.92# –10.44 –17.97
(19.20) (56.78) (56.49)N 44 32 32R2 0.930 0.836 0.834RMSE 23.97 25.27 25.37St. Dev. 83.70 62.32 62.32
Entries are regression coefficients; standard errors are in parentheses.Note:* denotes p < 0.001, + denotes p < 0.05, and # denotes p < 0.10, one-tailed.
Winning-01-main text.qxd 2/6/09 09:53 Page 176
FIRST PROOFS - NOT FOR PUBLICATION
Despite the slowly evolving nature of the change that we observe, it is also clearthat inertia is far from the full story here; change does occur.
Looking at the results of Net Tone in Table 9.1, we see that the effects ofmedia framing are substantively and statistically significant. For every ten morepro-death penalty stories in a given year, we expect more than four more deathsentences. But, again, about 32 percent of this effect is carried forward in the nextyear and 32 percent of the remaining effect carried forward into the next year afterthat, and so on. Thus, a pro-death-penalty swing of ten points in media coverageis expected to produce about 6.5 more death sentences ((10 × .453) × 1.46 =6.61) over four years.
Pro-death-penalty coverage in the New York Times reached its pinnacle in1973 and again in 1992 with a Net Tone of 36 more pro-death-penalty storiesthan anti-death-penalty stories. The situation was reversed with a 105-story anti-death-penalty advantage in 2000. This 141-point swing in Net Tone translatesthrough Model 1, then, to explain a decline of 93 death sentences after thevariable reaches its full effect (64 in the short term). Compare this effect to thatof homicides.6 For much of this period, homicides increased by an average ofabout one thousand per year. The predicted effect on death sentences is just oneadditional sentence in the long run. Over the period of our study, homicides inthe US have varied from 8,530 (in 1962) to 24,703 (in 1991)—a shift of 16,173.Translating this number into its effect on death sentences shows a long-termimpact of twenty additional death sentences. The effect is certainly important, butconsiderably smaller than that of Net Tone.
To further draw comparisons between the effects of Net Tone and homicides,we compare the effects of a standard deviation change in each on the numberof death sentences. A standard deviation change in media framing produces anexpected change in sentences of over twenty, while the comparable change inhomicides produces only an expected change of 5 death sentences.7 We see thatNet Tone has an effect almost four times as large as that of homicides, usingequivalent measures of each.
Public opinion also plays a role in determining the number of death sentencesin a given year.8 The estimated short-term effect of a one-point shift in net publicopinion is to change the number of death sentences by over five (5.06). Thelong-term effect of this change is over seven additional death sentences (5.06 ×1.46 = 7.39). When public opinion becomes more pro-death-penalty, on averagewe experience more death sentences. When it becomes less pro-death-penalty,we experience fewer death sentences on average, as hypothesized. In fact, theevidence we present provides the upper bounds on the effects of opinion onsentences, and we do not draw out the dynamic implications of these shocksbecause of the mutual effects of sentences on opinions. The positive and signifi-cant finding provides further evidence for the social cascade theory: that is, forthe theory that “successful” shifts in issue-definition do not occur incrementally,but rather in surges that lead to dramatic change throughout a policy system.Media framing effects build momentum in the death-penalty system, influencingsentencing directly as well as indirectly through public opinion.
12345678901112131415161718192021222324252627282930313233343536373839404142434445
The Decline of the Death Penalty 177
Winning-01-main text.qxd 2/6/09 09:53 Page 177
FIRST PROOFS - NOT FOR PUBLICATION

In addition to the effects of media framing, homicides, and opinion, Model 1also controls for the effects of the constitutional ban on death sentences. We findthat the estimated effects of the onset and end of the constitutional ban on thedeath penalty were to drop death sentences by about 68 (estimated as 1 × –67.80)and to increase death sentences by 129, respectively, controlling for the levels of homicides, Net Tone, and opinion that existed at that time (1 × 129.49).These are contemporaneous effects and so again underestimate the total effect.The total effect is the now familiar 1.46 times the contemporaneous effect; for the onset the effect is –98.99, and for the end of the moratorium the effectis 189.06. That structural changes to the death-penalty system exert such bigeffects should come as no surprise. One reason to include these effects in themodel is so that we know that the other effects we measure are in addition to theseeffects, not simply reflecting them.
Consider the effect of the death-penalty moratorium in 1972, which wasresponsible, statistically speaking, for 99 fewer people being sentenced to deathin the long term, as compared to the impact of the 141-point swing in the NetTone of media coverage between 1992 and 2000, which was statisticallyresponsible in the long term for 93 fewer death sentences. The shift in mediaframing we have documented produced nearly as large an effect on capitalsentencing as did the complete system shut down ordered by the SupremeCourt. Without any direct checks and balances on the judicial system, the medianevertheless wield tremendous influence.
We turn now to testing the alternative hypothesis that exonerations ratherthan media framing explain the annual number of death sentences. Both Model2 and Model 3, also presented in Table 9.1, are run using data from 1973 through2005. Model 2 includes the number of exonerations in the previous year. Model3 presents an alternative operationalization of the same concept, this timeincluding the cumulative number of exonerations from 1976 to the year inquestion rather than only the number in each previous year. This alternatespecification allows us to test for the possibility that it took the momentum ofincreasing numbers of exonerations over several years to affect public policy. Themain finding from these results is that exonerations themselves have noindependent effect on death sentences, a finding that persists when Net Tone isomitted from the models. Further, while the effect of the number of exonerationsin the last period is negative, as we would expect, the cumulative number ofexonerations has an estimated effect of zero. Importantly, the inclusion ofexonerations does not change the conclusion that media coverage has a substan-tively important impact on the annual number of death sentences. The estimatedeffects of all the variables in the model are highly stable.
Conclusions
The number of death sentences is an important indicator of public policy, onethat has changed a lot over the last four decades, ranging from a low of 42 in1973 (when executions were rendered unconstitutional) to a high of 317 in
12345678901112131415161718192021222324252627282930313233343536373839404142434445
178 Impact
Winning-01-main text.qxd 2/6/09 09:53 Page 178
FIRST PROOFS - NOT FOR PUBLICATION

1996, just before the rise of the innocence frame. We have shown that thisvariation is highly predictable. The number of death sentences responds to mediaattention, to public opinion, and to homicide levels. It is especially responsiveto the tenor of media framing. In particular, the sentencing rate is almost fourtimes more responsive to Net Tone than to homicides. And the recent shift inmedia coverage from pro-death-penalty coverage focused on morality-basedand constitutionality-based frames to anti-death-penalty coverage focused on theinnocence frame was responsible for nearly as big a drop in death sentences aswas the moratorium placed on capital punishment in 1972. In contrast,exonerations from death row have no significant effect on the number of peoplesentenced to death.
Taken with our knowledge of actual media coverage, we can say a lot aboutthe nature of policy change with respect to the death penalty. The paths thathomicides, media framing, and public opinion have followed in recent timeperiods have produced a dramatic decrease in the number of people sentencedto death. Declines in the number of homicides and a consistent anti-death-penalty tenor in media framing—rooted in the innocence frame—have pulledopinion in a distinctly anti-death-penalty direction and, both directly andindirectly via public opinion, have led to a reduction in the number of deathsentences. Together, these variables help us to understand the dramatic declinein the number of death sentences handed down by juries in the last ten years,from 317 in 1996 to four-tenths as many (128) in 2005. This conclusion ismeaningful and, moreover, it is sensible.
The innocence movement we have documented appears to have led to a shiftin the focus of the death penalty debate. This redefinition has had a substantialeffect on public policy. The story we tell draws first on real events and then onmedia’s presentation of them. The consequence of these events and mediaframing, as we have shown, is fundamentally, but slowly, to alter public policy.This is a straightforward story, told with many tables and figures. Framingmatters.
Appendix: Description of Data
This Appendix offers summary descriptions of the data sources and collectionprocedures for the six major annual data series presented in this chapter: deathsentences, death row inmate population, executions, exonerations, homicides,and net public opinion support.
Death Sentences: The number of death sentences handed down each year,as provided by the following sources: 1961–1972 data from United StatesDepartment of Justice 1972; 1973–2005 data from Snell 2005 (Appendix Table 2: Prisoners Sentenced to Death and the Outcome Sentence, by Year ofSentencing, 1973–2005).
Death Row Inmates: The total number of individuals under sentence ofdeath in the United States in each year. We follow the Death PenaltyInformation Center in supplementing the primary Bureau of Statistics data
12345678901112131415161718192021222324252627282930313233343536373839404142434445
The Decline of the Death Penalty 179
Winning-01-main text.qxd 2/6/09 09:53 Page 179
FIRST PROOFS - NOT FOR PUBLICATION

source with the NAACP estimate for the most recent year, as reported by Snell2005 (Figure 9.1: Persons under Sentence of Death 1953–2005).
Executions: The number of individuals executed in the United States in eachyear, as reported by Snell 2005 (Figure 9.4: Persons Executed, 1930–2005).
Exonerations: The number of individuals exonerated from death row in theUnited States in each year, as calculated from DPIC 2006. The Death PenaltyInformation Center makes the following statement regarding the criteria foridentifying exonerations: “The DPIC uses the traditional objective criteria thathave determined innocence since the founding of this country. In order to beincluded on the list, defendants must have been convicted and sentenced todeath, and subsequently either: a) their conviction was overturned and theywere acquitted at a re-trial, or all charges were dismissed; or b) they were givenan absolute pardon by the governor based on new evidence of innocence. Thelist includes cases in which the release occurred in 1973 or later.”
Homicides The number of homicides committed in the United States eachyear, as provided by the following sources: 1961–1985 data from Fox andZawitz 2006 (Table of Homicide Victimization, 1950–2004); 1986–2005 datafrom Uniform Crime Reporting Program 2006 (Table 1: Crime in the UnitedStates by Volume and Rate per 100,000 Inhabitants, 1986–2005).
Net Public Support for the Death Penalty: A measure of public support for the death penalty as calculated from data collected from the following source: Gallup Organization, public opinion surveys conducted November 11,1953–May 5, 2006. In this chapter, we use a variable we call “net support.” Thisvariable is calculated simply from subtracting, at each point in time, our measureof death-penalty opposition from our measure of death-penalty support (i.e., %pro – % anti). To gather these measures of death penalty support and opposition,we began by searching on iPoll for all public opinion polls on “capital punish-ment” or “death penalty.” Our search yielded 780 survey items taken betweenDecember, 1936 and May, 2006. These surveys were conducted by a wide rangeof different survey organizations (Gallup, CBS, Roper, etc.) and employed aneven wider range of question types (“Do you believe in the death penalty,” “Areyou in favor of the death penalty for murder?,” “Do you think the death penaltyprevents crime?,” “Are you in favor of the death penalty for persons convictedof rape?,” etc.). Although there is significant variance across these surveys in termsof survey house and question wording, we are able to incorporate differentquestions asked by different organizations by using the WCalc algorithm, createdby James Stimson, which we describe below.
Through use of this algorithm, questions with important differences inquestion wording but with a common root subject—including those questionslisted above and many more—can each contribute information to our overallmeasure of public opinion on the death penalty. Of the full set of 780 questionitems we downloaded from iPoll, 292 surveys meet our criteria for inclusion:directly relevant to the death penalty debate, given to a random sample of national adults, containing responses that can be categorized into pro- andanti-death penalty valences, and asked two or more times by the same survey
12345678901112131415161718192021222324252627282930313233343536373839404142434445
180 Impact
Winning-01-main text.qxd 2/6/09 09:53 Page 180
FIRST PROOFS - NOT FOR PUBLICATION

organization. The surveys we used represented 19 distinct survey organizationsand 35 distinct question wordings. In all, the data hold a total of 65 surveyorganization and question wording combinations.
In order to utilize this data set of 292 surveys from multiple survey housesand with multiple question types, we employed the WCalc Public OpinionDimensional Extraction Algorithm created by James Stimson (software retrievedMarch 23, 2007, from http://www.unc.edu/~jstimson/resource.html). In amanner similar to dynamic factor analysis, this software program calculates howthe survey marginals (i.e., percentage values) for each survey question asked byeach organization change over time. Having calculated relative change scoresfor each individual survey question series, the algorithm extracts the latentdimension underlying the shared patterns of variance across these changes,producing a single series of public opinion data. The algorithm is also equippedwith an optional smoothing function, which we choose to employ in order tominimize the “noise” inherent in this kind of survey data. The result: twosmoothed time-series, one representing aggregate support for the death penaltyand the other representing aggregate opposition. Subtracting the oppositionvalues from the support values, we obtain the final series of “Net Support,”which we employ in our analysis.
Notes1. We gratefully acknowledge the support of the Department of Political Science at
Penn State University, the Miller-LaVigne Graduate Fellowship, the Miller-LaVigneProfessorship, and the College of the Liberal Arts. Baumgartner also gratefullyacknowledges the support of the Camargo Foundation where he was a Fellow duringthe time when parts of this chapter were drafted.
2. We use the New York Times Index because the Times represents the best single nationalsource for public policy stories. Our main interest is in how coverage shifts over time,so we are less concerned with how the Times may differ from other newspapers in itseditorial stance on the death penalty or coverage of the issue; the key question is howcoverage changes over time. To test the robustness of our findings using the Times,we also reviewed coverage in the Readers’ Guide to Periodical Literature. Althoughthere is only a partial correlation of .53 between the two series overall (1960–2003),both show the same dramatic rise in attention in recent years coinciding with the risein the innocence frame. In the year 2000, both the Times and the Readers’ Guideprinted a higher number of stories—235 and 106, respectively—than in any previousyear, and both surges were dominated by arguments against the death penalty. On theuse of the New York Times as an indicator of media coverage, see Althaus et al. 2001;McCombs and Reynolds; Soroka 2002; Van Belle 2003. We also compare the Timesto nine other newspapers and show high correlations in coverage over time (0.70) and,in particular, in coverage of the innocence frame (0.90); see Baumgartner, De Boef,and Boydstun 2008.
3. We coded every abstract listed under the heading “capital punishment” in the New York Times Index, noting whether or not the abstract mentioned any of anexhaustive list of 65 different arguments, with abstracts being allowed to receivemultiple codes as appropriate. Thanks to Cheryl Feeley for doing the bulk of this workfor her Senior Thesis and for allowing us to use and update the data she collected.See Baumgartner and Boydstun 2005 for a description of the coding process.
12345678901112131415161718192021222324252627282930313233343536373839404142434445
The Decline of the Death Penalty 181
Winning-01-main text.qxd 2/6/09 09:53 Page 181
FIRST PROOFS - NOT FOR PUBLICATION

4. Contrary to some common expectations, what the story mentioned about the victims,including whether they were police officers, women, children, or if there were multiplevictims, had no significant impact on the tone of the story overall; any discussion ofthe victim was related to an overall pro-death-penalty tone. Similarly, there were fewdifferences across types of defendants: be they female, of various racial categories, etc.,any discussion of the defendant correlated highly with an overall anti-death-penaltytone. There is one notable exception to this finding: If the defendant was characterizedas a terrorist, the tone was more likely to be pro-death-penalty. There were few suchcases, however, as a proportion of the total.
5. The number of death sentences is large enough that the variable is approxi-mately normally distributed so that OLS regression, rather than models designedespecially for the unique problems associated with count data, is appropriate for theanalysis.
6. We estimated statistical tests—Granger causality tests—that allow us to test the nullhypothesis that each of the processes we care about predicts the others. We find thathomicide levels are predicted by the number of death sentences that occur in a givenyear. This finding means that the estimated effect of homicides on death sentencesis, strictly speaking, biased. We find, however, that in estimating the full system ofequations and interpreting effects in the context of a vector autoregression (VAR)we draw almost identical inferences to those produced by the simple regressionanalysis that we report here. Of particular note, Net Tone is weakly exogenous and,thus, unbiased. Given the complexities of the VAR, we choose to present the singleequation in Table 9.1.
7. The standard deviation of Net Tone is just over thirty stories; that of homicides4,508.
8. As with homicides, we find that we cannot rule out the possibility that the number ofdeath sentences influences opinion when we test that hypothesis using Grangercausality tests. This finding means that our estimated coefficient on public opinion isbiased. Using more statistically sophisticated techniques that handle this possibility—again the VAR—we find that the dynamic effects we report overestimate the effect ofopinion somewhat.
Works Cited
Althaus, Scott L., Jill A. Edy, and Patricia F. Phalen. 2001. “Using Substitutes for Full-text News Stories in Content Analysis: Which Text Is Best?” American Journal ofPolitical Science 45(3): 707–723.
Banner, Stuart. 2002. The Death Penalty: An American History. Cambridge, MA:Harvard University Press.
Baumgartner, Frank R. and Bryan D. Jones. 1993. Agendas and Instability inAmerican Politics. Chicago, IL: The University of Chicago Press.
Baumgartner, Frank R. and Amber E. Boydstun. 2005. New York Times CapitalPunishment Coverage, 1960–2003. Codebook available online at: http://www.personal.psu.edu/frb1/Innocence/DP_NYT_Codebook.pdf.
Baumgartner, Frank R., Suzanna L. De Boef, and Amber E. Boydstun. 2008. TheDecline of the Death Penalty and the Discovery of Innocence. New York: CambridgeUniversity Press.
Bedau, Hugo Adam, editor 1997. The Death Penalty in America: Current Controversies.New York: Oxford University Press.
Cobb, Roger W. and Charles D. Elder. 1972. Participation in American Politics: TheDynamics of Agenda-Building. Baltimore: The Johns Hopkins University Press.
12345678901112131415161718192021222324252627282930313233343536373839404142434445
182 Impact
Winning-01-main text.qxd 2/6/09 09:53 Page 182
FIRST PROOFS - NOT FOR PUBLICATION

DPIC (Death Penalty Information Center). 2006. “Innocence: List of Those FreedFrom Death Row.” Retrieved March 13, 2007, from http://www.deathpenaltyinfo.org/article.php?scid=6&did=110.
Druckman, James N. 2001. “On the Limits of Framing Effects: Who Can Frame?”Journal of Politics 63(4): 1041–1066.
Erikson, Robert S., James A. Stimson, and Michael MacKuen. 2002. The Macro Polity.New York: Cambridge University Press.
Fox, James Alan and Marianne W. Zawitz. 2006. “Homicide Trends in the UnitedStates.” Washington, DC: United States Department of Justice, Bureau of JusticeStatistics. Retrieved March 16, 2007, from http://www.ojp.usdoj.gov/bjs/homicide/tables/totalstab.htm.
Furman v. Georgia, 408 U.S. 238 (1972).Gallup Organization. Public opinion surveys conducted November 11, 1953–May 5,
2006. Retrieved March 18, 2007, from the iPOLL Databank, The Roper Center forPublic Opinion Research, University of Connecticut, http://www.ropercenter.uconn.edu/ipoll.html.
Gregg v. Georgia, 428 U.S. 153 (1976).Haines, Herbert H. 1996. Against Capital Punishment: The Anti-Death Penalty
Movement in America, 1972–1994. New York: Oxford University Press.Jacoby, William G. 2000. “Issue Framing and Public Opinion on Government
Spending.” American Journal of Political Science Vol 44 Issue(4): 750–767.Jones, Bryan D. 2001. Politics and the Architecture of Choice: Bounded Rationality and
Governance. Chicago, IL: The University of Chicago Press.Jones, Bryan D. and Frank R. Baumgartner. 2005. The Politics of Attention. Chicago,
IL: The University of Chicago Press.Jost, Kenneth. 2001. “Rethinking the Death Penalty.” CQ Researcher 11 (November
16): 945–968.Kingdon, John W. 1984. Agendas, Alternatives, and Public Policies. Boston: Little,
Brown.McCombs, Maxwell and Amy Reynolds. 2002. “News Influence on Our Pictures in the
World.” In Jennings Bryant and Dolf Zillman, editors, Media Effects: Advances inTheory and Research. Hillsdale, NJ: Erlbaum.
Nelson, Thomas E., Rosalee A. Clawson, and Zoe M. Oxley. 1997. “Media Framing ofa Civil Liberties Conflict and Its Effect on Tolerance.” American Political ScienceReview 91(3): 567–583.
Nelson, Thomas E. and Zoe M. Oxley. 1999. “Issue Framing Effects on BeliefImportance and Opinion.” The Journal of Politics 61: 1040–1067.
Page, Benjamin I. and Robert Y. Shapiro. 1983. “Effects of Public Opinion on PublicPolicy.” The American Political Science Review 77(1): 175–190.
Pollock, Philip H. III. 1994. “Issues, Values, and Critical Moments: Did ‘Magic’Johnson Transform Public Opinion on AIDS?” American Journal of Political Science38(2): 426–446.
Poole, Keith T. and Howard Rosenthal. 1991. “Patterns of Congressional Voting.”American Journal of Political Science 35(1): 228–278.
Riker, William H. 1986. The Art of Political Manipulation. New Haven: Yale UniversityPress.
Schattschneider, E.E. 1960. The Semi sovereign People. New York: Holt, Rinehart &Winston.
12345678901112131415161718192021222324252627282930313233343536373839404142434445
The Decline of the Death Penalty 183
Winning-01-main text.qxd 2/6/09 09:53 Page 183
FIRST PROOFS - NOT FOR PUBLICATION
Schneider, Anne and Helen Ingram. 1993. “Social Construction of Target Populations:Implications for Politics and Policy.” The American Political Science Review 87(2):334–347.
Snell, Tracy L. 2005. Capital Punishment, 2005 (NCJ-215083). Washington, DC:United States Department of Justice, Bureau of Justice Statistics. Retrieved March13, 2007, from http://www.ojp.usdoj.gov/bjs/pub/pdf/cp05.pdf.
Soroka, Stuart N. 2002. Agenda-Setting Dynamics in Canada. Vancouver, Canada:UBC Press.
Stimson, James A. 1999. Public Opinion in America: Moods, Cycles, and Swings, 2ndedition. Boulder, CO: Westview Press.
Stone, Deborah A. 1989. “Causal Stories and the Formation of Policy Agendas.”Political Science Quarterly 104(2): 281–300.
Stone, Deborah A. 2002. Policy Paradox: The Art of Political Decision Making, revisededition. New York: Norton & Company.
Terkildsen, Nayda and Frauke Schnell. 1997. “How Media Frames Move PublicOpinion: An Analysis of the Women’s Movement.” Political Research Quarterly50(4): 879–900.
Tversky, Amos and Daniel Kahneman. 1986. “Rational Choice and the Framing ofDecisions.” Journal of Business 59: 251–284.
Uniform Crime Reporting Program. 2006. Crime in the United States 2005.Washington, DC: United States Department of Justice, Federal Bureau ofInvestigation. Retrieved March 16, 2007, from http://www.fbi.gov/ucr/05cius/data/table_01.html.
Van Belle, Douglas A. 2003. “Bureaucratic Responsiveness to the News Media:Comparing the Influence of the New York Times and Network Television NewsCoverage on US Foreign Aid Allocations.” Political Communication 20(3):263–285.
12345678901112131415161718192021222324252627282930313233343536373839404142434445
184 Impact
Winning-01-main text.qxd 2/6/09 09:53 Page 184
FIRST PROOFS - NOT FOR PUBLICATION