Embed Size (px)
Citation preview
1
A Case Study on
Property Tax ReformsS.K. Singh, I.A.S.
slide number 2
2
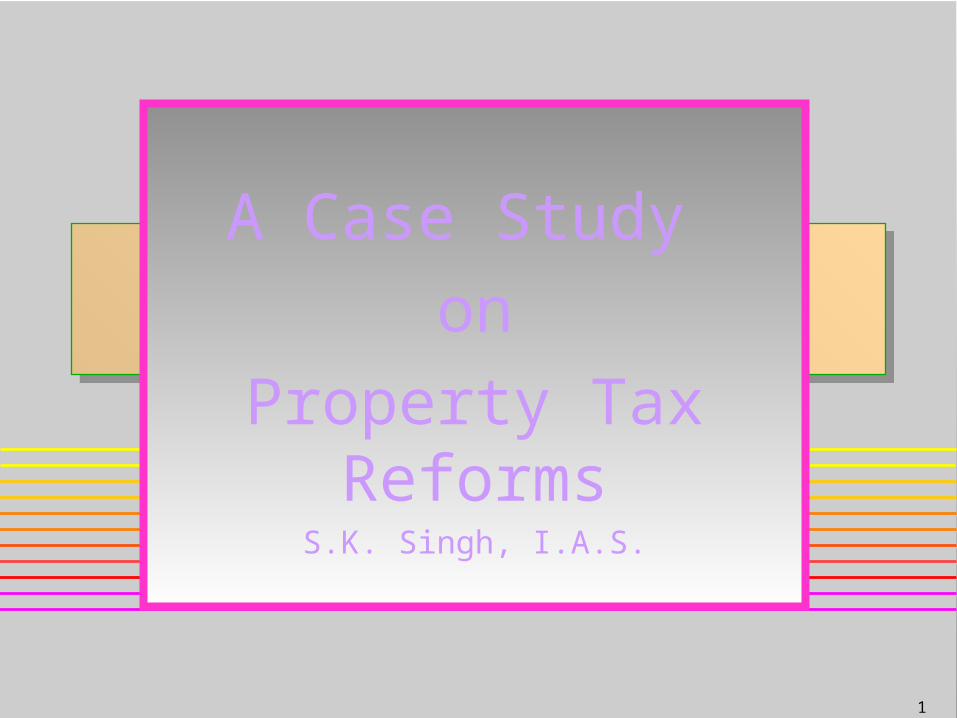
Rural Population - 742 MUrban Population - 285 M
1971 -20%
1981- 23%1991- 26%
Status as in 2001
URBAN
2001- 28%
TOTAL - 1027 M
22%
46%
38%
19%
36%
20% 18%
31%
10%
20%
30%
40%
50%
Urban Rural
1961-711971-811981-911991-01
Decadal Population Growth
INDIA:URBANISATION SCENARIO INDIA:URBANISATION SCENARIO
slide number 3
3
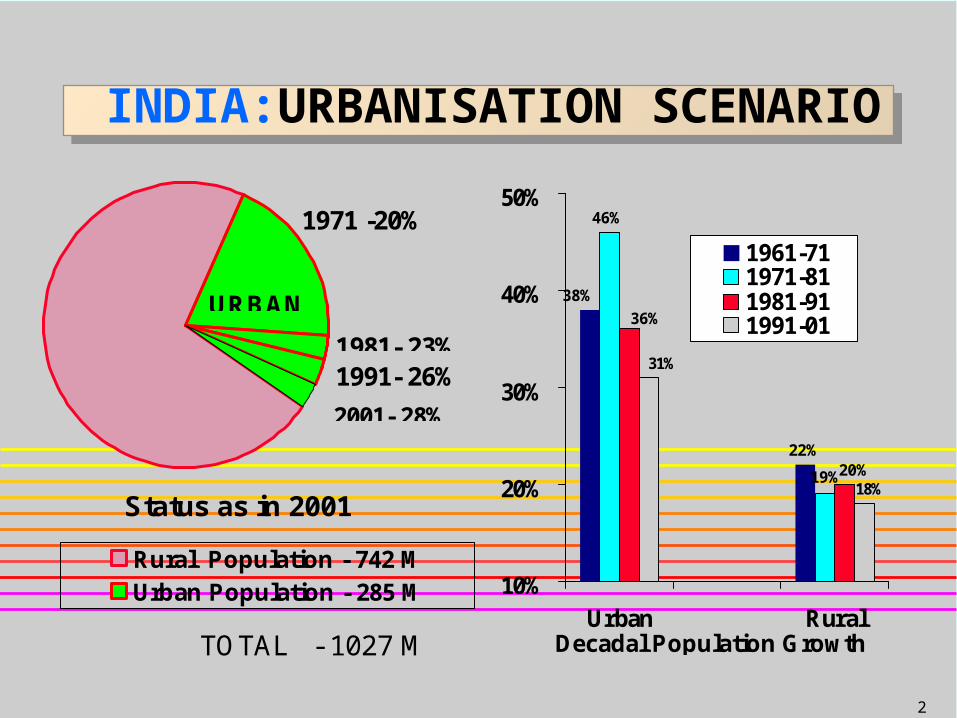
INDIA:URBANISATION SCENARIO Distribution of Urban Centres by Size (1991)
INDIA:URBANISATION SCENARIO Distribution of Urban Centres by Size (1991)
Population in Thousands
198
740
1170
944
345
300
0 200 400 600 800 1000 1200 1400
<5
5-10
10-20
20-50
50-100
> 100
Total No. of Urban Agglomerations/Towns = 3697
2 Million plus Cities - 9 4 Million plus cities - 6
slide number 4
4
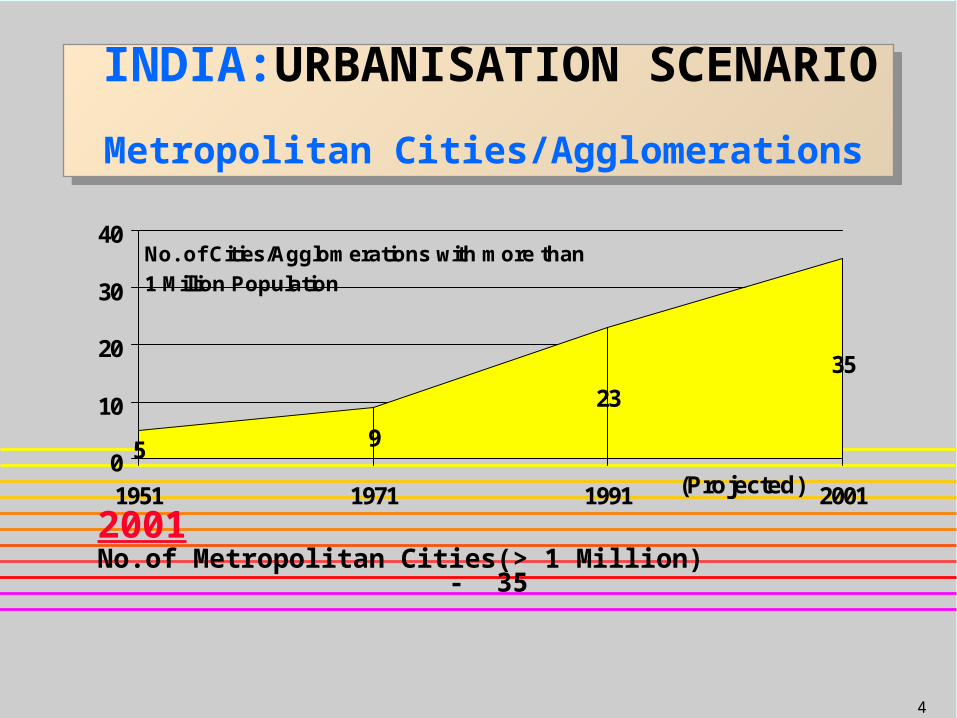
5 9
23
35
0
10
20
30
40
1951 1971 1991 2001(Projected)
No. of Cities/Agglomerations with more than
1 Million Population
2001No.of Metropolitan Cities(> 1 Million) - 35
INDIA:URBANISATION SCENARIO Metropolitan Cities/Agglomerations
INDIA:URBANISATION SCENARIO Metropolitan Cities/Agglomerations
slide number 5
5
ROLE OF URBAN AREAS Cities and Towns are :
Reservoirs of Skills Centres for Hope for Millions of
Migrants Engines of Productivity & Economic
Growth
Need to Sustain and Augment High Urban Productivity for the Country’s Economic Growth.
ROLE & CONTRIBUTION OF URBAN AREAS
ROLE & CONTRIBUTION OF URBAN AREAS
slide number 6
6
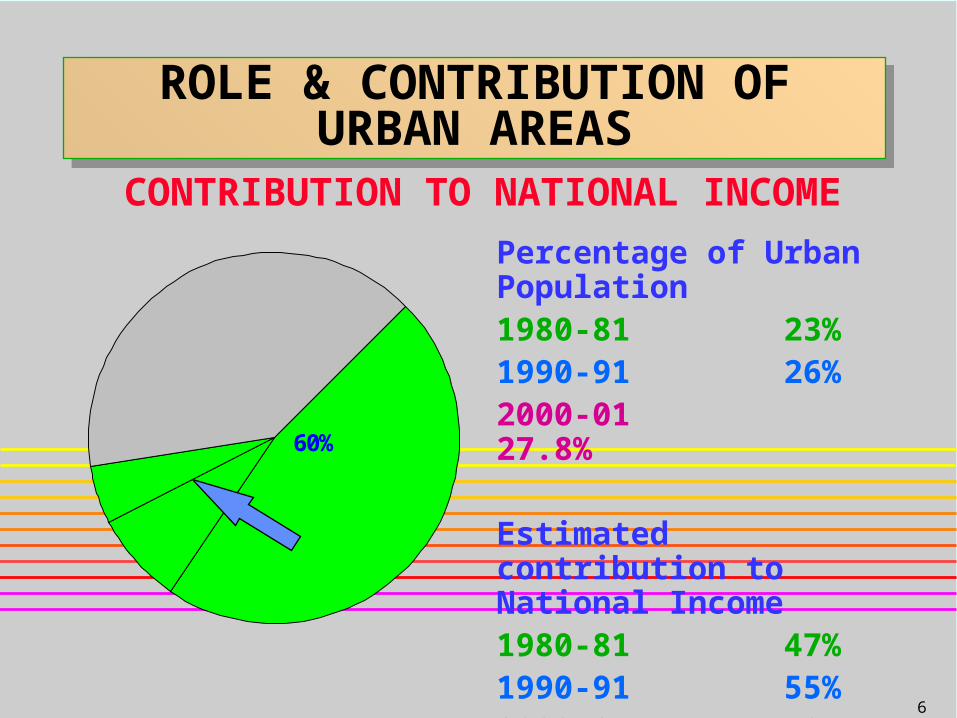
60%
Percentage of Urban Population1980-81 23%1990-91 26%2000-01 27.8%
Estimated contribution to National Income1980-81 47%1990-91 55%2000-01 60%
CONTRIBUTION TO NATIONAL INCOME
ROLE & CONTRIBUTION OF URBAN AREAS
ROLE & CONTRIBUTION OF URBAN AREAS

slide number 7
7
(As on 31.3.99)WATER SUPPLY Covered DeficitPopulation Coverage
SANITATION Population CoverageWASTE MANAGEMENT LIQUID WASTES (MLD) SOLID WASTES(MT/DAY) GENERATED TREATED
GENERATED (Primary/Secondary)
Mumbai 2156 1109**6000
Delhi 2179 12715500
Chennai 352 3522550
Calcutta 690 690**2500
Hyderabad 350 1151500
Bangalore 496 2862500
* Indicate accessibility only. Adequacy and equitable distribution of water is not as per the norms of Govt. of India
** Primary Treatment only
STATUS OF URBAN INFRASTRUCTURE STATUS OF URBAN INFRASTRUCTURE
90%*
50%50%
10%
slide number 8
8
Consequences of Urban Infrastructure deficienciesConsequences of Urban
Infrastructure deficiencies
Wide spread Water borne and other diseases (Diarrhoea, Hepatitis, Jaundice)
Contamination of ground water Densification of existing Urban Habitats
creates Slum like conditions Choked drains and sewer lines High air and water pollution Direct impact on poor
slide number 9
9
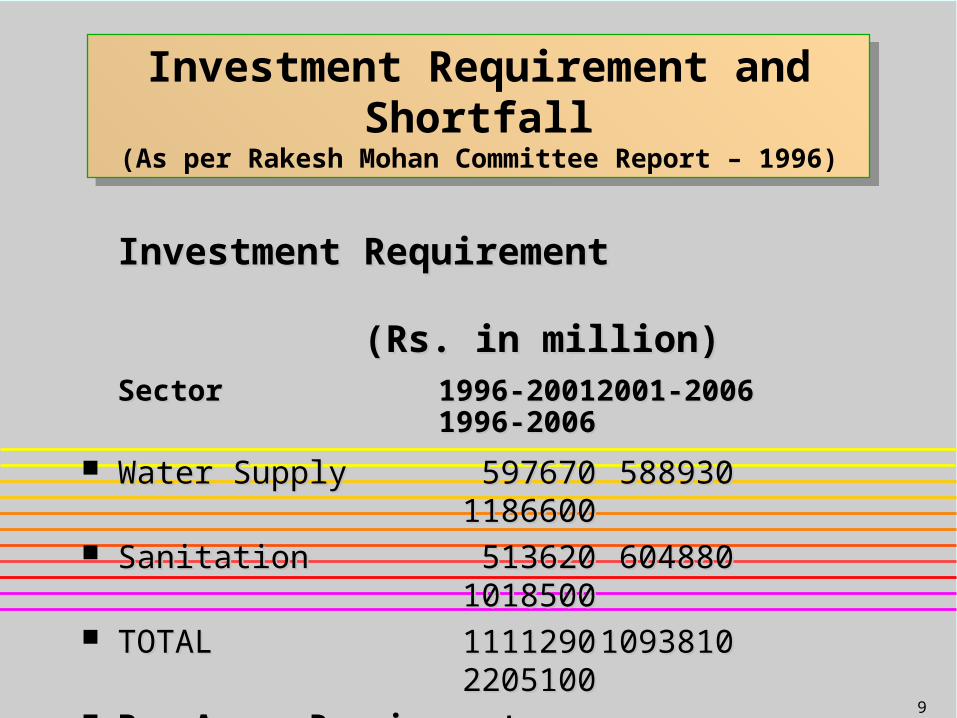
Investment RequirementInvestment Requirement (Rs. in million)(Rs. in million)SectorSector 1996-20011996-2001 2001-20062001-2006
1996-20061996-2006
Water SupplyWater Supply 597670597670 58893058893011866001186600
SanitationSanitation 513620513620 60488060488010185001018500
TOTALTOTAL 11112901111290 1093810109381022051002205100
Per Annum RequirementPer Annum Requirement220510220510
Flow of Plan Funds per annumFlow of Plan Funds per annum5000050000
Shortfall per annumShortfall per annum170510170510
Investment Requirement and Shortfall(As per Rakesh Mohan Committee Report – 1996)
Investment Requirement and Shortfall(As per Rakesh Mohan Committee Report – 1996)
10
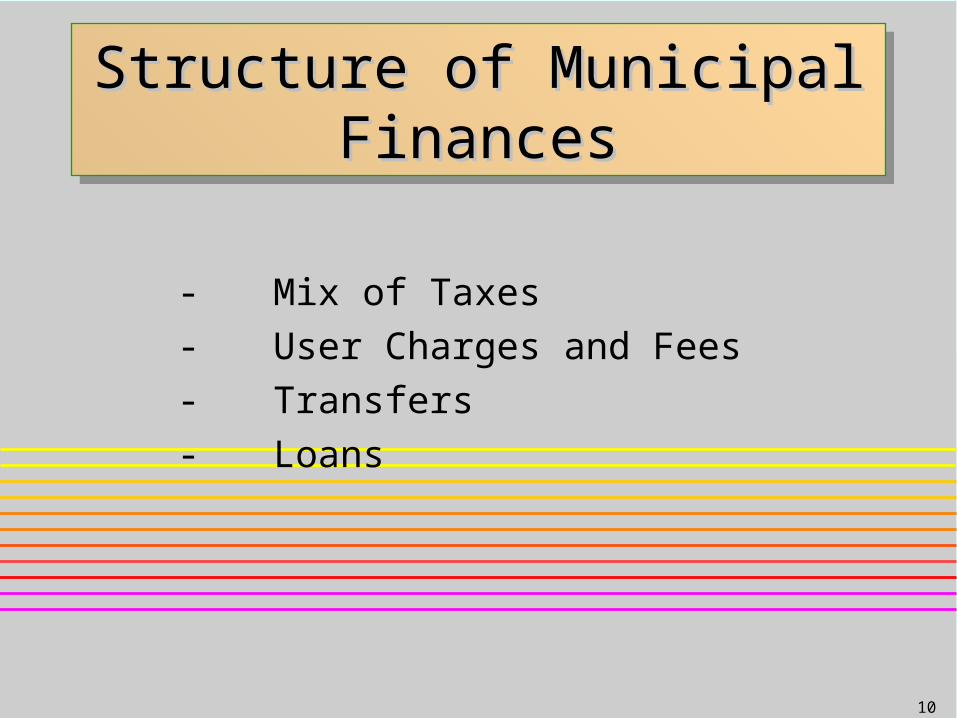
Structure of Municipal Structure of Municipal FinancesFinances
Structure of Municipal Structure of Municipal FinancesFinances
- Mix of Taxes
- User Charges and Fees
- Transfers
- Loans
11
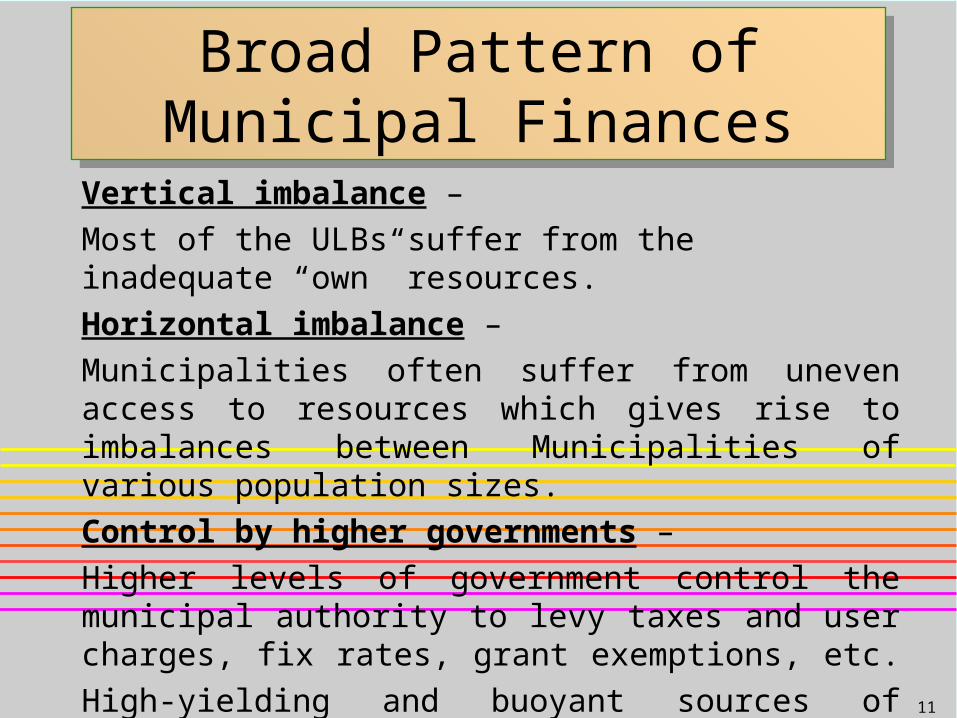
Broad Pattern of Municipal Finances
Broad Pattern of Municipal Finances
Vertical imbalance –
Most of the ULBs suffer from the inadequate “own” resources.
Horizontal imbalance –
Municipalities often suffer from uneven access to resources which gives rise to imbalances between Municipalities of various population sizes.
Control by higher governments –
Higher levels of government control the municipal authority to levy taxes and user charges, fix rates, grant exemptions, etc.
High-yielding and buoyant sources of revenue are seldom assigned to ULBs.
slide number 12
12
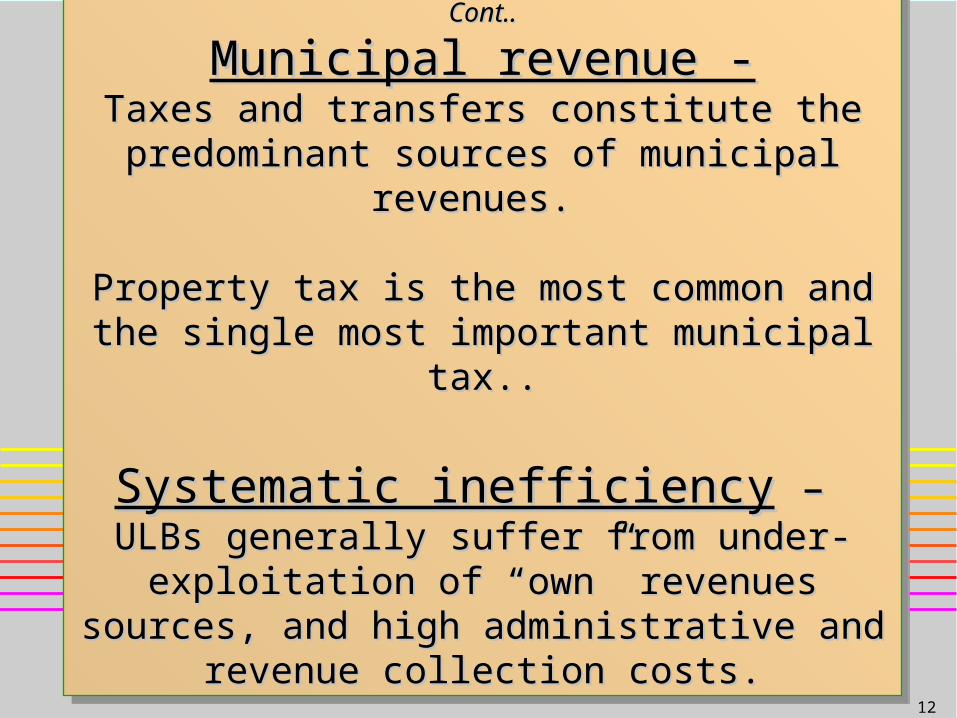
Cont..Cont..
Municipal revenue -Municipal revenue -Taxes and transfers constitute the predominant Taxes and transfers constitute the predominant
sources of municipal revenues. sources of municipal revenues.
Property tax is the most common and the single Property tax is the most common and the single most important municipal tax..most important municipal tax..
Systematic inefficiencySystematic inefficiency – – ULBs generally suffer from under-exploitation of ULBs generally suffer from under-exploitation of “own” revenues sources, and high administrative “own” revenues sources, and high administrative
and revenue collection costs.and revenue collection costs.
13
Property TaxProperty TaxProperty TaxProperty Tax
Property Tax is the most important component of Municipal finance.
This generally consists of Holding tax, Water tax, Scavenging tax, lighting tax, fire tax, street tax and general tax.
This tax is a indirect user charge whose benefits are collective and not confined to identifiable individuals.
Property tax suffers from lack of adequacy, buoyancy and acceptability.
14
Property Tax and Urban IndiaProperty Tax and Urban India
The share of property tax varies in the range of 40-80% of municipal income.
Wherever octroi is levied, the share of property tax is just next to octroi.
The 74th Amendment Act added a series of functions in the municipal functional domain which require additional funds.
15
Property Tax in Major Indian CitiesProperty Tax in Major Indian CitiesProperty Tax in Major Indian CitiesProperty Tax in Major Indian Cities- According to 2001 census, the urban population is 285 million which account for 27.8% of the total population.
- As per 1991 census, more than 65% of the urban population live in cities with more than1,00,000 population and about 1/3rd living in the 23 metropolitan cities.
- This has resulted in serious problems relating to provision of infrastructure and civic amenities.
- Urban Local Bodies are not in a position to provide these amenities and infrastructure in view of their poor financial health.
cont.
16
Cont..
- Full potential of property tax is not utilised anywhere in the country.
- Its base is considerably eroded by administrative and procedural inadequacies
- The property tax structure has not been free from certain flaws.
- The problem relate to the fixation of tax base and tax rate, tax assessment, tax collection, tax exemptions, disputes, resolutions etc.
- No scientific and simple basis is followed for the determination of the tax.
- People are harassed by the Inspectors due to discretionary powers.
17
Attempt for Property Tax Reforms
Attempt for Property Tax Reforms
- In the recent year some State Governments and ULBs have tried property tax reforms.
- Patna Municipal Corporation in Bihar have attempted drastic simplification in tax assessment procedure.
18
Characteristic of a good property tax structure
Characteristic of a good property tax structure
- Make the process of assessment, levy and collection, transparent and simple.
- Minimize the discretion on the part of the assessors in tax levy.
- Low rate of property tax to make it acceptable by the public at large.
- Ensure equity between classes of tax payers/ property owners.
- Facilitate self-assessment of property tax by property owners/occupiers.
19
Annual Rental ValueAnnual Rental Value- Annual Rental Value of a building is the rental
which a building is likely to fetch.
- It delinks the concept from rental approach to Area Based Approach.
- Conventional administration of rental based valuation is loose and defective and property tax based on it becomes in-elastic in long run.
- This also resulted in a purely adhoc and
discretionary assessment.
20
Unit Area MethodUnit Area Method
- Unit Area Method (UAM) has emerged as alternative to rental value.
- This tends to remove the disparity in assessment of similar properties.
- Under this, basic tax is related to plinth area/carpet area.
- UAM is based on the principal of classification.
21
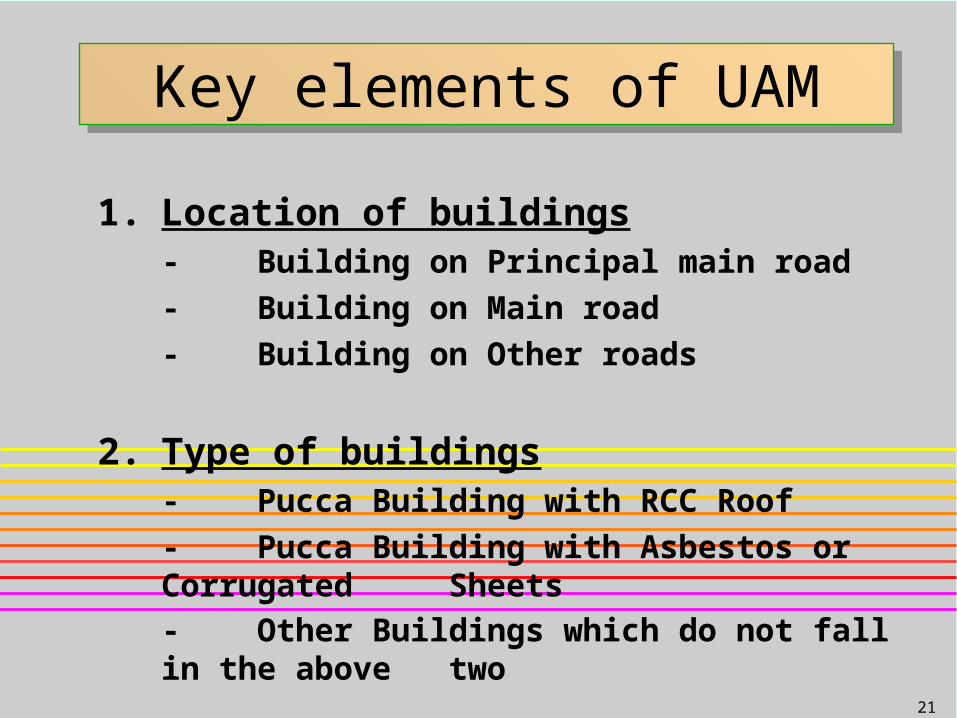
Key elements of UAMKey elements of UAM
1. Location of buildings- Building on Principal main road
- Building on Main road
- Building on Other roads
2. Type of buildings- Pucca Building with RCC Roof
- Pucca Building with Asbestos or Corrugated Sheets
- Other Buildings which do not fall in the above two
cont..
22
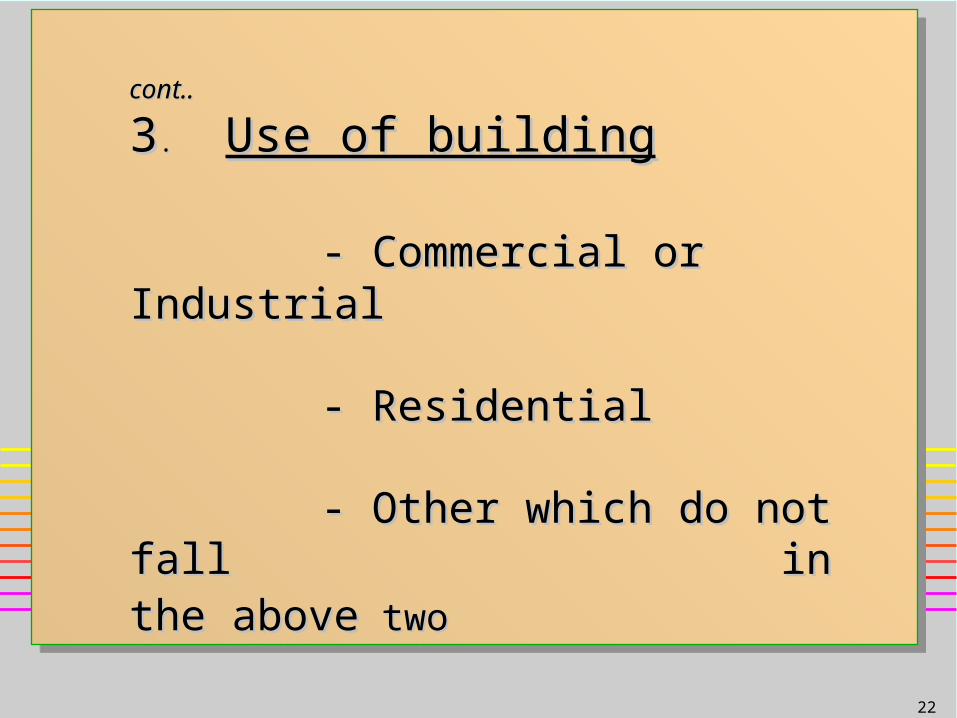
cont..cont..
33.. Use of buildingUse of building
- Commercial or Industrial- Commercial or Industrial
- Residential- Residential
- Other which do not fall - Other which do not fall in the above in the above two two
cont..cont..
33.. Use of buildingUse of building
- Commercial or Industrial- Commercial or Industrial
- Residential- Residential
- Other which do not fall - Other which do not fall in the above in the above two two
23
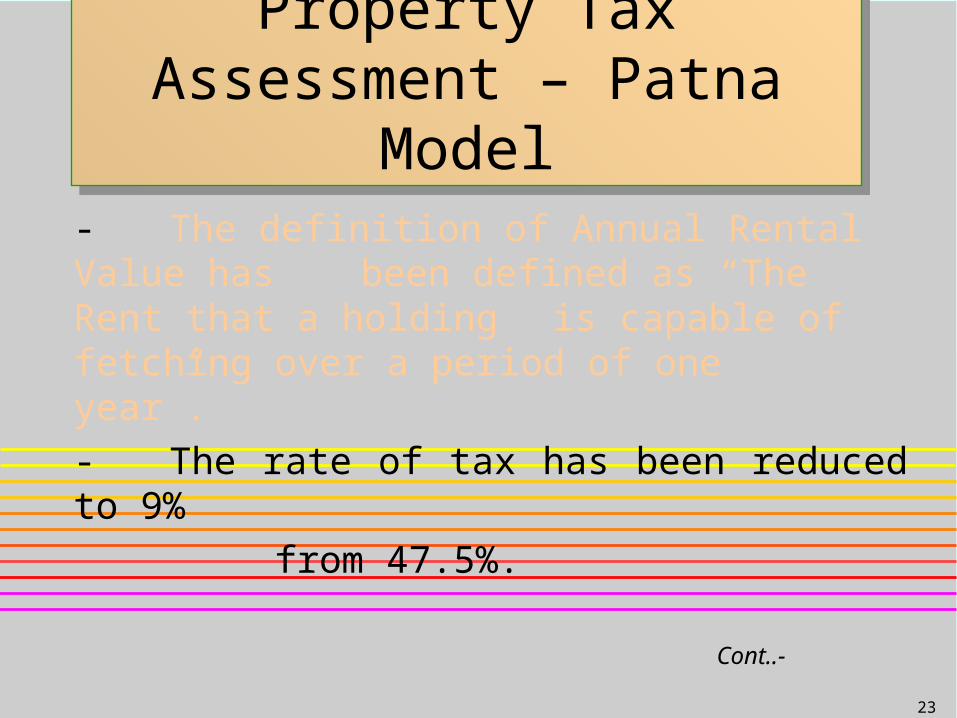
Property Tax Assessment – Patna Model
Property Tax Assessment – Patna Model
- The definition of Annual Rental Value has been defined as “The Rent that a holding is capable of fetching over a period of one year”.
- The rate of tax has been reduced to 9%
from 47.5%.
Cont..-
slide number 24
24
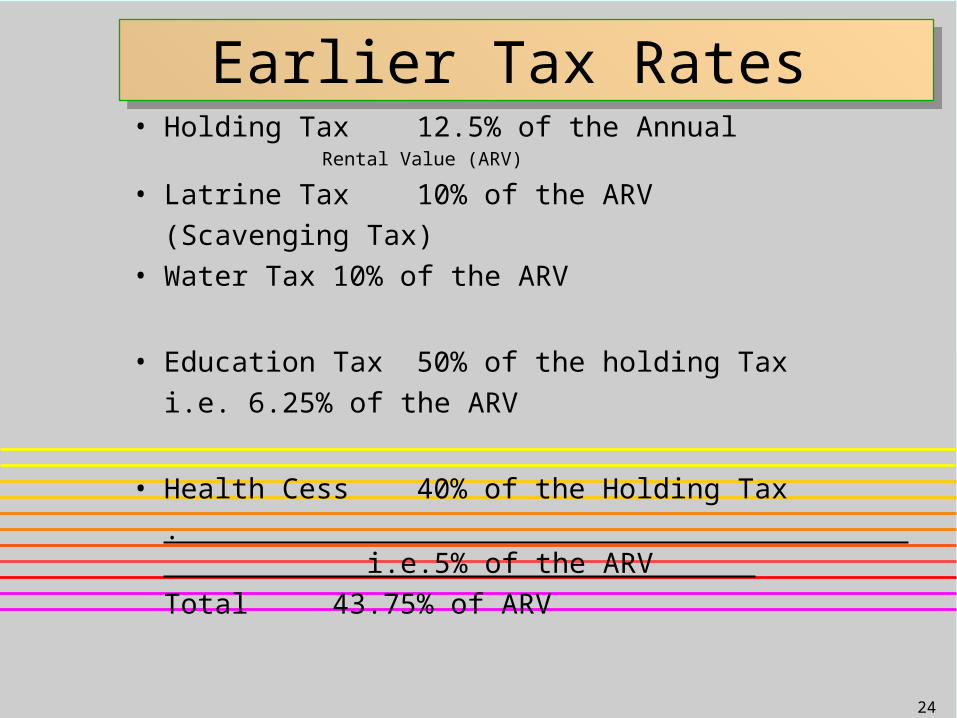
Earlier Tax Rates Earlier Tax Rates • Holding Tax 12.5% of the Annual
Rental Value (ARV)
• Latrine Tax 10% of the ARV
(Scavenging Tax)
• Water Tax 10% of the ARV
• Education Tax 50% of the holding Tax
i.e. 6.25% of the ARV
• Health Cess 40% of the Holding Tax
. i.e.5% of the ARV
Total 43.75% of ARV
slide number 25
25
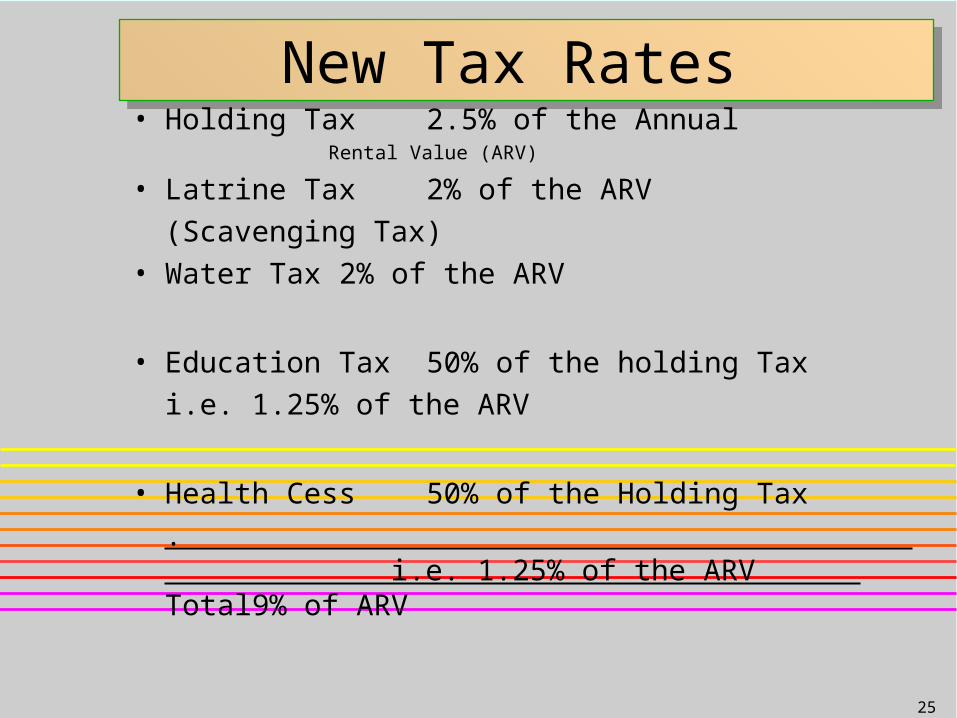
New Tax Rates New Tax Rates • Holding Tax 2.5% of the Annual
Rental Value (ARV)
• Latrine Tax 2% of the ARV
(Scavenging Tax)
• Water Tax 2% of the ARV
• Education Tax 50% of the holding Tax
i.e. 1.25% of the ARV
• Health Cess 50% of the Holding Tax
. i.e. 1.25% of the ARV Total 9% of ARV
26
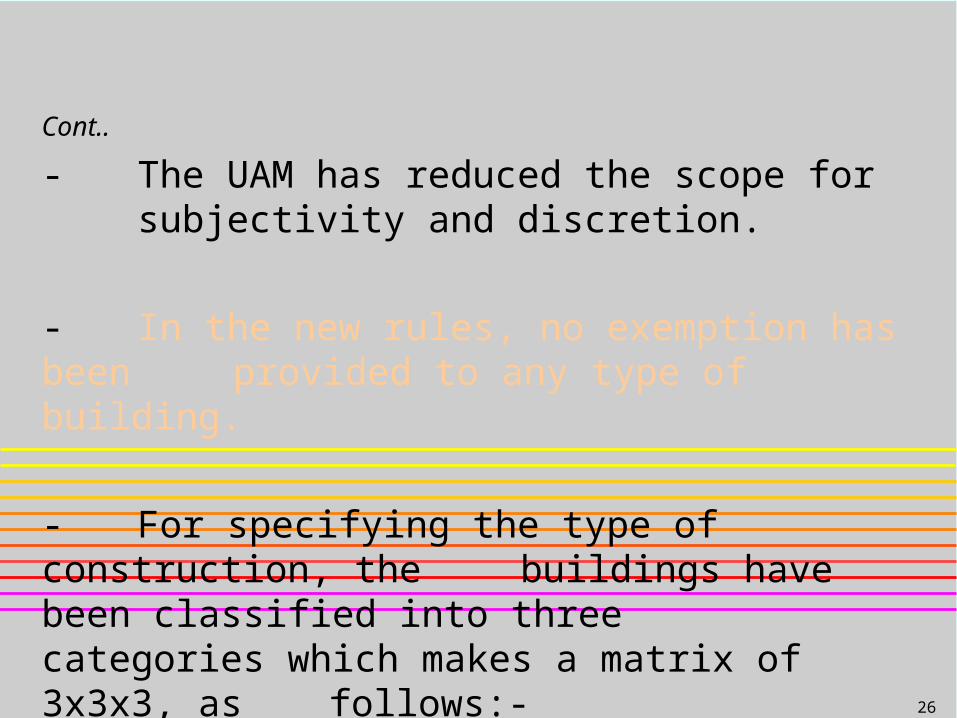
Cont..
- The UAM has reduced the scope for subjectivity and discretion.
- In the new rules, no exemption has been provided to any type of building.
- For specifying the type of construction, the buildings have been classified into three categories which makes a matrix of 3x3x3, as follows:-

27
Patna Tax Assessment Scheme (Rs. Per square feet)
Other Buildings
Pucca Buil-ding with Asbestos or Corrugated Sheets
Pucca Building with RCC Roof
Fully Resi- dential
OthersFully Comm- rcial or Indust-rial
Fully Resi- dential
OthersFully Comm- rcial or Indust-rial
Fully Resi- dential
OthersFully Comm- rcial or Indust-rial
TYPE OF CONSTRU-CTION
Holding on other Roads
Holding on the Main Road
Holding on the Principal Main Road
54.0 36.0 18.0 36.0 24.0 12.0 18.0 12.0 6.0
36.0 24.0 12.0 24.0 16.0 8.0 12.0 8.0 4.0
18.0 12.0 6.0 12.0 8.0 4.0 6.0 4.0 2.0

28
Comparison between New and Old Method to Assess Properties
Under new Rules ARV is redefined as the rend that a holding is capable of fetching over a period of one year
Rate of Taxation reduced to 9% of
ARV
Lower rates coupled with simpler rules:
-has eliminated any scope of discretion
of tax inspectors
-have been acceptable to people at large
Property Tax Demand : Rs. 17 crore
Estimated to grow to Rs.40 crore if estimated properly.
Earlier Definition of Annual Rental Value: The gross annual rent at which the holding may resonably be expected to let
Earlier Rate of Taxation:43.75% of ARV
Higher rate gave rise to:
- arbitrary and unreasonable assessment by inspector
-corruption and unscrupulousness
Property Tax Demand : Rs.4 crore
After revisionsBefore revisions
slide number 29
29
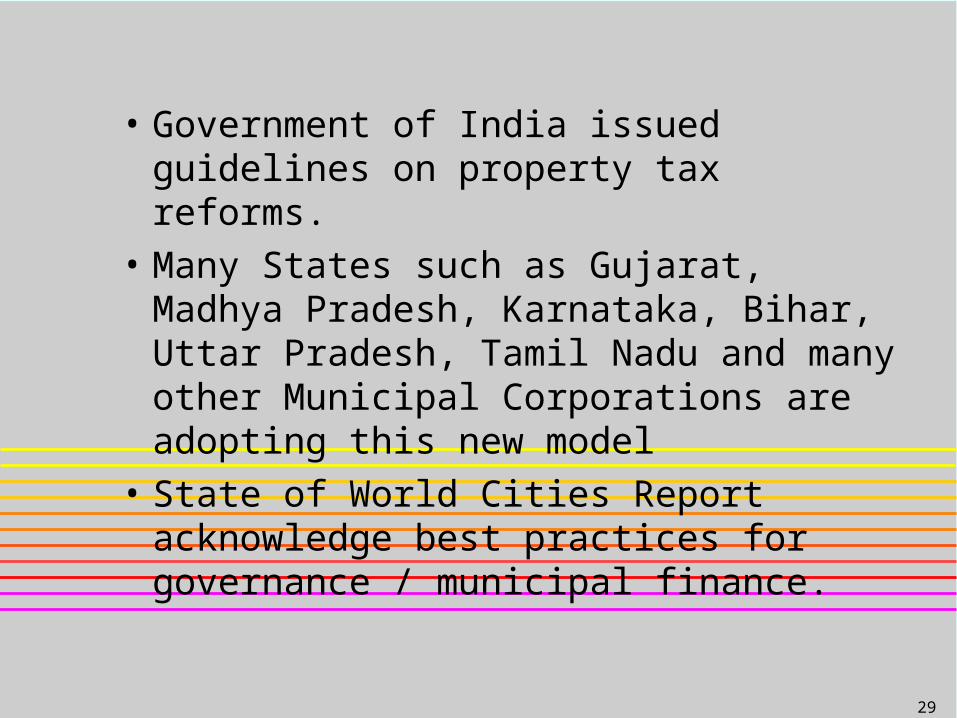
• Government of India issued guidelines on property tax reforms.
• Many States such as Gujarat, Madhya Pradesh, Karnataka, Bihar, Uttar Pradesh, Tamil Nadu and many other Municipal Corporations are adopting this new model
• State of World Cities Report acknowledge best practices for governance / municipal finance.
30
THANKS.THANKS.