Embed Size (px)
Citation preview

1
Abnormal Acidification of Melanoma Cells Induces Tyrosinase Retention in the Early
Secretory Pathway
Ruth Halaban¶, Robin S. Patton*, Elaine Cheng¶, Sherri Svedine*, E. Sergio Trombetta§,
Miriam L. Wahl†, Stephen Ariyan†, and Daniel N. Hebert*
From the Departments ¶Dermatology, §Cell Biology and †Plastic Surgery, Yale University
School of Medicine, New Haven, CT 06520; the *Department of Biochemistry and Molecular
Biology, Program in Molecular and Cellular Biology, University of Massachusetts, Amherst,
MA 01003 and the †Department of Biochemistry and Molecular Pharmacology, Thomas
Jefferson University, Philadelphia, PA 19107
Communicating authors:
Dr. Ruth Halaban Dr. Daniel N. Hebert
Yale University School of Medicine University of Massachusetts
Department of Dermatology Department of Biochemistry &
P.O. Box: 208059 Molecular Biology
15 York St., HRT 610 Amherst, MA 01003
New Haven, CT 06520-8059 Tel: 413-545-0079
Tel: 203-785-4352 Fax: 413-545-3291
FAX: 203-785-7637 [email protected]
Email: [email protected]
Key words: V-ATPase/pigmentation/oxidoreductase/glycolysis/pH
Condensed title: Tyrosinase Misfolding by Defective Acidification
Copyright 2002 by The American Society for Biochemistry and Molecular Biology, Inc.
JBC Papers in Press. Published on January 25, 2002 as Manuscript M111497200 by guest on M
arch 17, 2018http://w
ww
.jbc.org/D
ownloaded from

2
ABSTRACT
In tyrosinase-positive amelanotic melanoma cells inactive tyrosinase accumulates in the
endoplasmic reticulum. Based on studies described here, we propose that aberrant
V-ATPase-mediated proton transport in melanoma cells disrupts tyrosinase trafficking
through the secretory pathway. Amelantotic, but not melanotic melanoma cells or
normal melanocytes, display elevated proton export as observed by the acidification of
the extracellular medium and their ability to maintain neutral intracellular pH.
Tyrosinase activity and transit through the Golgi were restored by either maintaining the
melanoma cells in alkaline medium (pH 7.4 – 7.7), or by restricting glucose uptake. The
translocation of tyrosinase out of the endoplasmic reticulum and the induction of cell
pigmentation in the presence of the ionophore monensin or the specific V-ATPase
inhibitors, concanamycin A and bafilomycin A1, supported a role for V-ATPases in this
process. Since it was previously shown that V-ATPase activity is increased in solid
tumors in response to an acidified environment, the appearance of hypopigmented cells
in tyrosinase-positive melanoma tumors may indicate the onset of enhanced glycolysis
and extracellular acidification, conditions known to favor metastatic spread and the
resistance to weak base chemotherapeutic drugs.
INTRODUCTION
Tyrosinase (monophenol, L-dopa:oxygen oxidoreductase, EC 1.14.18.1) is a copper
binding enzyme that catalyses the oxidation of monohydric and dihydric phenols
(catechols) to their corresponding quinones, the rate limiting reaction in melanin
synthesis (1, 2). Peptides derived from tyrosinase are frequently presented on melanoma
cells by major histocompatibility molecules (3, 4). The development of immunotherapies
for patients with melanoma is based, in part, on employing cytotoxic T-cell recognizing
tyrosinase peptides as the immunogen (5). The production of these peptides is contingent
on the presence of tyrosinase and its proteolytic degradation products. However,
tyrosinase peptide presentation is an aberrant phenotype of melanoma cells because
tyrosinase in normal melanocytes is a stable enzyme that is localized to the melanosomes,
the site of melanin synthesis.
The production of antigenic peptides involves accumulation of tyrosinase in the
endoplasmic reticulum (ER) as a 70 kDa high-mannose glycoform and its subsequent
routing to the cytoplasm for degradation by the proteasome (6, 7). Failure of tyrosinase in
by guest on March 17, 2018
http://ww
w.jbc.org/
Dow
nloaded from
3
these melanoma cells to be processed in the medial Golgi, as indicated by
endoglycosidase H (Endo H) digestion and confocal microscopy (6, 7), is reminiscent of
albino mutant forms of tyrosinase, which contain loss-of-function mutations and are
retained in the ER (8-10). The observations that incubating melanoma cells with the co-
factor DOPA or high concentrations of the substrate tyrosine, enhanced the exit of
tyrosinase from the ER, its carbohydrate modification in the Golgi, transport to the
melanosomes and melanin production, suggested that tyrosinase inactivation is
associated with aberrant misfolding and ER retention (11). However, the cause of
inactivation of non-mutated tyrosinase in melanoma cells has not yet been elucidated.
We reasoned that inactivation of tyrosinase is likely to be linked to tumor induced
metabolic changes. A common phenotype shared by melanoma cells is acidification of
the extracellular milieu and poor response to chemotherapy (12-15). Melanoma cells
adapted to grow under hypoxic conditions, acidify their immediate extracellular
environment due to high rates of glucose uptake, increased glycolysis and the
accumulation of lactic acid (12, 16-18), a process known as the Warburg effect (19, 20). In
fact, increased glucose uptake is currently the basis for melanoma tumor staging by PET
(18F-fluorodeoxyglucose Positron Emission Tomography) (21). These metabolic changes
are likely to contribute to the drug resistance phenotype, since the extent of multidrug
resistance (MDR) in advanced melanoma lesions does not correlate with the expression
of P-glycoprotein (MDR-1), even after chemotherapeutic treatment (13-15).
An alternative mechanism shared by drug-resistant cells is sequestration of weak base
chemotherapeutics in acidic organelles away from their sites of action in the cytosol and
nucleus (22-24). Increased vacuolar proton ATPase (V-ATPase) activity has been
implicated in the acidification of endosomes, trans-Golgi network and lysosomes in solid
tumors to accommodate the acidic environment (25-27). Substances that cause
alkalinization of vesicular compartments, such as the Na+ ionophore monensin, or the
V-ATPase specific inhibitors concanamycin A or bafilomycin A1, also induce the release
of chemotherapeutic drugs and enhance their accumulation in the nucleus (28). Since
tyrosinase activity can be suppressed by acidified conditions (2, 29), we explored the
possibility that increased proton pump also affects tyrosinase activity and processing in
melanoma cells. We show here that tyrosinase trafficking and activity in amelanotic
melanoma cells was restored after alkaline treatment or inhibition of V-ATPase activity.
The data support the hypothesis that protonation, possibly in the ER-Golgi interface,
by guest on March 17, 2018
http://ww
w.jbc.org/
Dow
nloaded from

4
disrupts tyrosinase maturation in melanoma cells resulting in the amelanotic phenotype,
tyrosinase degradation and antigen production.
MATERIALS AND METHODS
Cell Culture _____ Normal human melanocytes were cultured from newborn foreskins in
Ham's F-10 medium supplemented with glutamine (2 mM), penicillin-streptomycin
(100 U/ml), and 7% Fetal Bovine Serum (FBS, all from Gibco BRL Life Technologies,
Rockville, MD), termed basal medium, that was further enriched with several ingredients
required for normal melanocyte proliferation. They included TPA (85 nM, 12-O-
tetradecanoyl phorbol-13-acetate), IBMX (0.1 mM, 3-isobutyl-1-methyl xanthine), cholera
toxin (2.5 nM), Na3VO4 (1 µM) and dbcAMP (0.1 mM, N6, 2’-O-dibutyryladenosine
3:5-cyclic monophosphate), all from Sigma-Aldrich Co. (St. Louis, MO) (termed TICVA)
(30).
Human metastatic amelanotic melanoma cells (YUGEN8, 501 mel, YUSIT1 and
YUSAC2) (30), were maintained in the Ham’s F-10 basal medium. The melanotic Heik178
cells were grown in the Ham’s F-10 basal medium supplemented with growth factors
(2 ng/ml FGF2, 10 nM ET-1 and 10 nM HGF plus 0.2 ng/ml heparin), and used during
the second passage in cultured. The melanotic MNT-1 melanoma cells (from Dr. M. S.
Marks, Department of Pathology and Laboratory Medicine, University of Pennsylvania
School of Medicine, PA) were grown in DMEM plus 20% serum and 10% AIM-V
medium (GibcoBRL) as described (31). When needed, the pH of the medium (pHe) was
monitored daily and adjusted to pH 7.7 with 1 N NaOH. Experiments were performed
with the basal medium, unmodified OptiMEM (Gibco BRL Life Technologies) plus 2%
FBS, DMEM-glucose-free medium or RPMI select amine (Gibco BRL Life Technologies)
reconstituted with Na pyruvate, tyrosine and glucose or galactose, as indicated. In some
experiments, the medium was supplemented with 50 µM of freshly prepared DOPA
(1 mM stock solution in PBS), monensin (10 mM stock solution in DMSO, both from
Sigma-Aldrich Co), concanamycin A or bafilomycin A1 (20 µM stock solutions dissolved
in DMSO; both from Calbiochem, San Diego, CA), pepstatin (10 mg/ml stock solution),
or leupeptin (Sigma, 20 mg/ml stock solution), using DMSO as a control when needed.
Western Blot Analysis, Precipitation and Antibodies___CHAPS lysis buffer (2% CHAPS in
50 mM HEPES and 200 mM NaCl, pH 7.5), containing protease inhibitors (Boehringer
Mannheim, Indianapolis, IN; CompleteTM protease inhibitor cocktail) was used to lyse
by guest on March 17, 2018
http://ww
w.jbc.org/
Dow
nloaded from

5
cells and to wash bead-bound precipitated material as described (6). Western blot
analyses were performed on whole cell lysates (40 µg protein/lane, as measured by the
Bio-Rad protein assay reagent, Bio-Rad Laboratories, Hercules, CA), anti-tyrosinase
immunoprecipitated proteins (C-19 goat, Santa Cruz Biotechnology Inc., Santa Cruz,
CA), or affinity purified glycoproteins using wheat germ agglutinin bound to beads
(WGA; lectin from triticum vulgaris), following standard procedures or the
manufacturer's instructions (Sigma-Aldrich Co). Endoglycosidase H (Endo H, Roche
Molecular Biochemical, Indianapolis, IN) digestion of precipitated proteins was
performed as described (6, 11). Tyrosinase was detected with mouse mAb T311 (32) and
protein loading in each lane was assessed by staining the gels with Coomassie brilliant
blue after transfer of the proteins to membranes and by immunoblotting with anti-actin
rabbit polyclonal antibodies (Sigma-Aldrich Co).
Tyrosinase Activity ____Tyrosinase assays were performed with L-tyrosine-[3, 5-3H] (Perkin-
Elmer Life Sciences) as a substrate (33-35). Briefly, reaction mixtures (200 µl final
volume), containing 150 µg cell extract protein prepared in 2% CHAPS buffer,
50 µM L-tyrosine, 1 µCi/assay L-tyrosine- [3, 5-3H], and 50 µM L-DOPA, were incubated
for 60 min at 37 oC. Reactions were stopped with 200 µl solution of 10% activated
charcoal in 0.1 M citric acid (w/v), the charcoal slurries passed through Dowex columns
(350 µl), and radioactivity of the eluate in scintillation fluid measured with a scintillation
counter. One unit of tyrosinase was defined as the amount of enzyme that catalyzed the
oxidation of 1 mmol tyrosine in 1 min. All reactions were performed in triplicates or
duplicates, and the standard errors were in the range of 15% of total counts.
Intracellular pH (pHi) Measurements___ Normal and malignant melanocytes were grown on
18 mm glass coverslips precoated with a 1:1 mixture of collagen I and fibronectin-like
RGD fragments at a final concentration of 50 µg/ml for 48-72 h. Cells were then
incubated with the pH-sensitive dye BCECF-AM [2',7'-bis-(2-carboxyethyl) -5-(and-6)-
carboxyfluorescein, acetoxymethyl ester] at final concentration of 5 µM for 4 min at pH
7.3 at room temperature and 5% CO2 as described (36, 37). Following a medium change
to pH 7.3 or 7.0, the cells were maintained for an additional 20 min at 37 ˚C, 5% CO2 to
allow to complete hydrolysis of the dye ester. The plates were then mounted on the
microscope stage and pH was monitored at 37 oC under humidified air containing
5% CO2. Cellular pHi values were calculated based on data from whole excitation spectra
(36, 37). All measurements were done in triplicates.
by guest on March 17, 2018
http://ww
w.jbc.org/
Dow
nloaded from

6
Metabolic Labeling ____Pulse-chase experiments were performed as described (8). Briefly,
cells were pulse-labeled for 15 min with [35S]Met/Cys (0.7 mCi/ml, EasyTag, Perkin-
Elmer Life Sciences, Boston, MA), in methionine/cysteine-free RPMI medium (Gibco
BRL Life Technologies) and either collected immediately or after chase incubation with
nonradioactive medium (Ham’s F-10) for the indicated period of time. Experiments were
performed in medium supplemented with tyrosine (as indicated) then subjected to
immunoprecipitation with rabbit anti-tyrosinase antibodies. Following extensive
washing with RIPA buffer, half of the precipitated products were digested with Endo H
overnight. Eluted proteins were fractionated in SDS-PAGE and dried gels were analyzed
by autoradiography. Densities of radioactive tyrosinase bands on the X-ray films were
determined using a Molecular Dynamics phosphoimager.
Immunofluorescence Microscopy ___ Melanoma cells were grown on chamber slides in
unmodified Ham’s F-10 medium at pH 7.4. Treated and untreated cells were washed
with PBS, fixed in 4% formaldehyde/PBS, and permeabilized with 0.1% Triton
X-100/PBS. The permeabilized and fixed cells were then incubated with antibodies
against tyrosinase (goat, C-19, Santa Cruz Biotechnology Inc.), ERGIC-53 (mAb; from
Dr. H.-P. Hauri, Geneva, Switzerland; a marker of ER/ER Golgi intermediate
compartment), COPI (rabbit polyclonal anti-β-COPI antibodies, a gift from
Dr. G. Warren, Department of Cell Biology at Yale; a marker for ER/ERGIC/Golgi
compartments), or calnexin (mAb, StressGen Biotechnologies Corp., Victoria BC, Canada;
an ER marker). The primary antibodies were detected with flourescein anti-goat
conjugates (Santa Cruz Biotechnology), or rhodamine anti-mouse or anti-rabbit
conjugates (Molecular Probes, Eugene, OR). All dilutions were in 0.1% BSA/PBS. Indirect
immunofluorescence was visualized with an inverted Bio-Rad MRC-600 Laser Confocal
Microscope System. Images were processed with Bio-Rad Confocal Assistant software.
RESULTS
Stabilization of Tyrosinase by Raising Extracellular pH ___ Under normal conditions, the
media from amelanotic melanoma cells becomes rapidly acidified within a day of
medium change (pH 7.0-7.2), whereas that of normal melanocytes, or the pigmented
metastatic melanoma Heik178, remain basic (pH 7.4-7.5). We therefore, evaluated
pigmentation and tyrosinase processing in melanoma cells (YUGEN8) subcultured in
Ham’s F-10 medium adjusted daily to pH 7.7, and compared it to cells that were
by guest on March 17, 2018
http://ww
w.jbc.org/
Dow
nloaded from
7
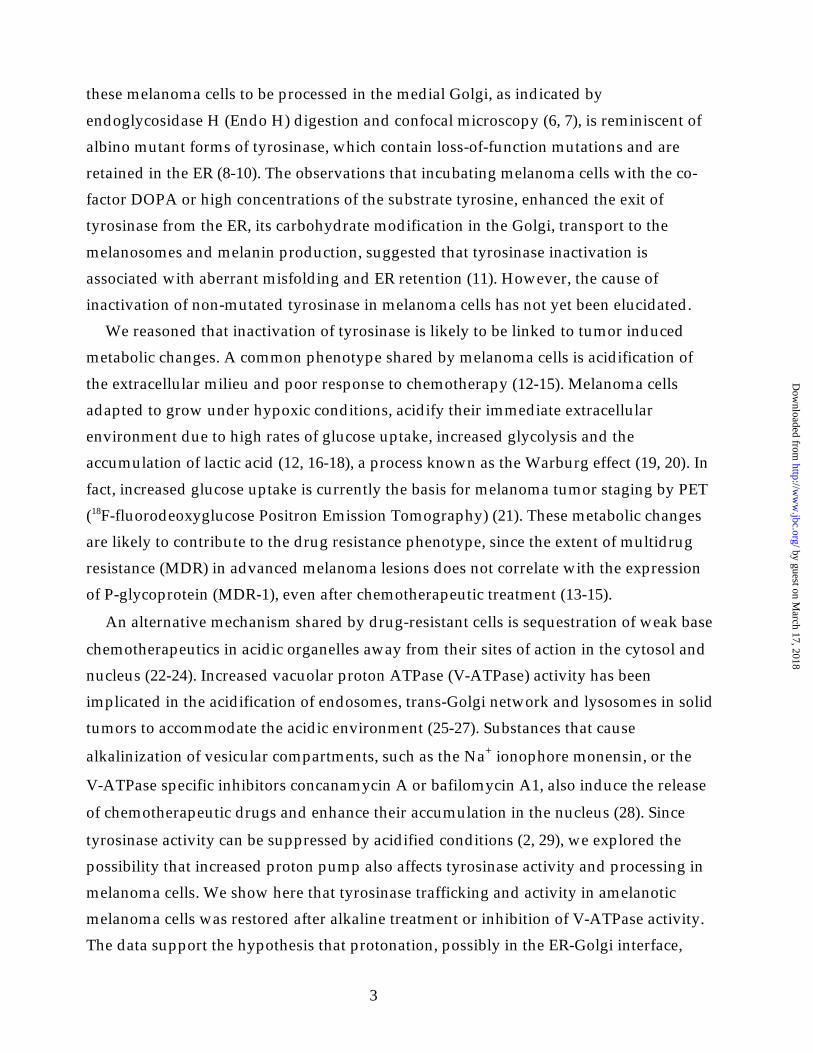
continuously grown in unmodified Ham’s F-10 medium. Alkalinization of the
extracellular pH (pHe) had a marked effect as the cells became pigmented during two
weeks of culture (Fig. 1A). Analysis of steady-state tyrosinase levels demonstrated an
increase in the abundance of tyrosinase protein (normalized to actin and total protein
concentration, Fig. 1B, lanes 1 and 2). Most striking was the increase in the level of the
higher molecular weight mature tyrosinase (Fig. 1B, compare lanes 1 and 2; arrow) (6, 7).
The identification of the higher molecular weight tyrosinase glycoform as a protein
that had been modified by Golgi enzymes was verified by Endoglycosidase H (Endo H)
digestion. Endo H cleaves N-linked oligosaccharides between the two
N-acetylglucosamine residues in the core region of the oligosaccharide chain of high
mannose but not complex carbohydrates. Since the addition of complex sugars occurs in
the medial Golgi, the limited substrate specificity of this enzyme provides a useful tool
for monitoring the subcellular location of proteins. Endo H treatment had only a slight
effect on the electrophoretic mobility of mature tyrosinase (Fig. 1B, lanes 4 and 6; solid
arrow) indicating that the majority of the seven tyrosinase N-linked glycans had been
modified with complex sugars in the Golgi (38). In contrast, the faster migrating
immature glycoform (Fig. 1B, bands marked with empty arrow), was digested to its
58 kDa polypeptide indicative of complete sensitivity of all of seven glycans in
tyrosinase, characteristic of ER or cis-Golgi residency (Fig. 1B, lanes 4 and 6, band
marked DG, for deglycosylated). A low molecular weight species of ~58 kDa (Fig. 1B,
lane 2 marked with spearhead) also accumulated after incubation in alkaline pHe. This
protein band represents the non-glycosylated tyrosinase as shown by its inability to bind
WGA (Fig. 1B, lanes 5) as reported (6, 11).
Further evidence that alkaline pHe promoted tyrosinase maturation and activation
was obtained by analyzing the effect of DOPA on this process. We have previously
shown that addition of the co-factor DOPA to the growth medium in the presence of
catalytic amounts of the substrate tyrosine promoted tyrosinase activation and
maturation in melanoma cells within hours (11). Because DOPA activation of tyrosinase
is dependent on pH (2, 29), we tested whether low pHe could suppress the DOPA effect.
Indeed, maintaining the cells at low pHe, hampered the DOPA/tyrosine-induced
maturation (Fig. 1C, compare lanes 1-3 to 4-7), suggesting that long-term growth in
acidified pH suppresses DOPA activation, tyrosinase maturation and pigmentation.
by guest on March 17, 2018
http://ww
w.jbc.org/
Dow
nloaded from

8
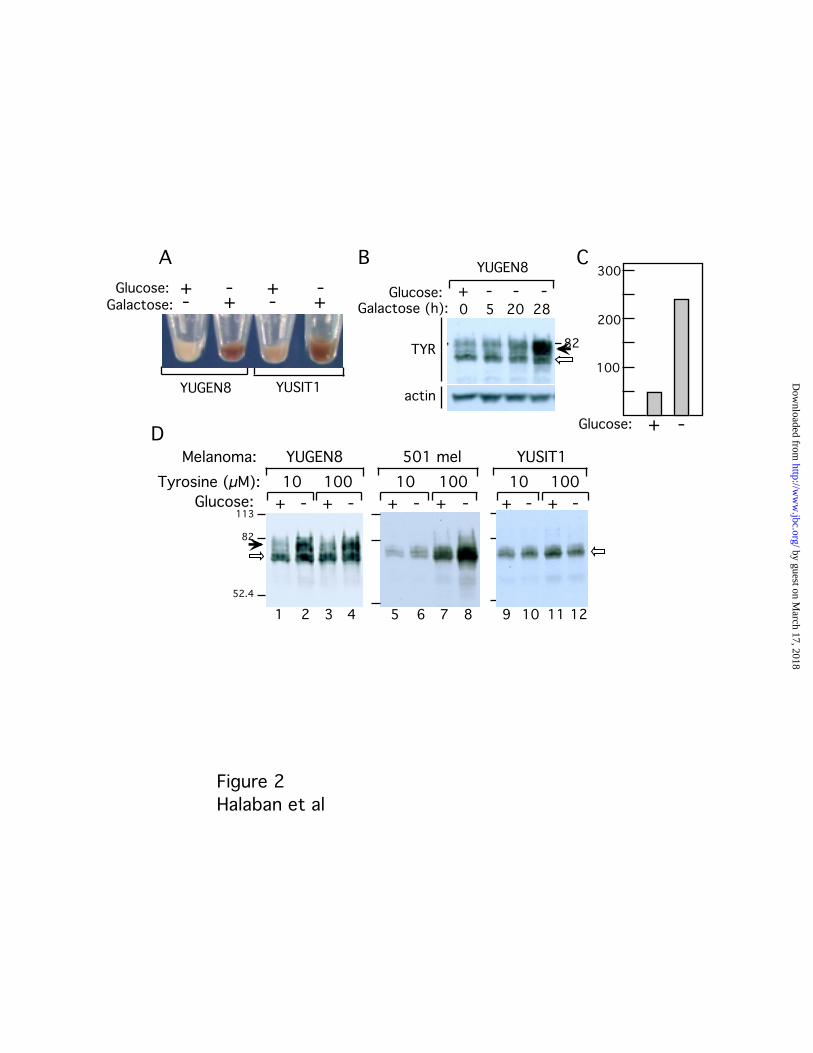
Tyrosinase Processing is Induced by Glucose Restriction in Melanoma Cells___ Since increased
glucose consumption can increase acidity due to the accumulation of lactic acid in the cell
environment (17), we tested if eliminating glucose in the medium could affect
pigmentation, tyrosinase activity and maturation. Toward this end, melanoma cells
(YUGEN8 and YUSIT1) were grown for 3 days in glucose-free medium with 1 mM
pyruvate, supplemented with 25 mM glucose (+), or 2 mM galactose (-) (Fig. 2). The
source of energy affected the pH of the external medium, since at the end of three days of
incubation, the pHe was 7.1 and 7.5-7.7, in the glucose-containing and glucose-free
(galactose-supplemented) medium, respectively. The levels of pigmentation were also
dramatically increased in melanoma cells (YUGEN8 and YUSIT1) grown in the glucose-
free compared to glucose-supplemented medium (Fig. 2A, compare + to -). Time course
analysis revealed the accumulation of the 80-kDa tyrosinase glycoform in melanoma cells
after 28 hours in glucose-free medium (Fig. 2B, TYR), accompanied by a large increase in
tyrosinase activity (Fig. 2C). These results demonstrated that glucose metabolism has an
impact on tyrosinase activity and processing, probably due to acidification of the
extracellular milieu and endomembranous compartments.
Since tyrosinase maturation has previously been shown to be induced by its
activation (11), we further investigated whether the restoration of tyrosinase processing
obtained with direct alkalinization of the pHe (Fig. 1), or by restricting glucose
consumption (Fig. 2), could be modulated by the concentrations of tyrosine in the
medium. As the glucose-free medium used above contained a high tyrosine
concentration (400 µM), we incubated three melanoma cell lines (YUGEN8, 501 mel and
YUSIT1) in RPMI select-amine medium supplemented with glucose or galactose in the
presence of low (10 µM) or high (100 µM) tyrosine for three days. Tyrosinase was
processed to the 80 kDa form in cells grown in glucose-free medium at both low and high
tyrosine concentrations in melanoma cells exhibiting relatively modest levels of
tyrosinase (Fig. 2D, YUGEN8, compare lanes 1 to 2, and 3 to 4, solid and empty arrows).
Melanoma cells with lower levels of tyrosinase displayed different thresholds of
activation. The 501 mel cells required at least 100 µM tyrosine for stabilization (Fig. 2D,
compare lane 6 to 8), whereas the enzyme remained as the ER 70 kDa glycoform in
YUSIT1 melanoma cells even at 100 µM tyrosine (Fig. 2D, lanes 9-12, empty arrow).
Therefore, in agreement with previous observations (11), the effectiveness of glucose
restriction and alkaline extracellular pH was dependent on the concentration of tyrosine
by guest on March 17, 2018
http://ww
w.jbc.org/
Dow
nloaded from

9
in the medium and the levels of endogenous tyrosinase, suggesting that the maturation
process was dependent on tyrosinase activity.
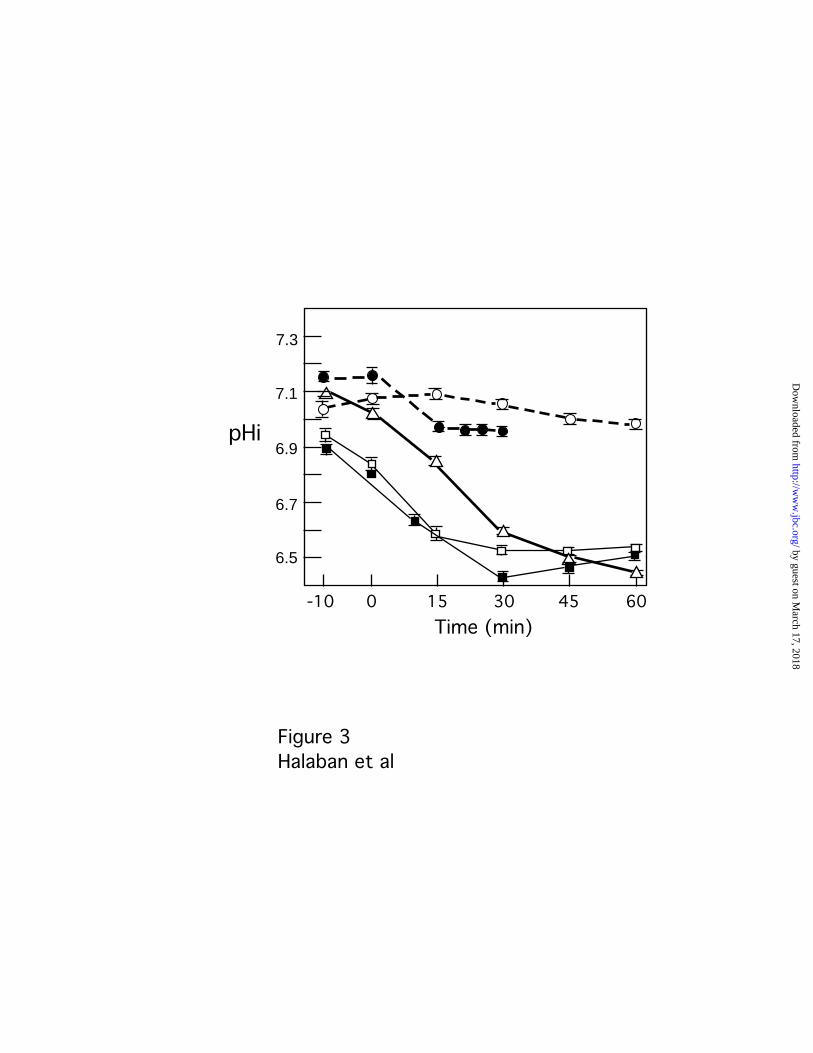
Amelanotic Melanoma Cells Maintain higher Intracellular pH Values ___ The enhanced
extracellular acidification observed for amelanotic melanoma cells indicated an increased
proton pump activity at their plasma membrane. In addition, the surface proton pumps,
Na+/H+ antiporters and Cl-/HCO3 exchangers are known to be activated in tumor cells in
order to maintain intracellular pH (pHi) and protect the cells from the acidic extracellular
environment (reviewed in 24). We therefore assessed the pHi in response to external
acidification in normal melanocytes and compared it to melanotic and amelanotic
melanoma cells.
A shift to extracellular pH 7.0 induced a dramatic drop in intracellular pH in normal
melanocytes and pigmented melanoma cells (Heik178 and MNT-1). In contrast, the pHi
of the amelanotic melanoma cells (YUGEN8 and 501 mel) remained relatively alkaline
and was persistently 0.4-0.5 pH units above that of cells that retained their pigmented
phenotype in culture (normal and malignant melanocytes), indicating high compensating
proton pump activity in amelanotic melanoma cells (Fig. 3). Changes in the activity of the
proton pumps in melanoma cells in response to growth in low extracellular pH for
several days were recently reported (16).
Inhibition of Proton Pump Activity Promotes Tyrosinase Maturation___ Activation of proton
pumps in cultured amelanotic melanoma cells can be inferred from the highly acidified
conditioned medium, and their ability to compensate their pHi when exposed to pH 7.0.
V-ATPases have been implicated in neutralizing cytosolic pH by pumping protons away
from the cytoplasm to the outside milieu, as well as into acidic organelles such as the
Golgi, endosomes and lysosomes (25, 39, 40). We therefore, tested the effect of the Na+
ionophore monensin known to reversibly raise the pH of endocytic vesicles (22, 41) and
the high-affinity V-ATPase inhibitors concanamycin A and bafilomycin A1 (42) on
tyrosinase maturation and activity. Four different strains of amelanotic melanoma cells
became highly pigmented within 2 hours of incubation with each of these compounds in
the presence of 100 µM tyrosine, without any manipulation of the extracellular pH (data
not shown). In agreement with published observations (43, 44), the three agents also
increased the level of pigmentation of the already highly melanized normal human
melanocytes derived from Caucasian donors. The increase in pigmentation in all cell
types was likely due to an increase in in situ tyrosinase activity in response to
by guest on March 17, 2018
http://ww
w.jbc.org/
Dow
nloaded from
10
alkalinization of vesicular compartments known to be acidified under normal conditions
(45, 46). In vitro tyrosinase activity of cell extracts from normal melanocytes and
melanoma cells (YUGEN8 and 501 mel), increased 5- and 2-fold in a pH dependent
manner (between pH 6.6 to 8.0), respectively (our unpublished results in agreement with
43), suggesting that mature and immature forms of tyrosinase are activated at basic pH.
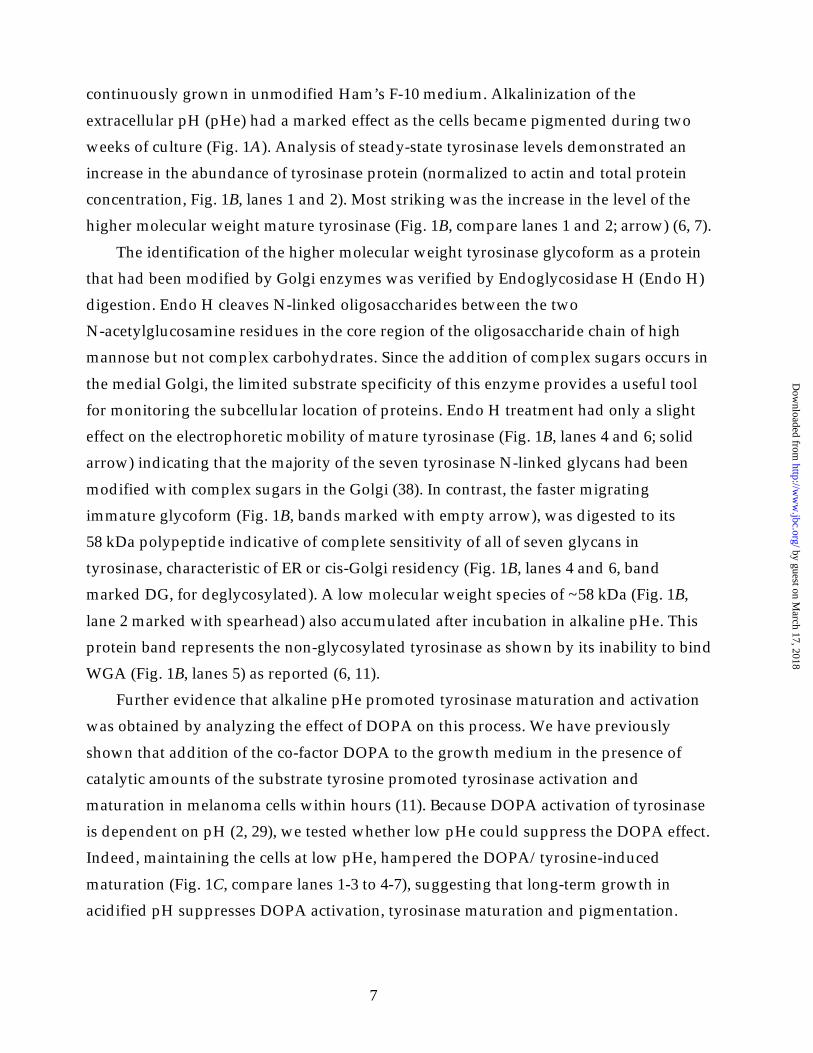
Analyses of steady-state tyrosinase levels showed that in normal human
melanocytes, the mature 80 kDa enzyme, the predominant glycoform, was not affected
by monensin, concanamycin A or bafilomycin A1 (Fig. 4A, compare lane 1 to 2-4). In
contrast, treatment of melanoma cells with nanomolar concentrations of the two
V-ATPase inhibitors induced the conversion of the 70 kDa glycoform to the mature
80 kDa glycoform (Fig. 4A, lanes 7, 8, 11, 12, 15, 16, 19 and 20). Although high
concentrations of tyrosine were not required to elicit maturation (Fig. 4A, lanes 17–20; B,
as indicated; C and D), higher levels of tyrosine enhanced the effect of the V-ATPase
inhibitors on tyrosinase (Fig. 4B). Dose-response analysis showed that concanamycin A
and bafilomycin A1 were optimally effective at 20 nM and 50 nM, respectively. However,
5 nM of each inhibitor was sufficient to induce tyrosinase maturation (Fig. 4C). At
optimal concentrations, high molecular weight forms of tyrosinase began to accumulate
within 30 min of incubation, with maximum effect reached within 3 h (Fig. 4D). The low
concentration required to elicit an effect and the higher effectiveness of concanamycin A
over bafilomycin A1 on tyrosinase maturation, are indicative of specific inhibition of
V-ATPase, and in agreement with the relative potency of each compound toward
V-ATPase inhibition (42).
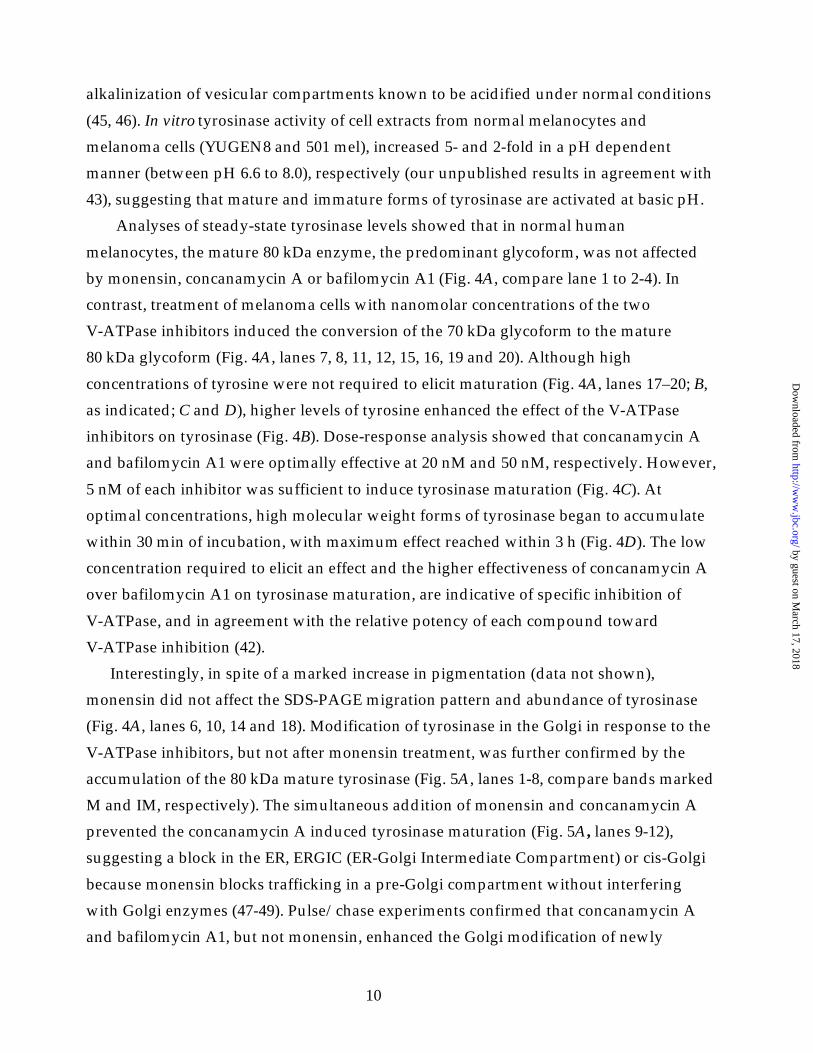
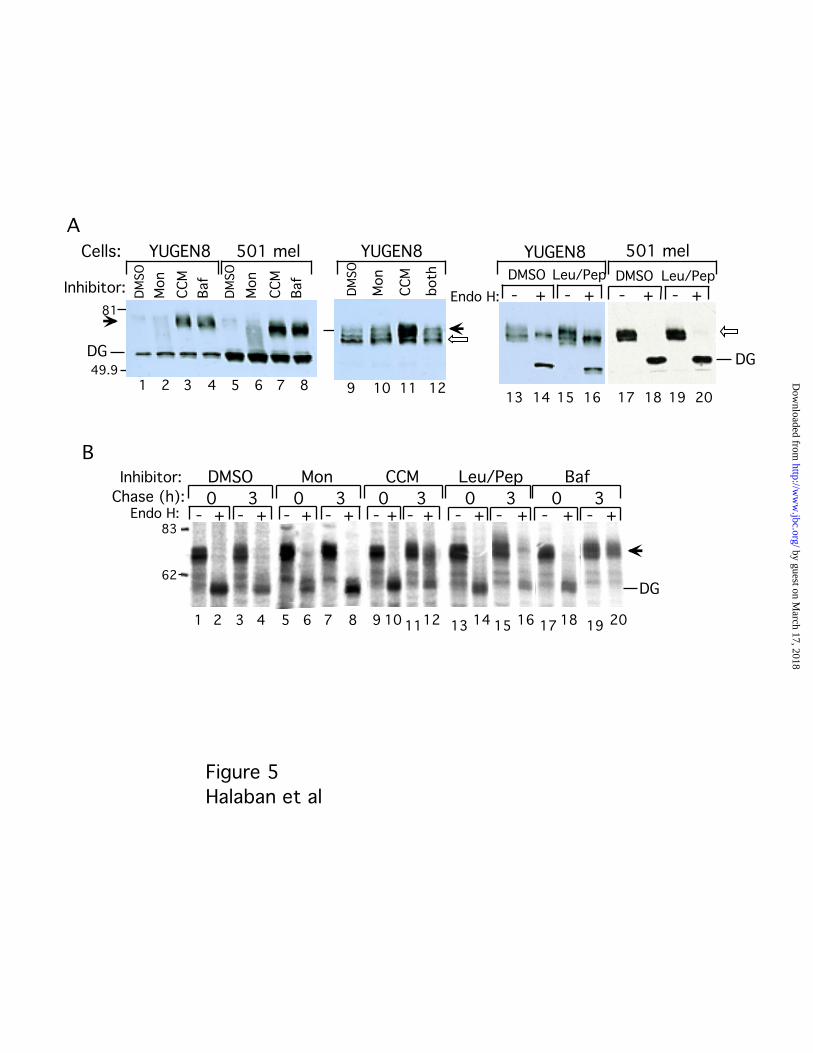
Interestingly, in spite of a marked increase in pigmentation (data not shown),
monensin did not affect the SDS-PAGE migration pattern and abundance of tyrosinase
(Fig. 4A, lanes 6, 10, 14 and 18). Modification of tyrosinase in the Golgi in response to the
V-ATPase inhibitors, but not after monensin treatment, was further confirmed by the
accumulation of the 80 kDa mature tyrosinase (Fig. 5A, lanes 1-8, compare bands marked
M and IM, respectively). The simultaneous addition of monensin and concanamycin A
prevented the concanamycin A induced tyrosinase maturation (Fig. 5A, lanes 9-12),
suggesting a block in the ER, ERGIC (ER-Golgi Intermediate Compartment) or cis-Golgi
because monensin blocks trafficking in a pre-Golgi compartment without interfering
with Golgi enzymes (47-49). Pulse/chase experiments confirmed that concanamycin A
and bafilomycin A1, but not monensin, enhanced the Golgi modification of newly
by guest on March 17, 2018
http://ww
w.jbc.org/
Dow
nloaded from
11
synthesized tyrosinase in melanoma cells (Fig. 5B, YUGEN8, lanes 1-12, 17-20, bands
marked with arrow).
To determine if tyrosinase stabilization by alkalination or inhibition of V-ATPases
could be due to the interference with lysosomal proteolysis, tyrosinase was monitored
after inhibition of the lysosomal proteases with leupeptin and pepstatin. Treatment of
melanoma cells with leupeptin and pepstatin caused only a slight increase in the levels of
steady-state or newly synthesized tyrosinase with complex carbohydrates in YUGEN8
(Fig. 4A, lanes 13-16; B, lanes 13-16), but not in 501 mel cells (Fig. 5A, lanes 17-20). The
results indicated that although small amounts of tyrosinase was able to reach a post-
Golgi compartment in some melanoma cell strains, lysosomal protease inhibition could
not account for the pigmentation and enhanced maturation of tyrosinase observed after
alkalination or V-ATPase inhibition.
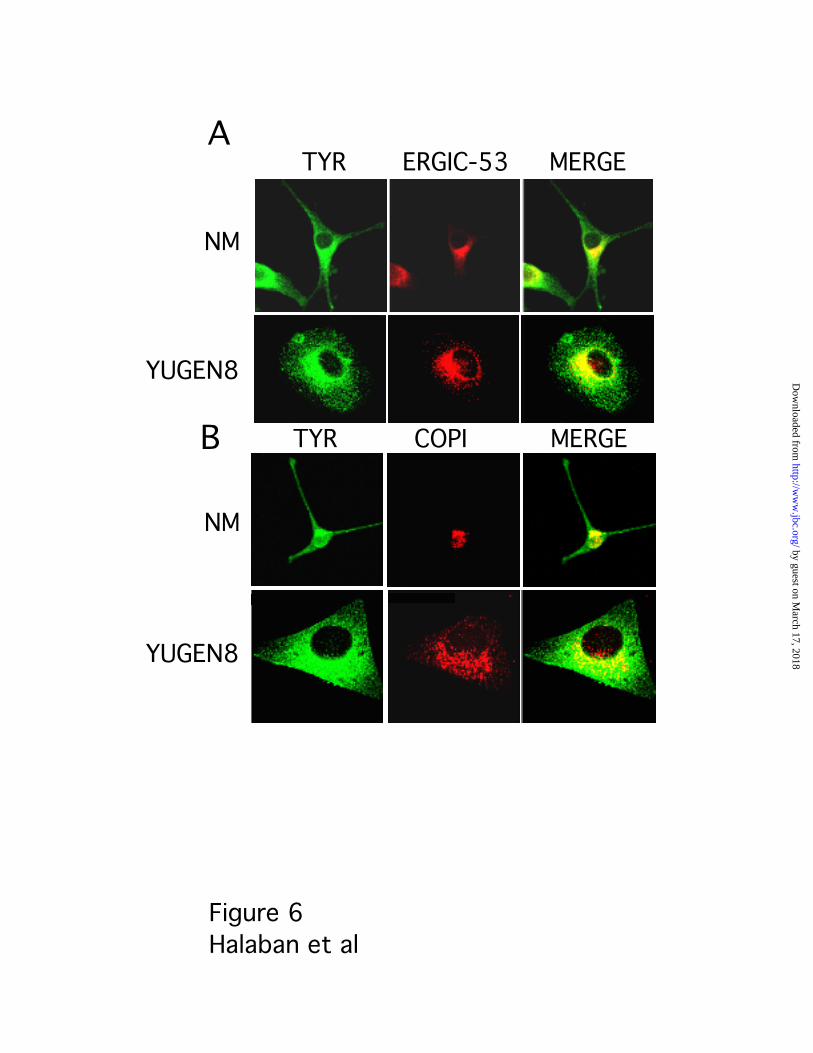
Exit of Tyrosinase from the ER in Response to Intracellular Alkalination___Confocal
immunofluorescence analyses indicated that tyrosinase remained in the ER in melanoma
cells under steady-state conditions (Fig. 6). Antibodies to ERGIC-53 and COPI stained
normal melanocytes and melanoma cells in a characteristic perinuclear crescent shape
pattern representing the Golgi, as well as in punctate structures peripheral to the ER
region corresponding to the ERGIC, and the ER. In normal melanocytes, only partial
overlap was seen between tyrosinase and ERGIC-53 or COPI (Fig. 6, NM). In contrast, in
the melanoma cells tyrosinase co-localized with ERGIC-53 and COPI in the ER region but
not in the ERGIC or Golgi regions, as shown by the red rhodamine vesicles containing
ERGIC-53 or COPI that did not merge with green FITC-tyrosinase (Fig. 6, YUGEN8).
Therefore, if tyrosinase travels beyond the ER in untreated melanoma cells, its presence
there must be short lived, as it cannot be detected under steady-state conditions by
immunostaining.
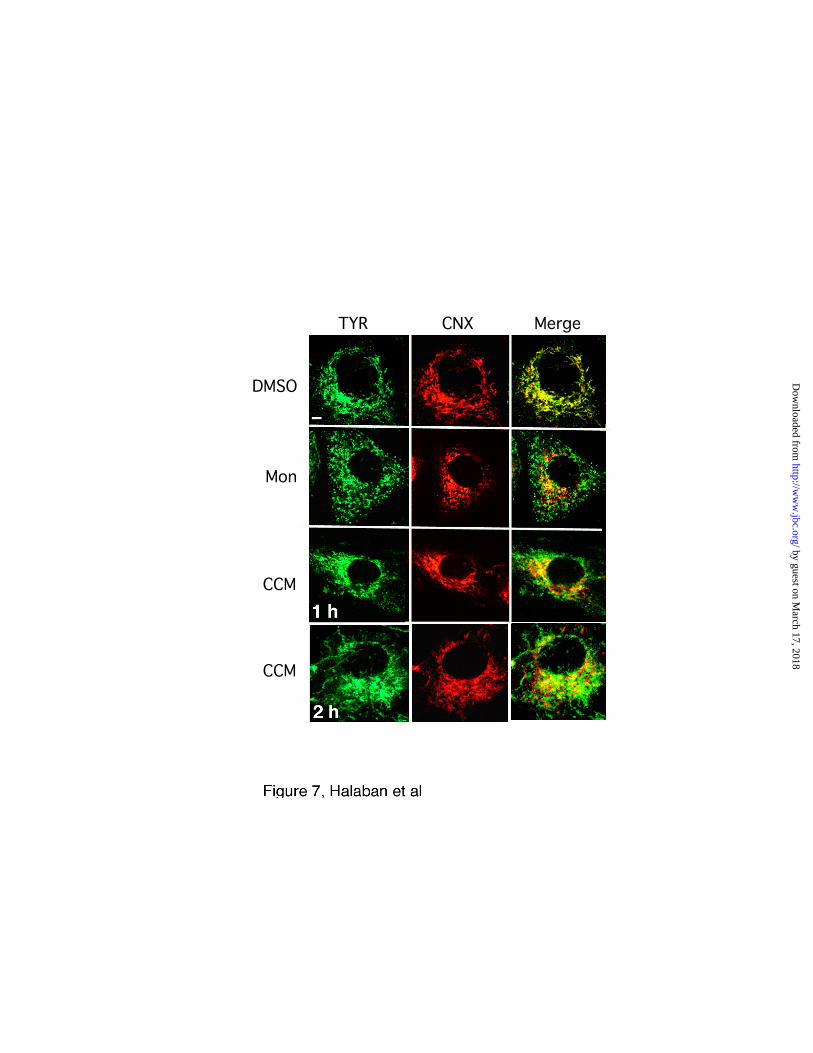
Simultaneous immunostaining with tyrosinase and the ER marker calnexin showed
that tyrosinase exited from the ER in response to concanamycin A and monensin (Fig. 7).
Within 1 h of treatment with concanamycin A, tyrosinase appeared in structures that did
not coincide with the ER (Fig. 7, CCM 1 h). After 2 h treatment, tyrosinase localized in
tubules extending from perinuclear compartments across the cell (Fig. 7, CCM 2 h).
Tyrosinase was also distributed outside the ER and did not colocalize with calnexin after
a 2 h incubation with monensin (Fig. 7, panel marked Mon). The confocal images
confirmed the steady-state immunoblotting results demonstrating exit of tyrosinase from
by guest on March 17, 2018
http://ww
w.jbc.org/
Dow
nloaded from

12
the ER in response to imposed alkalinization. Although the nature of the tyrosinase-
positive post-ER structures after monensin and concanamycin A treatment has yet to be
determined, it is possible that the enzyme was exported to distant sites by two different
pathways, one that involved the Golgi medial processing compartment and the other that
did not.
DISCUSSION
We provided evidence that abnormal acidification of the extracellular milieu is the likely
reason for the decline in tyrosinase catalytic activity in tyrosinase-positive amelanotic
melanoma cells. In these cells, tyrosinase catalytic activity was restored by alkalinization,
in a manner dependent on the presence of extracellular tyrosine. Alkalination was
accomplished by adjusting the pH of the extracellular medium, by glucose deprivation,
or by using agents that inhibit vacuolar proton ATPases or dissipate pH gradients across
membranes. Therefore, inactivation of tyrosinase is likely to be the consequence of
increased proton pump activity in the malignant cells compared to normal melanocytes.
This change was also reflected by the appearance of higher pHi under steady-state
conditions in melanoma cells. The higher proton pump activity is probably localized at
both the cell membrane and within the endomembranes. Whereas Na+/H+ antiporters
and Cl-/HCO3 exchangers are known to be activated in tumor cells in order to maintain
pHi, V-ATPases are the major proton pumps of vesicular compartments (reviewed in 24).
V-ATPases play a principle role in generating and maintaining the acidic environment in
the lumen of intracellular organelles such as the Golgi, endosomes and lysosomes
(reviewed in 50, 51-53). While the Golgi contains active V-ATPases, the ER does not (46,
54, 55). Therefore, tyrosinase may encounter an increased activity of this proton pump in
a compartment anterograde to the ER in melanoma cells.
The ionophore monensin and two V-ATPase inhibitors allowed the release of
tyrosinase from the ER and induced pigmentation, but yet only the V-ATPase inhibitors
promoted tyrosinase acquisition of complex sugars. Monensin and the V-ATPase
inhibitors affect lumenal processes at the ER/Golgi boundary via different mechanisms.
Monensin blocks ER trafficking of glycoproteins, such as IgG and transferrin, in a pre-
Golgi compartment without interfering with Golgi enzymes (47-49). Bafilomycin A1, on
the other hand, inhibits retrograde transport of proteins such as ERGIC-53 from the pre-
Golgi-compartment back to the ER, but not the anterograde transport of proteins from
by guest on March 17, 2018
http://ww
w.jbc.org/
Dow
nloaded from
13
the ER to the Golgi (54). Because both agents cause alkalination of subcellular organelles,
tyrosinase exit from the ER and pigmentation were probably enhanced due to activation
of enzymatic activity by the increased pH. In vitro tyrosinase activity employing cell
extracts from normal and malignant melanocytes, expressing mature and immature
forms, respectively, showed a pH dependent activity with tyrosinase being 2-5 fold more
active at pH 8 compared to pH 6.3 (data not included). Therefore, like in vivo, the in vitro
activation did not require modification to complex carbohydrates.
This conclusion is consistent with published values of pH within the secretory
pathway and their changes in response to V-ATPase inhibition (45, 47). The ER and the
Golgi maintain a pH of 7.2 ± 0.2 and 6.4 ±0.3, respectively, and bafilomycin A1 induced
alkalinization of the various regions of the Golgi complex but did not affect the pH of the
ER (56). Therefore, the aberrant accumulation of tyrosinase in the ER of melanoma cells
raises the possibility that the acidified ER/Golgi boundary of melanoma cells is hostile to
tyrosinase maturation. Even small changes in lumenal pH can cause a significant change
in protein processing and activation, as shown for the processing of adrenocorticotropic
hormone from its pro-opiomelanocortin precursor (57).
Quality control processes that monitor the fidelity of the maturation process appear to
be in place throughout the secretory pathway (58). Some misfolded or partially
assembled proteins that have escaped the ER can still be subjected to quality control in
the early secretory system because they can be retrieved from post-ER compartments
back to the ER through COPI vesicles (59-61). In these cases, inhibition of the COPI
retrieval system induced the accumulation of the respective protein in post-ER
compartments.
In light of these observations, the accumulation of tyrosinase in the ER of melanoma
cells might also be the result of the quality control system in the ERGIC/cis-Golgi.
Tyrosinase under steady-state conditions colocalized with the ER marker calnexin and
with the ER portion of ERGIC-53 and COPI, suggesting a rapid retrograde transport to
the ER if it reached a post-ER/pre-Golgi compartment. The observations that monensin,
even in the presence of concanamycin A elicited tyrosinase activation, ER exit, transport
to distant sites and pigmentation in the absence of Golgi processing, suggest that
monensin acts by dissipating a pH gradient upstream of the concanamycin A affected-
site, such as the ERGIC. These results also demonstrate that basic pH is sufficient to
activate tyrosinase, in agreement with the pH-dependent in vitro tyrosinase activity, and
that the addition of complex oligosaccharides is dispensable for tyrosinase activity.
by guest on March 17, 2018
http://ww
w.jbc.org/
Dow
nloaded from
14
The concept of abnormal acidification of intracellular organelles, including the
melanosomes, as the cause for an amelanotic phenotype is supported also by genetic
evidence. OCA2 is an inherited condition in which individuals suffer loss-of-function
mutation in the P-protein (62-65). The P-protein is a 110-kDa melanosomal protein (66)
with 12 putative membrane-spanning domains and homology to known transporters
(67). In the absence of normal P-protein, there is an imbalance in the intracellular pH of
melanosomes, disruption in melanosomal structure, and misrouting of tyrosinase to
other sites including the cell membrane (68-70). It was recently suggested that the
P-protein acts as a Na+/H+ exchanger in the melanosomes (71, 72). The homology to
E. coli Na+/H+ antiporter and the observation that dissipating pH gradients or inhibiting
V-ATPase activity in mouse melanocytes carrying the p-mutation restored pigmentation
(71), supports this possibility.
We suggest that tyrosinase maturation is particularly vulnerable to pH changes
because of its oxidoreductase activity and its dependence on DOPA for activation. The
acidic pH may have inactivated tyrosinase by the protonation of DOPA, the critical co-
factor and substrate for tyrosinase (1, 2, 73-75). Unlike tyrosine, DOPA (and other
catechols) can be oxidized to the corresponding quinone by the met-form of the enzyme
(Cu II state without bound dioxygen), thus reducing the copper atoms in the active site
and enabling the generation of the active, oxygen-bound form (2, 74, 75). Protonation of
DOPA prevents the formation of DOPAquinone, the intermediate required for DOPA
regeneration (2, 29, 75). The precise mechanism by which DOPA is regenerated from
DOPAquinone is not yet determined, but it is possible that DOPAquinone is reduced to
DOPA through the oxidation of critical sulfhydryl groups on tyrosinase, forming the
final disulfide bond(s) required to stabilize the protein in its native/active form. In this
scenario, depletion of DOPAquinone leads to the accumulation of misfolded tyrosinase
in the ER or the ER/Golgi boundary. The requirement for a tyrosinase reaction product
in tyrosinase proper folding may explain the uniqueness of tyrosinase sensitivity to
proton changes, because the maturation of the homologous melanocyte-specific
glycoprotein, gp75/TRP1, within melanoma cells is unaffected (76).
Our results provide an explanation for the appearance of amelanotic clones in
primary and metastatic pigmented tumors in which tyrosinase accumulates in the ER, as
a result of organelle acidification in vivo. It would be of interest to correlate the
appearance of amelanotic clones in primary and metastatic pigmented tumors with rates
by guest on March 17, 2018
http://ww
w.jbc.org/
Dow
nloaded from
15
of glucose uptake and the acquisition of drug resistance to further substantiate that
downregulation of tyrosinase is a consequence of these metabolic changes in vivo.
Acknowledgements
We thank Drs. L. Old (Memorial Sloan-Kettering Cancer Center, New York, NY) for anti-
tyrosinase 3T11 mAb, Dr. H.-P. Hauri for the ERGIC-53 antibodies, Dr. G. Warren for the
rabbit polyclonal anti-β-COPI antibodies and M. S. Marks for the MNT-1 melanoma cells.
This work was supported by USPHS grants AR39848 and CA44542 to R.H and AR41942
(Yale Skin Diseases Research Center; R.E. Tigelaar, Program Investigator), and USPHS
grant CA79864 to D.N.H.
by guest on March 17, 2018
http://ww
w.jbc.org/
Dow
nloaded from
16
REFERENCES
1. Lerner, A. B., Fitzpatrick, T. B., Calkins, E., and Summerson, W. H. (1949) J. Biol. Chem.
178, 185-195
2. Riley, P. A. (1999) Cell. Mol. Biol. 45, 951-960
3. Kang, X. Q., Kawakami, Y., Elgamil, M., Wang, R. F., Sakaguchi, K., Yannelli, J. R.,
Appella, E., Rosenberg, S. A., and Robbins, P. F. (1995) J. Immunol. 155, 1343-1348
4. Topalian, S. L., Gonzales, M. I., Parkhurst, M., Li, Y. F., Southwood, S., Sette, A.,
Rosenberg, S. A., and Robbins, P. F. (1996) J. Exp. Med. 183, 1965-1971
5. Cormier, J. N., Abati, A., Fetsch, P., Hijazi, Y. M., Rosenberg, S. A., Marincola, F. M.,
and Topalian, S. L. (1998) J. Immunother. 21, 27-31
6. Halaban, R., Cheng, E., Zhang, Y., Moellmann, G., Hanlon, D., Michalak, M., Setaluri,
V., and Hebert, D. N. (1997) Proc. Natl. Acad. Sci. USA 94, 6210-6215
7. Mosse, C. A., Meadows, L., Luckey, C. J., Kittlesen, D. J., Huczko, E. L., Slingluff, C.
L., Shabanowitz, J., Hunt, D. F., and Engelhard, V. H. (1998) J. Exp. Med. 187, 37-48
8. Halaban, R., Svedine, S., Cheng, E., Smicun, Y., Aron, R., and Hebert, D. N. (2000)
Proc. Natl. Acad. Sci. USA 97, 5889-5894
9. Berson, J. F., Frank, D. W., Calvo, P. A., Bieler, B. M., and Marks, M. S. (2000) J. Biol.
Chem. 275, 12281-12289
10. Toyofuku, K., Wada, I., Spritz, R. A., and Hearing, V. J. (2001) Biochem. J. 355, 259-269.
11. Halaban, R., Cheng, E., Svedine, S., Aron, R., and Hebert, D. N. (2001) J. Biol. Chem.
276, 11933-11938
12. Engin, K., Leeper, D. B., Cater, J. R., Thistlethwaite, A. J., Tupchong, L., and
McFarlane, J. D. (1995) Int. J. Hyperthermia 11, 211-216
13. Levine, E. A., Holzmayer, T. A., Roninson, I. B., and Das Gupta, T. K. (1993) J. Surg.
Res. 54, 621-624
14. Berger, W., Elbling, L., Minai-Pour, M., Vetterlein, M., Pirker, R., Kokoschka, E. M.,
and Micksche, M. (1994) Int. J. Cancer 59, 717-723
15. Schadendorf, D., Makki, A., Stahr, C., van Dyck, A., Wanner, R., Scheffer, G. L., Flens,
M. J., Scheper, R., and Henz, B. M. (1995) Am. J. Pathol. 147, 1545-1552.
16. Burd, R., Wachsberger, P. R., Biaglow, J. E., Wahl, M. L., Lee, I., and Leeper, D. B.
(2001) Cancer Res. 61, 5630-5635
by guest on March 17, 2018
http://ww
w.jbc.org/
Dow
nloaded from

17
17. Stubbs, M., McSheehy, P. M., Griffiths, J. R., and Bashford, C. L. (2000) Mol. Med.
Today 6, 15-19
18. Dang, C. V., Lewis, B. C., Dolde, C., Dang, G., and Shim, H. (1997) J. Bioenerg.
Biomembr. 29, 345-354
19. Warburg, O. (1956) Science 123, 309-314
20. Racker, E. (1983) Science 222, 232
21. Rinne, D., Baum, R. P., Hor, G., and Kaufmann, R. (1998) Cancer 82, 1664-1671
22. Altan, N., Chen, Y., Schindler, M., and Simon, S. M. (1998) J. Exp. Med. 187, 1583-1598
23. Schindler, M., Grabski, S., Hoff, E., and Simon, S. M. (1996) Biochem. 35, 2811-2817
24. Simon, S. M. (1999) Drug Discov. Today 4, 32-38
25. Martinez-Zaguilan, R., Lynch, R. M., Martinez, G. M., and Gillies, R. J. (1993) Am. J.
Physiol. 265, C1015-1029
26. Martinez-Zaguilan, R., Raghunand, N., Lynch, R. M., Bellamy, W., Martinez, G. M.,
Rojas, B., Smith, D., Dalton, W. S., and Gillies, R. J. (1999) Biochem. Pharmacol. 57, 1037-
1046
27. Yamagata, M., Hasuda, K., Stamato, T., and Tannock, I. F. (1998) Br J Cancer 77, 1726-
1731
28. Simon, S., Roy, D., and Schindler, M. (1994) Proc. Natl. Acad. Sci. USA 91, 1128-1132
29. Naish-Byfield, S., and Riley, P. A. (1998) Pigm. Cell. Res. 11, 127-133
30. Halaban, R., Cheng, E., Smicun, Y., and Germino, J. (2000) J. Exp. Med. 191, 1005-1015
31. Raposo, G., Tenza, D., Murphy, D. M., Berson, J. F., and Marks, M. S. (2001) J. Cell Biol.
152, 809-824
32. Chen, Y. T., Stockert, E., Tsang, S., Coplan, K. A., and Old, L. J. (1995) Proc. Natl. Acad.
Sci. USA 92, 8125-8129
33. Pomerantz, S. H. (1976) Anal. Biochem. 75, 86-90
34. Halaban, R., and Lerner, A. B. (1977) Exp. Cell Res. 108, 119-125
35. Halaban, R., Moellmann, G., Tamura, A., Kwon, B. S., Kuklinska, E., Pomerantz, S. H.,
and Lerner, A. B. (1988) Proc. Natl. Acad. Sci. USA 85, 7241-7245
36. Owen, C. S., Pooler, P. M., Wahl, M. L., Coss, R. A., and Leeper, D. B. (1997) J. Cell.
Physiol. 173, 397-405
37. Wahl, M. L., Pooler, P. M., Briand, P., Leeper, D. B., and Owen, C. S. (2000) J. Cell.
Physiol. 183, 373-380
38. Újvári, A., Aron, R., Eisenhaure, T., Cheng, E., Smicun, Y., Halaban, R., and Hebert, D.
N. (2001) J. Biol. Chem. 276, 5924-5931
by guest on March 17, 2018
http://ww
w.jbc.org/
Dow
nloaded from

18
39. Gillies, R. J., Martinez-Zaguilan, R., Martinez, G. M., Serrano, R., and Perona, R. (1990)
Proc. Natl. Acad. Sci. USA 87, 7414-7418
40. Martinez-Zaguilan, R., and Gillies, R. J. (1992) Ann. N Y Acad. Sci. 671, 478-480
41. Maxfield, F. R. (1982) J. Cell Biol. 95, 676-681
42. Dröse, S., and Altendorf, K. (1997) J. Exp. Biol. 200, 1-8
43. Fuller, B. B., Spaulding, D. T., and Smith, D. R. (2001) Exp. Cell Res. 262, 197-208
44. Ancans, J., Tobin, D. J., Hoogduijn, M. J., Smit, N. P., Wakamatsu, K., and Thody, A. J.
(2001) Exp. Cell Res. 268, 26-35
45. Mellman, I., Fuchs, R., and Helenius, A. (1986) Annu Rev Biochem 55, 663-700
46. Wu, M. M., Llopis, J., Adams, S., McCaffery, J. M., Kulomaa, M. S., Machen, T. E.,
Moore, H. P., and Tsien, R. Y. (2000) Chem. Biol. 7, 197-209
47. Tartakoff, A. M. (1983) Cell 32, 1026-1028
48. Tartakoff, A. M., and Vassalli, P. (1977) J. Exp. Med. 146, 1332-1345
49. Strous, G. J., and Lodish, H. F. (1980) Cell 22, 709-717
50. Forgac, M. (1999) J. Biol. Chem. 274, 12951-12954
51. Nelson, N., and Harvey, W. R. (1999) Physiol. Rev. 79, 361-385
52. Finbow, M. E., and Harrison, M. A. (1997) Biochem. J. 324, 697-712.
53. Stevens, T. H., and Forgac, M. (1997) Annu. Rev. Cell. Dev. Biol. 13, 779-808
54. Palokangas, H., Ying, M., Vaananen, K., and Saraste, J. (1998) Mol. Biol. Cell 9, 3561-
3578
55. Kim, J. H., Johannes, L., Goud, B., Antony, C., Lingwood, C. A., Daneman, R., and
Grinstein, S. (1998) Proc. Natl. Acad. Sci. USA 95, 2997-3002
56. Wu, M. M., Llopis, J., Adams, S. R., McCaffery, J. M., Teter, K., Kulomaa, M. S.,
Machen, T. E., Moore, H. P., and Tsien, R. Y. (2000) Methods Enzymol. 327, 546-564
57. Schmidt, W. K., and Moore, H. P. (1995) Mol. Biol. Cell 6, 1271-1285
58. Ellgaard, L., Molinari, M., and Helenius, A. (1999) Science 286, 1882-1888
59. Hammond, C., and Helenius, A. (1994) J. Cell. Biol. 126, 41-52
60. Raposo, G., Vansanten, H. M., Leijendekker, R., Geuze, H. J., and Ploegh, H. L. (1995)
J. Cell Biol. 131, 1403-1419
61. Yamamoto, K., Fujii, R., Toyofuku, Y., Saito, T., Koseki, H., Hsu, V. W., and Aoe, T.
(2001) EMBO J. 20, 3082-3091
62. Gardner, J. M., Nakatsu, Y., Gondo, Y., Lee, S., Lyon, M. F., King, R. A., and Brilliant,
M. H. (1992) Science 257, 1121-1124
by guest on March 17, 2018
http://ww
w.jbc.org/
Dow
nloaded from
19
63. Rinchik, E. M., Bultman, S. J., Horsthemke, B., Lee, S. T., Strunk, K. M., Spritz, R. A.,
Avidano, K. M., Jong, M. T., and Nicholls, R. D. (1993) Nature 361, 72-76
64. Lee, S. T., Nicholls, R. D., Bundey, S., Laxova, R., Musarella, M., and Spritz, R. A.
(1994) New Engl. J. Med. 330, 529-534
65. Oetting, W. S., Gardner, J. M., Fryer, J. P., Ching, A., Durham-Pierre, D., King, R. A.,
and Brilliant, M. H. (1998) Hum. Mutat. 12, 434
66. Rosemblat, S., Durham-Pierre, D., Gardner, J. M., Nakatsu, Y., Brilliant, M. H., and
Orlow, S. J. (1994) Proc. Natl. Acad. Sci. USA 91, 12071-12075
67. Brilliant, M. H., Gondo, Y., and Eicher, E. M. (1991) Science 252, 566-569
68. Puri, N., Gardner, J. M., and Brilliant, M. H. (2000) J. Invest. Dermatol. 115, 607-613
69. Orlow, S. J., and Brilliant, M. H. (1999) Exp. Eye Res. 68, 147-154
70. Potterf, S. B., Furumura, M., Sviderskaya, E. V., Santis, C., Bennett, D. C., and
Hearing, V. J. (1998) Exp. Cell Res. 244, 319-326
71. Ancans, J., Hoogduijn, M. J., and Thody, A. J. (2001) J. Invest. Dermatol. 117, 158-159
72. Brilliant, M. H. (2001) Pigm. Cell. Res. 14, 86-93
73. Raper, H. S. (1928) Physiol. Rev. 8, 245-282
74. Riley, P. A. (1998) in The Pigmentary System. Physiology and Pathophysiology (Nordlund,
J. J., Boissy, R., Hearing, V. J., King, R. A., and Ortonne, J-P., ed), 1st Ed., pp. 401-421,
Oxford University Press, New York., New York
75. Cooksey, C. J., Garratt, P. J., Land, E. J., Pavel, S., Ramsden, C. A., Riley, P. A., and
Smit, N. P. (1997) J. Biol. Chem. 272, 26226-26235
76. Vijayasaradhi, S., Xu, Y. Q., Bouchard, B., and Houghton, A. N. (1995) J. Cell Biol. 130,
807-820
by guest on March 17, 2018
http://ww
w.jbc.org/
Dow
nloaded from

20
Legends to the Figures
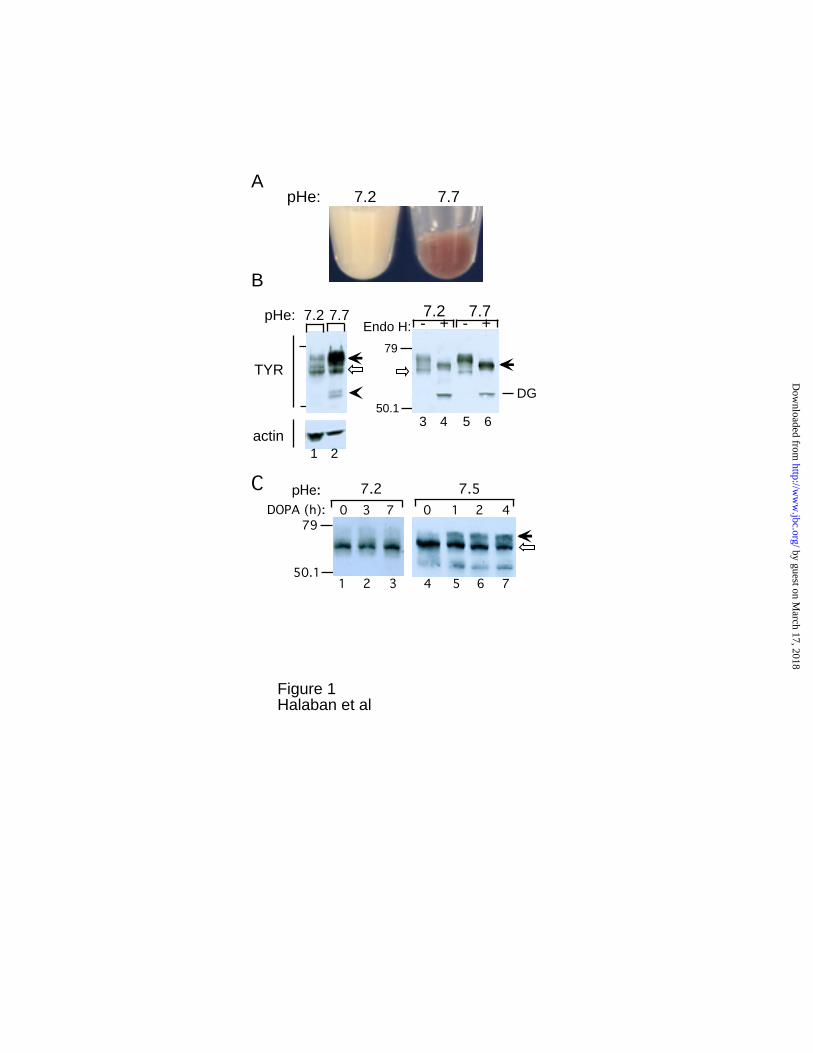
Fig. 1. Extracellular pH dependent pigmentation, stabilization and Golgi processing of
tyrosinase. Melanoma cells (YUGEN8) were grown in Ham’s F-10 medium (pHe ~7.2), or
in medium adjusted to pH 7.7 for 2 weeks. A, Pellets of amelanotic and melanotic cells
grown in the indicated pHe. B, Lanes 1 and 2 represent anti-tyrosinase Western blot
analysis of whole cell lysates prepared from the cell pellets presented in A. Solid and
empty arrows and spearhead mark mature and immature tyrosinase, and proteolytic
degradation products, respectively. Protein loading in each well was normalized by
subsequent immunoblotting the same membrane with anti-actin antibodies (actin). Lanes
3-6 represent anti-tyrosinase Western blot of proteins bound to WGA beads undigested (-
) or digested (+) with Endo H. Arrow indicates mature partially Endo H resistant
tyrosinase, and DG the deglycosylated form of the immature glycoform (empty arrow).
C, Low pHe suppressed DOPA induced Golgi maturation. Western blot analysis of cell
extracts derived from melanoma cells (YUGEN8) incubated in OptiMEM medium
containing 200 µM tyrosine with 50 µM DOPA at pHe 7.2 (lanes 1-3) or pHe 7.5 (lanes 4-
7). Solid and empty arrows indicate the mature and immature tyrosinase forms as above.
Numbers on the left-hand side of Western blot images here and in all other figures
indicate molecular weight markers in kDa.
Fig. 2. Restoration of pigmentation, increased tyrosinase activity and Golgi maturation
by glucose restriction. Melanoma cells were incubated in glucose-free medium (DMEM)
with 7% FBS plus 1 mM pyruvate supplemented with 25 mM glucose (+), or with 2 mM
galactose (-). A, Melanoma cell pellets (YUGEN8 and YUSIT1) after 3 days incubation in
the experimental medium. B, Time course analysis of tyrosinase in response to glucose
deprivation. YUGEN8 melanoma cells were grown in galactose-supplemented DMEM
glucose-free medium for increasing periods of time. Cell extracts were subjected to
Western blot analysis first with anti-tyrosinase T311 mAb (TYR), and then with anti-actin
antibodies (actin). C, DOPA- stimulated tyrosinase activity in cell extracts of YUGEN8
melanoma cells grown in the presence or absence of glucose as shown in A. D,
Maturation of tyrosinase in glucose-free medium supplemented with different
concentrations of tyrosine. Western blots with T311 anti-tyrosinase mAb of whole cell
lysates derived from YUGEN8, YUSIT1 and 501 mel melanoma cells grown for 3 days in
glucose-free or glucose-supplemented medium with 10 µM or 100 µM tyrosine.
by guest on March 17, 2018
http://ww
w.jbc.org/
Dow
nloaded from

21
Fig. 3. Amelanotic melanoma cells maintain high pHi values after acidification.
Intracellular pH (pHi) of normal human melanocytes (empty squares), amelanotic
melanoma cells (YUGEN8 and 501 mel, dashed lines solid and empty circles,
respectively), melanotic melanoma cells Heik178 and MNT-1 (solid squares and empty
triangles, respectively), was measured after exposure to pH 7.0. Measurements were
done in growth medium at pH 7.3, 10 min before pH changes (-10 data point) and up to
60 min after a shift to pHe 7.0 (acidification). Reduction in pH during initial recording
before time 0 is sometimes seen when the lost CO2 during transfer to the microscope was
not completely re-equilibrated. A shift to pH 7.3 did not cause a change in intracellular
pH in any of the cell lines. At least five consecutive measurements were taken on each of
three fields. Data are means of triplicate measurements in a representative experiment
out of three, and error bars indicate the standard deviations.
Fig. 4. Inhibitors of V-ATPase enhance tyrosinase maturation. A, Western blot analyses
for tyrosinase (TYR) normalized to (actin), using whole cell lysates derived from normal
melanocytes (NM) and melanoma cells (YUGEN8, 501 mel and YUSIT1), or WGA-bound
glycoproteins from YUSAC2 melanoma cells. The various cell types were incubated for 4
h before harvest in medium supplemented with the diluent DMSO (1 µl/ml), monensin
(Mon, 10 µM), concanamycin A (CCM) or bafilomycin A1 (Baf) at 100 nM each. Ham’s F-
10 medium supplemented with low (10 µM, lanes 1-4), or high tyrosine (100 µM, lanes 5-
20) was used. Solid and empty arrows indicate mature and immature unprocessed
tyrosinase proteins, respectively. B, High concentration of tyrosine in the medium
enhanced the concanamycin A induced tyrosinase maturation in melanoma cells. Cells
(YUGEN8) were harvested after 4 h incubation in Ham’s F-10 medium with low (10 µM
tyrosine) or high (100 µM) tyrosine in the absence and presence of concanamycin A
(100 nM). C, Dose response of melanoma cells (YUGEN8) to concanamycin A (CCM) and
bafilomycin A1 (Baf), supplemented to Ham’s F-10 (10 µM tyrosine). Cells were
harvested after incubation in the experimental media for 4 h. D, Kinetics of tyrosinase
maturation in melanoma cells. Melanoma cells (YUGEN8) were incubated in unmodified
Ham’s F-10 medium (10 µM tyrosine) supplemented with concanamycin A (CCM, 20
nM) or bafilomycin A1 (Baf, 50 nM) for increasing duration.
Fig. 5. Golgi modification of tyrosinase in response to V-ATPase and protease
inhibitors. A, Steady-state tyrosinase as revealed by anti-tyrosinase Western blotting.
Cells were treated with DMSO (1 µl/ml), monensin (Mon, 20 µM), concanamycin A
by guest on March 17, 2018
http://ww
w.jbc.org/
Dow
nloaded from
22
(CCM, 20 nM), bafilomycin A1 (Baf, 50 nM), or leupeptin and pepstatin (Leu/Pep,
10 µg/ml and 25 µg/ml each, respectively) for 3 h. Tyrosinase was precipitated from
melanoma cell extracts (YUGEN8 and 501 mel) with WGA bound beads. Endo H
digested (lanes 1-8), or not digested (lanes 9-12) proteins were subjected to SDS-PAGE
and Western blotting. Alternatively, immunoprecipitated tyrosinase (C-19 antibodies)
was subjected to treatment with or without Endo H (lanes 13-20). Solid and empty
arrows indicate mature and immature tyrosinase, respectively. Band marked DG is the
deglycosylated tyrosinase polypeptide. Note that the X-ray film representing lanes 17-20
was overexposed to rule out the presence of any minor bands. B, Autoradiogram of
metabolically radiolabeled tyrosinase immunoprecipitated from melanoma cells
(YUGEN8) incubated in Ham’s F-10 medium containing 100 µM tyrosine with inhibitors
as above. Cells were metabolically labeled with [35S]Met/Cys for 15 min and harvested
immediately (0 h), or after a 3 h chase in non-radioactive medium (3 h). The indicated
agents were present during the 2 h starvation in cys/met free medium.
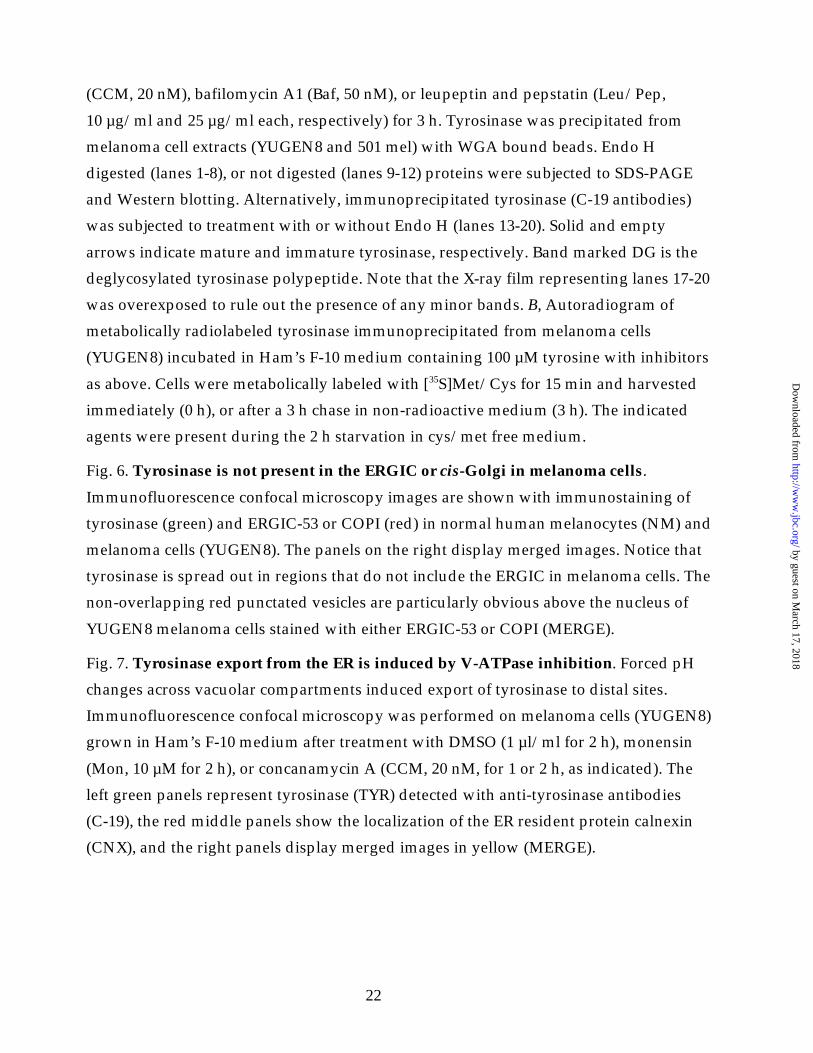
Fig. 6. Tyrosinase is not present in the ERGIC or cis-Golgi in melanoma cells.
Immunofluorescence confocal microscopy images are shown with immunostaining of
tyrosinase (green) and ERGIC-53 or COPI (red) in normal human melanocytes (NM) and
melanoma cells (YUGEN8). The panels on the right display merged images. Notice that
tyrosinase is spread out in regions that do not include the ERGIC in melanoma cells. The
non-overlapping red punctated vesicles are particularly obvious above the nucleus of
YUGEN8 melanoma cells stained with either ERGIC-53 or COPI (MERGE).
Fig. 7. Tyrosinase export from the ER is induced by V-ATPase inhibition. Forced pH
changes across vacuolar compartments induced export of tyrosinase to distal sites.
Immunofluorescence confocal microscopy was performed on melanoma cells (YUGEN8)
grown in Ham’s F-10 medium after treatment with DMSO (1 µl/ml for 2 h), monensin
(Mon, 10 µM for 2 h), or concanamycin A (CCM, 20 nM, for 1 or 2 h, as indicated). The
left green panels represent tyrosinase (TYR) detected with anti-tyrosinase antibodies
(C-19), the red middle panels show the localization of the ER resident protein calnexin
(CNX), and the right panels display merged images in yellow (MERGE).
by guest on March 17, 2018
http://ww
w.jbc.org/
Dow
nloaded from
7.2 7.7
7.2
actin3 4
Figure 1Halaban et al
pHe:
Endo H: - + - +
5 6
pHe:
A
B
7.7 7.2 7.7
79
50.1
C0 1 2 4
7.5
1 2 3 4
0 3 7
7.2
5 6 7
DOPA (h):79
50.1
pHe:
TYR
1 2
DG
by guest on March 17, 2018
http://ww
w.jbc.org/
Dow
nloaded from
CB
Galactose (h): 0 5 20 28
82
Glucose: + -- -
TYR
actin
YUGEN8
YUGEN8 YUSIT1
Glucose:
A
+ - + -
Figure 2Halaban et al
Glucose: + -
100
200
300
10 100
501 mel
-+ -+Tyrosine (µM):
YUSIT1
10 100
-+ -+
YUGEN8
10 100Glucose:
113
82
52.4
Melanoma:
1 2 3 4 5 76 8 9 10 11 12
-+ -+
D
Galactose: +- +-
by guest on March 17, 2018
http://ww
w.jbc.org/
Dow
nloaded from
6.5
6.7
6.9
7.1
7.3
Figure 3Halaban et al
Time (min)
pHi
-10 0 15 30 6045
by guest on March 17, 2018
http://ww
w.jbc.org/
Dow
nloaded from

YUGEN8 501 mel
Inhibitor:
NM
1 2 3 4 5 6 7 8 9 10 11 12
A
B
Figure 4Halaban et al
0 100
10 100
1 2 3 4
CCM (nM): 0 100Tyrosine (µM):
TYR
actin
C
YUSAC2
15 1613 14
Inhibitor: CCM Baf
0 5 10 20 50 5 10 20 50
TYR
actin
nM:
1 2 3 4 5 6 7 8 9
D
0.5 10 2 3 4
CCM (20 nM)Time (h):
10 11 121 2 3 4 5 6 7 8 9
0.5 10 2 3 4
Baf (50 nM)
YUSIT1
19 2017 18
TYR
actin
TYR
actin
Cells:
DM
SO
Mon
CC
M
Baf
DM
SO
Mon
CC
M
Baf
DM
SO
Mon
CC
M
Baf
DM
SO
Mon
CC
M
Baf
DM
SO
Mon
CC
M
Baf
by guest on March 17, 2018
http://ww
w.jbc.org/
Dow
nloaded from
81
49.91 2 3 4 5 6 7 8
YUGEN8 501 mel
DM
SO
Mon
CCM
BafInhibitor:
Inhibitor: DMSO Mon CCMChase (h): 0 3 0 3 0 3
Endo H: - + - + - + - + - + - + - + - +
1 2 3 4 5 6 7 8 9 10 1112
Figure 5Halaban et al
A
B
9 10 11 12
62
83
Cells:
Baf0 3
- + - +0 3
Leu/Pep
DMSO Leu/Pep
Endo H: - -
YUGEN8 501 melYUGEN8D
MSO
Mon
CCM
Baf DM
SO
Mon
CCM
both
13 14 1615
13 14 1615 17 18 2019
DMSO Leu/Pep
- + - +
17 18 2019
+ +
DG
DG
DG
by guest on March 17, 2018
http://ww
w.jbc.org/
Dow
nloaded from
NM
YUGEN8
MERGEERGIC-53TYR
Figure 6Halaban et al
NM
YUGEN8
TYR COPI MERGE
A
B
by guest on March 17, 2018
http://ww
w.jbc.org/
Dow
nloaded from
MergeCNXTYR
DMSO
Mon
CCM
CCM
by guest on March 17, 2018
http://ww
w.jbc.org/
Dow
nloaded from
L. Wahl, Stephen Ariyan and Daniel N. HebertRuth Halaban, Robin S. Patton, Elaine Cheng, Sherri Svedine, E. Sergio Trombetta, Miriam
secretory pathwayAbnormal acidification of melanoma cells induces tyrosinase retention in the early
published online January 25, 2002J. Biol. Chem.
10.1074/jbc.M111497200Access the most updated version of this article at doi:
Alerts:
When a correction for this article is posted•
When this article is cited•
to choose from all of JBC's e-mail alertsClick here
by guest on March 17, 2018
http://ww
w.jbc.org/
Dow
nloaded from