Embed Size (px)
Citation preview

1
Agricultural Policy Outlook
Speaker: Fang YanRural Economy Division, NDRC
November 13, 2013

2
Challenges Facing China’s Agriculture Sector
Growing import despite growth in grain
production for consecutive nine years
Agricultural subsidies substantially increase with
descending policy effects
Sustainable development restricted by resources
and environment
Protection of enthusiasm for production in main
producing areas

3
Food supply & demand has changed from
“basically balanced with surplus” to “tight
overall supply with emerging structural
contradictions”
Three key food products turned from net
export to net import since 2009
Structural Changes in Food Supply & Demand

4
2799
7748
501
-831
13021990
5806
-2000
0
2000
4000
6000
8000
10000
10kt
粮食 谷物 大豆
0
200
400
600
800
1000
522
835
189
512
112
370
食用植物油 棉花 食糖
10kt
Agricultural Commodities: Net Import since 2001
Trade deficit of agricultural commodities grew 10.4 times from 2004 to 2012 to reach USD49.1 billion
Food Grain SoybeanEdible vegetable oil
Cotton Sugar

5
963.6
720
532
194.589.4
0
200
400
600
800
1000
小麦 玉米 大米 食糖 棉花
万吨大宗农产品进口关税配额与实际进口量
关税配额 2010年进口量 2012年进口量
38%72.3%
44.5%
190%
5.8倍
Note: Import tariff quotas represent the level of commitment in 2004. Actual imports of cotton and sugar went beyond import tariff quotas in 2012 because importers leveraged the price difference between domestic and overseas markets.
Agricultural Commodities: Import Tariff Quotas vs. Actual Imports
10kt
Wheat Corn Rice Sugar Cotton
Import Tariff Quota
Import 2010 Import 2012
5.8 times

6
Agricultural Commodities: Global Production & Trade Volume
0
1
2
3
4
5
6
7
8
9
小麦 玉米 大米 大豆 棉花 食糖
亿吨
世界产量 世界贸易量
0
2000
4000
6000
8000
10000
12000
14000
16000
小麦 玉米 大米 大豆 棉花 食糖
万吨
世界贸易量 中国进口量
Note: Global production, China production and China import are average values of the last three years.
59%
90844%
21%12%
8%36%
34%33%
6.68
8.57
4.62
2.57
14300
9900
3717
9334
1.72
5595
100mmt 10kt
Wheat Corn Rice Soybean Cotton Sugar Wheat Corn Rice Soybean Cotton Sugar
Global Production
Global Trade Volume
Global Trade Volume
China’s Import

7
Food Supply & Demand in International Market
• Share of grains per capita varies in different continents: food shortage mainly caused by poverty.
Share of Grains per Capita In kg
World N. America Oceania Europe Asia Africa
337 1400 1020 640 290 160
1995/1996 2012/13 Increase
Food Production 173mmt 2280mmt 550mmt
Trade Volume 210mmt 290mmt 80mmt
Inventory-to-sales Ratio
17% 22% 5%
2013/14 estimate: 22.3%, record high since 2001/02. Source: FAO

8
China’s Investment in Agriculture
Financial support from central governmentInvestment in agricultural infrastructure
Total Green box
Yellow box
1998 - 2012 1996 - 2010
Est.

9
Central government spent more than 530 billion Yuan on food
in 2012, i.e. 320 Yuan/mu (divided by sown area) or 0.9
Yuan/kg (divided by food production).
The “four subsidies” totaled 166.8 billion Yuan,
food subsidy plus comprehensive agricultural subsidy: 76
Yuan/mu Per mu cost of food production increased by 110% when
compared to 2003, average annual growth 9.7%. Per mu
revenue from food production only equals to a migrant
worker’s salary per eight days.
Descending Policy Effects

10
In Yuan/50kgPrice of Agricultural Commodities since 2004
Moderate advances in price now “capped”
Min. Purchase or Temporary Storage Price Domestic Purchase Price
Early indica rice
Late indica rice
Japonica rice
Wheat
Corn
Soybean
Cotton
Rapeseed
Temporary Storage
Percentage Change 2012 over 2004 (%)
Percentage Change 2012 over 2004 (%)

11
Profit rate of cost (PRC) varies substantially
among different crops and years
PRC of japonica rice grew from 40% in 2009 to 59%
Wheat drop from 27% to 17%;
Rapeseed dropped from 10% to 2%;
Soybean maintained at 30% or so;
Cotton volatized between 13% and 74%

12
YearTotal Cost
Net
ProfitCash
Earnings Materials and services
Labor LandSeeds Fertili-
zersPesti-cides
Machi-nery
Yuan Yuan Yuan Yuan Yuan Yuan Yuan Yuan Yuan Yuan
2003 377 187 19 58 9 24 138 53 34 211.5
2004 395 200 21 71 12 32 141 54 197 373.9
2005 425 212 25 84 14 38 151 62 123 318.8
2006 445 225 26 87 16 47 152 68 155 356.7
2007 481 240 28 91 18 54 160 82 185 404.6
2008 562 288 31 118 21 69 175 100 186 434.3
2009 600 297 34 118 21 73 188 115 192 466.7
2010 673 312 40 111 22 85 227 133 227 551.4
2011 791 358 46 128 23 99 283 150 251 642.2
Growth 2011 over 2003
(%)110 92 144 121 154 309 106 184 633 204
Food Production Cost

13
It is becoming more and more difficult to defend the
redline of 1.8 billion mu arable land
Space left for increasing food acreage is smaller
than ever
Potential to increase effectively irrigated area
remains low
Two pressing issues: non-point source agricultural
pollution and degrading quality of arable land
Sustainable Development Restricted by Resources and Environment

14
Two pressing issues: non-point source agricultural
pollution and degrading quality of arable land
China consumes 57 million tons of pure chemical fertilizer every year, or 480kg per hectare, which is 4.1 times of the world’s average consumption.
Pesticide consumption is also above the world’s average level.
Soil erosion seen on 360 million mu of arable land; soil thickness in Northeast China reduced by 70%.
Sustainable Development Restricted by Resources and Environment
15
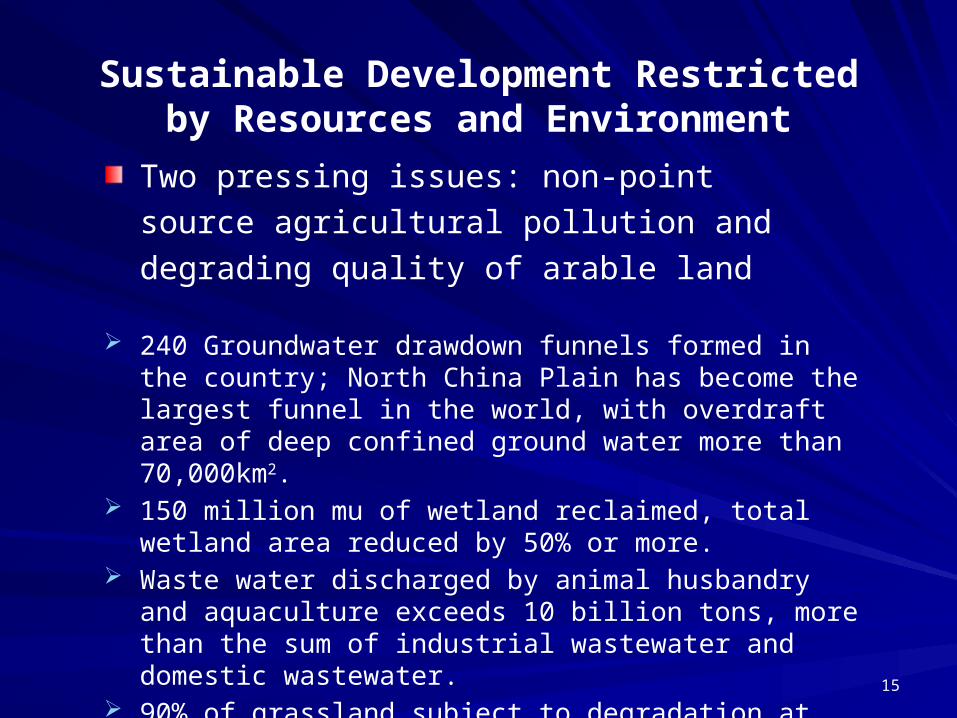
Two pressing issues: non-point source agricultural
pollution and degrading quality of arable land
240 Groundwater drawdown funnels formed in the country; North China Plain has become the largest funnel in the world, with overdraft area of deep confined ground water more than 70,000km2.
150 million mu of wetland reclaimed, total wetland area reduced by 50% or more.
Waste water discharged by animal husbandry and aquaculture exceeds 10 billion tons, more than the sum of industrial wastewater and domestic wastewater.
90% of grassland subject to degradation at varying degrees, including 2.3 billion mu of moderately and heavily degraded grassland; wetland area reduced by 50% or more.
Sustainable Development Restricted by Resources and Environment

16
How to protect the interests of main grain producing areas?
Distribution of Core, Non-core and Backup Grain Producing Areas
Core grain producing areas: 37.1 billion kg
Non-core grain producing areas: 2.25 billion kg
Legend
Core grain producing areas
Non-core grain producing areas
Backup areas

17
How to protect the interests of main grain producing areas?
全国平均 粮食主产省0
500
1000
1500
2000
2500
3000
3500
4000
4500
3920
3253
Revenue per Capita 2011元
财政收入 财政支出0
1000
2000
3000
4000
5000
6000
7000
8000
4000
6900
1200
3040
Revenue & Expenditure per Capita at County Level
全国平均 产粮大县National Average
Main Grain Producing Provinces National
AverageKey Grain Producing Counties
Revenue Expenditure

Agro Products Consumption Forecast
2015
Urbanization rate: 51.5%
(52.6% in 2012)
Per capita disposable income
of urban residents: 26810
Yuan
Per capita net income of rural
residents: 8310 Yuan
- The 12th Five-year Plan
2020
Urbanization rate: 60%
Per capita disposable income
of urban residents: more than
38000 Yuan
Per capita net income of rural
residents: more than 10000
Yuan (equivalent to per capita
income of urban residents in
2006)
18

Food Intake per Capita by 2020
Grain: 135kg Edible vegetable oil:
12kg
Beans: 13kg Meat: 29kg
Egg: 16kg Milk: 36kg
Vegetables: 140kg Fruits: 60kg
Aquatic products: 18kg
Factors boosting agro products
consumption: growing population,
accelerated urbanization and optimized
consumption structure
19

20
Agricultural Policies
Food safety: a basic national policy that
should always be adhered to
Market-oriented price regulation
Sustainable development of agriculture

Food safety as a basic national policy must be adhered to by “retaining essence and removing
dregs”
Priority given to staple food
Cultivation of comprehensive
production capacity
Interest compensation mechanism for producing and
marketing areas
Utilization of resources from
international market
Food safety: a basic national policy that should always be adhered to

Market-oriented price regulation
To break through the “ceiling” that caps prices of agricultural products

23
Sustainable development of agriculture
Sustainable development of forests, grasslands and seas to relieve the pressure on domestic resources;
Solution to outstanding environmental issues
Adjustment of planting structure, crop rotation, ecological restoration

24
To facilitate advancement of agricultural
technologies:
Improved varieties; new cultivation
techniques; water-saving technologies;
recycle of straws; utilization of biogas;
promotion of pesticides with low
toxicity/pesticide residues and slow-release
fertilizers with high efficiency; farm machinery
and equipment
Sustainable development of agriculture

To provide subsidies to governance projects and affected farmers by utilizing available funding sources
Sustainable development of agriculture

26
Thank You!


![Biosensors and Bioelectronics Volume 51 Issue 2014 [Doi 10.1016%2Fj.bios.2013.07.066] Liu, Fang; Zhang, Yan; Yu, Jinghua; Wang, Shaowei; Ge, Shenguang -- Application of ZnOgraphene](https://img.pdfslide.net/doc/110x75/577cc78e1a28aba711a14d47/biosensors-and-bioelectronics-volume-51-issue-2014-doi-1010162fjbios201307066.jpg)


![Amazon S3€¦ · Web viewSynthesis and Biological Activity of Novel Sulfone Derivatives Containing a [1,2,4]Triazolo[4,3-a]pyridine Moiety Fang-Zhou Xu 1, Yan-Yan Wang1, #, Yun-Ying](https://img.pdfslide.net/doc/110x75/5f851fbdbdb2f3186a342493/amazon-s3-web-view-synthesis-and-biological-activity-of-novel-sulfone-derivatives.jpg)