Embed Size (px)
Citation preview
39
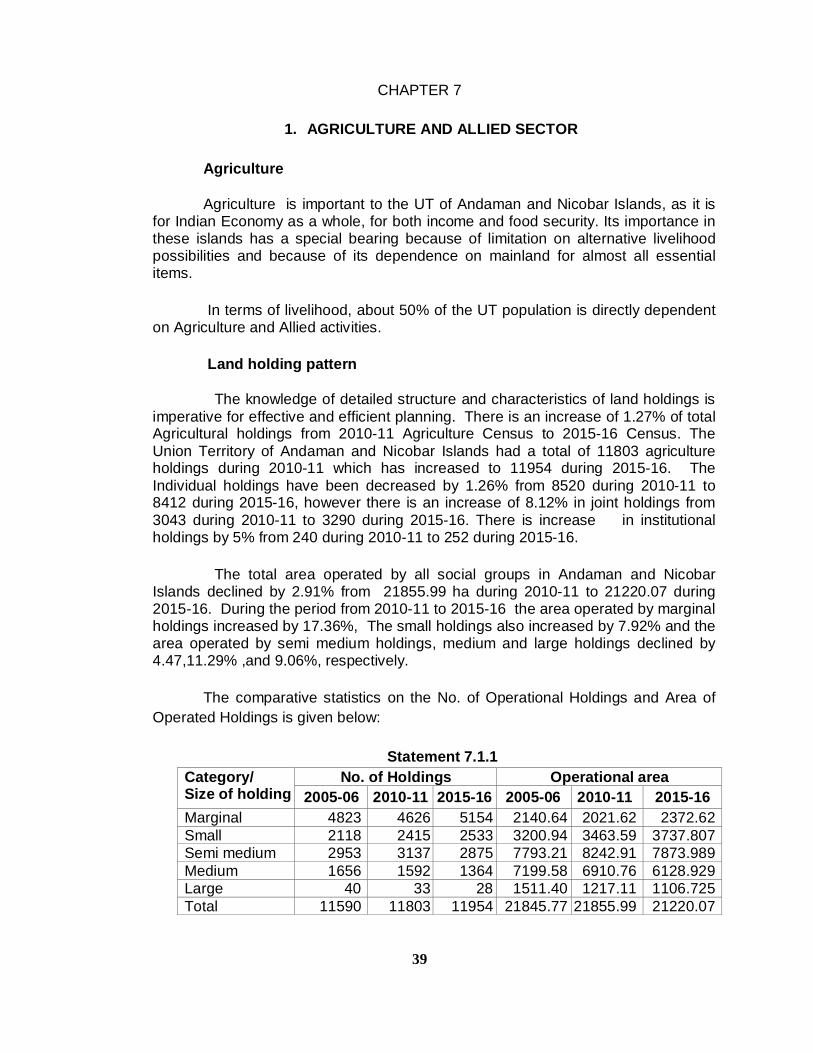
CHAPTER 7
1. AGRICULTURE AND ALLIED SECTOR
Agriculture Agriculture is important to the UT of Andaman and Nicobar Islands, as it is
for Indian Economy as a whole, for both income and food security. Its importance in these islands has a special bearing because of limitation on alternative livelihood possibilities and because of its dependence on mainland for almost all essential items.
In terms of livelihood, about 50% of the UT population is directly dependent
on Agriculture and Allied activities. Land holding pattern The knowledge of detailed structure and characteristics of land holdings is
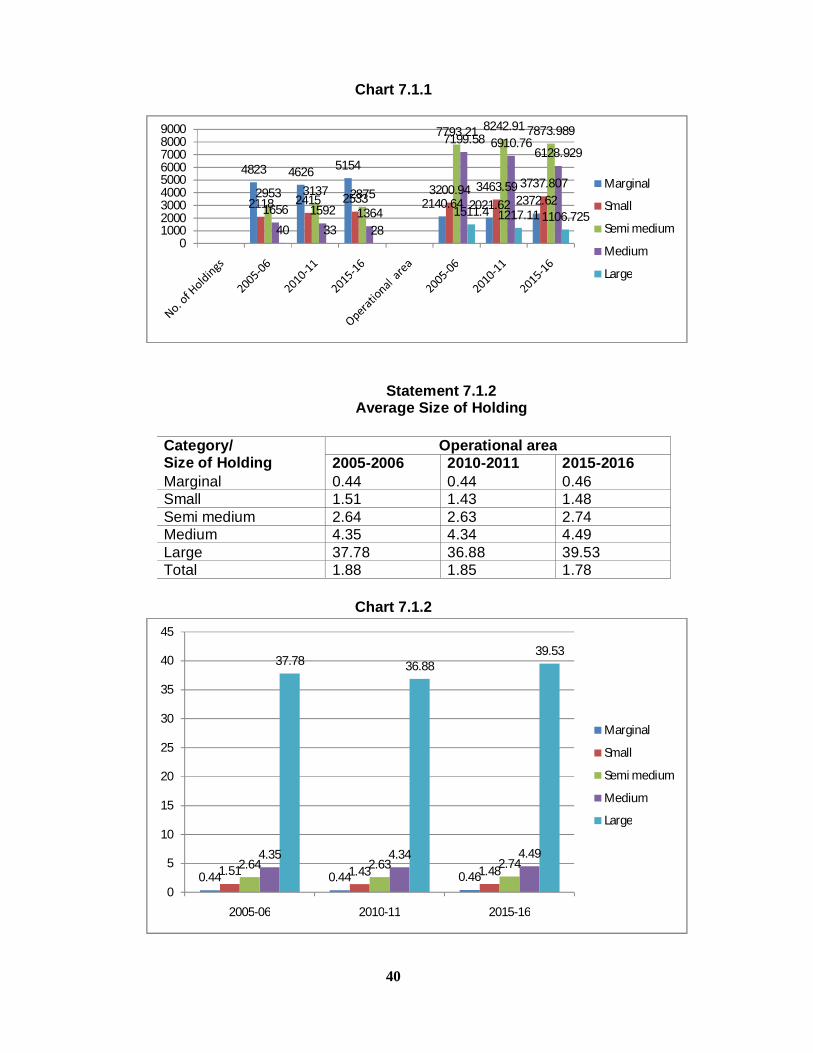
imperative for effective and efficient planning. There is an increase of 1.27% of total Agricultural holdings from 2010-11 Agriculture Census to 2015-16 Census. The Union Territory of Andaman and Nicobar Islands had a total of 11803 agriculture holdings during 2010-11 which has increased to 11954 during 2015-16. The Individual holdings have been decreased by 1.26% from 8520 during 2010-11 to 8412 during 2015-16, however there is an increase of 8.12% in joint holdings from 3043 during 2010-11 to 3290 during 2015-16. There is increase in institutional holdings by 5% from 240 during 2010-11 to 252 during 2015-16.
The total area operated by all social groups in Andaman and Nicobar
Islands declined by 2.91% from 21855.99 ha during 2010-11 to 21220.07 during 2015-16. During the period from 2010-11 to 2015-16 the area operated by marginal holdings increased by 17.36%, The small holdings also increased by 7.92% and the area operated by semi medium holdings, medium and large holdings declined by 4.47,11.29% ,and 9.06%, respectively.
The comparative statistics on the No. of Operational Holdings and Area of
Operated Holdings is given below:
Statement 7.1.1 Category/ Size of holding
No. of Holdings Operational area 2005-06 2010-11 2015-16 2005-06 2010-11 2015-16
Marginal 4823 4626 5154 2140.64 2021.62 2372.62 Small 2118 2415 2533 3200.94 3463.59 3737.807 Semi medium 2953 3137 2875 7793.21 8242.91 7873.989 Medium 1656 1592 1364 7199.58 6910.76 6128.929 Large 40 33 28 1511.40 1217.11 1106.725 Total 11590 11803 11954 21845.77 21855.99 21220.07
40
Chart 7.1.1
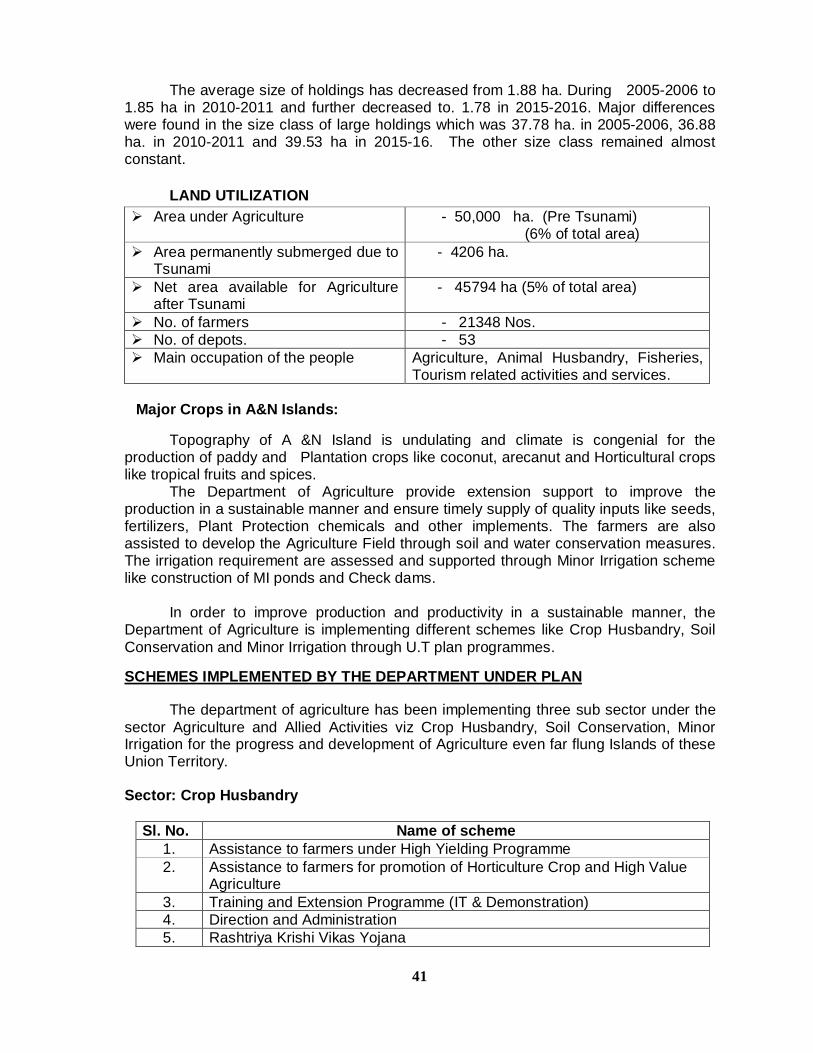
Statement 7.1.2 Average Size of Holding
Category/ Size of Holding
Operational area 2005-2006 2010-2011 2015-2016
Marginal 0.44 0.44 0.46 Small 1.51 1.43 1.48 Semi medium 2.64 2.63 2.74 Medium 4.35 4.34 4.49 Large 37.78 36.88 39.53 Total 1.88 1.85 1.78
Chart 7.1.2
4823 4626 5154
2140.64 2021.62 2372.622118 2415 25333200.94 3463.59 3737.807
2953 3137 2875
7793.21 8242.91 7873.989
1656 1592 1364
7199.58 6910.766128.929
40 33 281511.4 1217.11 1106.725
0100020003000400050006000700080009000
Marginal
Small
Semi medium
Medium
Large
0.44 0.44 0.461.51 1.43 1.482.64 2.63 2.744.35 4.34 4.49
37.78 36.8839.53
0
5
10
15
20
25
30
35
40
45
2005-06 2010-11 2015-16
Marginal
Small
Semi medium
Medium
Large
41
The average size of holdings has decreased from 1.88 ha. During 2005-2006 to
1.85 ha in 2010-2011 and further decreased to. 1.78 in 2015-2016. Major differences were found in the size class of large holdings which was 37.78 ha. in 2005-2006, 36.88 ha. in 2010-2011 and 39.53 ha in 2015-16. The other size class remained almost constant.
LAND UTILIZATION
Area under Agriculture - 50,000 ha. (Pre Tsunami) (6% of total area)
Area permanently submerged due to Tsunami
- 4206 ha.
Net area available for Agriculture after Tsunami
- 45794 ha (5% of total area)
No. of farmers - 21348 Nos. No. of depots. - 53 Main occupation of the people Agriculture, Animal Husbandry, Fisheries,
Tourism related activities and services.
Major Crops in A&N Islands:
Topography of A &N Island is undulating and climate is congenial for the production of paddy and Plantation crops like coconut, arecanut and Horticultural crops like tropical fruits and spices.
The Department of Agriculture provide extension support to improve the production in a sustainable manner and ensure timely supply of quality inputs like seeds, fertilizers, Plant Protection chemicals and other implements. The farmers are also assisted to develop the Agriculture Field through soil and water conservation measures. The irrigation requirement are assessed and supported through Minor Irrigation scheme like construction of MI ponds and Check dams.
In order to improve production and productivity in a sustainable manner, the Department of Agriculture is implementing different schemes like Crop Husbandry, Soil Conservation and Minor Irrigation through U.T plan programmes.
SCHEMES IMPLEMENTED BY THE DEPARTMENT UNDER PLAN
The department of agriculture has been implementing three sub sector under the sector Agriculture and Allied Activities viz Crop Husbandry, Soil Conservation, Minor Irrigation for the progress and development of Agriculture even far flung Islands of these Union Territory. Sector: Crop Husbandry
Sl. No. Name of scheme 1. Assistance to farmers under High Yielding Programme 2. Assistance to farmers for promotion of Horticulture Crop and High Value
Agriculture 3. Training and Extension Programme (IT & Demonstration) 4. Direction and Administration 5. Rashtriya Krishi Vikas Yojana
42
The major activities undertaken through above schemes:-
Measures like crop improvement, crop intensity, scientific practices etc have been
adopted to achieve the target of the production of 27500 MT paddy, 45000 MT vegetable, 130 Million nuts coconut, 75 MT Spices, 1200 MT Pulses.
Marketing System are regularized by establishing Kisan Mandi/Farmers market at Goalghar.
Farmers are encouraged to adopt organic farming. Productivity of coconut are improved by adopting scientific technologies.
Govt. of India has launched a new Crop Insurance Scheme namely ‘Pradhan Mantri Fasal Bima Yojana (PMFBY)’ which is being implemented in this UT from Kharif,2016. The scheme envisages to provide insurance coverage to the farmers for crop loss arising out of calamities.
Trainings/demonstrations, Kisan mela, exhibition etc. are conducted to train farmers/staff to under take modern farm implements/ machineries.
Static and dynamic information about latest technologies are provided to the farmers by adopting Information Technology are imparted to farmers by Knowledge Centres.
Programmes have been introduced to adopt commercial cultivation of horticulture crops in mission mode manner and with aim to increase area, production and productivity of fruits and vegetable.
Implementation of Organic Vegetable Mission at Neil Island with a view to popularize vegetable cultivation and to increase area, production and productivity of vegetable there.
II. Sub-Sector: Soil Conservation Conservation of Soil, Systematic Soil Survey Work, Soil analysis for determination of soil fertility, issue of Soil Health Cards to farmers, Saline Reclamation works etc. are the main objective of this sub-sector.
Sch.No. Name of Scheme 1. Soil Conservation works and strengthening of Soil Testing Laboratory 2. Improvement of degraded Land and Drainage
The major activities undertaken through above schemes Farmers of these Islands are encouraged to develop hilly land, which are lying as
waste land/uncultivated land by providing terracing of contour bunds, con tour trenches of continues or staggered drains for safe disposal of excess water from the plot.
Village wise Soil Nutrient Mapping are conducted to co-relate the characteristics of soil.
Soil Testing Lab are strengthened to adopt micro nutrient analysis of soil. Protective barriers/spurs/gabions etc are constructed to avoid stream bank
erosion. The farmers are provided with Soil Kits to analyze the soil nutrient, fertility etc. by
themselves.
43
III. Sub-Sector: Minor Irrigation
Minor Irrigation programmes being implemented by this department to provide irrigation to crop like pulses, oilseeds, vegetable etc during dry spell and paddy in the dry days of rainy season through construction of ponds, check dams etc.
AVERAGE MONTHLY RAINFALL (mm) RECORDED IN A & N ISLANDS FOR THE LAST FIVE YEARS
Statement 7.1.3 Month 2012 2013 2014 2015 2016 2017 January 146.90 98.23 73.33 129.58 103.65 279.02 February 47.07 53.30 11.17 9.78 32.07 9.05 March 41.87 49.38 0.00 4.80 4.90 33.28 April 64.4 44.92 17.83 142.72 3.37 101.42 May 531.58 478.08 251.68 309.25 186.18 276.05 June 407.55 757.57 383.63 350.57 414.53 320.85 July 318.32 536.05 440.23 307.25 275.50 364.61 August 342.82 326.57 307.05 421.88 237.15 386.00 September 812.18 454.17 400.12 505.73 583.77 354.85 October 197.3 430.82 382.70 259.87 288.42 247.80 November 320.6 334.05 212.67 252.73 176.00 223.35 December 197.88 109.20 117.35 142.97 527.65 270.32 Total 3428.47 3672.34 2597.76 2837.13 2833.19 2866.60
Centrally Sponsored Schemes implemented by the department
1. High Value Agriculture Programme 2. Centrally Sponsored Scheme to State Extension Programmes for Extension
Reforms-ATMA I. High Value Agriculture Programme
The High Value Agriculture Programme (HVA) is tailored for these islands to boost the productivity of various Horticultural crops. For implementation of the HVA for the overall development and holistic growth of Horticultural Sector in the island, an autonomous society namely High Value Agriculture Development Agency (HVADA) is registered during 2004 under the Society Registration Act 1860.
ii. Centrally Sponsored Scheme to State Extension Programmes for Extension Reforms-ATMA
ATMA was registered under Society Registration Act 1860 in this UT on 12th June, 2006 with a view to make the extension system demand driven and decentralized.
Under the Centrally Sponsored Scheme “ Support to State Extension
Programmes for Extension Reforms” ATMA, since its constitution from 2007-08 is disseminating innovative technology, updating farmers knowledge and skill by arranging training programme, demonstrations, exposure visits etc. through various extension methodologies. Also for up-gradation of knowledge and skill of extension functionaries, conducting exposure visits & trainings in mainland institutions.
44
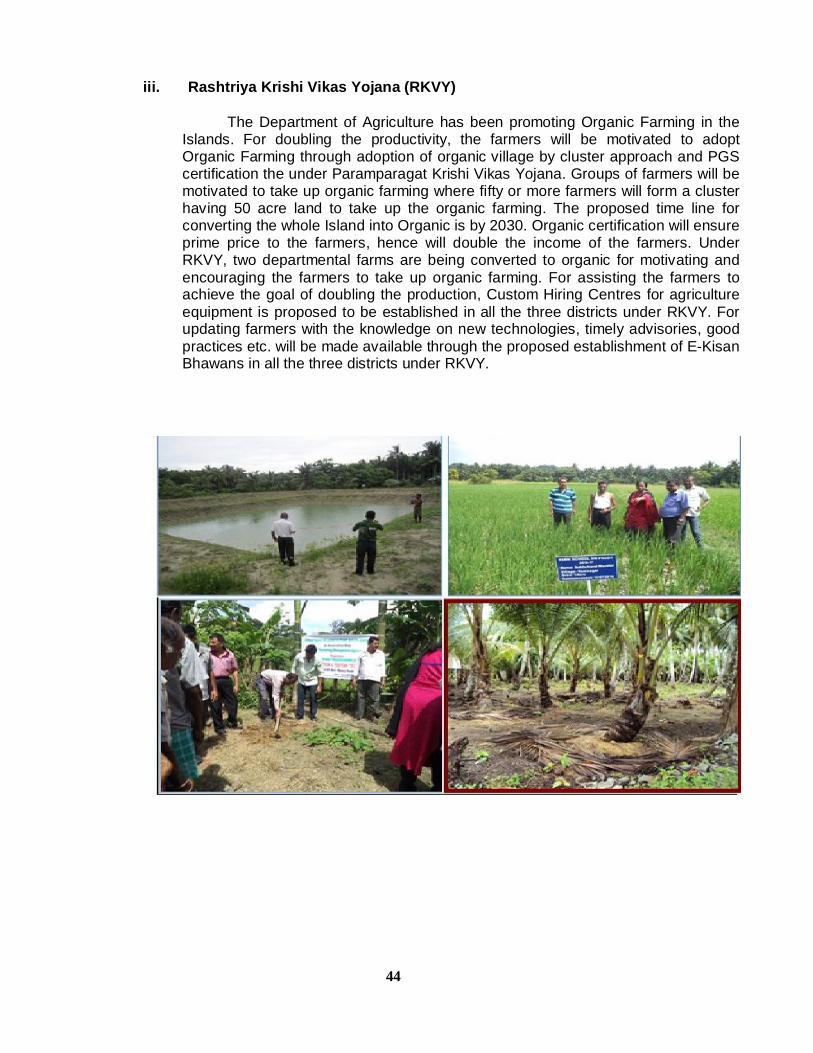
iii. Rashtriya Krishi Vikas Yojana (RKVY)
The Department of Agriculture has been promoting Organic Farming in the Islands. For doubling the productivity, the farmers will be motivated to adopt Organic Farming through adoption of organic village by cluster approach and PGS certification the under Paramparagat Krishi Vikas Yojana. Groups of farmers will be motivated to take up organic farming where fifty or more farmers will form a cluster having 50 acre land to take up the organic farming. The proposed time line for converting the whole Island into Organic is by 2030. Organic certification will ensure prime price to the farmers, hence will double the income of the farmers. Under RKVY, two departmental farms are being converted to organic for motivating and encouraging the farmers to take up organic farming. For assisting the farmers to achieve the goal of doubling the production, Custom Hiring Centres for agriculture equipment is proposed to be established in all the three districts under RKVY. For updating farmers with the knowledge on new technologies, timely advisories, good practices etc. will be made available through the proposed establishment of E-Kisan Bhawans in all the three districts under RKVY.
45
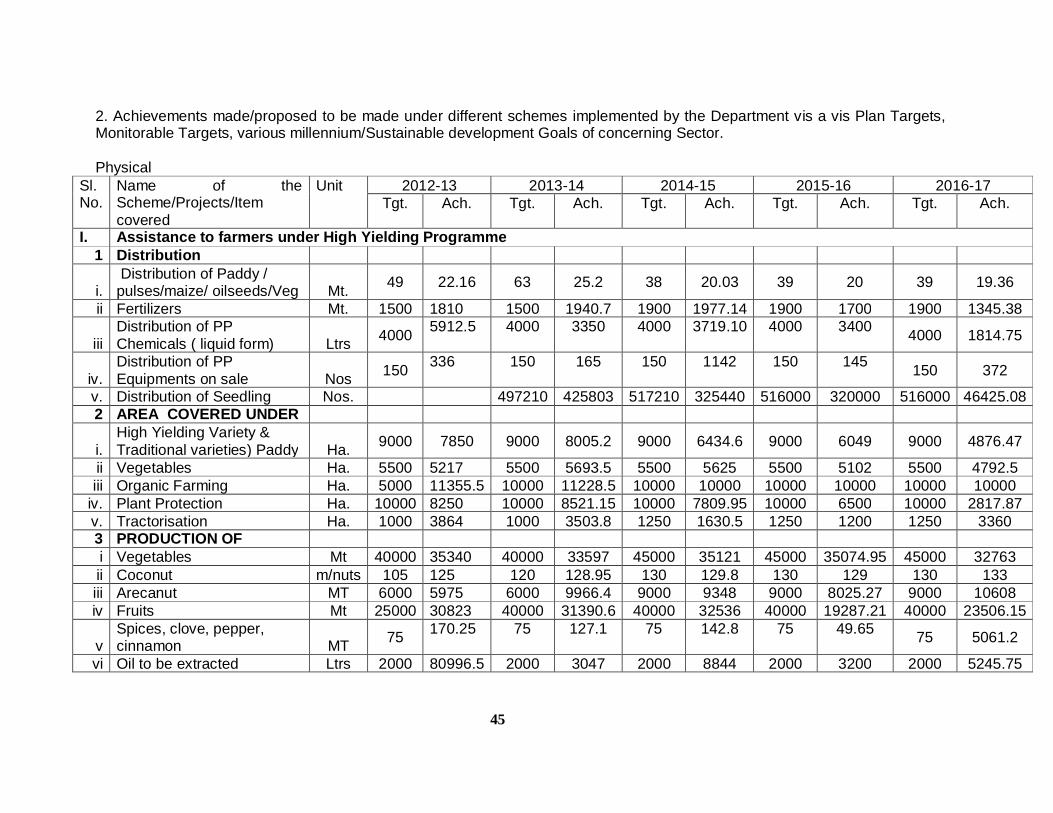
2. Achievements made/proposed to be made under different schemes implemented by the Department vis a vis Plan Targets, Monitorable Targets, various millennium/Sustainable development Goals of concerning Sector.
Physical
Sl. No.
Name of the Scheme/Projects/Item covered
Unit 2012-13 2013-14 2014-15 2015-16 2016-17 Tgt. Ach. Tgt. Ach. Tgt. Ach. Tgt. Ach. Tgt. Ach.
I. Assistance to farmers under High Yielding Programme 1 Distribution
i. Distribution of Paddy / pulses/maize/ oilseeds/Veg Mt. 49 22.16 63 25.2 38 20.03 39 20 39 19.36
ii Fertilizers Mt. 1500 1810 1500 1940.7 1900 1977.14 1900 1700 1900 1345.38
iii Distribution of PP Chemicals ( liquid form) Ltrs 4000 5912.5 4000 3350 4000 3719.10 4000 3400 4000 1814.75
iv. Distribution of PP Equipments on sale Nos 150 336 150 165 150 1142 150 145 150 372
v. Distribution of Seedling Nos. 497210 425803 517210 325440 516000 320000 516000 46425.08 2 AREA COVERED UNDER
i. High Yielding Variety & Traditional varieties) Paddy Ha. 9000 7850 9000 8005.2 9000 6434.6 9000 6049 9000 4876.47
ii Vegetables Ha. 5500 5217 5500 5693.5 5500 5625 5500 5102 5500 4792.5 iii Organic Farming Ha. 5000 11355.5 10000 11228.5 10000 10000 10000 10000 10000 10000
iv. Plant Protection Ha. 10000 8250 10000 8521.15 10000 7809.95 10000 6500 10000 2817.87 v. Tractorisation Ha. 1000 3864 1000 3503.8 1250 1630.5 1250 1200 1250 3360 3 PRODUCTION OF i Vegetables Mt 40000 35340 40000 33597 45000 35121 45000 35074.95 45000 32763 ii Coconut m/nuts 105 125 120 128.95 130 129.8 130 129 130 133 iii Arecanut MT 6000 5975 6000 9966.4 9000 9348 9000 8025.27 9000 10608 iv Fruits Mt 25000 30823 40000 31390.6 40000 32536 40000 19287.21 40000 23506.15
v Spices, clove, pepper, cinnamon MT 75 170.25 75 127.1 75 142.8 75 49.65 75 5061.2
vi Oil to be extracted Ltrs 2000 80996.5 2000 3047 2000 8844 2000 3200 2000 5245.75
46
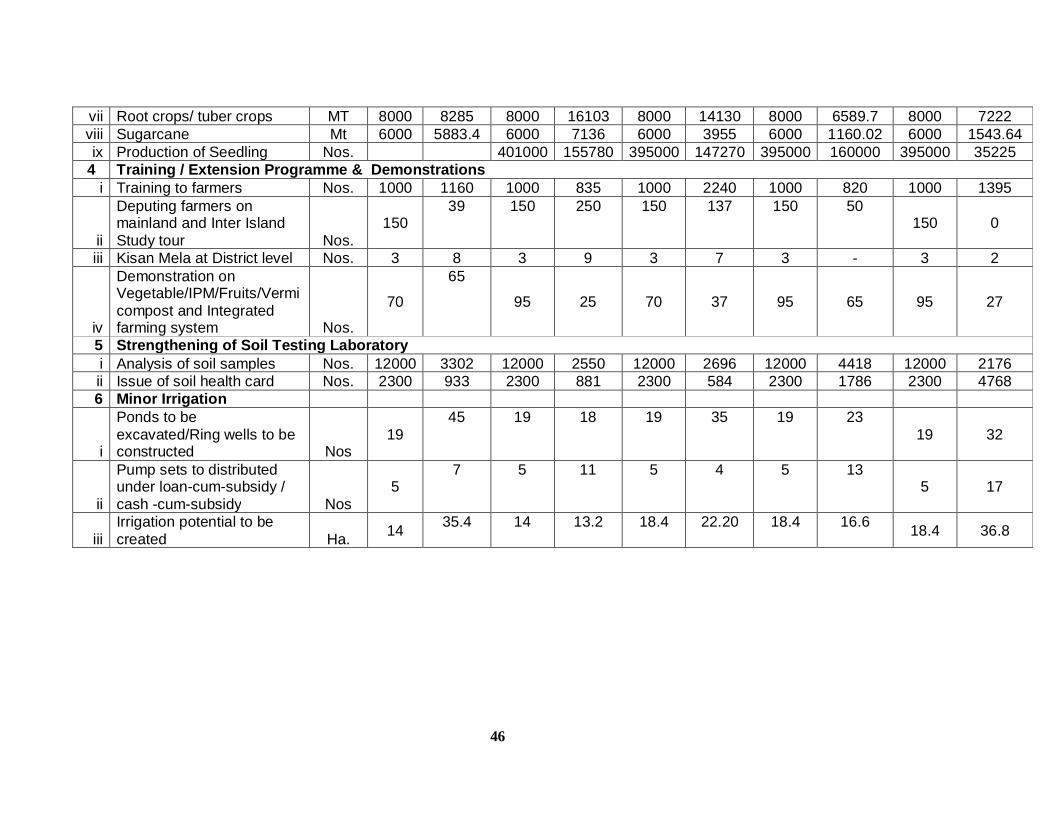
vii Root crops/ tuber crops MT 8000 8285 8000 16103 8000 14130 8000 6589.7 8000 7222 viii Sugarcane Mt 6000 5883.4 6000 7136 6000 3955 6000 1160.02 6000 1543.64 ix Production of Seedling Nos. 401000 155780 395000 147270 395000 160000 395000 35225
4 Training / Extension Programme & Demonstrations i Training to farmers Nos. 1000 1160 1000 835 1000 2240 1000 820 1000 1395
ii
Deputing farmers on mainland and Inter Island Study tour Nos.
150 39 150 250 150 137 150 50
150 0
iii Kisan Mela at District level Nos. 3 8 3 9 3 7 3 - 3 2
iv
Demonstration on Vegetable/IPM/Fruits/Vermicompost and Integrated farming system Nos.
70
65
95 25 70 37 95 65 95 27
5 Strengthening of Soil Testing Laboratory i Analysis of soil samples Nos. 12000 3302 12000 2550 12000 2696 12000 4418 12000 2176 ii Issue of soil health card Nos. 2300 933 2300 881 2300 584 2300 1786 2300 4768 6 Minor Irrigation
i
Ponds to be excavated/Ring wells to be constructed Nos
19 45 19 18 19 35 19 23
19 32
ii
Pump sets to distributed under loan-cum-subsidy / cash -cum-subsidy Nos
5 7 5 11 5 4 5 13
5 17
iii Irrigation potential to be created Ha. 14 35.4 14 13.2 18.4 22.20 18.4 16.6 18.4 36.8
47
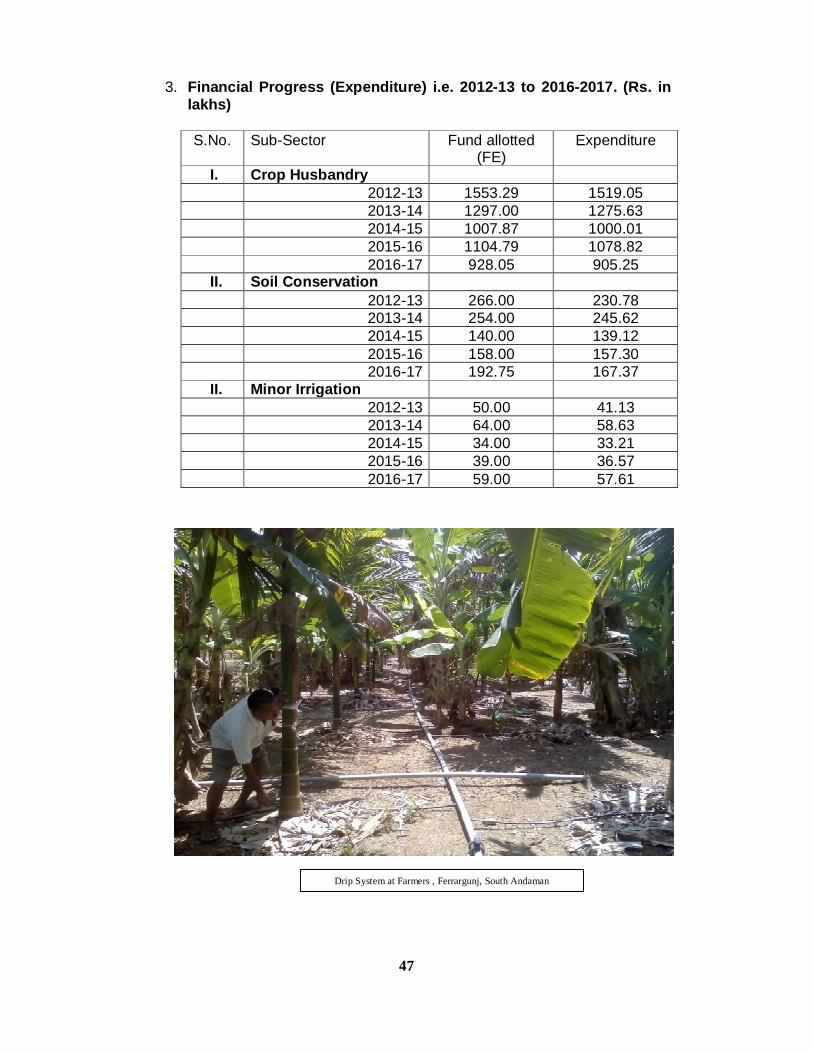
3. Financial Progress (Expenditure) i.e. 2012-13 to 2016-2017. (Rs. in
lakhs)
S.No. Sub-Sector Fund allotted (FE)
Expenditure
I. Crop Husbandry 2012-13 1553.29 1519.05 2013-14 1297.00 1275.63 2014-15 1007.87 1000.01 2015-16 1104.79 1078.82 2016-17 928.05 905.25 II. Soil Conservation 2012-13 266.00 230.78 2013-14 254.00 245.62 2014-15 140.00 139.12 2015-16 158.00 157.30 2016-17 192.75 167.37 II. Minor Irrigation 2012-13 50.00 41.13 2013-14 64.00 58.63 2014-15 34.00 33.21 2015-16 39.00 36.57 2016-17 59.00 57.61
Drip System at Farmers , Ferrargunj, South Andaman
48
Coconut occupies prime position in the social & economic life of the people as it is the main source of income and livelihood support of the farming community.
The Production of Coconut has increased from 125 M/nut during 2012-13 to 133
M/nut during 1216-17 (+6.4%). There is tremendous increase in the production of arecanut from 5975 MT during 2012-13 to 10608 MT(+77.54%)during 2016-17.The Paddy production has also increased from 21500 MT during 2012-13 to 24368.20 MT during 2013-14 and further declined to 12593.72 (41.42%) during 2016-17.The production of Vegetable has increased by (2.57%) during 2015-16 and declined by (-7.28%) during 2016-17 from 2012-13.The production of Fruits have also increased by( +1.84% and +5.56%) during 2013-14 and 2014-15 and further declined to (-23.74%) during 2016-17 from 2012-13.
Area & production of Major crops for the last 05 years
Crops 2012-13 2013-14 2014-15 2015-16 2016-17
Area Prodn. Area Prodn. Area Prodn. Area Prodn. Area Prodn.
Coconut 21875.00 125.00 21900.00 0128.95 21910.00 129.80 21915.00 131.60 22079 133
Arecanut 4225.00 5975.00 4290.90 9966.40 4669.50 9348.00 4623.50 10327.50 4625.5 10608 Paddy 7850.00 21500.00 8005.20 24368.20 6434.60 19679.00 6100.00 20517.00 4876.47 12593.72
Pulses 1317.40 646.50 578.25 279.54 1575.00 844.00 1418.50 921.50 1533.15 467.71 Oilseeds 108.80 51.90 40.40 14.23 36.00 15.00 42.50 9.35 9.5 3.36
Vegetables 5217.00 35340.00 5693.50 33597.00 5625.00 35121.00 5335.00 36250.00 4792 32764 Fruits 3256.00 30823.00 3620.95 31390.60 3745.00 32536.00 3946.00 31130.00 3825.12 23506.15 Note : Coconut production in Million Nuts Area in Hectares ( Ha) and Prod in Metric Tonnes ( MT)
49
2. Animal Husbandry I. Historical Background:
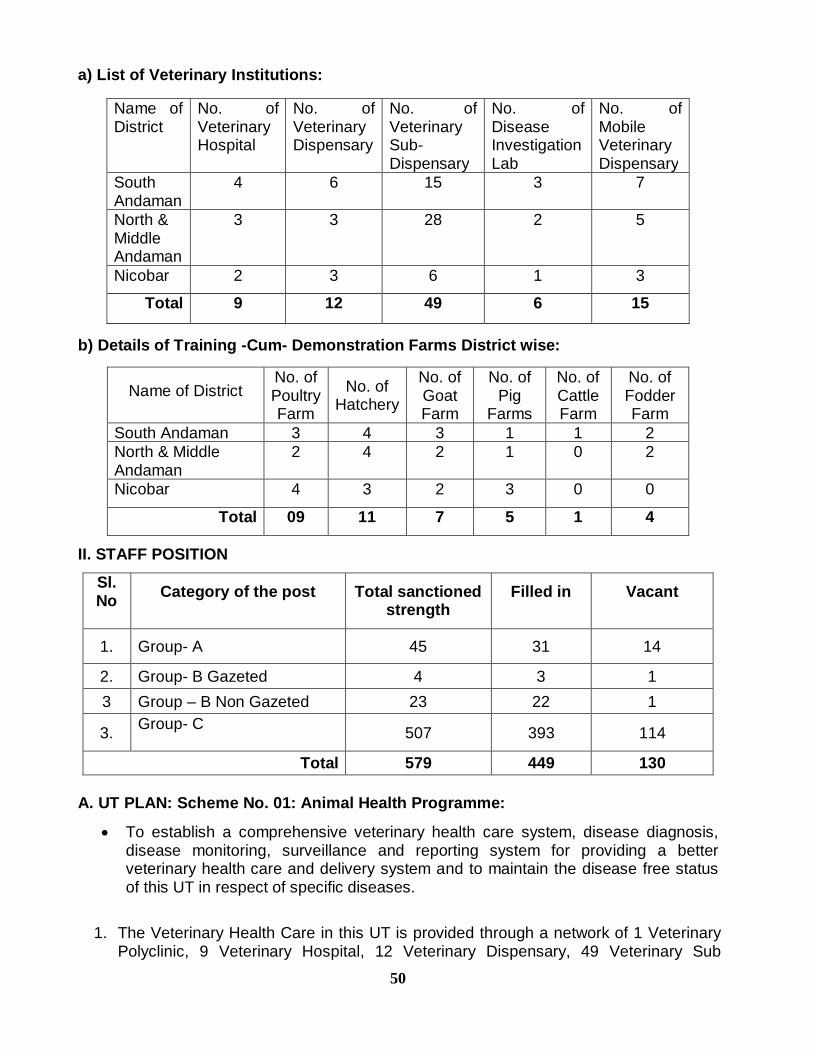
Prior to 1947, the livestock department of Andaman and Nicobar islands had no separate existence of its own but was merged with the supply department. For the first time in 1952, a separate livestock officer was appointed. Since then the department started functioning separately with the livestock officer as technical head of office under the control of Deputy Commissioner Establishment. In December 1971, the livestock department was upgraded into Directorate of Animal Husbandry. The Director of Animal Husbandry was appointed as the Head of Department under the control of Development Commissioner-cum-Secretary (AH) of Andaman & Nicobar Administration. Later on in the year 1977, the post of Director was upgraded and the department was named as Directorate of Animal Husbandry & Veterinary Services. II. Livestock and Poultry in A & N Islands: Unlike in the mainland of India, limited variety of livestock are found in these islands. The Cattle, Buffaloes, Goats, Pigs and Poultry are the important livestock in these islands. The Live stock and poultry population as per 18th and 19th Livestock Census is indicated in the following table:-
Statement 7.2.1
Livestock Census Data Sl. No.
Livestock Census 2007 (No.)
Census 2012 (No.)
Percentage of Growth Rate over previous
Census 1 Cow 49,791 45625 -8.38 2 Buffalo 9,986 7863 -21.28 3 Goat 67,472 65324 -3.18 4 Pig 48,406 35,921 -25.79 5 Horse & pony - 4 6 Donkey 3 4
Total live stock 175658 154741 7 Poultry including
Duck 9,80,920 1165223 +18.80
The major thrust of the Department of Animal Husbandry and Veterinary Services is to concentrate on treatment and control of animal diseases, creation of disease free zones, scientific management and up-gradation of genetic resources, increasing availability of nutritious feed and fodder, motivating farmers/unemployed persons for self employment and higher subsidiary income through Animal Husbandry activities resulting in enhanced production of eggs, meat and milk and providing marketing facilities to the farmers for sale of livestock products.
The Department of Animal Husbandry and Veterinary Services provides the health coverage through various institutions. The details are given below:-
50
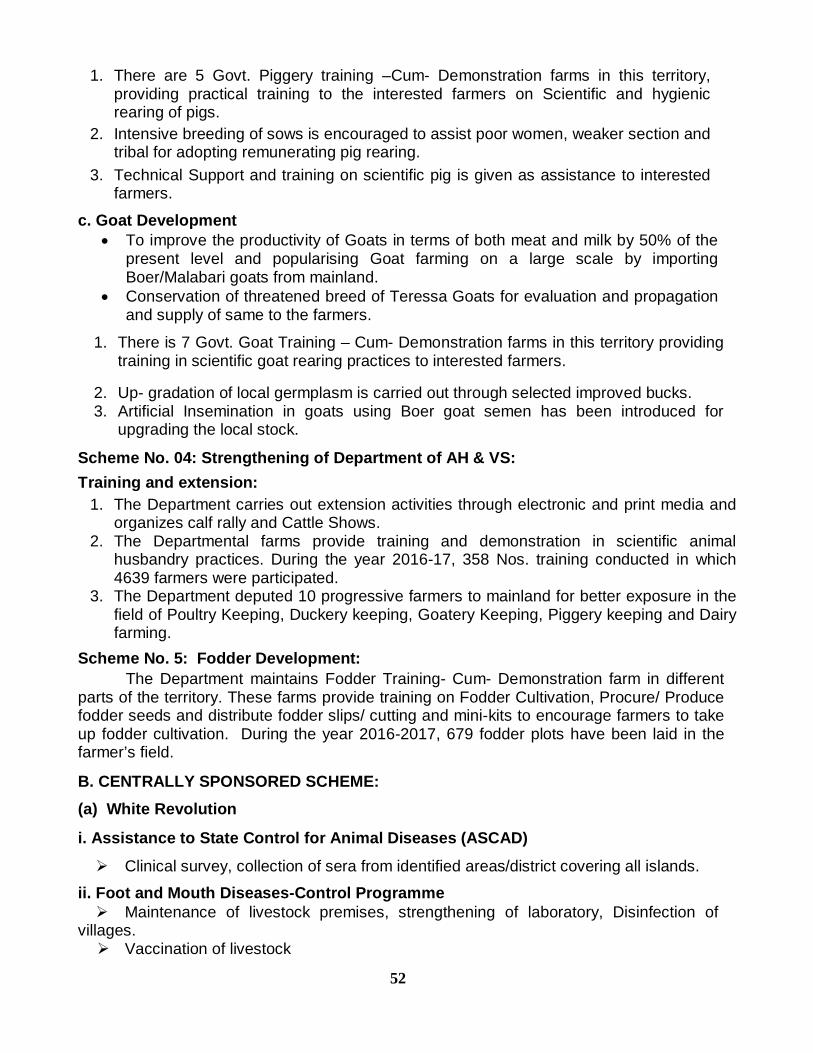
a) List of Veterinary Institutions:
Name of District
No. of Veterinary Hospital
No. of Veterinary Dispensary
No. of Veterinary Sub-Dispensary
No. of Disease Investigation Lab
No. of Mobile Veterinary Dispensary
South Andaman
4 6 15 3 7
North & Middle Andaman
3 3 28 2 5
Nicobar 2 3 6 1 3
Total 9 12 49 6 15 b) Details of Training -Cum- Demonstration Farms District wise:
Name of District No. of Poultry Farm
No. of Hatchery
No. of Goat Farm
No. of Pig
Farms
No. of Cattle Farm
No. of Fodder Farm
South Andaman 3 4 3 1 1 2 North & Middle Andaman
2 4 2 1 0 2
Nicobar 4 3 2 3 0 0
Total 09 11 7 5 1 4
II. STAFF POSITION
Sl. No
Category of the post
Total sanctioned
strength Filled in
Vacant
1. Group- A 45 31 14
2. Group- B Gazeted 4 3 1 3 Group – B Non Gazeted 23 22 1
3. Group- C 507 393 114
Total 579 449 130 A. UT PLAN: Scheme No. 01: Animal Health Programme:
To establish a comprehensive veterinary health care system, disease diagnosis, disease monitoring, surveillance and reporting system for providing a better veterinary health care and delivery system and to maintain the disease free status of this UT in respect of specific diseases.
1. The Veterinary Health Care in this UT is provided through a network of 1 Veterinary Polyclinic, 9 Veterinary Hospital, 12 Veterinary Dispensary, 49 Veterinary Sub

51
Dispensaries and 15 Mobile Veterinary Dispensaries spread over the entire Islands of this Territory,
2. These Islands are also free from the contagious diseases such as RABIES, ANTHRAX, H.S. RINDERPEST, BQ etc. The Department carried out Disease surveillance, reporting and diagnosis and disease monitoring throughout the year. No major disease or outbreaks have been reported during the year.
3. State Animal Disease Emergency Committee (SADEC) has been effectively implementing necessary preventive measures to restrict entry of infectious and contagious disease into this territory.
4. The department conducted 567 Veterinary Health Camps and Mobile tours over the entire territory during the year 2016-17.
Scheme No: 02 Cattle Development: To augment the milk production
1. Up gradation of the local non- descript and low producing Cattle by Artificial Insemination using high quality semen is carried out through 34 A.I. Sub Centers and 17 Artificial Insemination Centers spread over the entire territory. During the year 2016-17, 8370 Nos. of AI have been carried out and 8819 Scrub bulls & Goat have been castrated. A total of 4106 Nos. of cross bred calves have been born.
2. The department maintains Dairy Farm to impart training and demonstration and to supply cross bred calves to the farmers.
3. The department is implementing a programme of training and engaging part time volunteers for performing Artificial Insemination & Castration in remote areas.
4. The department maintains fodder demonstration farm to increase fodder resources of the islands.
Scheme No. 03: Poultry, Piggery & Goat Development Programme: a) Poultry:
To augment the egg production and the Poultry meat production, as well as to popularise the backyard poultry, Turkey, Vanaraja and quail farming among the farmers.
1. There are 11 Govt. Hatcheries and 9 Govt. Poultry Training-cum-Demonstration farm, Eight Govt. Duckery –Cum- Demonstration farms in this territory. Promotion of improved Varieties like Vanaraja has been successful in popularizing Backyard Poultry in this territory. Vanaraja chicks and breeding birds are supplied to farmers and the tribal farmers at economical rates.
2. Duck rearing is also promoted and these farms supplied ducklings to interested farmers. 38420 Nos. Ducks/Ducklings sold to farmers during the year 2016-17.
3. Vaccination against major poultry diseases is carried out free of cost. 29,21,266 Nos. birds have been vaccinated during the year 2016-17
4. Turkey and Guinea fowls has been introduced in these Islands and are supplied
through the departmental farms.
b) Piggery Development: Increasing the productivity of pigs by transforming 80% of the pig population in this
UT to crossbreed Large White Yorkshire and popularising Pig keeping among the Non-Tribal population.
52
1. There are 5 Govt. Piggery training –Cum- Demonstration farms in this territory, providing practical training to the interested farmers on Scientific and hygienic rearing of pigs.
2. Intensive breeding of sows is encouraged to assist poor women, weaker section and tribal for adopting remunerating pig rearing.
3. Technical Support and training on scientific pig is given as assistance to interested farmers.
c. Goat Development To improve the productivity of Goats in terms of both meat and milk by 50% of the
present level and popularising Goat farming on a large scale by importing Boer/Malabari goats from mainland.
Conservation of threatened breed of Teressa Goats for evaluation and propagation and supply of same to the farmers.
1. There is 7 Govt. Goat Training – Cum- Demonstration farms in this territory providing training in scientific goat rearing practices to interested farmers.
2. Up- gradation of local germplasm is carried out through selected improved bucks. 3. Artificial Insemination in goats using Boer goat semen has been introduced for
upgrading the local stock.
Scheme No. 04: Strengthening of Department of AH & VS:
Training and extension:
1. The Department carries out extension activities through electronic and print media and organizes calf rally and Cattle Shows.
2. The Departmental farms provide training and demonstration in scientific animal husbandry practices. During the year 2016-17, 358 Nos. training conducted in which 4639 farmers were participated.
3. The Department deputed 10 progressive farmers to mainland for better exposure in the field of Poultry Keeping, Duckery keeping, Goatery Keeping, Piggery keeping and Dairy farming.
Scheme No. 5: Fodder Development:
The Department maintains Fodder Training- Cum- Demonstration farm in different parts of the territory. These farms provide training on Fodder Cultivation, Procure/ Produce fodder seeds and distribute fodder slips/ cutting and mini-kits to encourage farmers to take up fodder cultivation. During the year 2016-2017, 679 fodder plots have been laid in the farmer’s field.
B. CENTRALLY SPONSORED SCHEME: (a) White Revolution
i. Assistance to State Control for Animal Diseases (ASCAD)
Clinical survey, collection of sera from identified areas/district covering all islands.
ii. Foot and Mouth Diseases-Control Programme Maintenance of livestock premises, strengthening of laboratory, Disinfection of
villages. Vaccination of livestock
53
iii. National Project on Rinderpest Surveillance & Monitoring: Sero surveillance, clinical surveillance Village searches and the awareness campaign.
iv. Professional Efficiency Development (PED): Establishing Veterinary Council continuous Veterinary Education and regulating
Veterinary Practices in the Islands. v. Establishment & Strengthening of existing Veterinary Hospitals & Dispensaries
(ESVHD): Strengthening the infrastructure in the Veterinary Hospitals & Dispensaries.
C. RASTRIYA KRISHI VIKAS YOJANA: i) Goat Development Programme: Genetic Up-gradation of local goats
through natural services and Strengthening of Departmental Goat Breeding Farms:
Import of improved variety of goats from mainland for stationing at the departmental institution/distribution to the farmers for providing natural services to the local goats.
ii) Immunization of Rural Poultry Farm:
For carrying out Blanket immunization programme against Rhaniket Diseases/IBD especially in backyard Poultry the Vaccinator have to be carried out at dusk/night or before dawn as most of the poultry do not have shelter and spent the night on the nearby trees/roof of the houses in the villages. At present the existing departmental staff is not able to effectively cover all the birds in the villages. Hence it is proposed to train the selected youth from the Villages in Poultry Vaccination and engaged them for carrying out Poultry Vaccination in the villages by providing them incentive of Rs. 2/- per bird. During the year 2016-2017, 68 Vaccinator have been engaged in which 4.24 Lakh Poultry Birds were vaccinated.
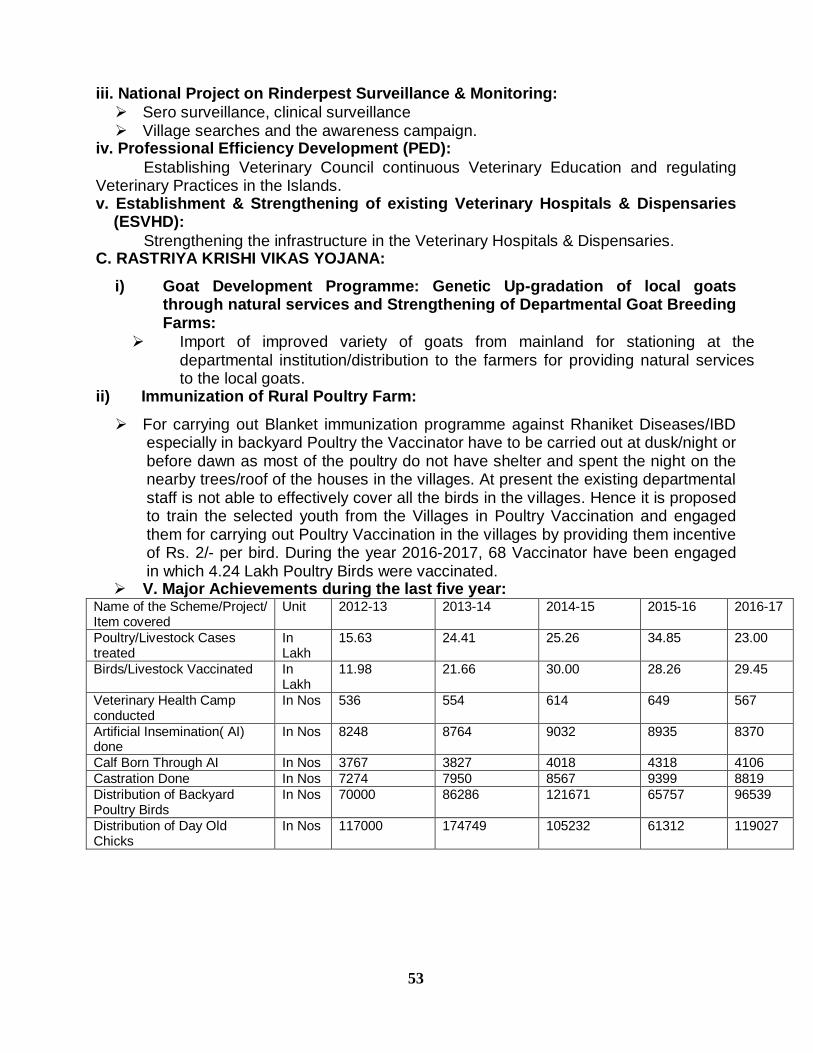
V. Major Achievements during the last five year: Name of the Scheme/Project/ Item covered
Unit 2012-13 2013-14 2014-15 2015-16 2016-17
Poultry/Livestock Cases treated
In Lakh
15.63 24.41 25.26 34.85 23.00
Birds/Livestock Vaccinated In Lakh
11.98 21.66 30.00 28.26 29.45
Veterinary Health Camp conducted
In Nos 536 554 614 649 567
Artificial Insemination( AI) done
In Nos 8248 8764 9032 8935 8370
Calf Born Through AI In Nos 3767 3827 4018 4318 4106 Castration Done In Nos 7274 7950 8567 9399 8819 Distribution of Backyard Poultry Birds
In Nos 70000 86286 121671 65757 96539
Distribution of Day Old Chicks
In Nos 117000 174749 105232 61312 119027
54
Organising Short term training Programme on Scientific Livestock & Poultry Management for farmers/ unemployed youth and rural women
In Nos 324 Programme (5397 Farmers/ unemployed youth and rural women participated.)
235 Programme (3849 Farmers/ unemployed youth and rural women participated.)
271 Programme (4471 Farmers/ unemployed youth and rural women participated.)
294 Programme (4951 Farmers/ unemployed youth and rural women participated.)
358 Programme (4639 Farmers/ unemployed youth and rural women participated.)
Technical Assistance provided to farmers for setting up their Private Farm
In Nos. 129 32 546 238 200
Development of Fodder Demonstration Plots in the field of farmers.
In Nos. 481 655 537 602 679
55
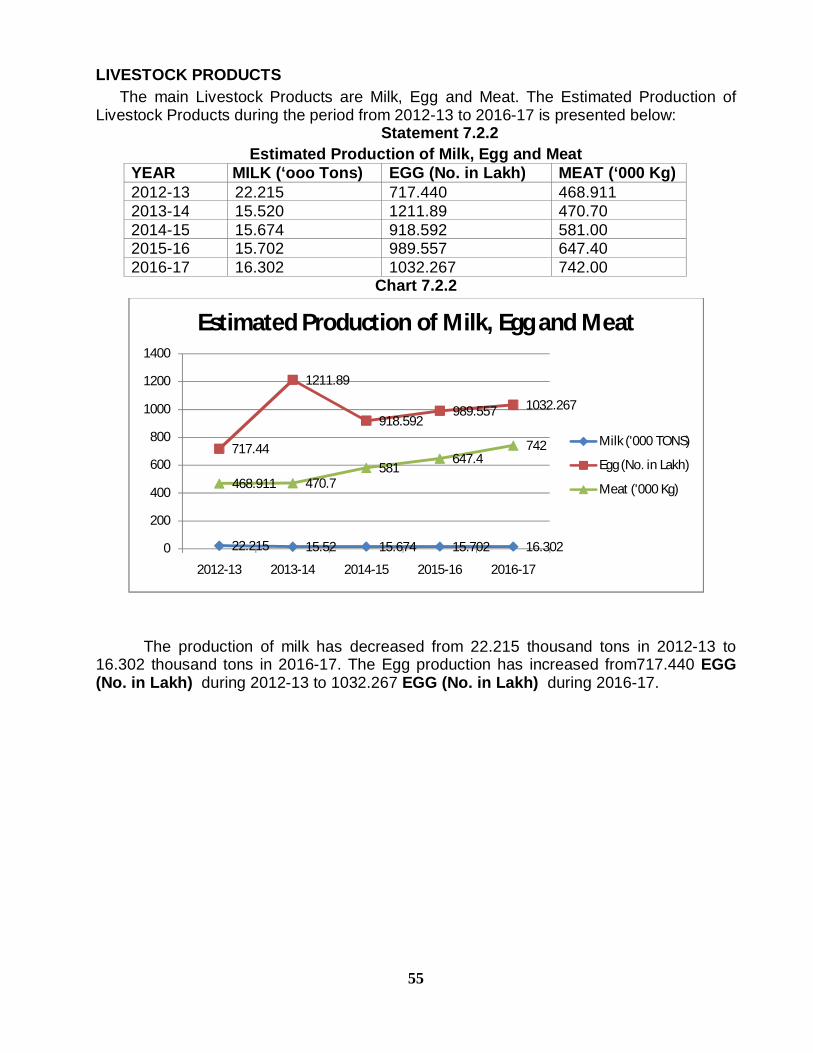
LIVESTOCK PRODUCTS The main Livestock Products are Milk, Egg and Meat. The Estimated Production of
Livestock Products during the period from 2012-13 to 2016-17 is presented below: Statement 7.2.2
Estimated Production of Milk, Egg and Meat YEAR MILK (‘ooo Tons) EGG (No. in Lakh) MEAT (‘000 Kg) 2012-13 22.215 717.440 468.911 2013-14 15.520 1211.89 470.70 2014-15 15.674 918.592 581.00 2015-16 15.702 989.557 647.40 2016-17 16.302 1032.267 742.00
Chart 7.2.2
The production of milk has decreased from 22.215 thousand tons in 2012-13 to 16.302 thousand tons in 2016-17. The Egg production has increased from717.440 EGG (No. in Lakh) during 2012-13 to 1032.267 EGG (No. in Lakh) during 2016-17.
22.215 15.52 15.674 15.702 16.302
717.44
1211.89
918.592989.557 1032.267
468.911 470.7581
647.4742
0
200
400
600
800
1000
1200
1400
2012-13 2013-14 2014-15 2015-16 2016-17
Estimated Production of Milk, Egg and Meat
Milk ('000 TONS)
Egg (No. in Lakh)
Meat ('000 Kg)
56
3. FISHERIES
The Andaman and Nicobar Islands has a vast potential in view of coastal length of about1912 km and the continental shelf area of about 35,000 sq.km. The Exclusive Economic Zone around these Island is about 6,00,000 sq. kms forming 28% of total EEZ area of the country.
As per the report of the working group on revalidation of potential Marine Fisheries Resources of EEZ of India during during the year 2010 the estimated annual exploitatable stock of marine stock of marine fish in A&N waters is 1.48 lakhs MT.
FISH PRODUCTION Marine and Inland FISHERY
Statement 7.3.1
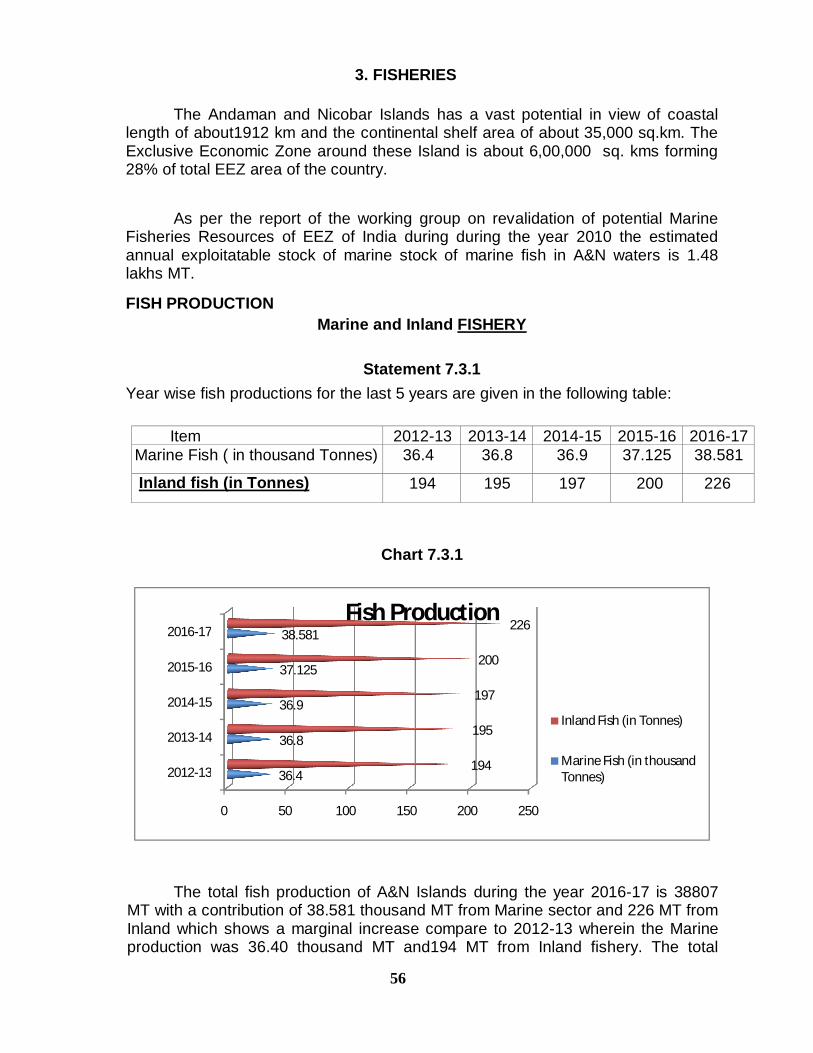
Year wise fish productions for the last 5 years are given in the following table:
Item 2012-13 2013-14 2014-15 2015-16 2016-17 Marine Fish ( in thousand Tonnes) 36.4 36.8 36.9 37.125 38.581
Inland fish (in Tonnes) 194 195 197 200 226
Chart 7.3.1
The total fish production of A&N Islands during the year 2016-17 is 38807
MT with a contribution of 38.581 thousand MT from Marine sector and 226 MT from Inland which shows a marginal increase compare to 2012-13 wherein the Marine production was 36.40 thousand MT and194 MT from Inland fishery. The total
0 50 100 150 200 250
2012-13
2013-14
2014-15
2015-16
2016-17
36.4
36.8
36.9
37.125
38.581
194
195
197
200
226Fish Production
Inland Fish (in Tonnes)
Marine Fish (in thousand Tonnes)
57
number of crafts registered during the year is 2888 and number of identity card issued to active fishers is 7326. There are about 14839 fishermen engaged in fishing activity by using 1528 No. of fishing country crafts, 1385 motorized traditional fishing boat and 69 mechanized fishing vessels. The main fishing gears used are gill nets, Hook and lines, cast nets ,shore seines/ anchor nets.
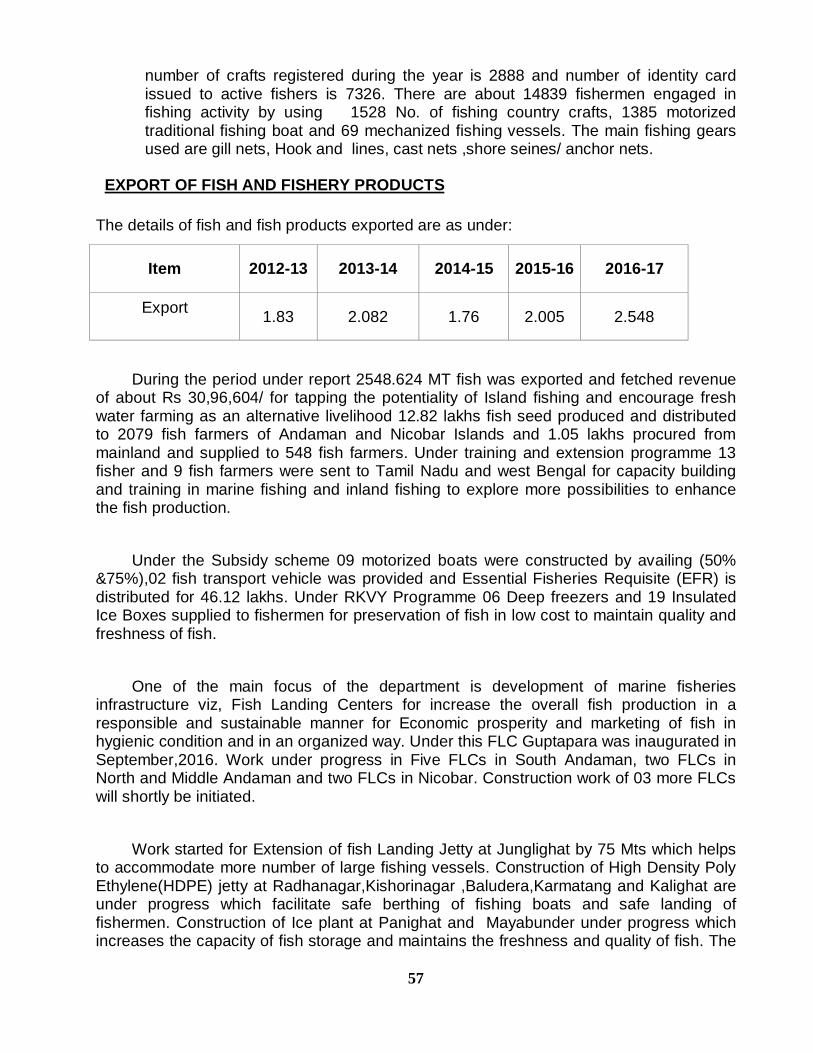
EXPORT OF FISH AND FISHERY PRODUCTS
The details of fish and fish products exported are as under:
Item 2012-13 2013-14 2014-15 2015-16 2016-17
Export 1.83 2.082 1.76 2.005 2.548
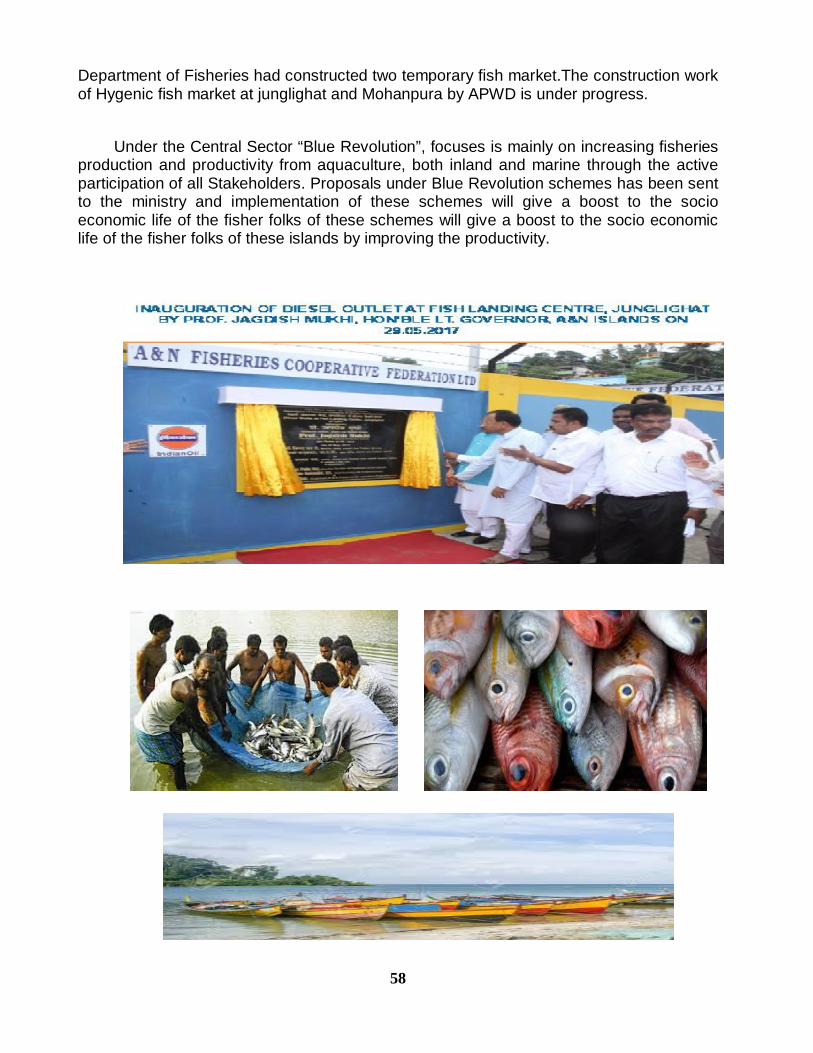
During the period under report 2548.624 MT fish was exported and fetched revenue of about Rs 30,96,604/ for tapping the potentiality of Island fishing and encourage fresh water farming as an alternative livelihood 12.82 lakhs fish seed produced and distributed to 2079 fish farmers of Andaman and Nicobar Islands and 1.05 lakhs procured from mainland and supplied to 548 fish farmers. Under training and extension programme 13 fisher and 9 fish farmers were sent to Tamil Nadu and west Bengal for capacity building and training in marine fishing and inland fishing to explore more possibilities to enhance the fish production. Under the Subsidy scheme 09 motorized boats were constructed by availing (50% &75%),02 fish transport vehicle was provided and Essential Fisheries Requisite (EFR) is distributed for 46.12 lakhs. Under RKVY Programme 06 Deep freezers and 19 Insulated Ice Boxes supplied to fishermen for preservation of fish in low cost to maintain quality and freshness of fish. One of the main focus of the department is development of marine fisheries infrastructure viz, Fish Landing Centers for increase the overall fish production in a responsible and sustainable manner for Economic prosperity and marketing of fish in hygienic condition and in an organized way. Under this FLC Guptapara was inaugurated in September,2016. Work under progress in Five FLCs in South Andaman, two FLCs in North and Middle Andaman and two FLCs in Nicobar. Construction work of 03 more FLCs will shortly be initiated. Work started for Extension of fish Landing Jetty at Junglighat by 75 Mts which helps to accommodate more number of large fishing vessels. Construction of High Density Poly Ethylene(HDPE) jetty at Radhanagar,Kishorinagar ,Baludera,Karmatang and Kalighat are under progress which facilitate safe berthing of fishing boats and safe landing of fishermen. Construction of Ice plant at Panighat and Mayabunder under progress which increases the capacity of fish storage and maintains the freshness and quality of fish. The
58
Department of Fisheries had constructed two temporary fish market.The construction work of Hygenic fish market at junglighat and Mohanpura by APWD is under progress. Under the Central Sector “Blue Revolution”, focuses is mainly on increasing fisheries production and productivity from aquaculture, both inland and marine through the active participation of all Stakeholders. Proposals under Blue Revolution schemes has been sent to the ministry and implementation of these schemes will give a boost to the socio economic life of the fisher folks of these schemes will give a boost to the socio economic life of the fisher folks of these islands by improving the productivity.
59
ENVIRONMENT & FORESTS The Department of Environment and Forests has been entrusted with the responsibility of conservation, protection and Management of unique Biodiversity of Andaman and Nicobar Islands for the present and future generations, sustainable utilization of natural resources for the benefit of local communities without corresponding the ecological security through various policies and programmes of Government of India. As per the ISFR 2015 out of geographical area (8249 sq.km) 82.28% (7171 sq.km) of the area is under forest cover. A&N Islands constitute one of the hotspot of biodiversity with a varieties eco system such as Tropical Forests, Mangroves, Coral Reefs and Marine environment. These Islands have been categorized as one of the biodiversity eco region under the category of tropical corals in global 200 marine eco regions. It is one of the 31 bio diversity hotspots of the world where in the Andaman group of Islands is included in Indo Burmese hotspot and Nicobar Group in Sundaland hotspots. The Andaman and Nicobar Islands are also one of the first places in India to be added in the list of 50 Global ‘hope spots’ by the International Union for Conservation of Nature and Mission Blue. Further, the International Coordination Council of UNESCO’s Man and the Biosphere Programme has added the Great Nicobar Biosphere Reserve to the world network of biosphere reserve due to its rich biodiversity as added during May 2013 .The A&N Islands encompass a broad range of ecological habitat and highly diverse ecosystem varying from sandy beaches to evergreen forests, littoral plains, muddy creeks, mangroves(617 sqkm area),marine habitat which support thousands of species of plants and animals. 3552 plant species have been recorded from these islands so far and large areas still remain un explored. Similarly 5357 species of fauna have been recorded which includes large number of species from marine ecosystem. Department is implementing 12 schemes for scientific management of forest and wildlife: - The Department has been achieving its basic objective through the implementation of 12 plan schemes which is as under:-
1. Direction, Administration and Capacity Building: 2. Silviculture and Forestry Research: 3. Forests Regeneration and Development of Non-Timber Forest Produce (NTFP): 4. Forests, Resources Survey, Consolidation and working Plan. 5. Forests, Extension and publicity: 6. Forests Utilization:
Statement 7.4.1
Forest Cover Very Dense Forest Moderately Dense Forest Open Forest
Total Forest Covered Area 5686 685 380
60
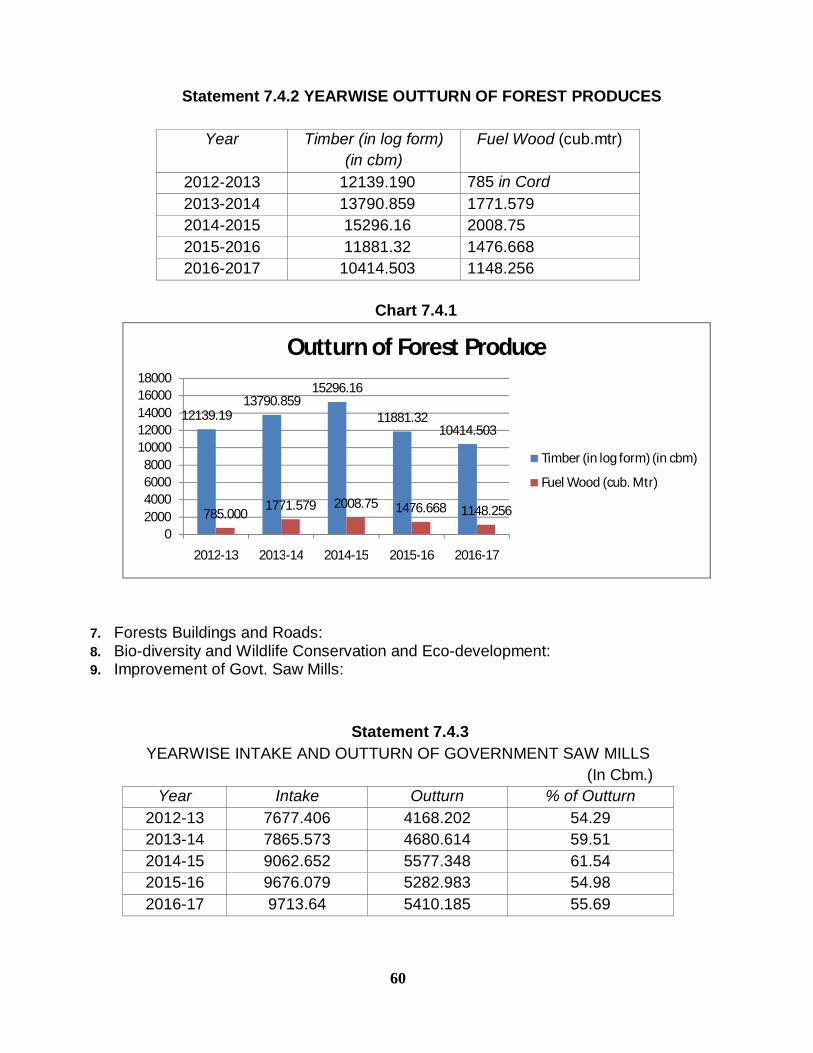
Statement 7.4.2 YEARWISE OUTTURN OF FOREST PRODUCES
Year Timber (in log form)
(in cbm) Fuel Wood (cub.mtr)
2012-2013 12139.190 785 in Cord 2013-2014 13790.859 1771.579 2014-2015 15296.16 2008.75 2015-2016 11881.32 1476.668 2016-2017 10414.503 1148.256
Chart 7.4.1
7. Forests Buildings and Roads: 8. Bio-diversity and Wildlife Conservation and Eco-development: 9. Improvement of Govt. Saw Mills:
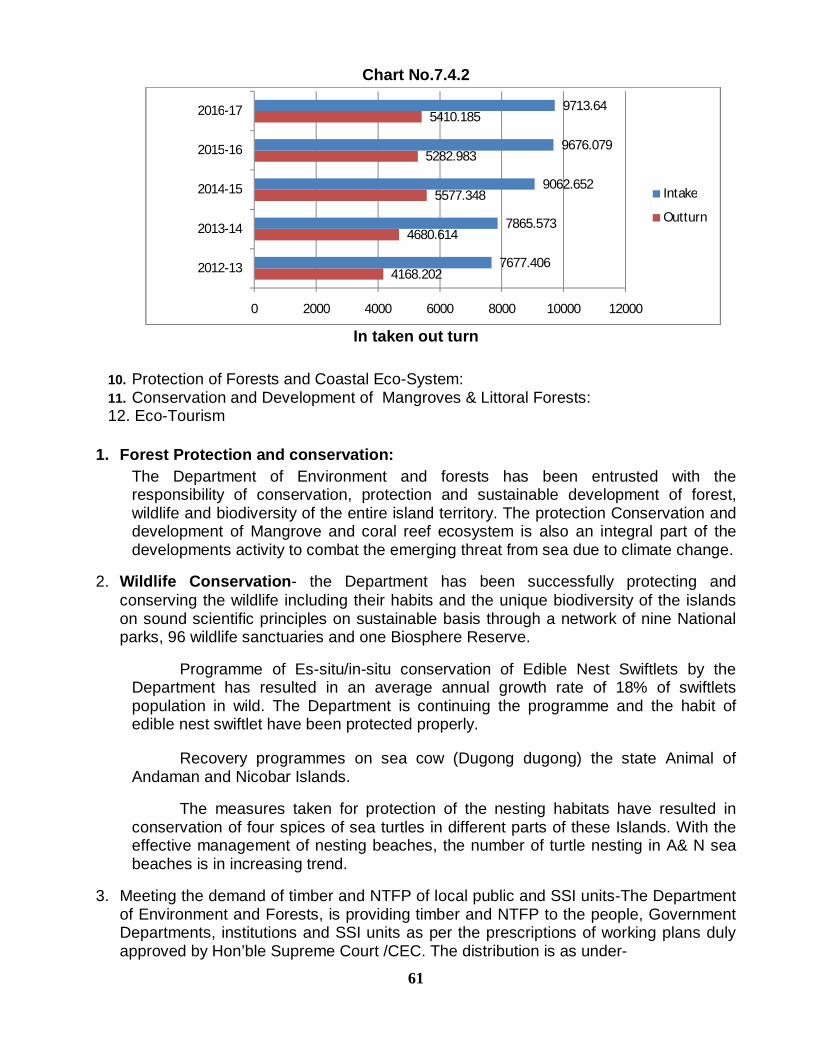
Statement 7.4.3 YEARWISE INTAKE AND OUTTURN OF GOVERNMENT SAW MILLS (In Cbm.)
Year Intake Outturn % of Outturn 2012-13 7677.406 4168.202 54.29 2013-14 7865.573 4680.614 59.51 2014-15 9062.652 5577.348 61.54 2015-16 9676.079 5282.983 54.98 2016-17 9713.64 5410.185 55.69
12139.1913790.859
15296.16
11881.3210414.503
785.0001771.579 2008.75 1476.668 1148.256
02000400060008000
1000012000140001600018000
2012-13 2013-14 2014-15 2015-16 2016-17
Outturn of Forest Produce
Timber (in log form) (in cbm)
Fuel Wood (cub. Mtr)
61
Chart No.7.4.2
In taken out turn
10. Protection of Forests and Coastal Eco-System: 11. Conservation and Development of Mangroves & Littoral Forests: 12. Eco-Tourism
1. Forest Protection and conservation: The Department of Environment and forests has been entrusted with the responsibility of conservation, protection and sustainable development of forest, wildlife and biodiversity of the entire island territory. The protection Conservation and development of Mangrove and coral reef ecosystem is also an integral part of the developments activity to combat the emerging threat from sea due to climate change.
2. Wildlife Conservation- the Department has been successfully protecting and conserving the wildlife including their habits and the unique biodiversity of the islands on sound scientific principles on sustainable basis through a network of nine National parks, 96 wildlife sanctuaries and one Biosphere Reserve.
Programme of Es-situ/in-situ conservation of Edible Nest Swiftlets by the
Department has resulted in an average annual growth rate of 18% of swiftlets population in wild. The Department is continuing the programme and the habit of edible nest swiftlet have been protected properly.
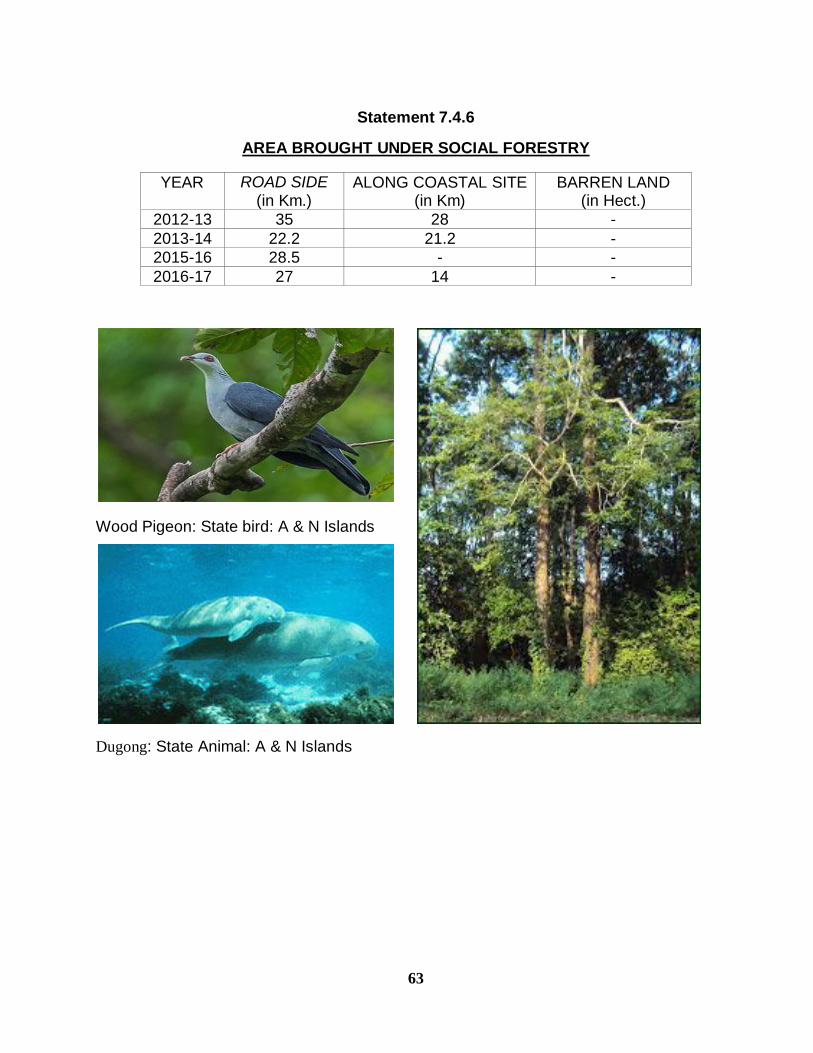
Recovery programmes on sea cow (Dugong dugong) the state Animal of
Andaman and Nicobar Islands. The measures taken for protection of the nesting habitats have resulted in
conservation of four spices of sea turtles in different parts of these Islands. With the effective management of nesting beaches, the number of turtle nesting in A& N sea beaches is in increasing trend.
3. Meeting the demand of timber and NTFP of local public and SSI units-The Department
of Environment and Forests, is providing timber and NTFP to the people, Government Departments, institutions and SSI units as per the prescriptions of working plans duly approved by Hon’ble Supreme Court /CEC. The distribution is as under-
4168.202
4680.614
5577.348
5282.983
5410.185
7677.406
7865.573
9062.652
9676.079
9713.64
0 2000 4000 6000 8000 10000 12000
2012-13
2013-14
2014-15
2015-16
2016-17
Intake
Outturn
62
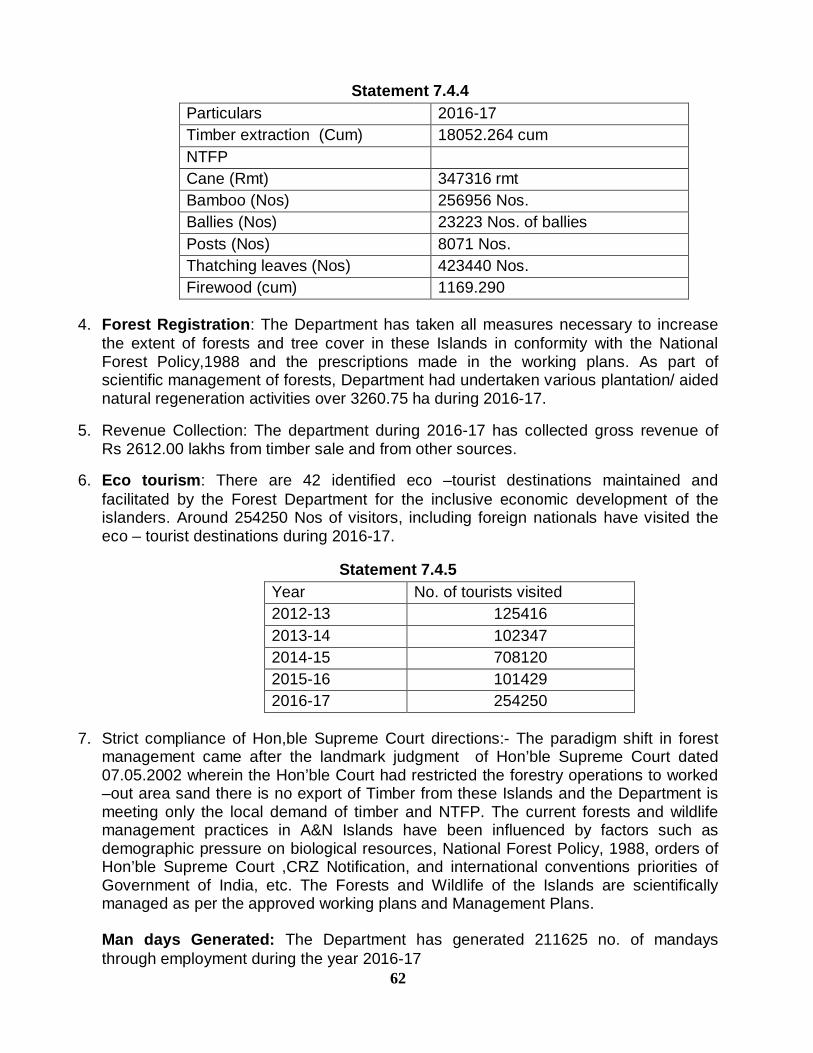
Statement 7.4.4
Particulars 2016-17 Timber extraction (Cum) 18052.264 cum NTFP Cane (Rmt) 347316 rmt Bamboo (Nos) 256956 Nos. Ballies (Nos) 23223 Nos. of ballies Posts (Nos) 8071 Nos. Thatching leaves (Nos) 423440 Nos. Firewood (cum) 1169.290
4. Forest Registration: The Department has taken all measures necessary to increase
the extent of forests and tree cover in these Islands in conformity with the National Forest Policy,1988 and the prescriptions made in the working plans. As part of scientific management of forests, Department had undertaken various plantation/ aided natural regeneration activities over 3260.75 ha during 2016-17.
5. Revenue Collection: The department during 2016-17 has collected gross revenue of
Rs 2612.00 lakhs from timber sale and from other sources.
6. Eco tourism: There are 42 identified eco –tourist destinations maintained and facilitated by the Forest Department for the inclusive economic development of the islanders. Around 254250 Nos of visitors, including foreign nationals have visited the eco – tourist destinations during 2016-17.
Statement 7.4.5
Year No. of tourists visited 2012-13 125416 2013-14 102347 2014-15 708120 2015-16 101429 2016-17 254250
7. Strict compliance of Hon,ble Supreme Court directions:- The paradigm shift in forest
management came after the landmark judgment of Hon’ble Supreme Court dated 07.05.2002 wherein the Hon’ble Court had restricted the forestry operations to worked –out area sand there is no export of Timber from these Islands and the Department is meeting only the local demand of timber and NTFP. The current forests and wildlife management practices in A&N Islands have been influenced by factors such as demographic pressure on biological resources, National Forest Policy, 1988, orders of Hon’ble Supreme Court ,CRZ Notification, and international conventions priorities of Government of India, etc. The Forests and Wildlife of the Islands are scientifically managed as per the approved working plans and Management Plans.
Man days Generated: The Department has generated 211625 no. of mandays through employment during the year 2016-17
63
Statement 7.4.6
AREA BROUGHT UNDER SOCIAL FORESTRY
YEAR ROAD SIDE (in Km.)
ALONG COASTAL SITE (in Km)
BARREN LAND (in Hect.)
2012-13 35 28 - 2013-14 22.2 21.2 - 2015-16 28.5 - - 2016-17 27 14 -
Wood Pigeon: State bird: A & N Islands Dugong: State Animal: A & N Islands