Embed Size (px)
Citation preview

1 An Introduction to Photosynthesis in Aquatic Systems
Photosynthesis is the biological conversion of light energy to chemical bond energy that is stored in the form of organic carbon compounds. Approximately 45% of the photosynthesis on Earth each year occurs in aquatic environments (Falkowski 1994; Field et al. 1998). However, because we live on land and the aggregate biomass of aquatic plants amounts to less than 1% of the total photosynthetic biomass on our planet, terrestrial plants are much more a part of the human experience (Table 1.1). Consequently, the role and importance of aquatic photosynthetic organisms in shaping the ecology and biogeochemistry of Earth often is not appreciated by most students of photosynthesis.
In virtually all aquatic ecosystems, including the open ocean, lakes, continental margins, rivers, and estuaries, photosynthesis supplies the primary source of organic matter for the growth and metabolic demands of all the other organisms in the ecosystem. Hence, the rate of photosynthesis places an upper bound on the overall biomass and productivity of ecosystems and constrains the overall biological flow of energy on the surface of this planet. Over two billion years ago, aquatic photosynthetic organisms permanently altered Earth’s atmosphere through the addition of a highly reactive gas, oxygen (Farquhar et al. 2000; Bekker et al. 2004), a phenomenon that ultimately permitted multicellular animals, including humans, to evolve (Knoll 2003). A small fraction of the fossilized organic remains of aquatic photosynthetic organisms would become petroleum and natural gas that simultaneously fuels contemporary civilization and serves as chemical feedstocks for innumerable industries, including plastics, dyes, and pharmaceuticals. The fossilized remains of calcareous nanoplankton, deposited over millions of years in ancient ocean basins, are mined for building materials. Siliceous oozes are used as additives for reflective

2 | Chapter 1
TABLE 1.1 Comparison of global net productivity/living biomass in marine and terrestrial ecosystems
Net Primary Productivity Total Plant Biomass Ecosystem (1015 g year−1) (1015 g) Turnover Time (years)
Marine 45–55 1–2 0.02–0.06
Terrestrial 55–70 600–1000 9–20
After Field et al. (1998).
paints, polishing materials, abrasives, and insulation. Aquatic photosynthetic organisms are key sources of vitamins and other high-quality biochemicals. This list could go on, but our point is that an understanding aquatic photosynthesis is not merely an academic exercise. Rather it provides a vantage point from which to explore how living and fossil aquatic photosynthetic organisms have influenced the biological and geochemical history and dynamics of Earth.
Historically, most of the detailed biochemical, biophysical, and molecular biological information about photosynthetic processes comes from studies of higher plants and a few model algae, including Synechocystis, Chlamydomonas, Chlorella, and Phaeodactylum (Kaplan and Reinhold 1999; Harris 1989; Rochaix 1995; Grossman 2000). Traditionally, most model organisms have been chosen because they are easily grown or can be genetically manipulated rather than because they are ecologically important. There are significant differences between terrestrial and aquatic environments that affect and are reflected in photosynthetic processes. These differences have led to a variety of evolutionary adaptations and physiological acclimations of the photosynthetic apparatus in aquatic organisms that are without parallel in terrestrial plants. Moreover, there is sufficient knowledge of the basic mechanisms and principles of photosynthetic processes in aquatic organisms to provide a basic understanding of how they respond to changes in their environment. Such interpretations form the foundation of aquatic ecophysiology and are requisite to understanding both community structure and global biogeochemical cycles in marine and freshwater environments.
We strive here to describe some of the basic concepts and mechanisms of photosynthetic processes, with the overall goal of developing an appreciation of the adaptations and acclimations that have led to the abundance, diversity, and productivity of photosynthetic organisms in aquatic ecosystems. In this introductory chapter we briefly examine the overall photosynthetic process, the geochemical and biological evidence for the evolution of oxygenic photosynthetic organisms, and the concepts of life-forms and nutritional modes. Many of these themes are explored in detail in subsequent chapters.

An Introduction to Photosynthesis in Aquatic Systems | 3
A Description of the Overall Photosynthetic Process
The biological economy of Earth is based on the chemistry of carbon. The vast majority of carbon on Earth is in an oxidized, inorganic form;1 that is, it is combined with molecular oxygen and is in the form of the gas carbon dioxide (CO2) or its hydrated or ionic equivalents, namely bicarbonate (HCO3
−) and carbonate (CO3
2−). These inorganic forms of carbon are interconvertible but thermodynamically stable. They contain no biologically usable energy, nor can they be used directly to form organic molecules without undergoing a chemical or biochemical reaction. To extract energy from carbon or to use the element to build organic molecules, the carbon must be chemically reduced, which requires an investment in free energy. There are only a handful of biological mechanisms extant for the reduction of inorganic carbon; on a global basis photosynthesis is the most familiar, most important, and most extensively studied.
Photosynthesis can be written as an oxidation–reduction reaction of the general form
Pigment2H A + CO + Light → (CH O) + H O + 2A (1.1)2 2 2 2
Note that in this representation of photosynthesis light is specified as a substrate; the energy of the absorbed light is stored in the products. All photosynthetic bacteria, with the important exceptions of the cyanobacteria (including the prochlorophytes) and a group of aerobic photoheterotrophs (Kolber et al. 2000), are capable of fixing carbon only under anaerobic conditions and are incapable of evolving oxygen. In these organisms compound A is, for example, an atom of sulfur and the pigments are bacteriochlorophylls (Blankenship et al. 1995; van Niel 1941). All other photosynthetic organisms, including the cyanobacteria, prochlorophytes, eukaryotic algae, and higher plants, are oxygenic; that is, Eq. 1.1 can be modified to
Ch1 a2H O + CO + Light → (CH O) + H O + O (1.2)2 2 2 2 2
where Chl a is the ubiquitous plant pigment chlorophyll a. Equation 1.2 implies that somehow chlorophyll a catalyzes a reaction or a series of reactions whereby light energy is used to oxidize water:
Ch1 a +2H O + Light → 4H + 4e + O (1.3)2 2
1 The terms inorganic and organic are archaic, originating from the time when inorganic carbon compounds were obtained from minerals and organic compounds were obtained from plant or animal sources. For our purposes, we assume that an organic molecule contains a carbon atom that is directly, covalently linked to a hydrogen atom.

4 | Chapter 1
yielding gaseous, molecular oxygen. Equation 1.3 represents the so-called “light reactions” of oxygenic photosynthesis. The processes that constitute the light reactions are discussed in chapters 2 and 3.
Equation 1.3 describes an oxidation process. Specifically, it is a partial reaction, where electrons are extracted from water to form molecular oxygen. This process is the heart of one of two groups of reactions in oxygenic photosynthesis. The other reaction, the reduction of CO2, also can be described by
CO2 + 4H+ + 4e− → CH2O + H2O (1.4)
As free electrons are normally not found in biological systems, the reaction described by Eq. 1.3 and 1.4 requires the formation of an intermediate reducing agent that is not shown explicitly. The form of, and mechanism for, the generation of reductants is discussed in chapter 4.
Although the biological reduction of CO2 may be thermodynamically permitted on theoretical grounds by, for example, mixing a biological reducing agent such as NADPH with CO2, the reaction will not spontaneously proceed. Enzymes are required to facilitate the reduction process. Given the substrates and appropriate enzymes, the reactions that lead to carbon reduction can proceed in the dark as well as the light. These so-called “dark reactions” are coupled to the light reactions by common intermediates and by enzyme regulation. Although there are variations on the metabolic pathways for carbon reduction, the initial dark reaction, whereby CO2 is temporarily “fixed” to an organic molecule, is highly conserved throughout all photosynthetic organisms.2 We examine the dark reactions in chapter 5.
An Introduction to Oxidation–Reduction Reactions
The term oxidation was originally proposed by chemists in the latter part of the 18th century to describe reactions involving the addition of oxygen to metals, forming metallic oxides. For example,
3Fe + 2O2 → Fe3O4 (1.5)
The term reduction was used to describe the reverse reaction, namely, the removal of oxygen from a metallic oxide, for example, by heating with carbon:
Fe3O4 + 2C → 3Fe + 2CO2 (1.6)
2 Historically, the term fixation means to make nonvolatile. It is a term applied to the biochemical or chemical, but not physical, sequestration of a gas. Thus, adsorption of a gas by activated charcoal is not fixation, while the chemical reaction of CO2 with an amine to form a carbamate is a form of fixation. Strictly speaking, the term fixation is not synonymous with chemical reduction, although the two terms often are used interchangeably in the vernacular.

An Introduction to Photosynthesis in Aquatic Systems | 5
Subsequent analysis of these reactions established that the addition of oxygen is accompanied by the removal of electrons from an atom or molecule. Conversely, reduction is accompanied by the addition of electrons. In the specific case of organic reactions that involve the reduction of carbon, the addition of electrons is usually balanced by the addition of protons. For example, the reduction of carbon dioxide to formaldehyde requires the addition of four electrons and four H+—that is, the equivalent of four hydrogen atoms:
O � C � O + 4e− + 4H+ → CH2O + H2O (1.7)
Thus, from the perspective of organic chemistry, oxidation may be defined as the addition of oxygen, the loss of electrons, or the loss of hydrogen atoms (but not hydrogen ions, H+); conversely, reduction can be defined as the removal of oxygen, the addition of electrons, or the addition of hydrogen atoms.
Oxidation–reduction reactions only occur when there are pairs of substrates, forming pairs of products:
Aox + Bred ) Ared + Box (1.8)
In oxygenic photosynthesis, CO2 is the recipient of the electrons and protons, and thus becomes reduced (it is the A in Eq. 1.8). Water is the electron and proton donor, and thus becomes oxidized (it is the B in Eq. 1.8).The oxidation of two moles of water (Eq. 1.3) requires the addition of 495 kJ. The reduction of CO2 to the simplest organic carbon molecule, formaldehyde, adds 176 kJ of energy. The energetic efficiency of photosynthesis can be calculated by dividing the energy stored in organic matter by that required to split water into molecular hydrogen and oxygen. Thus, the maximum overall efficiency of photosynthesis, assuming no losses at any intermediate step, is 176/495 or about 36%. We discuss the thermodynamics of oxidation–reduction reactions more fully in chapter 4.
The Photosynthetic Apparatus
The light reactions and the subsequent movement of protons and electrons through the photosynthetic machinery to form chemical bond energy and reductants are reactions associated with, or occurring in, membranes (Anderson and Andersson 1988; Staehelin 1986). The fixation and subsequent biochemical reduction of carbon dioxide to organic carbon compounds are processes occurring in the aqueous phase, that is, not in membranes. The ensemble of the biochemical elements that facilitate these processes constitute the photosynthetic apparatus. In most anaerobic photosynthetic bacteria and cyanobacteria, the photosynthetic light reactions are organized on membranes that are arranged in sheets or lamellae adjacent to the periplasmic membrane (Blankenship et al. 1995; Bryant 1994) (Fig. 1.1a). The dark reactions are generally localized in the

6 | Chapter 1
0.5 µm
Thylakoid membrane (lp)
Cytosol (N)
Thylakoid lumen (P) Cytosol (N) Cytoplasmic membrane (lp) Periplasmic space (P)
TM
CM
+
+
−
−
(a)
Figure 1.1 Schematic diagrams and electron micrographs showing the membrane structure of (a) a
cyanobacterial cell and (b) a green algal chloroplast. In cyanobacteria, the cell is surrounded by a wall and
outer membrane that is separated from the plasma membrane by a periplasmic space. In the chloroplast,
two or more (depending on the algal class, see Table 1.4) envelope membranes separate the organelle
from the cytosol. Membranes provide electrical resistance to the movement of ions. The abbreviation (lp)
indicates hydrophobic lipoprotein; all others are aqueous phases. The terminology of the N and P aque
ous phases follows the nomenclature introduced by Mitchell and refers to the orientation of the mem
brane with respect to transport of positively charged ions (i.e., cations). In the case of photosynthetic
membranes, the major cation transported is H+. Active proton transport induces an electrochemical po
tential. The side from which protons are extracted becomes electrically negative relative to the side to
which the protons are deposited. N phases include the thylakoid stroma and the cytosol. The aqueous N
phases contain a relatively high diversity of proteins (e.g., enzymes), have functional nucleic acids, and
are where adenine and pyridine nucleotides interact with hydration–dehydration and oxidation–reduction
reactions. P phases include the thylakoid lumen and intermembrane spaces. Whereas P phases may have
high concentrations of proteins, the diversity of the proteins is relatively low. Active protein transport does
not occur at the porin-containing outer membrane of cyanobacteria or outer envelope membrane of the
chloroplast, although the N and P terminology is still applicable to the compartments in terms of protein
diversity. (The electron micrograph of the cyanobacterium was kindly provided by John Waterbury.)
center of the cell. In eukaryotic cells, the photosynthetic apparatus is organized in special organelles, the chloroplasts, which contain alternating layers of lipoprotein membranes and aqueous phases (Staehelin 1986) (Fig. 1.1b).
The lipoprotein membranes of eukaryotic cell chloroplasts are called thylakoids,3 and contain two major lipid components, mono- and digalactosyldiacylglycerol (MGDG and DGDG, respectively), arranged in a bilayer approximately 4 nm thick (1 nm = 10−9 m = 10 Å) in which proteins and other functional molecules are embedded (Singer and Nicolson 1972) (Fig. 1.2). Unlike most of
3 Derived from the Greek thylakos, meaning “a sack.”

An Introduction to Photosynthesis in Aquatic Systems | 7
Cytosol (N phase)
Inner Inner envelope membrane membrane space (lp) (P phase)
Thylakoid Stroma membrane (N phase) (lp)
Thylakoidlumen(P phase)
(b)
Figure 1.1 (continued )
the lipids associated with membranes in a cell, the lipids in thylakoid membranes are not phospholipids (Murphy 1986). Like most biological membranes, thylakoids are not symmetrical; that is, some of the components span the membrane completely, whereas others are embedded only partially (Cramer and Knaff 1990). The thylakoid membranes form closed vesicles around an aqueous, intrathylakoid space. This structure is analogous to the pocket in pita bread, the pocket being called the lumen. The proteins and pigments that constitute the two light reactions, as well as most of the electron transfer components that link them, and the catalysts involved in oxygen evolution and ATP synthesis are organized laterally along the membrane (Fig. 1.3). In addition, although there are some important exceptions, thylakoid membranes contain the major light-harvesting pigment–protein complexes; hence, when isolated from cells, thylakoids are characteristically colored (Larkum and Barrett 1983; Green and Durnford 1996).
Surrounding the thylakoids is an aqueous phase, the stroma. Soluble proteins in the stroma use chemical reductants and energy generated by the biochemical reactions in the thylakoid membranes to reduce CO2, NO2
−, and SO42−,
thereby forming organic carbon compounds, ammonium and amino acids, and organic sulfide compounds, respectively. The stroma also contains functional DNA (nucleoids), ribosomal (r), messenger (m), and transfer (t) RNAs, as well as all the associated enzymes for transcription and translation of the chloroplast genome (Kirk and Tilney-Bassett 1978; Reith and Munholland 1993; Grzebyk et al. 2003).
The stroma, in turn, is surrounded by two to four plastid envelope membranes
Outer envelope membrane (lp)
+ +
++ + +
−
− − −

(b)
Figure 1.2 (a) Structure of two of the most important lipids that make up thylakoid membranes:
monogalactosyl diacylglycerol (MGDG) and digalactosyl diacylglycerol (DGDG). In the formation of
membranes, the polar sugar groups face the aqueous phases, while opposing nonpolar alkyl groups are
oriented toward each other to form a lipid bilayer. The width of the bilayer is approximately 4 nm. (b) A
schematic diagram of a thylakoid membrane (modified from Singer and Nicolson 1972). Thylakoid mem
branes are largely composed of MGDG and DGDG with other polyunsaturated fatty acids. Proteins are
oriented within the membrane in a nonrandom fashion. Some proteins span the membrane, whereas
others may only partially protrude. The proteins will have specific “sidedness,” with some functional
groups facing the lumen and others facing the stroma.

An Introduction to Photosynthesis in Aquatic Systems | 9
Figure 1.3 Schematic cross section through a photosynthetic (i.e., thylakoid) membrane showing the
orientation and some of the major components of the photosynthetic apparatus. The complete mem
brane forms a closed vesicle. The electron-transport chain is indicated by solid arrows; proton transport is
indicated with dashed lines. Electrons extracted from water in photosystem II (PSII) are sequentially trans
ferred to the cytochrome b6/f complex (cyt bf ), and thence through either plastocyanin (PC) or another
cytochrome (cytochrome c553, also called c6) to photosystem I (PSI), where they are used to reduce NADP
to NADPH. Abbreviations: Yz, a tyrosine that is the immediate electron donor to the PSII chlorophyll P680;
P680 and P700, the reaction center chlorophyll a molecules of PSII and PSI, respectively; Pheo, a phaeophy
ton a molecule; QA, a bound plastoquinone; PQ, free (i.e., mobile) plastoquinone; PQH2, free plasto
quinol (reduced form of plastoquinone); bL and bH, low and high potential for of cytochrome b6; FeS,
iron–sulfur components in the cytochrome b6/f complexes and on the reducing side of PSI; f, cytochrome
f; PC, plastocyanin; A0, the immediate electron acceptor from P700 (a chlorophyll a molecule); A1, phyllo
quinone; Fd, ferredoxin; FNR, ferredoxin/NADP oxidoreductase; NADPH, reduced nicotinamide adenine
dinucleotide phosphate; ADP, adenosine diphosphate; ATP, adenosine triphosphate; Pi, inorganic phos
phate; +/−, polarity of electrical potential difference across the membrane established in the light;
RuBP, ribulose-1,5-bisphosphate; Rubisco, ribulose-1,5-bisphosphate carboxylase/oxygenase; PGA, 3
phosphoglycerate; (CH2O)n, generalized carbohydrate. The stoichiometry of protons, electrons, O2, ATP,
NADPH, and CO2 is not indicated. (Modified from Whitmarsh and Govindjee 1995.)
(depending on the organism) that, in some organisms, are connected to the nucleus and separated from each other by an aqueous intermembrane compartment (Berner 1993). The inner envelope membrane has a number of integral membrane proteins, which selectively transport photosynthetic substrates into the stroma and photosynthetic products out of it. The outer envelope membrane also has integral membrane proteins, called porins, which permit nonselective transport of solutes less than about 800 Da,4 such as CO2, O2, inorganic phosphate, ATP, and so on (Raven and Beardall 1981b).
4 A dalton (Da) is a unit of mass equal to 1⁄12 of the mass of the carbon atom.
10 | Chapter 1
The Role of Membranes in Photosynthesis
The structure of the chloroplast illustrates some important features of photosynthetic processes. All photosynthetic organisms, whether they be prokaryotes, eukaryotic algae, or higher plants, use membranes to organize photosynthetic electron transport processes and separate these processes from carbon fixation (Bryant 1994; Drews 1985; Redlinger and Gantt 1983). Biological membranes serve many purposes. One is to control the fluxes of solutes between compartments within cells and between cells. A second is to separate electrical charges across the membrane. Finally, membranes facilitate spatial organization of chemical reactions. These three roles of membranes are related to each other.
Chemical reactions are scalar processes—they have no intrinsic relationship to their spatial environment. The orientation of proteins and prosthetic groups within membranes allows the coupling of scalar photochemical reactions to vectorial fluxes of electrons, ions, and neutral solutes (Cramer and Knaff 1990). In the context of the photosynthetic apparatus, “vectorial” refers to a process whereby specific products of biochemical reactions accumulate on only one side of a thylakoid membrane, thereby forming concentration gradients across the membrane. The vectorial translocation of ions and electrons helps establish an electrical field across the membrane. Because membranes allow for spatial organization of enzymes and other proteins, mechanical (vectorially oriented) actions, on a molecular scale, can be coupled to the dissipation of the electrochemical (scalar) energy. For example, protons can be transported from one side of a membrane to other at the expense of ATP hydrolysis, and vice versa. These processes, which would be energetically futile in solution, are highly profitable when employed by a membrane.
Evolution of Oxygenic Photosynthesis: Geochemical Evidence
The evolution of biological membranes is obscure, but must have been one of the earliest processes in the origins of life on Earth (Benner et al. 2002). The origins of photosynthesis are also obscure, but geochemical imprints and molecular biological inferences can be used to reconstruct some of the key events.
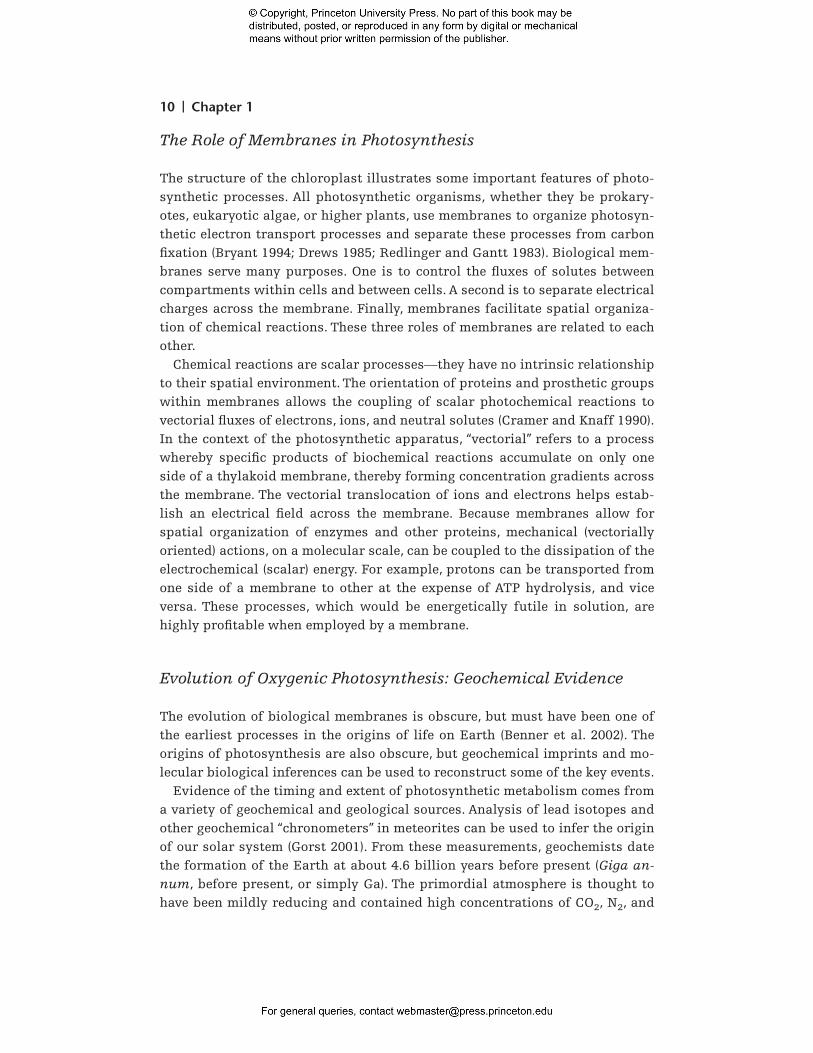
Evidence of the timing and extent of photosynthetic metabolism comes from a variety of geochemical and geological sources. Analysis of lead isotopes and other geochemical “chronometers” in meteorites can be used to infer the origin of our solar system (Gorst 2001). From these measurements, geochemists date the formation of the Earth at about 4.6 billion years before present (Giga annum, before present, or simply Ga). The primordial atmosphere is thought to have been mildly reducing and contained high concentrations of CO2, N2, and

An Introduction to Photosynthesis in Aquatic Systems | 11
CH4 together with traces of H2, HCN,5 H2S, and NH3, but to have been devoid of O2 for the first 2.3 Ga of Earth’s history (Holland 1984; Kasting et al. 1988; Kasting and Siefert 2002). Today the Earth’s atmosphere contains 78% N2, 21% O2, and 0.038% CO2 by volume, and is strongly oxidizing. All of the molecular oxygen present in the Earth’s atmosphere has been produced as the result of oxygenic photosynthesis; the source of the original O2 was photosynthetic activity in the Proterozoic oceans (Kasting 1993a; Wiechert 2002). In the 550 million years prior to the combustion of fossil fuels by humans, the reservoir of atmospheric O2 varied from a low of approximately 10% to a high of about 35% (Berner 1991; Falkowski et al. 2005). The changes were primarily driven by tectonic processes which control the burial of organic carbon in sediments and the oxidation of organic matter through weathering (Berner and Canfield 1989; Katz et al. 2004; Falkowski et al. 2000, 2005).
The development of aquatic photosynthesis coincided with a drawdown of atmospheric CO2, from concentrations approximately 100-fold higher than in the present-day atmosphere to approximately half of the present levels (Fig. 1.4).
(a) Millions of years before present
Figure 1.4 (a) A reconstruction of variations in the partial pressures of CO2 and O2 in the atmosphere
through geological time using data from Berner (1990, 1993) and Berner and Canfield (1989) for the
post-Cambrian epochs (i.e., the Phanerozoic). The absolute values and timing for the evolution of oxygen
are not constrained in the Proterozoic epoch. (b) Major geological and biological epochs and their char
acteristics regarding the evolution of photoautotrophs in aquatic environments.
5 Note that HCN is, by our earlier definition, an organic molecule that existed in the Earth’s atmosphere prior to the origin of life.
100
30 0
40 30 20 10 0
200
300
400
1000
2000
3000
CO2
O2
CO
2 (P
a)O
2 (k
Pa)
3500 3000 2500 2000 1500 1000 500 400 300 200 100 0550
ARCHAEAN PROTEROZOIC PHANEROZOIC
E M L O S D C P T J K TRC

Events in Earth history
Glacials-Interglacials Beginning of climatic cooling
Closing of Tethys
Warm Earth; “anoxic events”
Opening of Atlantic Oceanbreak-up of Gondwana
Glaciation
Assembly of Pangaea
Glaciation
Opening of Iapetus
CaCO3 and SiO2 biomineralization by animals
Radiation of large animals
Break-up of supercontinent
Ice ages
Appearance of stablyoxic environments
Glaciation
Widespread craters appear
Rapid accretion of continental crust
Decreasing importance of bolide bombardment
Earth formed
Figure 1.4 (continued )
Events in marine Events in prokaryotic animal evolution and protistan evolution
Increasing provinciality Major diatom radiation; Turnover in animals increasing provinciality
Major animal extinctions Major turnover in microplankton
4600
40
0035
0030
0025
0020
0015
0010
0055
050
040
030
020
010
00
Mill
ions
of y
ears
bef
ore
pres
ent
Q T
K
J
T
P
C
D
S
O
C
AR
CH
AE
AN
HA
DA
EA
N
PR
OT
ER
OZ
OIC
P
HA
NE
RO
ZO
ICP
aleo
zoic
M
esoz
oic
Cen
ozoi
c
R
Major extinctions
High protistan species diversity; diatom radiation
Radiation of planktic foraminifera
Radiation of dinoflagellates, nonnoplankton
Significant animal extinctions
Major animal extinctions Major extinctions
Fusulinid radiation
Major animal extinctions Microplankton and calcareous algal extinctions
MicroplanktonMajor animal extinctions extinctions
Renewed radiation of planktic protists
Protistan radiation; SiO2, CaCO3, and agglutinated skeletons
Renewed animal radiation
Radiation of skeletonized metazoa
Radiation of microplankton, benthic foraminifera; SiO2 and CaCO3 biomineralization
Extinction of large, morphologically complex acritarchs
Morphologic radiation of acritarchs
Earliest geologic evidence of eukaryotes
Widespread stromatolites
Aerobic metabolism; eukaryotes acquire mitochondria and later chloroplasts
Oldest geologic evidence of life
Origin of life; diversification of anaerobic archaebacteria and eubacteria; possible origin of eukaryotic cytosol
(b)

Mill
ions
of y
ears
bef
ore
pres
ent
0
4600
40
0035
0030
0025
0020
0015
0010
0055
050
040
030
020
010
0
Q T
K
J
T
P
C
D
S
M
C
AR
CH
AE
AN
P
RO
TE
RO
ZO
IC
PH
AN
ER
OZ
OIC
Pal
eozo
ic
Mes
ozoi
c C
enoz
oic
R
L
E
O
HA
DE
AN
O2
evol
ving
Ps
Cya
noba
cter
ia
Ter
rest
rial e
cosy
stem
s
Euk
aryo
tic a
lgae
of u
ncer
tain
affi
nitie
s
Rho
doph
yta
Ulv
ophy
ceae
Chl
orop
hyce
ae
Pra
sino
phyc
eae
Cha
roph
ycea
e
Bry
ophy
ta
Vas
cula
r pl
ants
(pt
erid
ophy
tes)
Vas
cula
r pl
ants
(gy
mno
sper
ms)
Vas
cula
r pl
ants
(flo
wer
ing
plan
ts)
Din
ophy
ta
Hap
toph
yta
Bac
illar
ioph
ycea
e
Trib
ophy
ceae
Chy
trid
s
Zyg
omyc
etes
(in
clud
ing
Glo
mus
)
Asc
omyc
etes
(fu
ngi)
Bas
idio
myc
etes
Art
hrop
ods
(mar
ine)
Art
hrop
ods
(ter
rest
rial)
Ver
tebr
ates
(m
arin
e)
Ver
tebr
ates
(te
rres
tria
l)
Embryophyta
Hetero- Fungi Metazoa kontophyta
Chlorophyta
Viridiplantae
Figure 1.4 (continued ) (b)

14 | Chapter 1
This drawdown was accompanied by a simultaneous evolution of oxygen from nil to approximately 10 kPa, that is, about half that of the present day (Berner 2001). Over geological timescales, the drawdown of CO2 was not stoichiometrically proportional to the accumulation of O2 because photosynthesis and respiration are but two of the many biological and chemical processes that affect the atmospheric concentrations of these two gases.
The “Slow” Carbon Cycle
On timescales of tens of millions of years, the concentration of CO2 in Earth’s atmosphere and oceans is constrained primarily by vulcanism and the chemical weathering of continental rocks. Tectonic processes, driven by the internal heat of the planet, continuously sweep the oceans’ sedimentary layers into the mantle of Earth, to be later regurgitated by vulcanic processes as igneous rocks. In so doing, carbon dioxide is outgassed to the atmosphere, where it combines with water to form carbonic acid. Neutralization of the excess protons is accomplished by the chemical erosion of alkaline metals,
Magma
CO2
CO2
CO2
release
Mid-ocean ridge
Carbonate metamorphism
(Ca, MgSi)
Subducting plate
CO2 CO3 + Ca++, Mg++
Ca(Mg)CO3
2−
Figure 1.5 Schematic diagram of the “slow” carbon cycle. Carbon dioxide, released to the at
mosphere from volcanism, combines with water vapor to form carbonic acid, which precipitates
over calcium/magnesium silicate rocks on land. The carbonic acid leaches the cations from the
silicates, allowing them to flow to the oceans in rivers, where they are precipitated as
calcium/magnesium carbonates. The carbonates are subducted through tectonic processes into
the upper mantle, where they are heated and the CO2 is released back to the atmosphere
through vulcanism. This carbon cycle overwhelmingly controls the concentration of CO2 in
Earth’s atmosphere on time scales of hundreds of millions of years.

An Introduction to Photosynthesis in Aquatic Systems | 15
primarily calcium and magnesium silicates in rocks (Fig. 1.5). The overall reaction is
Ca(Mg)SiO3 + CO2 → Ca(Mg)CO3 + SiO2 (1.9)
The mobilization of HCO3 − in the aqueous phase delivers inorganic carbon
to the oceans to be precipitated as magnesium and calcium carbonates (dolomites and limestones). On long timescales (hundreds of millions of years), the rate of vulcanism must closely match the rate of weathering, or the atmosphere/ocean system would gain or lose carbon dioxide. Increased vulcanism, leading to a greater rate of carbon dioxide supply, increases the acidity of rain and promotes more weathering. Conceptually, that simple negative feedback stabilizes carbon dioxide, but there were several periods in Earth’s history when the system went somewhat out of control.
Several geochemical signatures for the time of rise of oxygen in Earth’s atmosphere can be inferred from the fossil record. Two are based on the changes in the isotopes of sulfur (Canfield and Raiswell 1999; Farquhar et al. 2000). Prior to the evolution of oxygenic photosynthesis, sulfur in the oceans was a mixture between H2S and SO4
2−. Some anaerobic bacteria chemically reduce SO4
2−
to H2S in order to oxidize organic matter (this is a type of anaerobic respiratory pathway). In so doing, they discriminate against the heavier isotopes of sulfur in the SO4
2−. As oxygen becomes increasingly abundant, H2S becomes in
creasingly scarce, and the isotopic composition of sulfates, precipitated in mineral phases of ancient rocks, changes. The change in isotopic composition seems to have occurred approximately 2.2 to 2.4 Ga.
A second line of evidence for the change in the oxidation state of Earth can be inferred from the “mass independent” isotopic fractionation of SO4. Sulfate oxidation by ultraviolet radiation from the Sun also leads to an isotopic fractionation of sulfur, but one that differs from the biological fractionation described above. When high concentrations of oxygen accumulate in Earth’s atmosphere, the gas ozone (O3) is formed, which blocks the ultraviolet radiation from reaching Earth’s surface. Examination of sulfur isotopes in igneous rocks suggests that oxygen rose in the atmosphere between 2.4 and 2.1 Ga (Farquhar et al. 2000). This isotopic change implies an oxidation of the atmosphere over this period of time, i.e., a source of oxygen consistent with the evolution of oxygenic photosynthesis.
A third proxy is the oxidation state of iron–sulfur minerals (pyrite) on land. As atmospheric oxygen rose, the iron and sulfur oxidized. By dating these preserved “paleosols” one can reconstruct a period when the atmosphere became oxidized (Rye and Holland 1998). The results of such analyses suggest a large

16 | Chapter 1
change in the oxidation state of Earth’s atmosphere occurring at approximately 2.3 Ga (Bekker et al. 2004).
A fourth geochemical clue to the origin of oxygen can be gleaned from the distribution of uranium in sediments. Uraninite, UO2, is a detrital mineral that is presumed to have been produced when the Earth was formed and naturally occurs in igneous rocks. Under anaerobic (i.e., reducing) conditions, the valence state of U is +4, and detrital UO2, produced by the weathering of the igneous source rocks, is transported in sediments in aquatic environments without further chemical reaction. However, when O2 concentration in seawater becomes greater than about 1% of the concentration that would be at equilibrium with the O2 in the present-day atmosphere, U becomes oxidized to the +6 valence
Terminology of Geological Epochs
The terminology of geological time is a historical idiom that developed from the early investigations of rock formations. In the early 19th century, two British geologists, Rev. Prof. Adam Sedgwick and Prof. Roderick Impey Murchison, examined the structure of the exposed rock formations in Wales. The lowest—and therefore oldest—identifiable formation was called the Cambrian, a term derived from the latinization of “Wales.” This period, subsequently dated by isotopic measurements, began approximately 545 Ma. Consequently, all periods prior to the Cambrian are called Precambrian. The Precambrian is subdivided into two major eons: the Archean (4.6 to 2.5 Ga), and Proterozoic (2.5 Ga to 550 Ma).
All geological periods following the Cambrian are collectively called the Phanerozoic (meaning “obvious” or “visible” life). The Cambrian period was succeeded by a distinctly different formation containing different fossils, and came to be known as the Ordovician, a term derived from the Latin of a tribe that had inhabited the north of Wales. Similarly, the next period, Silurian, was named after another Welsh tribe, and the Devonian was named after the county of southwest England where the original geological formation and fossils that define that period were discovered. There are parallel names in the geological literature for common geological periods and stages (smaller sets of time within periods), based on the specific location in which the formations were discovered and the nationality of the discoverers. For example, the Carboniferous period, occurring between 375 and 310 Ma, is subdivided into the earlier Mississippian and later Pennsylvanian epochs in many geological texts published in the United States (Table 1.2). Prior to the use of naturally occurring radioactive elements to date the various periods, it was not possible to discern their actual chronology (Turekian 1996).

An Introduction to Photosynthesis in Aquatic Systems | 17
TABLE 1.2 Scale of geological time: The major geological epochs
Era Period or
Epoch Beginning and End, in
106 years before present Approximate Duration,
in 106 years
Quaternary Holocene Pleistocene
0.010–0.001 0.010–1.6 ± 0.050
0.011.6 �
Cenozoic Tertiary Pliocene Miocene Oligocene Eocene
1.6–5.1 5.1–24 24–38 38–55
9 15 15 69 20 �
Paleocene 55–68 10
Mesozoic Cretaceous Jurassic Triassic
68–144 144–200 200–250
76 56 182 50 �
Paleozoic Permian Carboniferous
Pennsylvanian Mississippian
Devonian Silurian Ordovician
250–285 285–360 285–320 320–360 360–410 410–440 440–505
35 75
50 290
30 65
� Cambrian 505–550 45
Precambrian Late Proterozoic Middle Proterozoic Early Proterozoic Archean
550–700 750–1500
1500–2500 2500–4000
150 750
1000 4200 1500 �
Hadean 4000–4800 800
state. In the presence of anions such as HCO3 −, a dicarbonate precipitate,
UO2(CO3)22−, can be formed by the reaction
UO2 + 1⁄2O2 + 2HCO3 − ) UO2(CO3)2
2− + H2O (1.10)
The radioactive half-life for 238U is 4.51 billion years. From knowledge of the oxidation state of uranium in relict sedimentary (i.e., metamorphic) rocks and the relative abundance of the parent isotope and its daughter products, it is possible to estimate the date of oxygen evolution. Assuming that the only source of oxygen was photosynthesis, this approach constrains the buildup of oxygen from oxygenic photosynthesis to between 2.5 and 2.7 Ga (Holland 1984).
While all these geochemical proxies suggest that the atmosphere became oxidized sometime between 2.6 and 2.2 Ga, it is not clear that the interior of the ocean was oxidized. Oxidation of the ocean is achieved by mixing atmospheric oxygen into waters that will sink into the ocean interior. The isotopic and geochemical (trace element) data suggest that the ocean interior remained

18 | Chapter 1
relatively anoxic for an extended period, perhaps until 1.8 Ga (Anbar and Knoll 2002). For example, when the ocean becomes oxidized, some transition metals such as iron (Fe3+) or manganese (Mn4+) are precipitated as oxides. Iron is the most abundant transition metal in the Earth’s crust. In its reduced, ionic form, Fe2+, it is relatively soluble in seawater; in its oxidized, ionic form, Fe3+, it is highly insoluble. The oxidized forms of iron are complexed with oxygen and hydroxides and vast quantities of Fe3+-containing minerals precipitated in the Precambrian oceans, forming bands of red minerals between darker strata. Based on the stratigraphy and elemental composition of these banded iron formations, the precipitation appears to have occurred over several hundred million years. It is sometimes inferred that the precipitation was brought about due to the endogenous production of oxygen by photosynthetic organisms in the Precambrian seas (Bjerrum and Canfield 2002).
Best-guess reconstructions from geochemical and geological evidence suggest that photosynthetic oxygen production probably occurred primarily in relatively small, shallow regions of coastal seas, such as those inhabited by microbial mat communities as are found in many tropical continental margins in the modern ocean. The oxygen produced in such mats was largely consumed in situ by the oxidation of inorganic elements, leading to the precipitation of iron- and manganese-containing sediments to the Precambrian seafloor (Knoll and Bauld 1989; Anbar and Knoll 2002). During this early period in the biogeochemical evolution of the Earth, there was a net oxidation of mineral elements, and organic compounds formed by photosynthetic processes were likely not reoxidized by heterotrophic metabolism, which left a net accumulation of photosynthetically fixed organic carbon in the environment (Falkowski 2002). A small fraction of this organic carbon was deposited in shallow seas (Berner 1980). Geochemical aging (diagenesis) and burial of these ancient deposits led to the formation of shales—rocks that typically contain between 1 and 10% organic carbon. A vanishingly small fraction of the organic carbon that was buried in shallow seas was subjected to heat and pressure and, over millions of years, was transformed to become the petroleum and natural gas that literally fuel the industrial world in the present geological period.
Some aquatic photosynthetic organisms also precipitate inorganic carbon to form calcareous shells (Holligan and Robertson 1996). This reaction can be described as
Ca2+ + 2HCO3 − → CaCO3 + CO2 + H2O (1.11)
Calcium carbonate is highly insoluble in seawater, and over hundreds of millions of years vast deposits of the fossilized remains of relic calcareous shells produced by a variety of marine organisms formed the bedrock of what subsequently became major mountain ranges, from the Alps to the Andes and the Himalayas.

An Introduction to Photosynthesis in Aquatic Systems | 19
The Evolution of Photosynthetic Organisms: Biological Evidence
The evolution of oxygenic photosynthesis can also be reconstructed or inferred by comparing the features of extant photosynthetic organisms. A comparison of genetic information among a variety of photosynthetic organisms suggests the earliest photosynthetic organisms evolved approximately 3.4 Ga as anaerobic bacteria (Blankenship 2001; Xiong et al. 2000). These organisms used light energy to extract protons and electrons from a variety of donor molecules, such as H2S, and carbohydrates, to reduce CO2 to form organic molecules. Anaerobic photosynthetic processes were probably among the first energy-transforming processes to appear on Earth, and proceeded without the evolution of molecular oxygen (Blankenship 1992). Three basic types of anaerobic photosynthetic reactions appear to have evolved and have persisted to the present time. One, typified by the heliobacteria and green sulfur bacteria such as Chlorobium, uses iron–sulfur clusters as an electron acceptor. A second, typified by the purple photosynthetic bacteria and Chloroflexus, uses phaeophytin and a quinone as an electron acceptor. Oxygen-tolerant, but not oxygen-producing, relatives of the purple photosynthetic bacteria are found extensively in the modern oceans (Kolber et al. 2000). Finally, a third type uses a caroteinoid pigment protein, bacteriorhodopsin or halorhodopsin, to “pump” protons out of the cell or chloride ions into the cell without the need for a reaction center or associated antenna pigments (Fig. 1.6). This type of photosynthetic pathway was originally discovered in Archaea from hypersaline lakes (Hader and Tevini 1987) and was thought to be rare, but genomic analyses suggest bacteria with this pathway are widely distributed in the oceans (Beja et al. 2000). The bacteriorhodopsin/halorhodopsin have evolved independently of the (bacterio-)chlorophyll-based types of bacterial photosynthetic processes. Functional (Nitschke and Rutherford 1991) and structural (Schubert et al. 1998) analyses suggest that the two (bacterio-)chlorophyll-based processes share a common photosynthetic ancestry (Blankenship 2002). No known anaerobic photosynthetic bacteria contain more than one type of photosynthetic process (Blankenship 1992).
Best-guess reconstructions of the scant fossil and geochemical evidence6 suggest that some 300 to 500 million years following the appearance of anaerobic photosynthetic bacteria, oxygen-producing photosynthetic organisms emerged in the oceans (Des Marais 2000). Although purported fossils of these cells have been described from rocks as old as 3.45 billion years ago (Schopf 1978, 1983, 1993), the interpretation of these structures has been questioned (Brasier et al.
6 The evidence is scant because there are few sedimentary rock formations on Earth from Archean and early Proterozoic eons to begin with, and many have been undergone some metamorphosis (i.e., subjected to heat, or in the parlance of geologists, “cooked”).

20 | Chapter 1
Pro
ton
grad
ient
∆pH
H+
H+
H+
H+ NADPH NADP
dissolved organics
Respiratory chain
ATP ADP + Pi
bacteriorhodopsin
Sym
port
organicsP
hoto
synt
hesi
s
CO2
CO2 organics + O2
Na+
H+ hν
H+
Na+ H+
Figure 1.6 Schematic representation of bacteriorhodopsin-based photosynthesis. In these organisms,
light energy, absorbed by bacteriorhodopsin in the plasma membrane is used to generate a proton gradi
ent, from which ATP can be formed and organic substrates can be imported. The oxidation of organic
matter is used to generate reductant, while the formation of ATP is an energy source. The reductant is
used to rereduce CO2 to organic matter. This basic type of pathway is called photoheterotrophy.
2002). There is more compelling evidence that cyanobacteria were present in the oceans 2.85 billion years ago based on the distribution of specific lipids that are preserved in sedimentary rocks (Summons et al. 1999). These results do not imply that cyanobacteria originated at that time, but rather that they were present then; they may well have originated earlier (Fig. 1.7). It seems, however, that aquatic photosynthetic organisms began oxidizing the atmosphere more than 400 million years after they first appeared. The oxidation step appears to have been hampered by the availability of nutrients, such as phosphorus (Bjerrum and Canfield 2002) and nitrogen (Falkowski 1997; Fennel et al. 2005). However, by approximately 1.9 Ga, the atmosphere contained significant quantities of oxygen, and Earth was permanently transformed. The rise of oxygen permitted the rise of a much more efficient respiratory pathway, but simultaneously poisoned most habitats for the anaerobic bacteria. Subsequently, the ecological and biogeochemical role of anaerobic photosynthetic bacteria has been one more of evolutionary curiosity than biogeochemical linchpin.
There is striking homology, however, between the proteins found in the two anaerobic photosynthetic bacteria that have reaction centers and the photosynthetic apparatus of oxygenic cyanobacteria, unicellular eukaryotic algae, seaweeds, and higher plants (Barber 1992; Blankenship 1992; Bryant 1994; Michel and Deisenhofer 1988; Reith 1995). Based on this homology, it is

An Introduction to Photosynthesis in Aquatic Systems | 21
(b)(a)
(c)
(e)
(f)
(d)
Figure 1.7 Photomicrographs of cyanobacteria from the Archean to late Proterozoic eons. (a) Carbona
ceous spheroids of uncertain biological origins, Onverwacht Group (3.45 Ga), South Africa (from Knoll
and Barghoorn 1977); (b) cyanobacterial trichome, ca. 1.5 Ga Bil’yakh Group, northern Siberia (from
Sergeev et al. 1995); (c) entophysalid cyanobacteria from the mid-Proterozoic (ca. 1.5–1.3 Ga) Debengda
Formation, northern Siberia (from Sergeev 1994); (d) entophysalid cyanobacteria, ca. 1.5 Ga Bil’yakh
Group, northern Siberia (from Sergeev et al. 1995); (e) endolithic cyanobacterium in silicified ooids, ca.
800 Ma Upper Eleonore Bay Group, East Greenland (from Green et al. 1988); (f ) cyanostylon-like stalked
cyanobacterium, ca. 800 Ma Draken Formation, Svalbard (from Green et al. 1987). Note that the older
the fossils, the more difficult it is to ascribe morphological characteristics with certainty.

22 | Chapter 1
assumed that the photoreaction responsible for the oxidation of water (photosystem II) is derived from an organism resembling the relict purple photosynthetic bacteria, while the second photoreaction (photosystem I), found in all oxygenic photoautotrophs, arose from the green sulfur bacterial line. (We discuss these two photosystems in chapters 2, 4, and 6.)
Since the first appearance of aquatic oxygenic photosynthetic organisms, approximately 12 divisions (or phyla) of unicellular and multicellular algae have evolved, and there is no place on Earth where photosynthetic organisms cannot be found if liquid water and light are available for at least part of the year (Cavalier-Smith 1993a) (Table 1.3). Although the earliest oxygenic photosynthetic organisms were prokaryotes, all but one of the 12 recognized algal divisions are eukaryotic. Eukaryotic cells appear to have arisen between 2.5 and 2.0 billion years ago (Brocks et al. 1999; Embley and Martin 2006). Based on the structure of fossils that are ca. 1200 million years old, the first eukaryotic algae referable to a modern algal class resemble members of the extant red algal family Bangiophyceae (Butterfield 2000; Butterfield et al. 1990) (Fig. 1.8).
The Origin and Phylogeny of Prokaryotes
The determination of evolutionary relationships has been greatly aided by molecular biological methods. Molecular techniques permit quantitative measurement of the genetic diversity of organisms. One of the most common approaches to deducing diversity compares nucleic acid sequences, especially those obtained from ribosomal RNA genes (Neefs et al. 1993). The rRNA genes that are commonly used in constructing phylogenetic trees are those coding the 16S and either 18S or 28S rRNA molecules. Analysis of these data is particularly useful because of the large databases for these molecules from a wide variety of organisms. The 16S rRNA molecule, together with 21 proteins, constitutes the small subunit of the 70S ribosome that is responsible for translating organellar and prokaryote messenger RNA (Hill et al. 1990). The 18S and 28S rRNA molecules, together with 33 and 24 proteins, respectively, constitute the small and large subunits of the 80S ribosome that translates nuclear-encoded mRNA in eukaryotic cells. rRNA molecules contain both conserved and variable sequence regions (Fig. 1.9). The distinction between conserved and variable regions is related to the frequency with which base substitutions are made at specific positions relative to the entire molecule. These sequences are compared using a variety of mathematical criteria to obtain a measure of the evolutionary “distance” or divergence between organisms. Assuming an ancestral origin of a sequence as the root (preferably using a sequence from an organism that is not represented by a taxon under investigation), each sequence can be related to the root to develop a branching tree or cladogram (Pace 1997; Medlin et al. 1994).
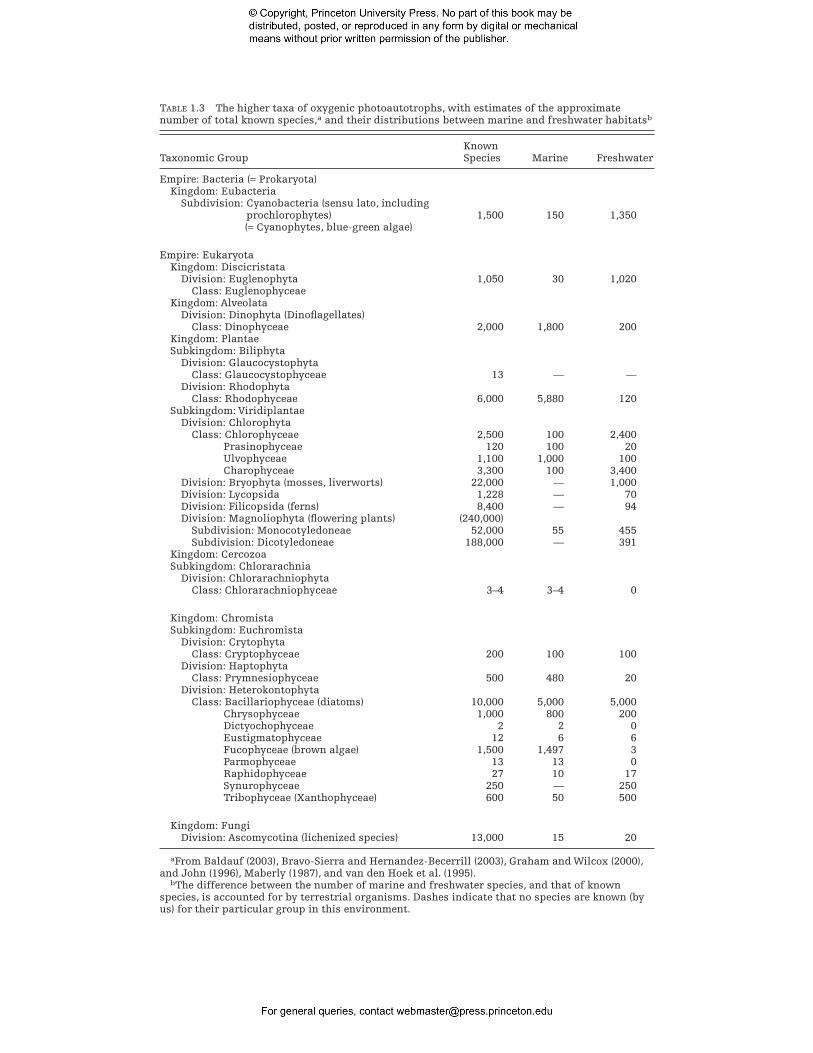
TABLE 1.3 The higher taxa of oxygenic photoautotrophs, with estimates of the approximate number of total known species,a and their distributions between marine and freshwater habitatsb
Known Taxonomic Group Species Marine Freshwater
Empire: Bacteria (= Prokaryota) Kingdom: Eubacteria
Subdivision: Cyanobacteria (sensu lato, including prochlorophytes) 1,500 150 1,350 (= Cyanophytes, blue-green algae)
Empire: Eukaryota Kingdom: Discicristata
Division: Euglenophyta 1,050 30 1,020 Class: Euglenophyceae
Kingdom: Alveolata Division: Dinophyta (Dinoflagellates)
Class: Dinophyceae 2,000 1,800 200 Kingdom: Plantae Subkingdom: Biliphyta
Division: Glaucocystophyta Class: Glaucocystophyceae 13 — —
Division: Rhodophyta Class: Rhodophyceae 6,000 5,880 120
Subkingdom: Viridiplantae Division: Chlorophyta
Class: Chlorophyceae 2,500 100 2,400 Prasinophyceae 120 100 20 Ulvophyceae 1,100 1,000 100 Charophyceae 3,300 100 3,400
Division: Bryophyta (mosses, liverworts) 22,000 — 1,000 Division: Lycopsida 1,228 — 70 Division: Filicopsida (ferns) 8,400 — 94 Division: Magnoliophyta (flowering plants) (240,000)
Subdivision: Monocotyledoneae 52,000 55 455 Subdivision: Dicotyledoneae 188,000 — 391
Kingdom: Cercozoa Subkingdom: Chlorarachnia
Division: Chlorarachniophyta Class: Chlorarachniophyceae 3–4 3–4 0
Kingdom: Chromista Subkingdom: Euchromista
Division: Crytophyta Class: Cryptophyceae 200 100 100
Division: Haptophyta Class: Prymnesiophyceae 500 480 20
Division: Heterokontophyta Class: Bacillariophyceae (diatoms) 10,000 5,000 5,000
Chrysophyceae 1,000 800 200 Dictyochophyceae 2 2 0 Eustigmatophyceae 12 6 6 Fucophyceae (brown algae) 1,500 1,497 3 Parmophyceae 13 13 0 Raphidophyceae 27 10 17 Synurophyceae 250 — 250 Tribophyceae (Xanthophyceae) 600 50 500
Kingdom: Fungi Division: Ascomycotina (lichenized species) 13,000 15 20
aFrom Baldauf (2003), Bravo-Sierra and Hernandez-Becerrill (2003), Graham and Wilcox (2000), and John (1996), Maberly (1987), and van den Hoek et al. (1995).
bThe difference between the number of marine and freshwater species, and that of known species, is accounted for by terrestrial organisms. Dashes indicate that no species are known (by us) for their particular group in this environment.

(b)
(c)(a)
(e)(d)
Figure 1.8 Photomicrographs of early eukaryotic algae. (a) and (b) Reproductive apices of the bangio
phyte red alga Bangiomorpha pubescens from 1.2 Ga collected in the Hunting Formation in Canada. The
morphology of this fossil shows considerable similarity to the extant Bangia (c) (Butterfield et al. 1990;
Butterfield 2000). (d) Branched filament of the ulvophyte green alga Proterocladia hermannae from the
750-million-year-old (Neoproterozoic) Svantergfjellt Formation (Upper Proterozoic) in Spitzbergen. This
fossil shows considerable similarity to the extant green algal genus Cladophora (e) (Butterfield et al. 1988;
Butterfield 2004). (Figures kindly provided by Nick Butterfield.)

An Introduction to Photosynthesis in Aquatic Systems | 25
Figure 1.9 Secondary structure model for eukaryotic small subunit (SSU) rRNAs. The shape of the
model is based on Saccharomyces cerevisiae SSU rRNA, and hollow circles represent nucleotides deleted in
most other eukaryotic SSU rRNAs. Variable regions are denoted V1 to V9. The area corresponding to V6 in
prokaryotic SSU rRNAs is more conserved among eukaryotic SSU rRNAs.
A cladogram showing the phylogeny of prokaryotes, based on the analyses of 16S rRNA7 nucleotide sequences (Giovannoni et al. 1993), is shown in Color Plate 1. This analysis provided a basis for distinguishing between two major groupings of prokaryotes, the eubacteria and the archebacteria (Woese 1987). The latter are believed to have been among the first life-forms to evolve on the
7 S is an abbreviation for a svedberg unit, which is a unit of relative mass named after a Swedish physicist who invented the ultracentrifuge. The unit is based on the rate of sedimentation of molecules or particles in a centrifugal field

26 | Chapter 1
Earth and contain all the extreme thermophilic heterotrophic bacteria, methanogens, and extreme halophiles. The eubacteria contain all the gram-positive bacteria, green nonsulfur bacteria, cyanobacteria, and flavobacteria, and a group of gram-negative bacteria called proteobacteria or “purple bacteria.” The proteobacteria are further subdivided into α, β, γ, and δ subdivisions. The α subdivision includes the rhizobacteria, which are capable of nitrogen fixation and form symbiotic associations with legumes, and the rickettsias, which are intracellular pathogens of animals.
In addition to the nucleus, eukaryotic photoautotrophs contain two membrane-bound organelles: chloroplasts (often called plastids) and mitochondria. In eukaryotes, molecular phylogenies can be constructed from either 16S or 18S and 28S rRNA molecules (Falkowksi and LaRoche 1991b). The 16S rRNA molecules are associated with the plastids, whereas the latter two rRNA molecules trace the phylogeny of the nucleus. A cladogram for eukaryotes, based on 18S rRNA sequences, is shown in Fig. 1.10. Other molecular cladograms have also been published and alternative schemes to that shown in Fig. 1.10 can be plausibly constructed. The alternative schemes often differ in some important details, and true phylogenetic relationships are not yet established for all algal divisions because the 18S and 28S rRNA data have not yet resolved the earliest relationships among major taxa of photoautotrophs.
The prevailing theory for the origin of organelles is the so-called serial endosymbiotic hypothesis8 (Margulis 1974). This hypothesis suggests that progenitor eukaryotes originated as prokaryotic cells, which phagotrophically engulfed and incorporated other prokaryotes to form intracellular symbionts that progressively lost their genetic capability to reproduce without the host cell. For example, the genetic template for mitochondria appears to have been a branch of α-proteobacteria that were engulfed by an ancestral archebacterial host cell (Pace 1997). Interestingly, there is some evidence that the α-proteobacterium was probably an anaerobic photosynthetic organism (Taylor 1979, 1987); its engulfment and retention may have given the host cell an alternative photosynthetic metabolic pathway (a “dual fuel” strategy). The molecular biological evidence clearly suggests that chloroplasts arose from the engulfment of an oxygenic cyanobacteria by a host cell that almost certainly con-
The rate of sedimentation is related to a sedimentation coefficient, s, by s = dx/dt (ω2x)−1, where x is distance of the molecule or particle from the center of rotation after time t (in seconds) in the rotating field, and ω is the angular velocity in radians per second. A sedimentation coefficient of 1 × 10⁻¹³ s is equal to 1 S. Thus, a 16S rRNA molecule would sediment with a coefficient of 16 × 10−13 s. The larger the coefficient, the larger the molecular mass of the molecule (i.e., the faster it sediments). The molecular mass can be related to the sedimentation rate by the Svedberg equation: mw = RTs/D(1 − vρ), where R is the gas constant, T is absolute temperature, v is the partial specific volume of the sedimenting particle or molecule, D is the diffusion coefficient, and ρ is the density of the solvent. This equation gives only an approximate molecular mass because it assumes that the sedimenting particles or molecules behave like an ideal gas, meaning that the particles are perfect spheres and do not have any interactions between each other.
8 This term was coined by F.J.R. Taylor.

Figure 1.10 (a) Phylogeny of eukaryotes (nuclear, i.e. “host”) genome derived from 18S rRNA se
quences using a “maximum likelihood” method (see Bhattacharya and Medlin 1995). Note that the ap
parent close relationship between nucleomorphs of cryptophytes and chlorarachniophytes is an artifact
(Palmer and Delwiche 1996). (b) A phylogenetic tree derived from analysis of plastid (i.e., “symbiont”)
genomes using plastid-encoded 16S rRNA sequences (Bhattacharya and Medlin 1995). (Figure kindly
provided by Wiebe Kooistra.)

28 | Chapter 1
tained a mitochondrion (i.e., it was already a eukaryote). The cyanobacteria themselves appear to have arisen from the genetic fusion of ancestral purple photosynthetic bacteria (with a photosystem II-like reaction center) with green sulfur bacteria (with a photosystem I-like reaction center). Intermediate stages in this process appear to have gone extinct. However, upon engulfment of a cyanobacterium, the cell would generate oxygen internally. Under such conditions, the anaerobic photosynthetic α-proteobacterium would cease to be photosynthetic, and would lose its capacity to do so. Rather it would operate its electron transport chain in reverse and evolve to become a mitochondrion, living symbiotically within an oxygen evolving cell.
The origin of plastid- and mitochondria-containing eukaryotes is, according to the endosymbiotic hypothesis, a result of arrested digestion of cyanobacteria and α-proteobacteria, respectively, that had been ingested by phagotrophic ancestral eukaryotes with endomembranes and a cytoskeleton. Such a proposal is supported by well-documented symbiotic associations of protists not only with eukaryotic and prokaryotic algae, but with intact chloroplasts derived
The Molecular Clock
The analysis of sequence variation in establishing phylogenetic relationships is based on the observation that the number of nucleotide or amino acid substitutions separating a pair of species is proportional to the time back to a common ancestor. In the simplest models, the rate at which substitutions, I, occur is assumed to be constant (although there is significant debate on this issue) for a specific molecule (Gillespie 1991). If it is further assumed that the substitutions are random point processes, then the statistical probability, P, of change can be derived from a Poisson distribution:
−rt ( )Ie rt P N t [ ( ) = I] =
I! (1.12)
where N(t) is the total number of substitutions at a particular point over time t, and r is the rate of substitution. This analysis forms the basis of the “molecular clock,” from which it is possible to estimate rates of speciation within an algal class, or rates of divergence from a common origin. Each mutation represents a “tick.” For example, geological evidence indicates that diatoms probably arose during the mid-Jurassic period, some 160 million years ago (when dinosaurs roamed a conglomerated continent we call “Pangea” and the Atlantic Ocean was not yet formed). Based on the rate of substitution of bases in 18S rRNAs, it is estimated that 1% of the ancestral diatom genome has changed every 25 million years (Figure 1.11).

Mill
ion
year
s ag
o (M
a)
An Introduction to Photosynthesis in Aquatic Systems | 29
95% upper limit of estimated age of diatoms250
200
150
100
50
0
“Clocked” Distance Distance from end nodes
to origin of diatoms
Average estimated age of diatoms ~160Ma b1
a
b2
0 0.02 0.04 0.06 0.08 0.10 0.12
Figure 1.11 Results of molecular clock calibrations following the method of Hillis and Moritz
(1990) in which dates of first appearances of diatom lineages in the fossil record are regressed
against their measured branch lengths in an maximum likelihood tree. The data are derived from
calibrating the first appearances of diatoms lineages in the fossil record their measured branch
lengths derived from 18S rRNA phylogenetic tree following the method of Hillis and Moritz
(1990). The straight line a is the regression line, forced through zero; the lines b1 and b2 are the
upper and lower 95% confidence limits around the regression line. The value projected over re
gression line provides the average age for the first appearance of diatoms (ca. 160 Ma) (figure
courtesy of Wiebe Kooistra.)
from the ingestion of eukaryotic cells (Schnepf and Elbrächter 1992; Taylor 1987). The latter process, sometimes called “kleptoplasty” (stealing a plastid), provides a mechanism for a heterotroph to derive a source of photosynthetically produced organic matter, but it must constantly renew its supply of plastids through the phagotrophic ingestion of cells (see Gustafson et al. 2000). This phenomenon is not uncommon in foraminifera and a variety of ciliates (e.g., Grzymski et al. 2002).
It would appear that all eukaryotic photosynthetic organisms are derived from a single common ancestor, but early in their evolutionary history two major schisms occurred giving rise to three extant “superfamilies” (Color Plates 1 and 2). The differences in these three superfamilies is based on plastid biochemistry and ultrastructure as much as on differences in rRNA. One group, the Glaucocystophyta, presently comprises only six extant species, but this group

30 | Chapter 1
contains relict cyanobacterial biochemical features that suggest it was one of the earliest branching photosynthetic eukaryotic clades. The two additional groups form “superfamilies.” One, containing chlorophyll b in addition to chlorophyll a, comprises (in the vernacular) the “green” line of eukaryotes, from which all higher plants are descended. The second superfamily contains organisms that use chlorophyll c in addition to chlorophyll a. In this group, the plastids are often yellow, orange-brown, or red in color, due to the presence of other accessory pigments, and hence the superfamily is called (again, in the vernacular) the “red” line (Falkowski et al. 2004b).
The earliest eukaryotic photosynthetic organisms in all three groups are derived from the engulfment of prokaryotic photosynthetic organism by a eukaryotic heterotrophic host cell. The derived eukaryote is called a “primary” symbiont. However, heterotrophic eukaryotes can engulf photosynthetic eukaryotes to form “secondary” symbionts. In some cases, a heterotrophic host cell, engulfed a secondary symbiont to form a “tertiary” symbiont. A major clue to the wholesale incorporation of a prefabricated photosynthetic apparatus is the presence of extra membranes surrounding the plastids (Reith 1995) (Fig. 1.12, Table 1.4). In primary endosymbiotic eukaryotes, red algae, green algae, and higher plants, the chloroplast envelope always contains two membranes (Berner 1993). In Euglenophyta and Dinophyta there are three plastid envelope membranes, whereas Chlorarachniophyta, Cryptophyta, Heterokontophyta, and Haptophyta have four (see Fig. 1.12). In many cases, the outermost membranes form an endoreticular conduit from the cell’s nucleus to the chloroplast. In the modern ocean, most of the ecologically successful species of eukaryotic photosynthetic organisms have secondary plastids in the red line; these include diatoms (and their closely related relatives, the chrysophytes), haptophytes (including coccolithophorids), and red plastid containing dinoflagellates (some of which synthesize toxins and form harmful algal blooms).
Besides the number of membranes surrounding the plastid, compelling evidence for secondary symbiotic events is the presence of a nucleomorph9 (the remnant nucleus of the primary endosymbiont). This relict organelle is found, for example, in the plastid compartment of cryptophytes and chlorarachniophytes (Gibbs 1992). In cryptophytes, the 18S rRNA from the nucleomorph more closely resembles red algal 18S rRNA rather than cryptophyte nuclear 18S rRNA, suggesting the plastids of the cryptophytes are derived from the endosymbiotic incorporation of a red algal-like organism (Cavalier-Smith 1993b; Douglas et al. 1991).
9 A nucleomorph is a nucleic-acid-containing, membrane-bound organelle located in the cytoplasmic region between the two sets of double membranes (i.e., a total of four in all) that surround the plastid. The nucleomorph is the remains of the nucleus of the eukaryotic endosymbiont that gave rise to the plastids of chlorarachniophyte and cryptophyte algae by secondary endosymbiosis. This structural residue of the endosymbiont has been lost from other extant examples of secondary endosymbioises.

Figure 1.12 Transmission electron micrographs showing the basic structure of chloroplast membranes
in a variety of unicellular algae. (a) A section through the whole cell of the chrysophyte, Ochromonas dan
ica, and (b) a detailed view of the thylakiod membranes. Note that the membranes form stacks of three.
The chloroplast itself is surrounded by four membranes, the two inner membranes are designated chloro
plast envelope membranes, while the two outer membranes are the chloroplast endoplasmic reticulum.

32 | Chapter 1
A key aspect of the endosymbiont hypothesis is that the incorporated organelle has become an obligate symbiont—chloroplasts cannot reproduce without their “host” cell. The obligate nature of the organelle is assured by the transfer of many of the genes necessary for its independent function to the nucleus of the host cell, as well as the loss of genes that would permit the endosymbiont to revert to a free-living existence. Assuming that the genome of the ancestral cyanobacterium which became a primordial plastid contained approximately the same number of genes as extant cyanobacteria (ca. 5000), >90% of the genes from the prokaryote were transferred to the host cell nucleus or lost (Grzebyk et al. 2003) (Color Plate 3). For example, all eukaryotic algae lack a complete suite of tRNAs in both the mitochondria and chloroplast. The missing genes are found in the nucleus, and the gene products must be imported into the respective organelles. Thus, the transcription and translation of organelle genes, which are essential for organelle function, are dependent on the supply of tRNAs encoded by the nucleus, thereby forcing nuclear control of organelle protein synthesis.
There is considerable variability among algae in the number of genes retained in the plastid genome, but a core of genes encoding essential plastid and mitochondrial functions are present in all of the respective organelles (Valentin et al. 1993). In chloroplasts, this core comprises genes for the electron transport components required for the light reactions, as well as enzymes that catalyze key dark reactions. The organellar genes are not inherited by Mendelian recombinatatorial genetics. As we will see in chapter 6, this conservation greatly improves the ability to extrapolate specific biophysical, structural, and biochemical processes that are encoded in the chloroplast genome from model organisms to large groups of otherwise disparate organisms.
A further clue to the relationship among photosynthetic organisms can be
In (b) the chloroplast endoplasmic reticulum is continuous with the nucleus, and ribosomes on the
membrane translate nuclear-encoded genes destined for the chloroplast. (c) A section through the
chloroplast of the chlorophyte Dunaliella tertiolecta (inset a whole cell section). Note the large electron
transparent region within the chloroplast, which corresponds to a site of starch accumulation. At the
center of this structure is a pyrenoid. The thylakoid membranes can be aggregated to less aggregated,
depending on growth conditions. Inspection of the whole cell reveals that the chloroplast in this
organism follows the cell perimeter with an opening. This structure is often called a “cup-shaped”
chloroplast. (d) A whole cell section through a cryptomonad, Guillardia theta. As found in chryso
phytes (a), the thylakoids form stacks of two membranes, and the chloroplast is surrounded by four.
The outer membrane of the chloroplast can be seen to envelop a nucleomorph at the bottom of the
cup-shaped chloroplast. The nucleomorph is the vistigial nucleus of the symbiont that gave rise to the
chloroplast in this organism. (e) Section through a diatom, Phaeodactylum tricornutum. Thylakoids are
found in stacks of three, except in the pyrenoid, where they are often paired. The chloroplast is also sur
rounded by four membranes, but unlike in chyrsophytes or cryptophytes, the outer membrane seldom
is connected to either the nucleus or a nucleomorph. (Panels a, b, d, and e courtesy of Sally Gibbs and
Michael McKay.)

TA
BL
E 1
.4
Stru
ctu
re a
nd
pig
men
tati
on o
f th
e p
hot
osyn
thet
ic a
pp
arat
us
in t
he
hig
her
tax
a of
oxy
gen
ic p
hot
oau
totr
oph
s w
ith
aq
uat
ic m
emb
ers
Cel
l St
ruct
ure
P
RO
KA
RY
OT
IC
EU
KA
RY
OT
IC
Th
ylak
oid
s in
Pla
stid
s
Pla
stid
s in
su
bco
mp
artm
ent
of t
he
cyto
pla
sm
Th
ylak
oid
s in
cyt
opla
sm
No
mem
bra
nes
bet
wee
n
Pla
stid
s in
th
e cy
top
lasm
; E
nve
lop
e of
E
nve
lop
e of
C
omp
artm
ents
th
yla
koid
s a
nd
pla
sma
lem
ma
E
nve
lop
e of
tw
o m
embr
an
es
fou
r m
embr
an
es
thre
e m
embr
an
es
Tax
a;
Cya
nob
acte
ria
Bil
iph
yta
(1)
Vir
idip
lan
tae
(4)
Th
yla
koid
C
yan
obac
teri
a (1
) C
hlo
roxy
bac
teri
a (3
) R
hod
oph
ycea
e C
hlo
rop
hyt
a A
rra
nge
men
t se
nsu
str
ictu
(P
roch
loro
ph
ycea
e)
Gla
uco
cyst
oph
ycea
e B
ryop
hyt
a (C
yan
oph
ycea
e)
Lyco
psi
da
Th
yla
koid
s si
ngl
e F
ilic
opsi
da
Th
yla
koid
s si
ngl
e T
hyl
ako
ids
in p
air
s M
agn
olio
ph
yta
Th
yla
koid
s in
st
ack
s of
th
ree
or m
ore
Het
erok
onto
ph
yta
(5)
Eu
glen
oph
yta
(4)
Bac
illa
riop
hyc
eae
Th
yla
koid
s in
sta
cks
Ch
ryso
ph
ycea
e of
on
e or
mor
e E
ust
igm
atop
hyc
eae
Fu
cop
hyc
eae
(= P
hae
oph
ycea
e)
Pel
agop
hyc
eae
Din
oph
yta
(6)
Syn
uro
ph
ycea
e T
hyl
ako
ids
in s
tack
s
Tri
bop
hyc
eae
of t
hre
e or
mor
e (=
Xan
thop
hyc
eae)
T
hyl
ako
ids
in s
tack
s of
th
ree
Hap
top
hyt
a (5
) T
hyl
ako
ids
in s
tack
s of
th
ree
Cry
pto
ph
yta
(2)
Th
yla
koid
s in
pa
irs
Ch
lora
rach
nio
ph
yta
(4)
Th
yla
koid
s in
sta
cks
of t
hre
e
Pig
men
ts a
nd
th
eir
loca
tion
as
ind
icat
ed b
y su
ffix
nu
mb
er:
(1) C
hlo
rop
hyl
l a
, β-c
arot
ene
and
oth
er c
arot
enoi
ds
in t
he
thyl
akoi
d m
emb
ran
e; p
hyc
obil
ins
on t
he
N s
ide
of t
he
mem
bra
ne.
(2
) Ch
loro
ph
yll
a,c
hlo
rop
hyl
lid
e c 2
(±M
g-2,
4 d
ivin
yl p
hae
opor
ph
yrin
a5 m
onom
eth
yl e
ster
), β
caro
ten
e an
d o
ther
car
oten
oid
s in
th
e th
ylak
oid
m
emb
ran
e; p
hyc
obil
ins
on t
he
P s
ide
of t
he
mem
bra
ne.
(3
) Ch
loro
ph
yll
a (±
div
inyl
-ch
loro
ph
yll
a),
chlo
rop
hyl
l b
(± d
ivin
yl-c
hlo
rop
hyl
l b)
, β-c
arot
ene
and
oth
er c
arot
enoi
ds
on t
he
thyl
akoi
d m
emb
ran
e.
(4) C
hlo
rop
hyl
l a
,ch
loro
ph
yll
b (M
g-2,
4 d
ivin
yl p
hae
opor
ph
yrin
a5 m
onom
eth
yl e
ster
in
som
e m
emb
ers
of t
he
Ch
loro
ph
ycea
e, P
rasi
nop
hyc
eae
in t
he
Ch
loro
ph
yta)
, β-c
arot
ene
and
oth
er c
arot
enoi
ds
in t
he
thyl
akoi
d m
emb
ran
e.
(5) C
hlo
rop
hyl
l a
,ch
loro
ph
ylli
de
c 1 a
nd
/or
c 2 a
nd
/or
c 3 (o
r n
o ch
loro
ph
ylli
de
c in
Eu
stig
mat
oph
ycea
e); β
-car
oten
e an
d o
ther
car
oten
oid
s (u
sual
ly
incl
ud
ing
fuco
xan
thin
an
d/o
r fa
tty
acid
der
ivat
ives
) in
th
e th
ylak
oid
mem
bra
ne.
(6
) Ch
loro
ph
yll
a,c
hlo
rop
hyl
l c,
β-c
arot
ene
and
oth
er c
arot
enoi
ds
incl
ud
ing
per
idin
in, s
ome
chlo
rop
hyl
l a
, all
per
idin
in, i
n c
omp
lexe
s on
th
e su
rfac
e th
ylak
oid
mem
bra
ne,
rem
ain
ing
pig
men
ts i
n t
he
thyl
akoi
d m
emb
ran
e.

34 | Chapter 1
gleaned from the ultrastructural organization of the thylakoid membranes. Being lipid bilayers, thylakoid membranes can aggregate via hydrophobic interactions.10 In higher plant chloroplasts, highly appressed areas of thylakoids called grana lamellae are interconnected with lower density regions (often single thylakoids) called stromal lamellae (Staehelin 1986).
Whereas in higher plants this organizational differentiation within the thylakoids appears to be important in the lateral distribution of electron transport components along the membrane surface, this “typical” chloroplast structure is rarely found in algae. In cyanobacteria and red algae, thylakoids occur singly. The lack of any association between thylakoids in these organisms is likely a result of their major light-harvesting complexes, the phycobilisomes. In cyanobacteria these hydrophilic macromolecules are located on the stromal side of the thylakoid membrane and prevent hydrophobic associations between adjacent membranes. In prochlorophytes (a cyanobacterial branch that contains chlorophyll b but no phycobilisomes) and cryptophytes (algae with phycobilins located within the thylakoid lumen and not organized into a phycobilisome) thylakoids are paired. Chromophytes typically have thylakoids in stacks of three, whereas the chlorophytes sometimes have pseudograna, regions of appressed stacks of three or more membranes interspersed with less-stacked regions (Berner 1993). In no algal class is there compelling evidence of lateral heterogeneity of photosynthetic systems within the thylakoid membranes (e.g., Song and Gibbs 1995).
Although both pigment composition and ultrastructural organization of the photosynthetic apparatus have served to help establish phylogenetic relationships, because of parallel evolution and ill-defined evolutionary relationships between pigments such an approach is limited (Bhattacharya et al. 1992). Plastid characteristics, whether they are encoded in the plastid per se or nuclear genomes, reflect the evolution of the endosymbiont that produced plastids as well as those inherited from the host (Douglas 1994; Lewin 1993). For example, chlorophyll b appears to have evolved in the earliest oxygenic cyanobacteria (Tomitani et al. 1999), but was lost in most of the extant phycobilin containing lines of cyanobacteria as well as in the red lineage of photosynthetic eukaryotes. Hence, phylogenetic trees based on pigment composition using chlorophyll b would be misleading (Palenik and Haselkorn 1992).
There are approximately 1500 species of prokaryotic photoautotrophs and 28,500 species of eukaryotic aquatic photoautotrophs extant. The ensemble of these organisms is, in the vernacular, called algae11 (from the Latin for “sea
10 Hydrophobic interactions are brought about as a result of the thermodynamic relationship of molecules to water. Liquid water forms extensive hydrogen bonding networks. Hydrophobic molecules, such as lipids, tend to aggregate in aqueous phases, thereby minimizing the disruption of the hydrogen bonds. This is a low free-energy condition. Hence, the water “squeezes” the lipids together, forming bilayers. Subsequent, larger interactions can be brought about by the addition of hydrophobic proteins, or secondary lipids, to form heterogeneous, macromolecular complexes. Hydrophobic interactions are generally weak and can be readily disrupted by cold temperatures, organic solvents, detergents, and some small ions such as Na+.
11 The study of algae is called phycology, a word derived from the Greek for a marine plant or seaweed.

An Introduction to Photosynthesis in Aquatic Systems | 35
Nomenclature of Major Groups of Aquatic Photosynthetic Organisms
The hierarchy of taxonomic classification is basically as follows: Empire
Kingdom Subkingdom
Division = Phylum Subdivision
Class Order
Family Genus
Species Botanical texts frequently use the term division, while microbial and zoological texts use the term phylum; from a taxonomic viewpoint, these are hierarchical equivalents.
Ironically, molecular biological criteria for classifying photoautotrophs, based on their “real” (i.e., evolutionarily meaningful) relationships, has sometimes caused more confusion than the older classification schemes based on morphology and/or pigmentation. This is especially true at the level of divisions. Viridiplantae, for example, is a term coined by Cavalier-Smith to include the Chlorophyta and their higher plant derivatives. Excluded from Viridiplantae are two groups of algae, the Euglenophyta and Chlorarachniophyta, that obtained their plastids from unicellular members of the Chlorophyta but whose nuclear genome is only distantly related to those of higher plants and of Chlorophyta. Similarly, the Biliphyta covers the red algae and the Glaucocystophyta, which are related to each other by their nuclear genomes, but not the groups that acquired their chloroplasts by endosymbiosis of unicellular red algae and are only distantly related to them as far as their nuclear genome is concerned. The latter include the Cryptophyta, Dinophyta, Haptophyta, and Heterokontophyta (sensu Cavalier-Smith 2002).
An informal taxonomic usage has evolved in the photosynthesis researcher population. Thus, blue-green algae refers to cyanobacteria, all of which contain chlorophyll a and generally phycobilins, which give them distinctive colors. Green algae or chlorophytes refer to eukaryotic chlorophyll-b-containing organisms other than higher plants. Eukaryotes lacking chlorophyll b and phycobilins, but containing chorophyll c and/or fucoxanthin (Heterokonta, Haptophyta) or peridinin (most Dinophyta) are often called chromophytes. Although most of the chromophytes are brown, yellow, or olive-green rather than bright green, the term brown algae is generally reserved for members of the Fucophyceae (Phaeophyceae), all members of which are multicellular and contain chlorophylls c.

36 | Chapter 1
weed,” although it also includes some embryophytic (= higher) plants, the seagrasses). A summary of the formal names of the higher plant taxa of aquatic photosynthetic organisms is given in Table 1.3, together with estimates of their diversity and comments on their habitats (marine, freshwater, terrestrial). This arrangement is based on analyses of nuclear (i.e., 18S rRNA) characteristics, but many of the prefixes for the classes (e.g., Chloro-, Rhodo-, Phaeo- (= Fuco-), Xantho- (= Tribo), Chryso-, Cyano-, etc.) refer to plastid pigmentation, which is a more commonly found nomenclature in most texts.
One of the algal classes, the Charophyceae, was the progenitor of higher land plants and garnered a foothold in the terrestrial world about 500 Ma. From the time of their invasion of land, higher plants have managed to diversify so extensively that an estimated 270,000 species of higher plants are extant (Table 1.3) and many more are extinct. Although there are many more morphologically distinct species of terrestrial higher plants than there are of aquatic photoautotrophs, the genetic differences between the higher plants are relatively small compared with algae.12 Thus, although there are fewer recognized species of algae than there are of higher plants, there is a much larger evolutionary distance between and within algal divisions. For example, Ragan and colleagues (1994) point out that the genetic diversity within a single algal division, the Rhodophyta, is greater than that within all the higher plants. Despite the great diversity of aquatic photosynthetic organisms, most of the molecular structures and functions that are essential for photosynthesis are highly conserved. This conservation suggests a common (i.e., single ancestral) origin of oxygenic photoautotrophs (Lewin 1993; Bhattacharya and Medlin 1995; Delwiche 1999; Palmer 2003).
Similarities and Differences in the Photosynthetic Processes in the Algal Classes
People who study aquatic photosynthesis generally think on two taxonomic levels simultaneously. One is related to the general kind of organism they are dealing with—meaning, is it a diatom, a cyanobacterium, or a seagrass? This level of classification is at the level of divisions or of classes. A division or class is defined by the extent of similarities of the organisms within divisions (or classes). Traditionally (i.e., historically), this concept of higher levels of or
12 To intuitively understand the deeply branching diversity of algal lineages compared with higher plants, we can think of the analogues in animal phyla. Humans, dinosaurs, fishes, and birds are all members of a single phylum, the Chordata. Insects, lobsters, and spiders are members of the Arthropoda. These two phyla share a common endosymbiotic organelle, a mitochondrion. A diatom is to a kelp as a bird is to a mammal—both are in the division (i.e., phylum) heterokontophyta. But diatoms and kelps are to coccolithophores as chordates are to arthropods. In this scheme, all higher plants are very closely related organisms that form a “crown” group, comparable to the evolutionary divergence of insects within the arthropoda.

An Introduction to Photosynthesis in Aquatic Systems | 37
ganization has aggregated organisms with similar features into groups. Many of the historically derived groups (which were based primarily on morphology), have been supported by molecular biological analysis of genetic similarities, but molecular biological data have also helped elucidate evolutionary histories (i.e., phylogeny) more objectively. Knowledge of the division or class confers considerable predictive value; for example, in the evolutionary origin of the photosynthetic pigments or enzymes involved in the photosynthetic process (Raven et al. 1989).
The other taxonomic level at which photosynthesis workers operate is that of the species. The concept of a species, which emerged from the studies of higher organisms in the 18th century, is not easily applicable for microbes in general, and for unicellular photoautrophs in particular. There is no simple, universally accepted definition of a species (Wood and Leatham 1992). A species is usually defined as like organisms that exchange genetic information in nature and produce sexually viable progeny. Such a definition is restricted to sexually reproducing organisms and generally involves genetic variability within a species. For organisms that do not have easily demonstrable sexual reproduction, such as the majority of the phytoplankton, there can be many genotypes within a morphologically defined species. In the case of the marine prokaryote Prochlorococcus marinus, for example, only one species is recognized; however, many genotypic differences in photosynthetic responses are apparent (Johnson et al. 2006). For known sexually reproducing species, such as the diatom Skeletonema costatum, genetic variability was demonstrated by distinguishing ecophysiologically specific strains (also called ecotypes) (Gallagher et al. 1984). These races appear to be phenotypically different in their photosynthetic characteristics. Genetic variability within a species appears to be common in unicellular algae (Wood and Leatham 1992; Medlin et al. 1995; de Vargas et al. 2004), and has been supported by higher resolution molecular biological studies (de Vargas et al. 2004).
In 1830, the British geologist and naturalist Charles Lyell wrote,
The name of a species, observes Lamark, has been usually applied to “every collection of similar individuals, produced by other individuals like themselves.” But this is not all which is usually implied by the term species, for the majority of naturalists agree with Linnaeus in supposing that all the individuals propagated from one stock have certain distinguishing characters in common which will never vary, and which have remained the same since the creation of each species. The more we advance in our knowledge of the different organized bodies which cover the surface of the globe, the more our embarrassment increases, to determine what ought to be regarded as a species, and still more how to limit and distinguish genera.

38 | Chapter 1
Operationally, a species may be defined as a morphologically identifiable entity of known environmental plasticity that has the same degree of similarity among members of a genus. This definition is somewhat arbitrary but often practical, although Lyell noted, “When the species are arranged in a series, and placed near to each other, with due regard for their natural affinities, they each differ in so minute a degree from those adjoining, that they almost melt into each other, and are in a manner confounded together.” Because there is such propensity for confusion of what constitutes a species based on morphological characteristics, the phycological literature abounds in correction and renaming of organisms.13
Life-forms and Niches in Aquatic Photosynthetic Organisms
Species exist because of natural selection and are sustained because of genetic fitness. In the identification of species, the morphological characteristics are frequent determinates; however, ecologists often adopt the concept of life-form, meaning the genetically determined gross morphology of an organism rather than its phenotypically determined growth form. Life-forms are presumed to confer a measure of evolutionary fitness, and therefore have been selected through the success offered to the species in a given environment. In aquatic systems, the life-form plays a key role in determining the ecological niche that an organism can occupy. With respect to photosynthesis, life-forms are critical to determining the rate of supply of substrates, especially CO2 and other dissolved nutrients, and light. For example, small cells, with high surface-area-to-volume ratios, have an advantage over large cells with respect to the diffusion and acquisition of essential elements and molecules between the bulk fluid and the cell (Chisholm 1992; Raven 1986). Thus, simply by virtue of size, small cells have a competitive advantage over large cells in environments where the diffusion of nutrients may be limiting growth. Large cells usually have a large storage capacity for nutrients (Raven 1984a). Hence, in environments where nutrients are delivered in pulses, such as continental margins or coastal upwelling areas, large cells often can acquire nutrients more rapidly and sustain growth for longer periods than their smaller counterparts (Malone 1980; Tozzi 2004; Finkel et al. 2005).
13 Because of the difficulty in applying the species concept to organisms that do not necessarily reproduce sexually, there have been proposals to define a species based on molecular biological criteria. For example, Annette Coleman (personal communication) has found, in groups of green algae, that a specific 116 nucleotide subset of the sequence between the 5.8S and the 18S rRNA gene (the second internal transcribed spacer region, or ITS2) determines the secondary structure of the primary RNA transcript. Interbreeders (members of a biological species) can differ at single nucleotide positions, but never by a compensating base pair change—a presumably more rare event. Since this region is present in essentially all eukaryotes, it could contribute to a molecular criterion for species.

An Introduction to Photosynthesis in Aquatic Systems | 39
In the simplest sense, it is useful to distinguish between two basic life-forms in aquatic photoautotrophs: those organisms that are attached to a substrate, and those that are unattached and are free to float in the water (Lee 1989). The latter are commonly called phytoplankton, from the Greek planktos, meaning “to wander.” Some phytoplankton are usually able to control their vertical position in the water column to some extent, either by changing their buoyancy and thereby facilitating sinking or floating, or by flagellar motility. In the context of photosynthesis, these vertical displacements may attenuate or enhance natural variations in irradiance resulting from turbulence; however, they do not significantly influence boundary layer thickness, and hence do not materially affect the diffusive exchange of nutrients between the bulk fluid and the organism.The boundary layer in relationship to carbon acquisition is discussed in chapter 5.
The attached organisms are both single-celled microalgae and multicellular macrophytes. The attached microalgae are usually associated with specific substrates in shallow waters. These organisms are often capable of movement that permits migration from the surface into the substrate. In some lakes and coastal ecosystems the single-celled, benthic organisms provide a significant source of organic carbon to the benthic community. The benthic macrophytes, or seaweeds, can reach exceedingly large sizes and can form layered canopies. From a photosynthetic perspective, the size of these organisms often has two consequences. First, the boundary layer becomes extremely large, necessitating continuous agitation to provide diffusive fluxes of nutrients to the blade or leaf of the plant. Hence, all macrophytes have relatively thin cross sections and large benthic macrophytes are often found in surf zones or regions with large physical energy inputs that facilitate the physical movement of water and nutrients to the plant. This situation is analogous to that of cell size for microalgae, but is significantly different from that of terrestrial environments, where the diffusive fluxes of gases (e.g., CO2) are four orders of magnitude higher in air than in water. Secondly, the canopy of the macrophytes can shade lower blades from light. This situation is highly analogous to terrestrial plant canopies, but the degree of physiological acclimation that results in aquatic macrophytes is without parallel. The acclimation of the photosynthetic apparatus to irradiance is discussed in chapters 7 and 9.
Nutritional Modes in Aquatic Phototrophs
While the life-form and shape of an organism begin to define the environment in which the organism may survive and grow, the nutritional mode can also be

40 | Chapter 1
extremely important. By far the majority of the organisms in all of the higher taxa listed in Table 1.3 are capable of photosynthetic oxygen evolution and of growth with inorganic carbon as the sole carbon source and light as the sole energy source. If, as is also usually the case, other nutrient elements can also be used in the inorganic form, then this mode of nutrition is termed photoautotrophy, meaning light-dependent self-feeders (sometimes called photolithotrophy; see Table 1.5). Obligate photoautotrophs are generally able to take up and metabolize at least some organic carbon compounds, but they can grow only if light and CO2 are provided, and the presence of an exogenous organic carbon source also does not always enhance the light- and CO2saturated growth rate. Some of the obligate photoautotrophs have a requirement for one or more vitamins, supplied in nature by secretion of vitamins from other organisms (usually bacteria) or by death and decay of other organisms. Obligate photoautotrophy is, by far, the major pathway for the biochemical reduction of inorganic carbon in aquatic environments and is the overarching subject of this book.
Earlier we had briefly mentioned that a second organelle, the mitochondrion, was also incorporated via the phagotrophic ingestion of a symbiotic prokaryote. This organelle oxidizes organic carbon at the expense of molecular oxygen to provide not only energy but also substrates for cell growth. This aspect of cell metabolism is examined in chapter 8. Mitochondria are found in almost all eukaryotic cells, whether photosynthetic or not.14 Although all obligate photoautotrophs are photosynthetic, not all photosynthetic organisms are obligate photoautotrophs. Some of the organisms in Table 1.3 are capable of using organic carbon as a supplement to, or a replacement for, light and CO2 as the energy and carbon sources for growth (see Table 1.5). These organisms metabolize the externally supplied organic carbon by oxygen-consuming, heterotrophic metabolic processes, where mitochondrial respiration supplements, or in some cases replaces, chloroplast metabolism. Such organisms are called facultative photoautotrophs. An example of a commonly grown facultative photoautotroph is the freshwater chlorophyte Chlamydomonas spp., which is often used to study the molecular genetics of photosynthesis. Chlamydomonas can use simple organic compounds such as acetate to supplement its photosynthetic nutrition. Facultative photoautotrophy (sometimes called mixotrophy) is fairly common in estuarine and lacustrine phytoplankton, where the concentrations of dissolved organic compounds are relatively high (Lewitus and Kana 1995).
If cells can also grow in the dark with an exogenous organic carbon source, they are heterotrophs (sometimes called chemoorganotrophs). Some species
14 Some eukaryotes, such as the flagellates Giardia and Microsporidium, were formerly thought to lack mitochondria, not because they have been lost in evolution but because these organisms have never acquired these organelles.

An Introduction to Photosynthesis in Aquatic Systems | 41
TABLE 1.5 Definitions of carbon and energy acquisition mechanisms used by aquatic plants
Definition for an Organism Using It as an Obligate or FacultativeNutritional Mode
Term Obligate Facultative
Photoautotrophy Light as sole energy source, Able to grow photoautotrophically, or in (Photolithotrophy) CO2 as sole C source; unable light with organic C as supplemental
to grow in dark energy and C source, or (in most cases) in dark on organic C
Heterotrophy Organic C as sole energy and C (Chemoorganotrophy) source (anaplerotic CO2 needs
satisfied from respirated CO2); cannot produce chlorophyll
of diatoms and many species of dinoflagellates and euglenoids, for example, lack photosynthetic pigments entirely and are completely dependent on heterotrophic metabolism. Phagotrophy (the ingestion of particles) is a form of acquisition of exogenous organic matter that is found in both facultative photoautotrophic (constituting another variant of mixotrophy) and heterotrophic organisms. Phagotrophy by facultative photoautotrophs occurs in a number of diverse microalgal taxa, notably the Chrysophyceae, Cryptophyta, Dinophyta, and Haptophyta. As definitive tests for these alternative nutritional modes have been largely restricted to microalgae, the nutritional status of most larger aquatic photosynthetic organisms is sometimes unclear (Ramus 1992).
The Study of Photosynthesis: A Coalescence of Disciplines
Since the middle of the 20th century, the main trends in photosynthesis research have been, broadly speaking, moving from biophysical to biochemical to molecular biological and structural processes on one hand, and toward large-scale, global biogeochemical investigations on the other, with each subdiscipline enhancing and modifying the previous research in the others.
From the late 1920s to the late 1960s, studies of the photosynthetic light reactions were primarily biophysical; photosynthesis was studied from the mechanistic perspective of physical chemistry, where the process was treated as a chemical reaction (Clayton 1980; Rabinowitch et al. 1969). Using principles described by empirical mathematical equations, the biological physicists treated photosynthesis as a “black box.” In the early stages of research that approach was especially useful because it allowed for systematic analyses of complex processes without requiring a mechanistic understanding of the processes.

42 | Chapter 1
From the late 1950s through the 1970s, research expanded and became more diversified as biochemists and geneticists explored the nature of the molecules involved in the photosynthetic apparatus. During this period, there was special interest and subsequent progress in understanding the mechanism of carbon fixation, patterns of the flow of electrons and protons, and the generation of ATP in chloroplasts (Lawlor 2001). Interestingly, the reactions responsible for carbon fixation were first elucidated in Chlorella and directly extended to higher plants.
The 1980s hailed the beginning of the molecular biological era, which led to characterization of key genes and proteins responsible for the photosynthetic light reactions and the development of detailed working models of the “photosynthetic apparatus.” By 1985 the entire photosynthetic apparatus of a purple photosynthetic bacterium, Rhodopseudomonas viridis, had been crystallized and analyzed, and its structure could be related to its function at the molecular level (Michel and Deisenhofer 1986, 1988).This structure has been central to the development of conceptual models for the reaction centers in oxygenic photosynthetic organisms (Barber J 1992; Michel et al. 1988). By early in the 21st century, the crystal structures of both photosystem I and II from a thermophilic cyanobacterium had been determined with sufficient resolution to observe how the key components responsible for splitting water and the photochemical generation of an electrical potential are arranged (Jordan et al. 2001; Zouni et al. 2001). These structures continue to be refined and integrated into higher orders (Ferreira et al. 2004). Indeed, entire genomes of several aquatic photoautotrophs have been completely elucidated and comparative analyses of the genes encoding for photosynthetic machinery has been conduced (e.g., Armbrust et al. 2004; Shi et al. 2005).
In the late 1980s, geochemists and biologists began to more fully appreciate the role that aquatic photoautotrophs have played in mediating major biogeochemical cycles of the Earth (Berger et al. 1987; Falkowski and Woodhead 1992; Sarmiento and Bender 1994; Falkowski et al. 2003). These organisms are not only essential to maintaining the steady-state gas composition of the atmosphere, but also appear to be responsive to climate feedbacks (Lovelock 1994; Falkowski et al. 2004a, b). We discuss the biogeochemical processes in the context of the Earth’s climate and the evolution and ecology of aquatic photoautotrophs in chapter 10.
With the powerful combination of biophysics, biochemistry, and molecular and structural biology, as well as geochemistry and remote sensing technologies, considerable progress has been made toward understanding not only the molecular mechanisms basic to water splitting and electron transfer and carbon reduction, but also the extrapolation of that information to the understanding of photosynthetic processes in natural aquatic ecosystems. Integrat

An Introduction to Photosynthesis in Aquatic Systems | 43
ing that information requires an appreciation of both mechanistic, reductionist approaches to photosynthetic processes as well as the more observational, synthetic approaches used to understand the evolution and ecology of photosynthetic organisms. Let us begin with the reductionist approach by examining the physical nature of light and its absorption by the photosynthetic apparatus.