Embed Size (px)
Citation preview

1
An Overview Of
Food,Nutrition & Health in
Islamic Republic of Pakistan
Presented By:
Prof.Dr.Perveen Liaqat
COUNTRY PRESENTATION
Intercountry Technical Consultation on National Food based Dietary Guidelines.6th to 9th Dec.2004
WHO-EMRO,Cairo,Egypt

2
COUNTRY INTRODUCTION

3
Demographic Indicators
Population 130.580 million (PCP 1998) 140 million (Economic Survey03-04) Population Growth Rate 2.2% (Economic Survey 2003-2004) 1.9% (World Development Report 2003)
Economy Agriculture Based
Main Food Crops Wheat,Rice,Sugarcane
Literacy Rate 43.9% (Population census 1998) 54.0% (Economic Survey,estimated 03-04) (66.25 %M & 41.75% F)
Life Expectancy M: 64 years; F:66 years(Pak Dev.House hold survey 1999)
Mortality Rate(Infant) 91 (PCP 1998) 81 (Economic survey 2003-2004)
Mortality Rate(Under Five) 120 (PCP 1998) 105 (Economic survey 2003-2004)
4
a) Per Capita Food Availability as a food security indicator
b) Poverty as food insecurity indicator
1. Food,Nutrition & Health Situation in Pakistan
1.1 Food Availability and Security As An Indicator of Food Situation

5
Items Units 1997-98 1998-99 1999-2000 2001-2002
Cereals Kg 159.7 171.0 163.5 149.3
Pulses Kg 5.9 6.8 7.2 6.1
Sugar Kg 32.8 31.2 26.4 26.1
Milk ltr 147.3 148.0 148.8 150.8
Eggs Doz 2.2 5.1 25.1 5.2
Edible Oil ltr 11.6 12.3 11.1 11.3
Meat Kg 17.9 18.2 18.7 18.9
a) Food Availability per Capita
Calories (per day)
2,655 2,728 2,625 2,306
Protein(per day) gms
68.37 71.85 70.00 67.00
Per Capita Availability of Calories & Protein
Source: Planning & Development Division (PES, 2001-2002)

6
Year Pakistan Rural Urban
1986-87 26.9 29.4 24.5
1987-88 17.3 29.9 22.7
1990-91 23.3 26.2 18.2
1992-93 20.3 22.5 16.8
1993-94 23.6 26.3 (WFP) 19.4(WFP)
1998-99 32.6 34.8 (WFP) 25.9
2002-2003 62.0
Percent
Source: PIDE 1998-99 PSES primary data &
Food security analysis 2003
Food Poverty,Inability to purchase food for daily Healthy diet causes:
unemployment
Low income
No purchasing power to high priced food items
Inadequate knowledge about healthy eating habitsSource: (PHEL-2002)
b) Trends in Food Poverty Incidence:

7
1.2 Nutrition Indicators of Malnutrition
i. Low Birth weight
ii. Childhood Growth
a) Time trend in prevalence of stunting,wasting & underweight
b) Prevalence of Stunting & Wasting among Gender
Source NSWP MNS NNS NHS NNS
Year 1965 1977 1985-7 1990-4 2001-2
Underweight - 53.3 47.9 40.1 37.4
Stunted 49 43.3 41.8 36.3 40
Wasted 11 8.6 10.8 11.8 14.9
Source NHS NNS
Year 1990-4 2001-2
Males Females Males Females
Stunted 36.0 36.3 40.5% 39.5%
Wasted 11.9 11.7 15.4% 14.4%
Underweight 39.8 40.5 37.6% 37.2%

8
c) Prevalence of Stunting and Wasting among Rural/Urban children under five.
Source NHS NNS
Year 1990-4 2001-2
Urban Rural Urban Rural
Stunted 32.1 39.0 34.7% 43.1%
Wasted 11.2 11.5 15.5% 14.6%
Underweight 34.5 41.6 34.7% 39.0%
9
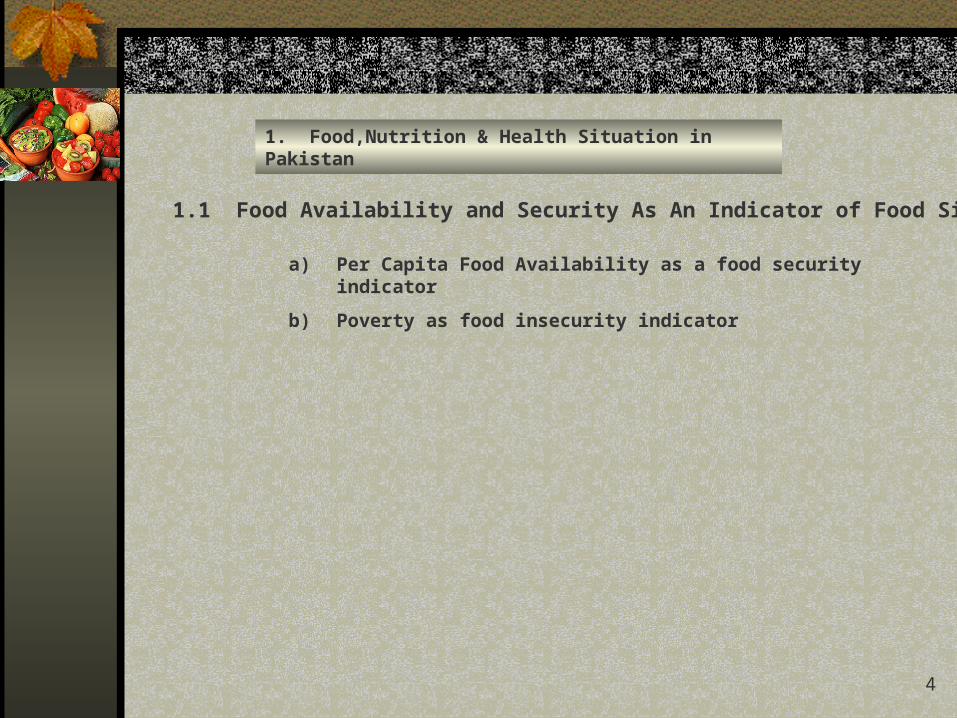
Underweight Non-pregnant mothers 12.5% (Malnourished with BMI<18.5)
Underweight Lactating Mothers 16.1% (Malnourished with BMI<18.5)
Mothers with normal limits of Nutrition 54%
Lactating Mothers More underweight as compare to less Obese non-pregnant women
Source: NNS 2001-2002
iii. BMI as Nutrition Indicator during Pregnancy & Lactation

10
1.3 Prevalence of Micronutrient Deficiencies as Malnutrition Indicators
a) Prevalence of Iron Deficiency Anemia
Moderate Severe
Children 33.0% 2.6%
Mothers 23.7% 1.8%
Iron deficiency Anemia among Children under five & their Mothers

11
b) Prevalence of Vitamin A Deficiency
Clinical Deficiency
Bitot spots,night blindness,xerophthalmia
Prevalence of Bitot spots among children under five 1.2%(NNS 2001-2002)
Prevalence of Night blindness among mothers (during last pregnancy and current)
7.8% to 9.9% respectively
Sub-clinical Deficiencies
Serum Retinol level <0.74 (mol/l) among pre-school children & their mothers
NHS1998 NNS2001-2002
Children Severe retinol level<0.35 mol/l (%) 3.3% 0.8%
Children Moderate retinol level b/w 0.35-0.7 mol/l (%) 31.8% 11.7%
Mother Moderate retinol level b/w 0.35-0.69 mol/l (%) 5.9 %
rural Urban
6.7% 5.4%
Bio-chemical levels of vitamin A among Mothers
Severe(<0.35(mol/l) 0.5%
Moderate(B/w 0.35-0.69) 5.4 %
Source: NNS 2001-2002

12
c) Prevalence of Iodine Deficiency
Clinical Signs
Visible goitre among mothers 12.2%
Palpable goitre among mothers 8.9%
Prevalence of goitre among Mothers by place of Residence
Place of Residence Palpable Visible No Goitre
Urban 7.4% 8.9% 83.8%
Rural 9.8% 14.1% 76.3%
National 8.9% 12.2% 79.1%
Palpable goitre% Visible % No Goitre
Urban 2.1% 1.9% 96.0%
Rural 5.8% 2.6% 91.6%
National 4.4% 2.3% 93.3%
Prevalence of goitre among school-aged children 6-12 years

13
Pre school Children 37.1%
(Serum Concentrations< 60 /dl Zinc level)
Pregnant Women 41.4%
(mother of children under five)
d) Prevalence of Zinc Deficiency (NNS 2001-2002)

14
Sub Clinical Signs (urinary excretion levels)
a) Thiamine
Adults 0.87%
Children 1.85%
b) Riboflavin
adults 0.25%
children 0.71%
e) Vitamin B Deficiencies
Source: NNS 1985

15
1.4 Childhood Morbidity as an indicator
Clinical Signs of Rickets
i. Enlarged Wrist 0.8%
ii. Bowed legs 0.5%
iii. Fontenelle (<2 years) 41.8%
iv. Frontal Bossing(3-5 years) 2.9%
a) Prevalence of vitamin D Deficiency among children upto 59 months
b) Prevalence of Diarrhoea among Children
National level 25%
Urban 20.8%
Rural 27.5%

16
0%
20%
40%
60%
80%
100%
Percent urban Male & Female
LOW Middle High
Female
LOW Middle High
Male
1.5 Overweight and Obesity as indicators of Malnutrition
Source: (NHS 1998)
Obese
Overweight
Desirable
Underweight
Severe thin

17
1.6 Chronic Diseases Related with Overweight and Obesity
i. Serum Cholestrol level
ii. Blood pressures and Hypertension
iii. Non-insulin dependent diabetes

18
1.7 Prevalence of elevated cholestrol levels
People with ECL requiring Nutritional/medical advice 7.3 million
12.6% population
Over 15 years of ages
Urban women over 65 years of age 1/every 3
much higher than their male counter parts
ECL: Elevated Cholestrol Levels (random blood cholestrol of at least 200 mg/ml)
Source: NNS 1990-94

19
1.8 Prevalence of high blood pressure & Hypertension
Blood Pressure(systolic>140 mmHg & Diastolic 90mmHg)
Urban 21.5%
Rural 16.2%
Hypertension
Men 5.5 million
Women 5.3 million
Severe Hypertension 4% urban women of high economic status
Systolic pressure > 180 mmHg
Diastolic pressure> 105 mmHg
Obese urban Female Over 45 years of age 65% hypertensive
Obese rural Female Over 45 years of age 48% hypertensive
Overweight Male(age 45+) 58% hypertensive both rural & urban
Source: (NHS 1994)
010203040506070
Obese Overweight Normal Underweight Thin
Percent urbanPercent rural
Female Male MaleFemale
*
*
0
10
20
30
40
50
60
70
Obese Overweight Normal Underweight Thin

20
1.9 Prevalence of Diabetes among 45-64 years age
Non recorded diabetes 2.7million
Diagnosed diabetes 0.8 million
Urban Male(over 65 yrs age) 15%
Urban Female(45 to 64 yrs) 18%
Rural Male 5%
Rural Female(45 to 64 yrs) 7%
Prevalence of diabetes
among urban female one in every 4th
of 45 years & above
Source: (NHS 1994)
21
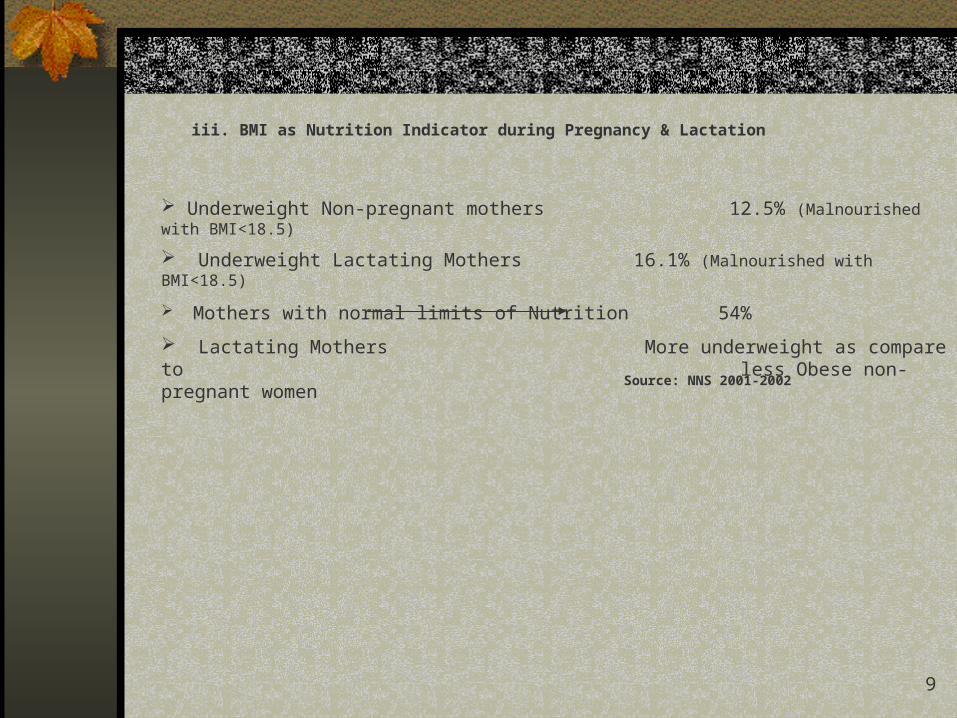
1.10 Other Health Diseases Common
a) Chronic Bronchitis caused by Tuberculosis & Chronic Obstructive Pulmonary Disease (COPD)
Rural Women(age 65 and above) 14%
Rural Men 6%
Urban(both sexes) 9%
b) Renal Impairment
Chronic Kidney problems *
(Among 40-49 yrs of age group ) 7%
(Among 50-59 yrs of age group) 17%
60+ in both rural and urban areas 13%
* It includes renal insufficiency and creatinine. Renal insufficiency is a clinical condition in which blood urea nitrogen is over 40 mg/dl and creatinine is over 1.2 mg/dl. It is used to monitor kidney function and early screening.
Source: NHS 1990-4

22
10000
12000
14000
16000
18000
20000
220009
0-9
1
91
-92
92
-93
93
-94
94
-95
95
-96
96
-97
97
-98
98
-99
99
-00
00
-01
20
01
-02
3-F
eb
03
-04
(P)
2. National Food situation in Pakistan
Wheat Production (000 Tonnes)
Rice Production (000 Tonnes)
2000
2500
3000
3500
4000
4500
5000
5500
Sugarcane Production (000 Tonnes)
30000
35000
40000
45000
50000
55000
60000
2.1 Food Production
a) Trends of major food crops production
Source: Economic Survey 2003

23
Livestock:• Accounts for 49.1% of agricultural value added and about 11.4% of the GDPØ 30-35 million rural population is engaged in livestock raisingØ Live stock include cattle, buffalos, sheep, goats, camels, horses, assess and mules Poultry:Ø Good substitute of beef and muttonØ According to Livestock Wing of Ministry of food, agriculture and livestock, almost every family in rural area and every fifth family in urban area is associated with poultry production Fisheries:Ø Fisheries contribute substantially to the national income through export earningsØ During July-March 2003-04, 101256 m. tones values at Rs.7.9 billion fish and fishery products were estimated to be exported to Japan, USA, UK, Germany, Middle East, Sri Lanka, China etc.Ø During the same period, the total fish production is estimated at 630,000 m. tonesØ The total number of persons engaged in fisheries during 2003-04 is estimated at 395,000
Source: (Economic Survey of Pakistan 2003)
b) Other Important Foods Commodities

24
2.2 DAILY FOOD INTAKE PATTERN
2.2.1 Average daily intake of food by Mothers (NNS 2001-02)
2.2.2 Consumption Frequency of different food items for weak
2.2.3 Average Intake of Food by Children-by Food Groups
2.2.4 Type of Bread Consumed by Regions
25
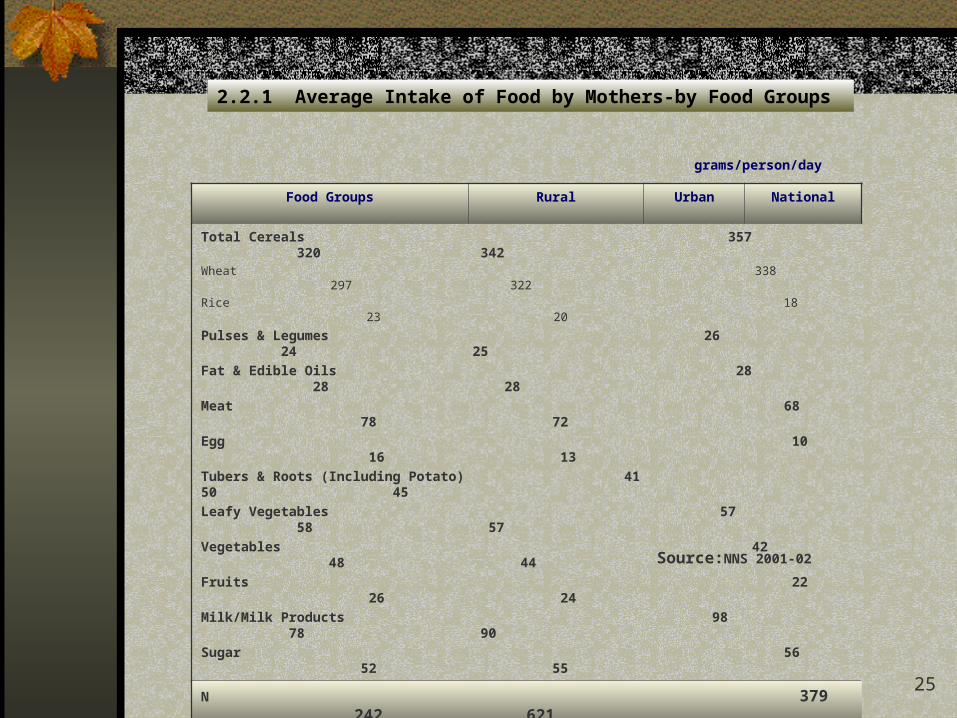
2.2.1 Average Intake of Food by Mothers-by Food Groups
Food Groups Rural Urban National
Total Cereals 357 320 342Wheat 338 297 322Rice 18 23 20
Pulses & Legumes 26 24 25 Fat & Edible Oils 28 28 28Meat 68 78 72 Egg 10 16 13Tubers & Roots (Including Potato) 41 50 45Leafy Vegetables 57 58 57Vegetables 42 48 44Fruits 22 26 24 Milk/Milk Products 98 78 90Sugar 56 52 55
N 379 242 621
grams/person/day
Source:NNS 2001-02

26
2.2.2 Average Intake of Food by Children-by Food Groups
Food Groups Rural Urban National
Total Cereals 235 271 226Wheat 174 156 165Rice 61 61 61
Egg 2.5 1.4 1.9Meat 29 33 31Milk/Milk Products 229 233 231
N 379 242 621
Types of Wheat Bread Consumed by Regions
Region N Roti Khameeri(Hot Plate)
Roti Pateeri(Hot Plate)
Roti Pateeri(Baked)
Nan(Baked)
NationalUrbanRural
621242379
171218
687165
101010
575
Grams/child/day
Source: NNS 2001-02

27
Most frequent Foods used N Once Twice 3-4 times 5-6 times Daily
All MeatUrbanRuralNational
242379621
233027
252022
181214
322
524
ChickenUrbanRuralNational
242379621
353334
191215
989
111
1107
Milk/Milk ProductsUrbanRuralNational
242379621
171314
587
766
222
242424
CarrotsUrbanRuralNational
242379621
354
111
222
011
101
Green Leafy VegetablesUrbanRuralNational
242379621
363133
181919
101614
143
655
Wheat BreadUrbanRuralNational
242379621
724
623
555
151314
828584
2.2.3 Consumption Frequency of Different Food Items Per WeekPercent
Source: NNS 2001-02
28
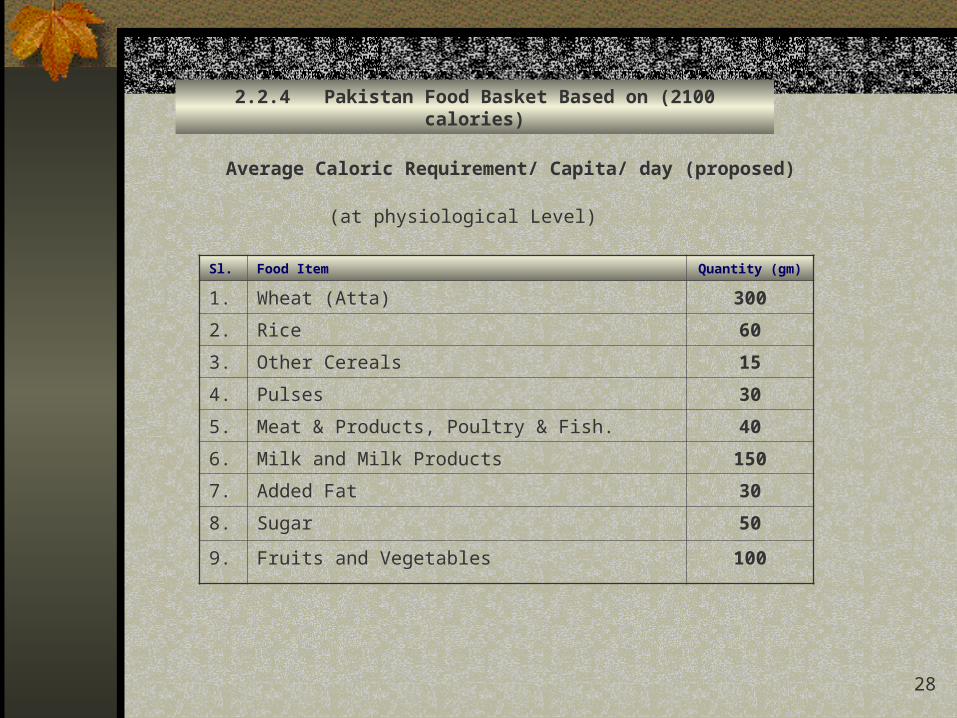
2.2.4 Pakistan Food Basket Based on (2100 calories)
Average Caloric Requirement/ Capita/ day (proposed)
(at physiological Level)
Sl. Food Item Quantity (gm)
1. Wheat (Atta) 300
2. Rice 60
3. Other Cereals 15
4. Pulses 30
5. Meat & Products, Poultry & Fish. 40
6. Milk and Milk Products 150
7. Added Fat 30
8. Sugar 50
9. Fruits and Vegetables 100

29
3. Food and Nutritional National policies
3.1 Existing
9th five year programme(2003-08)
Capacity development at all levels to address nutritional problems
Control of nutritional disorders
Universal accessibility to safe and balanced food
Awareness through education for healthy lifestyle and adopting improved nutritional practices
Initiation of community based growth monitoring policy for young child and maternal nutrition.
Promotion and protection of breastfeeding.
Development of strategic frame work. Consensus building among stakeholders for graphical & practical national nutrition strategic plan
National fond fortification
Research
a) Food Dietary Guidelines
b) Efficiency of single close vitamin A and Serum retinal level in locating moth
Micro nutrient supplementation

30
Tawana Pakistan: School Nutrition Package for girls
National Programme for Family Planning and Primary Health Care/ The Lady Health Workers Programme
Bait-ul-Mal’s Food Support Programme
Pakistan Standards and Quality Control Authority
3.2 Ongoing Nutrition programmes and Projects

31
World Health Organization
Micronutrient Initiative (MI) US aid Supported Programme
FAO
British Council
DFID
Save the Children Fund
Unicef
Unesco
3.3 International Organizations (working on Food,Nutrition and Health)

32
Department of Preventive Peadiatrics, KEMC, Punjab Faisalabad Agricultural University, Punjab Department of Human Nutrition, NWFP Agriculture University Pakistan Institute of Community Ophthalmology (PICO), NWFP Nuclear Institute of Food and Agriculture (NIFA), NWFP Agha Kahn University, Sindh Department of Pediatrics, Unit 1, Civil Hospital, Karachi Department of Home and Health Sciences, Allama Iqbal Open University
(National Level) Departments of Food & Nutrition at Home Economics Colleges at Provincial level
3.4 EDUCATIONAL INSTITUTES IMPARTING NUTRITION EDUCATION AND RESEARCH

33
Society for the Protection of the Rights of Child (SPARC), Islamabad Society for the Advancement of Community, Health, Education and Training
(SACHET), Islamabad Punjab Lok Sujag Jahandad Society for Community Development (JSCD), Punjab Oxfam NGO, Balochistan
3.5 NON-GOVERNMENT ORGANIZATIONS(working on nutrition & health)
34
Ministry of Health: Nutrition WingNational Nutrition ProgrammeUSI/ IDD Prevention ProgrammeVitamin A supplementation ProgrammeWorld Food programmeCBNP/ Baby Friendly Hospital Initiative (BFHI) ProgrammeNutrition rehabilitation unit (NRU) programme in NWFPNutrition Support Programme in SindhNational food fortification programme
3.6 GOVERNMENT stake holders (working on Different Nutrition Programmes)
Nutrition Section, Planning and Development Division, Government of PakistanUniversal Salt Iodization ProgrammeIDD WorkshopResearch, Publications, LiteratureMicronutrient fortification in collaboration with MI
National Institute of Health Applied Research
Laboratory ServicesIDD control Programmes in AJK, NA and Parts of NWFP

35
Under Nutrition PEM in Infants and Children
Poverty Illiteracy and lack of nutritional sp. awareness Poor Sanitation Rising Unemployment viza viz price instability
Maternal malnutrition Young girls
Dietary imbalances Early marriages Frequent pregnancies Non-affordability of health food due to poverty Inflation(Low purchasing power) Rural/Urban disparities Cultural Norms
Micronutrient disorders• Anemia• IDD• Vitamin A deficiencies• Zinc
Lack of awareness Excessibility and affordability to nutritional foods(Iodized salt,fortified foods) Non-bioavailability of some important nutrients Dietary Norms Resistance to diet modification
Vitamin D deficiency Lack of awareness
Over weight/Obesity Leading to diet related chronic diseases such as cardiovascular disease, hypertension, diabetes,Renal and dental carries
Excess to extra calories(Fat and simple sugar based) Reduced physical activities Cultural Norms Lack of low cost health clubs Casual attitude on middle and old age Nutritional health
3.7 Summary of Nutritional Problems and Underlying Causes:

36
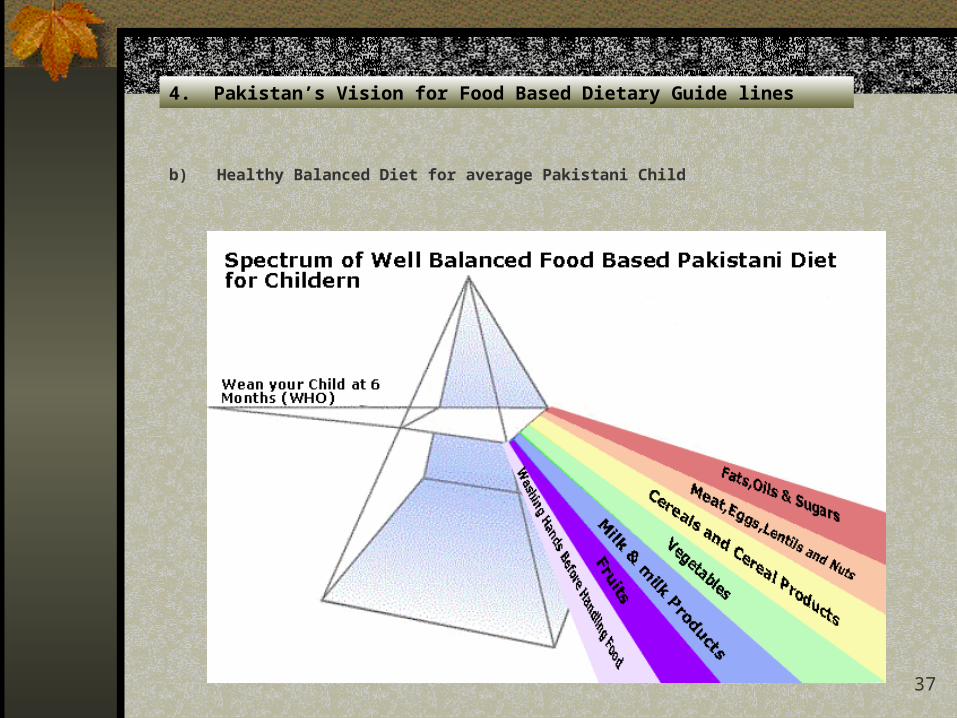
4. Pakistan’s Vision for Food Based Dietary Guide lines
a) Healthy Balanced Diet for average Pakistani
37
4. Pakistan’s Vision for Food Based Dietary Guide lines
b) Healthy Balanced Diet for average Pakistani Child