Embed Size (px)
Citation preview
1
AUTOMATION: WILL THE FOURTH INDUSTRIAL REVOLUTION
LEAD TO THE DOWNFALL
OF HUMAN LABOR?
by
Michael Justin Marsh
Submitted in partial fulfillment of the
requirements for Departmental Honors in
the Department of Finance
Texas Christian University
Fort Worth, Texas
May 8, 2017

2
AUTOMATION: WILL THE FOURTH INDUSTRIAL REVOLUTION
LEAD TO THE DOWNFALL
OF HUMAN LABOR?
Project Approved:
Supervising Professor: Vassil Mihov, Ph.D.
Department of Finance
Michael Sherrod
Department of Entrepreneurship

3
ABSTRACT
When widespread innovation dramatically increases the productivity of the average
worker, structural unemployment eventually follows. This thesis explores historical trends
which led to widespread structural unemployment and examines the technological
capabilities of automation. Peer groups of publicly traded companies within the automotive
manufacturing and steel-producing industries are examined to determine if a mathematical
relationship can explain the phenomenon. While the regression analyses were inconclusive
as a whole, some insight was gained in the process. There are several decisions in policy
that have been discussed by economists, political leaders, and philosophers. There may not
be one right answer, but a need to continue the ongoing debate and prepare for a possibility
of workforce disruption.
4
Table of Contents Introduction ..................................................................................................................... 5
Research Question ....................................................................................................... 7
Literature Review ............................................................................................................ 8
I. The Birth of Automation .......................................................................................... 8
I. A. Phase One: Industrial Automation .................................................................... 9
I. B. Phase Two: The Boom of Information Technology ........................................ 12
II. The Technical Capabilities of Automation ............................................................ 15
II. A. Limitations of Automation ............................................................................ 15
II. B. Possible Solutions ......................................................................................... 18
III. Published Theory on the Economic Long-term Effect of Automation................... 20
Research Methodology .................................................................................................. 23
Data Regression......................................................................................................... 26
Regression Results .................................................................................................... 27
Manufacturing Sector ............................................................................................ 27
Automotive Industry .............................................................................................. 27
Primary Metal Industry .......................................................................................... 30
Interpretation of the Results ....................................................................................... 31
Discussion and Implications: What is the solution?........................................................ 33
I. The Collapse of Capitalism .................................................................................... 33
II. Policy Responses – The Robotic Tax and Universal Basic Income ........................ 35
III. New Industry will Replace Outdated Occupations................................................ 36
Conclusion .................................................................................................................... 38
References ..................................................................................................................... 40
Appendix....................................................................................................................... 45
Manufacturing Sector Regression .............................................................................. 45
Automotive Data Regression ..................................................................................... 45
Steel Producer Data Regression ................................................................................. 49
5
Introduction
There have been many milestones in technology that have completely changed the
human’s role in society. In a sense, the theory of Darwinism explains these drastic
improvements and changes. These manmade tools are constantly refined and specialized,
becoming cheaper and more effective. The most productive method will always prevail.
Since the eighteenth century, the process of manufacturing has been streamlined. Prior
to the Industrial Revolution, many common goods were hand-made by specialized
craftsmen. To work in the profession one would need to spend years as an apprentice,
learning the skills required to craft a quality product. These artisans would individually
work on each product at a fairly standard pace. Output would linearly increase in tandem
with the number of skilled laborers employed.
However, this changed with the advent of ‘deskilling’ and the assembly line.
‘Deskilling’ is the process of simplifying a way a product is made into a sequence of
various tasks, each requiring brief and specific training to master (Attewell, 1987).
Dividing and distributing these tasks to a larger number of workers resulted in a faster
process and increased output. The benefits of this process can be illustrated when looking
at how a plow can be manufactured. In the eighteenth century, an artisan shop would
require two highly skilled craftsmen to spend 118 man-hours to produce a plow.
Essentially, only two tasks could be completed at a time. In contrast, a factory could divide
the process into 97 distinct tasks (of which 72 were assisted by steam power) and employ
52 workers to complete them in only 3.75 man hours (US Department of Labor, 1899).

6
With the advent of the assembly line, manufacturing production capacity expanded
dramatically.
Since the dawn of machinery, man has feared the possibility of becoming obsolete.
This was the case with the Luddite riots that took place between 1811 and 1816. These
riots featured English textile workers whose artisanal jobs were threatened by the industry-
wide adoption of automated textile equipment. Unskilled laborers, armed with automated
equipment, outworked men who spent their whole lives specializing in the craft. Ben Ludd
commanded a group of outraged colleagues who would destroy various pieces of
equipment, threaten mill owners, and wreak havoc on the marketplace. At the peak of the
conflict, the crown had to employ 12,000 troops to combat a single riot (Mantoux, 2006).
While the organization was terminated in 1816, the idea still lives on today. The term
Luddite fallacy is used by economists to refer to a fear of technological advances in
production that will eventually lead to structural unemployment. The notion of Luddism is
even present today, with middle-wage workers in manufacturing and servicing jobs.
This fear is rational when considering the economic implications of the Industrial
Revolution. Some economic historians estimate that wages actually fell 10 percent between
1770 and 1810 (Clark, 2005). In fact, it may have taken the common Englishman 60 years
to finally see wage growth. While English business owners benefitted from the increased
productivity, private per capita consumption in England is estimated to have grown a
modest 22 percent between 1760 and 1831 (Harley, 2012).

7
Research Question
This thesis is going to explore how rational this fear is and try to answer the question:
“Will the rise of automation lead to the downfall of low- and middle-wage jobs?” To
understand the context of a question that society has been faced with for over two centuries,
the relationship between previous industry-disrupting technological advancements and
labor productivity must be examined. To predict how susceptible laborers are to
automation, upcoming trends in several industries will be carefully considered. The
limitations of automation will be tested. A statistical regression will be developed and
tested to determine the structural unemployment risk and hopefully will answer the
following question: What happens when the tools that man has created perform better than
man himself?

8
Literature Review
I. The Birth of Automation
This thesis provides a historical perspective regarding the advent of productivity-
increasing technologies and its impact on the workforce. Many scholars have openly
studied the effects of automation, since its inception in the late eighteenth century with the
water powered flourmill. Both economists and political leaders have pondered the long-
term effects of widespread automation on the economy and society. Karl Marx was one of
the first to publish his concerns about technological advancements in the socialist
manifesto Capital: A Critique of Political Economy.
Within the capitalist system all methods for raising the social productivity
of labour are put into effect at the cost of the individual worker; all means
for the development of production undergo a dialectical inversion so that
they become means of domination and exploitation of the producers; . . .
they alienate from him the intellectual potentialities of the labour process in
the same proportion as science is incorporated in it as an independent power
(Marx, 1867).
Marx shared Ludd’s sentiment that the technology used to increase productivity
would eventually disadvantage the laborers intended to utilize it. This belief is much more
pessimistic than that of traditional economists. During the Great Depression, John Maynard
Keynes gave an alternate view on the same issue in his essay Economic Possibilities for
Our Grandchildren. Keynes refers to the shift from human to automated labor as
“technological unemployment”:

9
We are being afflicted with a new disease of which some readers may not
yet have heard the name, but of which they will hear a great deal in the years
to come – namely, technological unemployment. This means
unemployment due to our discovery of means of economizing the use of
labor outrunning the pace at which we can find new uses for labor... But this
is only a temporary phase of maladjustment. All this means in the long run
that mankind is solving its economic problem. I would predict that the
standard of life in progressive countries one hundred years hence will be
between four and eight times as high as it is (Keynes, 1933).
What Marx believed was the crux of capitalism, Keynes believed was a result of finding
the solution to solving mankind’s economic problem – that is, man’s basic needs of food,
shelter, and societal purpose (Keynes, 1933). Nearly a century later, Keynes’ broad
prophecy that technology will completely replace labor is still in question.
How far has society, technology, and the labor market progressed since Keynes’
findings during the Great Depression? Autor’s paper Why Are There Still So Many Jobs?
The History and Future of Workplace Automation examines the rapid growth of automation
following World War II. Similar to Autor’s discussion, there are two distinct time periods
that will be examined: 1) World War II to 1980, and 2) 1980 to present day.
I. A. Phase One: Industrial Automation
The first period (which for all intents and purposes will be referred to as Phase
One) is characterized by the post-war economic boom and a strong middle-class.
Mechanical and production technological advancements decreased demand for labor in
occupational tasks that were physically demanding, menial, and dangerous. The labor

10
force, armed with a large concentration of high school graduates, shifted towards more
information-based tasks such as administrative, clerical, and sales roles. Agricultural labor
as a share of the labor work force, fell about 4 percent per decade during this period (Autor,
2015). This is ultimately seen as a positive, as the labor force shifted towards more
professional, middle-wage roles.
About halfway through this era, TIME Magazine summarized this effect of
automation in The Automation Jobless. This article warned of the productivity-increasing
effects of automation. Research of various industries showed that growth in production far
outpaced the demand for labor:
Though steel capacity has increased 20% since 1955, the number of men
needed to operate the industry's plants—even at full capacity—has dropped
17,000. Auto employment slid from a peak of 746,000 in boom 1955 to
614,000 in November, just before the current layoffs became severe. Since
the meat industry's 1956 employment peak, 28,000 workers have lost their
jobs despite a production increase of 3%. Bakery jobs have been in a steady
decline from 174,000 in 1954 to 163,000 last year. On the farm one man
can grow enough to feed 24 people; back in 1949 he could feed only 15
(TIME, 1963).
This article was one of the first instances a mainstream publication acknowledging fear of
the growth of technology. The article concluded that the rise of automated production
technology would continue to expand at a nearly exponential rate.
The long-term negative impact is that domestic production will continue to expand
at a fast pace but no new jobs will come from this growth. Without regulation and proper

11
policy, businesses could abandon their lifeblood: the hardworking men and women whose
viability depends on their economic usefulness.
In response to outcry from the unemployed and publications such as TIME
Magazine, President Lyndon B. Johnson established the Blue-Ribbon National
Commission on Technology, Automation, and Economic Progress in 1964. The
commission’s main purpose was to determine how damaging the effects of automation
could be on the labor workforce. Should the findings raise concern, policy makers would
have a case to pass proactive legislation to protect the working class. The commission
reported its findings after two years of careful examination:
Thus technological change (along with other forms of economic change) is
an important determinant of the precise places, industries, and people
affected by unemployment. But the general level of demand for goods and
services is by far the most important factor determining how many are
affected, how long they stay unemployed, and how hard it is for new
entrants to the labor market to find jobs. The basic fact is that technology
eliminates jobs, not work... Technology enlarges the capacities of man and
extends his control over his environment (Bowen, 1966).
The commission measured the impact of technological developments on
productivity using annual growth of output per man-hour in the private economy as a
standard metric. Between 1909 and 1947, this number was 2 percent per year. Between
1947 and 1964, this number was 3.1 percent per year. Should growth in productivity exceed
growth in demand for output, demand for labor would be expected to decrease. Further in
the report, the commission finds that the labor group at risk is the uneducated and unskilled
12
workforce (referred to as the “back of the line” unemployed). The commission
recommended specific policy to empower this group:
A guaranteed minimum income for each family; using the government as
the employer of last resort for the hard core jobless; two years of free
education in either community or vocational colleges; a fully administered
federal employment service, and individual Federal Reserve Bank
sponsorship in area economic development free from the Fed’s national
headquarters (Bowen, 1966).
Phase One brought with it workforce and societal changes that dramatically
increased the typical American household’s quality of life. In 1960, about 50 percent of the
labor force obtained a GED. By 1980, that number reached 75 percent (King, et al., 2011).
I. B. Phase Two: The Boom of Information Technology
The latter period (Phase Two) birthed the innovation of information technology,
which grew at an unprecedented pace. Computers became cheaper and more accessible,
solving high-level problems in fractions of a second; formal problems such as counting,
sorting, mathematics, and logical deduction no longer needed to be performed through
primitive human calculation. Autor describes which class of workers was most impacted:
Routine tasks are characteristic of many middle-skilled cognitive and
manual activities: for example, the mathematical calculations involved in
simple bookkeeping; the retrieving, sorting, and storing of structured
information typical of clerical work; and the precise executing of a
repetitive physical operation in an unchanging environment as in repetitive
production tasks. Because core tasks of these occupations follow precise,
13
well-understood procedures, they are increasingly codified in computer
software and performed by machines. This force has led to a substantial
decline in employment in clerical, administrative support, and to a lesser
degree, in production and operative employment. (Autor, 2015)
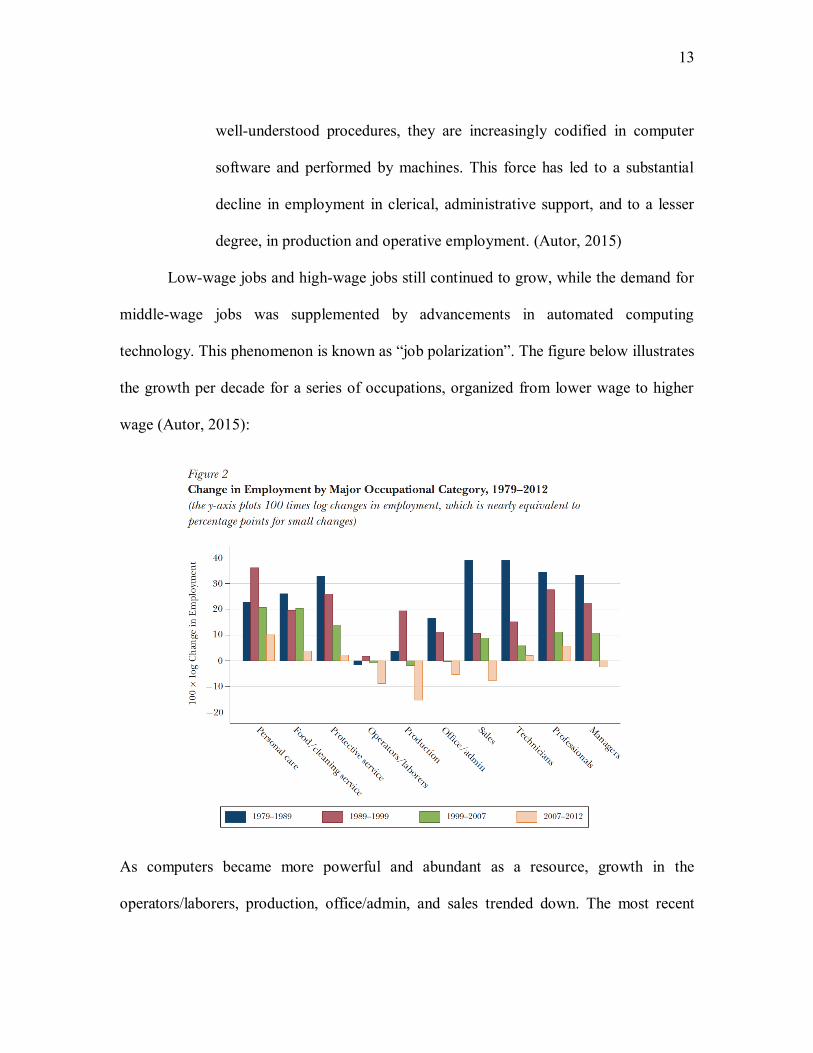
Low-wage jobs and high-wage jobs still continued to grow, while the demand for
middle-wage jobs was supplemented by advancements in automated computing
technology. This phenomenon is known as “job polarization”. The figure below illustrates
the growth per decade for a series of occupations, organized from lower wage to higher
wage (Autor, 2015):
As computers became more powerful and abundant as a resource, growth in the
operators/laborers, production, office/admin, and sales trended down. The most recent

14
period observed (2007-2012) shows negative growth across the board. This dumbbell
shaped graph illustrates the disparity of the allocation of employment.
Why are middle-wage jobs the most susceptible to being replaced? Intuition would
suggest that advancing computer technology should render the low-skill jobs susceptible
to automation rather than the middle-wage jobs. Currently, automated solutions are limited
to solving problems that can be explicitly described and coded. The simplest tasks, such as
recognizing a ledge one can sit on or cleaning out the inside of a car require abstract thought
and common sense – something that cannot be outright programmed. Economist and
philosopher Michael Polanyi, observed these tasks as “We know more than we can tell”
(Polanyi, 1966). Autor describes the Polanyi Paradox in greater detail:
We are engaging in tasks that we only tacitly understand how to
perform... the tasks that have proved most vexing to automate are
those demanding flexibility, judgment, and common sense... High-
level reasoning uses a set of formal logical tools that were developed
specifically to address formal problems: for example, counting,
mathematics, logical deduction, and encoding quantitative
relationships… Manual tasks are characteristic of food preparation
and serving jobs, cleaning and janitorial work, grounds cleaning and
maintenance, in-person health assistance by home health aides, and
numerous jobs in security and protective services… While these
activities are not highly skilled by the standards of the US labor
market, they present daunting challenges for automation (Autor,
2015).
15
Foresight from LBJ’s Commission suggested that the low-skill jobs would absorb most of
the risk of being replaced. In reality, it was the routine, information processing tasks that
were most susceptible to automation following 1980.
The question remains as to what extent information processing tasks can be
replaced and if this technology could evolve to take on these conceptual, sensorimotor, and
adaptive tasks much like the human species did.
II. The Technical Capabilities of Automation
Prior to exploring the limitations of automation, one must understand that
technology improves at a pace that is unpredictable in speed and scope. To give some
context to how much computing has expanded, William Nordhaus wrote the paper Two
Centuries of Productivity Growth in Computing in 2007. He estimated that the cost of
performing a standardized set of computations has fallen by 1.7 trillion-fold since the
manual-computing era, with most of this growth occurring in the 1980’s (Nordhaus, 2007).
With this exponential growth, something that is seen as a limitation of automation
technology today could be overcome in a couple years’ time.
II. A. Limitations of Automation
In 2013, Frey and Osborne observed how susceptible each occupation is to full
automation. Ultimately, the breadth of jobs at risk was determined by the nature of the task.
In the academic paper, the authors produced a list of limitations that computers have.
Perception and manipulation tasks are among the most difficult for computers to process.
Computers are programmed, meaning a programmer must be able to write deliberate code
and algorithms that direct a machine to react when stimulated by certain variables. They
go on to discuss robotic and automation short-comings relative to man:

16
Robots are still unable to match the depth and breadth of human perception.
While basic geometric identification is reasonably mature, enabled by the
rapid development of sophisticated sensors and lasers, significant
challenges remain for more complex perception tasks, such as identifying
objects and their properties in a cluttered field of view. As such, tasks that
relate to an unstructured work environment can make jobs less susceptible
to computerisation (Frey and Osborne, 2013).
Creative intelligence is yet another human characteristic that is nearly impossible
to code (Boden, 2003). The utility of creative thinking is not limited to painting a picture,
writing a subtle joke, or composing a music melody; creativity is where adaptive thinking
stems from. This is crucial for tasks that are less routine in nature. This may be man’s
greatest advantage over machine. In the high-wage jobs, the ability to draw on past
experiences and knowledge to develop a flexible strategy takes a premium to brute force.
Another challenge of replicating creativity is that it draws from human norms and values.
Human values are constantly changing. Even if a program were able to replicate human
creativity, that design would be obsolete as cultural norms shift.
Social intelligence is yet another human characteristic that is difficult to replicate
(Broekens, et al., 2009). Whether it be customer-to-employee interactions or employee-to-
employee interactions, there are a myriad of ways to send the same message. The Turing
Test examines an algorithm’s ability to carry a convincing conversation with a human. The
protocol is simple:
In each competition, a human judge simultaneously holds computer-based
textual interactions with both an algorithm and a human. Based on the

17
responses, the judge is to distinguish between the two (Frey and Osborne,
2013).
Ever since the test’s inception in 1990, there has yet to be a computer that can
outperform a human in this test (Masnick, 2014). Ben Goertzel, a well-known pioneer in
the robotics and artificial intelligence space, identified some of the key reasons why we
have not developed a program that can pass the test: first, computer hardware is not nearly
strong enough to support real intelligence; second, lack of funding for artificial general
intelligence; and finally, the challenge of integrating existing artificial intelligence
components together to work seamlessly and dependently on one another (Goertzel, 2012).
Singularity Hub, a website that covers all things technology and artificial
intelligence, has posted a timeline for the future of A.I:
By the late 2010s… Ten terabytes of computing power (roughly the same
as the human brain) will cost about $1,000. By the 2020s… The Turing test
begins to be passable. Self-driving cars begin to take over the roads, and
people won’t be allowed to drive on highways. By the 2030s, virtual reality
will begin to feel 100% real. We will be able to upload our
mind/consciousness by the end of the decade. By the 2040s, non-biological
intelligence will be a billion times more capable than biological intelligence
(a.k.a. us)… By 2045, we will multiply our intelligence a billionfold by
linking wirelessly from our neocortex to a synthetic neocortex in the cloud
(Diamandis, 2015).
Kurzweil’s bold predictions portray a future of endless possibilities for the utility of
artificial intelligence. The next milestone, whether AI can pass the Turing Test, is expected
18
to be achieved in the next decade. Should Kurzweil’s predictions come to fruition,
automation’s utility will bleed in to many fields that are considered safe today.
Consumers are increasingly comfortable with investing their savings in automated
investment funds. Between 2010 and 2016, Eureka Hedge’s A.I./Machine Learnings
Hedge Fund index netted annual returns of 8.44 percent, surpassing the human-ran index
returns of 2.62 percent (Eureka Hedge, 2017). BlackRock, one of the world’s largest asset
managers, is consolidating an entire division to make room for algorithm-based
quantitative analysis:
The company has taken the view that it is difficult for human beings to beat
the market with traditional bets on large U.S. stocks. So the firm on Tuesday
announced an overhaul of its actively-managed equities business that will
include job losses, pricing changes and a greater emphasis on computer
models that inform investments. Seven stock portfolio managers are among
several dozen employees who are expected to leave the firm as part of the
revamp (Krouse, 2017).
II. B. Possible Solutions
The Polanyi Paradox is an explanation of what has yet to be accomplished with
automation technology rather than what can not be accomplished. There are two defined
workarounds to the limitations mentioned in the previous section: Environmental Control
and Machine Learning (Autor, 2015):
The first path circumvents Polanyi’s paradox by regularizing the
environment, so that comparatively inflexible machines can function semi-
autonomously. The second approach inverts Polanyi’s paradox: rather than

19
teach machines rules that we do not understand, engineers develop
machines that attempt to infer tacit rules from context, abundant data, and
applied statistics (Autor, 2015).
Environmental Control limits the amount of change that occurs while the automated
robot is at work. As discussed earlier, there are many tasks that require the ability to adapt.
With the current state of automation in factories, a business would find it more effective to
spend time and resources designing the environment around the existing machine rather
than design a new machine to work in an existing environment. Engineers must focus on
the environment the robots work in. While one can try their best to program a robot to
autonomously adapt with the job, there is a greater return on investment for projects which
instead focus on controlling the environment and limit variability.
Lights-out manufacturing refers to an assembly line process that is completely free
of any human input (Aeppel, 2002). The meaning of the phrase ‘lights-out’ is literal, in that
robots don’t require lights or air conditioning when in operation. Japanese robotics
company FANUC is the most well-known example of a functional lights-out manufacturer.
A series of autonomous robotic arms manufacture FANUC’s legacy product, autonomous
robotic arms. The technology is so reliable and sophisticated that it can run for 30 days
with no human intervention (Tracy, 2016).
There is debate as to whether this form of manufacturing is economically viable for
other production lines. Much like other technological developments, supply and demand
economics dictate that the price will decrease as diffusion occurs. Data suggests that
commercialized robots are becoming much more affordable. According to the International

20
Federation of Robotics, between 1990 and 2005 quality-adjusted robot prices fell 80
percent (IFR, 2006). This is a compounded annual decline of just over 10 percent a year.
Machine Learning is a brute force way of programming machines to learn non-
routine tasks. Rather than articulate code to mimic abstract thought, engineers would
design computers that observe large amounts of data of a particular task and attempt to
develop an algorithm that can replicate the solution. How accurate and applicable is this
technology? Search engines utilize machine learning to guess which results from a database
will best match a user’s inputted query.
Autor summarizes his findings on the usefulness of machine learning: “the tools
are inconsistent: uncannily accurate at times; typically only so-so; and occasionally
unfathomable” (Autor, 2015). For example, IBM’s Watson frequently competes in the
popular television show game, Jeopardy! In several instances the artificial intelligence
successfully defeated its opponents including long-time winner, Ken Jennings. However,
there are some quirks when machine learning digests a massive amount of data.
Programmers added Wikipedia and urban dictionary to the AI’s vocabulary repository in
hopes of increasing the program’s understanding of informal slang and double entendre.
When a researcher asked Watson an ambiguous question, the program responded with the
phrase “Bullshit!” Watson had developed a vulgar lexicon. It took a team of 35 people to
develop a filter that removed obscenities from Watson’s vocabulary (Bort, 2013).
III. Published Theory on the Economic Long-term Effect of Automation
There are several academic papers that explore the implications of automation
replacing a large portion of existing jobs. The Future of Employment: How Susceptible Are
Jobs to Computerisation (Frey and Osborne, 2013) peers at the practicality of automating

21
the current labor force based on a set pool of limitations. Robots at Work (Graetz and
Michaels, 2015) uses a mathematical model to quantify how much commercialized robots
increased productivity between 1993 and 2007. Robots Are Us: Some Economics of Human
Replacement (Benzell, et al., 2015) attempts to predict what occupations in the future are
at risk of being replaced.
The Future of Employment gives insight into a framework that can be used to
determine which jobs are at risk of being replaced by robots. A mathematical model looks
at the susceptibility of 12 different types of occupation and uses various inputs to forecast
the growth of technology that can automate various tasks. The study estimated the
probability of automation for 702 detailed occupations. The conclusion was 47 percent of
existing jobs are at risk of being replaced by automation. The distribution chart from the
paper summarizes these findings (Frey and Osborne, 2013):
22
More surprising, at first sight, is that a substantial share of employment in
services, sales and construction occupations exhibit high probabilities of
computerisation (Frey and Osborne, 2013).
Industrial robots have heavily impacted manufacturing industry since the end of the
twentieth century. Graetz and Michaels discussion paper, Robots at Work, attempts to
examine the utilization of industrial robot equipment across 17 developed countries to
quantify the impact on gross domestic product. The paper utilizes information the total
count of robots utilized across 14 industries. This discussion paper was the first of its kind,
attempting to determine the economic impact of industrial robots and what the greater
implications are to the labor market.
The headline conclusion is that industrial robots increase the average country’s
GDP and labor productivity annually by 0.37 and 0.36 percent, respectively. Industrial
robots rapidly became affordable enough to be a commercially viable investment, falling
50 percent between 1990 and 2005. Over the same period, annual shipments increased from
about 70,000 to 120,000 (IFR, 2006).
In Robots Are Us, a mathematical model examines the impact of automation on the
workforce and available capital. The idea is that demand for low-skill workers will fall
because automated technology makes each worker more replaceable. A decline in wages
limits what younger generations can save and invest, in other words capital available for
investment. The problem exacerbates over time as each generation enters a workforce with
less innovation, less investment and lower wages. The result is an economy with anemic
production growth, stagnant wages, and little capital available for investment.
23
Research Methodology
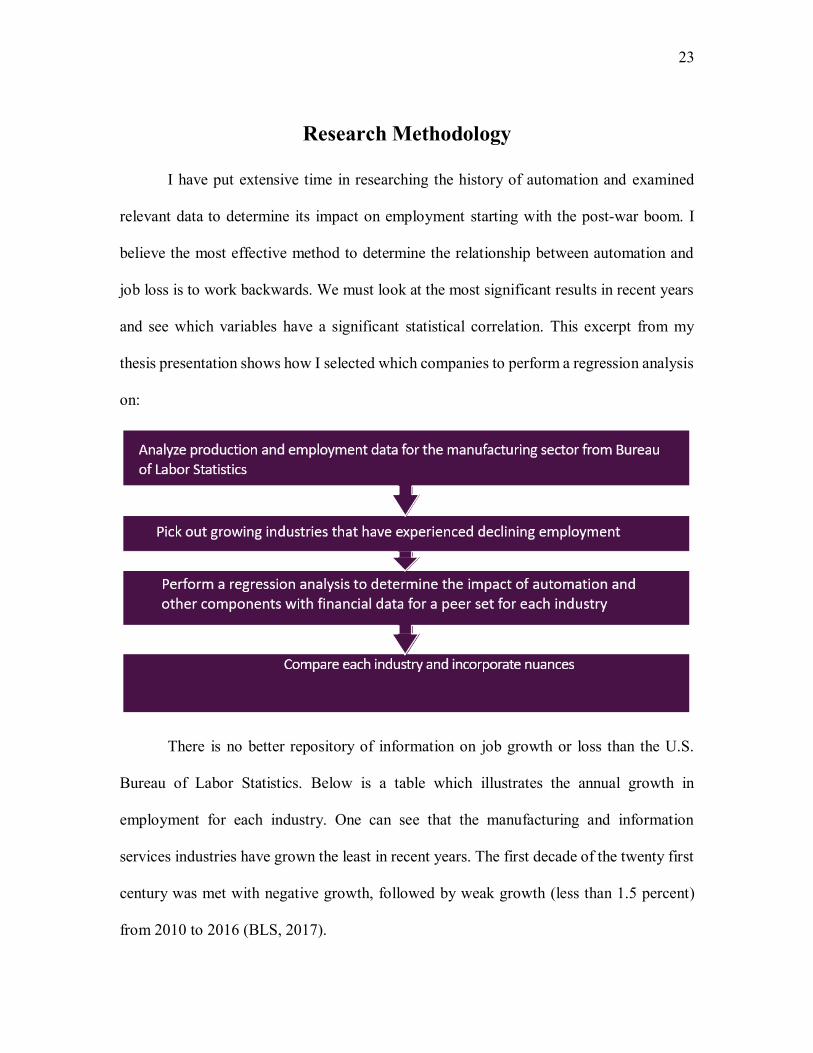
I have put extensive time in researching the history of automation and examined
relevant data to determine its impact on employment starting with the post-war boom. I
believe the most effective method to determine the relationship between automation and
job loss is to work backwards. We must look at the most significant results in recent years
and see which variables have a significant statistical correlation. This excerpt from my
thesis presentation shows how I selected which companies to perform a regression analysis
on:
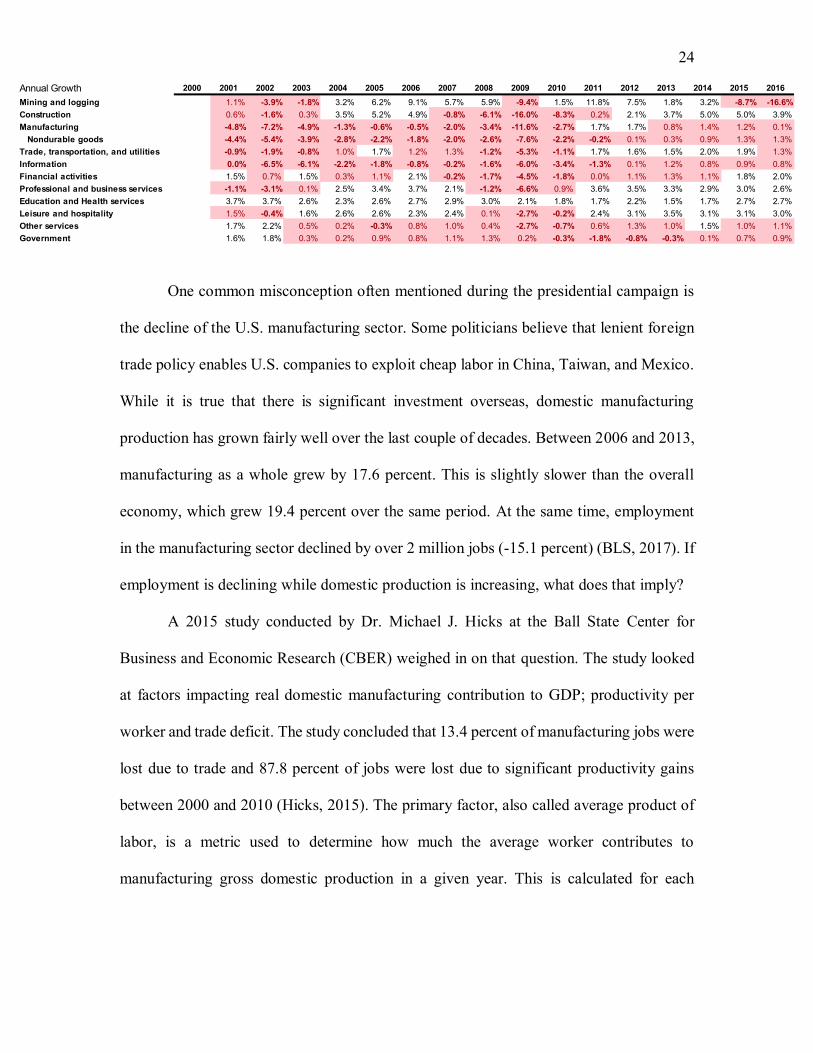
There is no better repository of information on job growth or loss than the U.S.
Bureau of Labor Statistics. Below is a table which illustrates the annual growth in
employment for each industry. One can see that the manufacturing and information
services industries have grown the least in recent years. The first decade of the twenty first
century was met with negative growth, followed by weak growth (less than 1.5 percent)
from 2010 to 2016 (BLS, 2017).
24
One common misconception often mentioned during the presidential campaign is
the decline of the U.S. manufacturing sector. Some politicians believe that lenient foreign
trade policy enables U.S. companies to exploit cheap labor in China, Taiwan, and Mexico.
While it is true that there is significant investment overseas, domestic manufacturing
production has grown fairly well over the last couple of decades. Between 2006 and 2013,
manufacturing as a whole grew by 17.6 percent. This is slightly slower than the overall
economy, which grew 19.4 percent over the same period. At the same time, employment
in the manufacturing sector declined by over 2 million jobs (-15.1 percent) (BLS, 2017). If
employment is declining while domestic production is increasing, what does that imply?
A 2015 study conducted by Dr. Michael J. Hicks at the Ball State Center for
Business and Economic Research (CBER) weighed in on that question. The study looked
at factors impacting real domestic manufacturing contribution to GDP; productivity per
worker and trade deficit. The study concluded that 13.4 percent of manufacturing jobs were
lost due to trade and 87.8 percent of jobs were lost due to significant productivity gains
between 2000 and 2010 (Hicks, 2015). The primary factor, also called average product of
labor, is a metric used to determine how much the average worker contributes to
manufacturing gross domestic production in a given year. This is calculated for each
Annual Growth 2000 2001 2002 2003 2004 2005 2006 2007 2008 2009 2010 2011 2012 2013 2014 2015 2016
Mining and logging 1.1% -3.9% -1.8% 3.2% 6.2% 9.1% 5.7% 5.9% -9.4% 1.5% 11.8% 7.5% 1.8% 3.2% -8.7% -16.6%
Construction 0.6% -1.6% 0.3% 3.5% 5.2% 4.9% -0.8% -6.1% -16.0% -8.3% 0.2% 2.1% 3.7% 5.0% 5.0% 3.9%
Manufacturing -4.8% -7.2% -4.9% -1.3% -0.6% -0.5% -2.0% -3.4% -11.6% -2.7% 1.7% 1.7% 0.8% 1.4% 1.2% 0.1%
Nondurable goods -4.4% -5.4% -3.9% -2.8% -2.2% -1.8% -2.0% -2.6% -7.6% -2.2% -0.2% 0.1% 0.3% 0.9% 1.3% 1.3%
Trade, transportation, and utilities -0.9% -1.9% -0.8% 1.0% 1.7% 1.2% 1.3% -1.2% -5.3% -1.1% 1.7% 1.6% 1.5% 2.0% 1.9% 1.3%
Information 0.0% -6.5% -6.1% -2.2% -1.8% -0.8% -0.2% -1.6% -6.0% -3.4% -1.3% 0.1% 1.2% 0.8% 0.9% 0.8%
Financial activities 1.5% 0.7% 1.5% 0.3% 1.1% 2.1% -0.2% -1.7% -4.5% -1.8% 0.0% 1.1% 1.3% 1.1% 1.8% 2.0%
Professional and business services -1.1% -3.1% 0.1% 2.5% 3.4% 3.7% 2.1% -1.2% -6.6% 0.9% 3.6% 3.5% 3.3% 2.9% 3.0% 2.6%
Education and Health services 3.7% 3.7% 2.6% 2.3% 2.6% 2.7% 2.9% 3.0% 2.1% 1.8% 1.7% 2.2% 1.5% 1.7% 2.7% 2.7%
Leisure and hospitality 1.5% -0.4% 1.6% 2.6% 2.6% 2.3% 2.4% 0.1% -2.7% -0.2% 2.4% 3.1% 3.5% 3.1% 3.1% 3.0%
Other services 1.7% 2.2% 0.5% 0.2% -0.3% 0.8% 1.0% 0.4% -2.7% -0.7% 0.6% 1.3% 1.0% 1.5% 1.0% 1.1%
Government 1.6% 1.8% 0.3% 0.2% 0.9% 0.8% 1.1% 1.3% 0.2% -0.3% -1.8% -0.8% -0.3% 0.1% 0.7% 0.9%

25
industry by dividing annual real GDP by average workers employed in that industry. The
chart below summarizes my findings between 2000 and 2015:
The top 5 manufacturing industries with productivity gains are wood products,
primary metals, computer and electronic products, transportation equipment, and printing
related activities. Between 2000 and 2015, every single manufacturing industry
experienced productivity growth, some more than others. In other words, these industries
have experienced significant productivity gains which have lessened the demand for labor.
26
Data Regression
Now that there have been several industries identified that range in scope and
sector, a regression was performed to determine whether there is a correlation between
increase in automation technology and increase in product of labor.
A. The Dependent Variable
The most cookie cutter equation for product of labor would be total output of real
GDP divided by total number of employees for the respective year. There are other methods
in determining output of labor: output in the automotive industry as vehicles manufactured
or output in the steel fabricating industry as tons of steel produced.
B. The Independent Variable
The independent variable that the results will be tested against will be some
measure of investment or capacity of automation technology. The easiest measure available
is net investment in plant and machinery, however there are other measures that may be
used if the data is available. For example, the International Federation of Robotics releases
statistics every year on robotic technology adoption rates for specific industries. I compiled
as much of this historical data as I could find, however there exists some missing data as I
could not access many of the older reports. The most complete data set was used in one of
the regression analyses for the automotive industry.
27
Regression Results
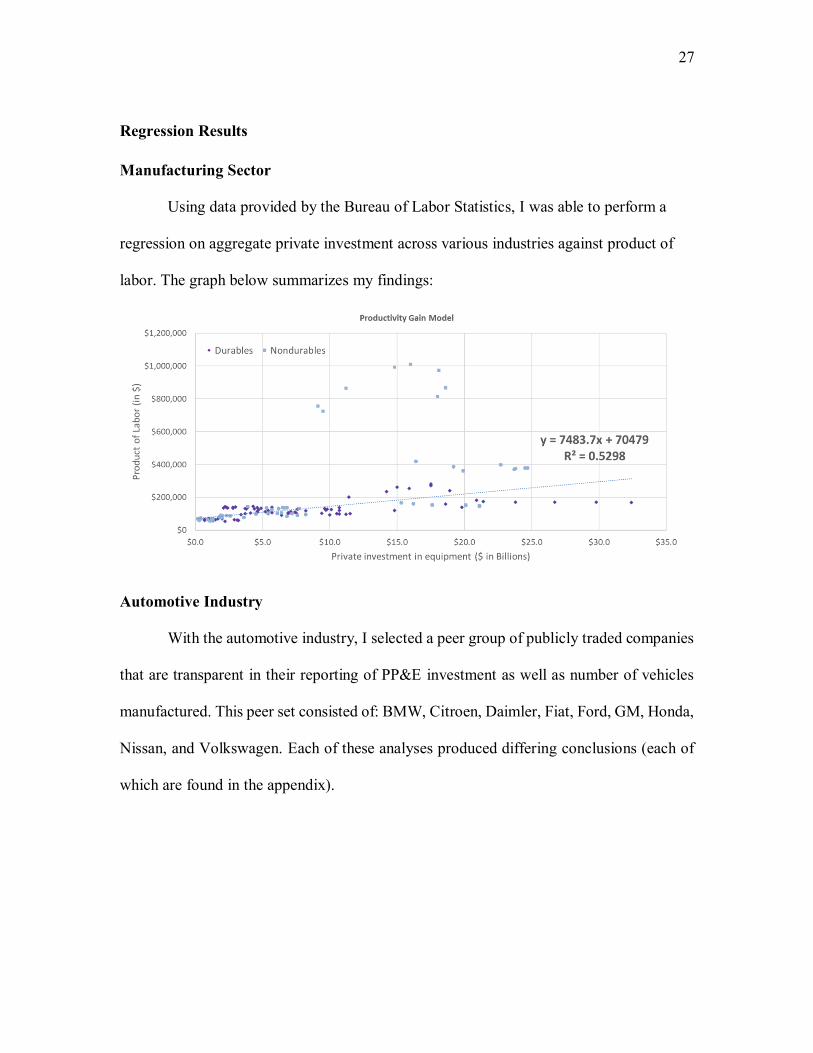
Manufacturing Sector
Using data provided by the Bureau of Labor Statistics, I was able to perform a
regression on aggregate private investment across various industries against product of
labor. The graph below summarizes my findings:
Automotive Industry
With the automotive industry, I selected a peer group of publicly traded companies
that are transparent in their reporting of PP&E investment as well as number of vehicles
manufactured. This peer set consisted of: BMW, Citroen, Daimler, Fiat, Ford, GM, Honda,
Nissan, and Volkswagen. Each of these analyses produced differing conclusions (each of
which are found in the appendix).
28
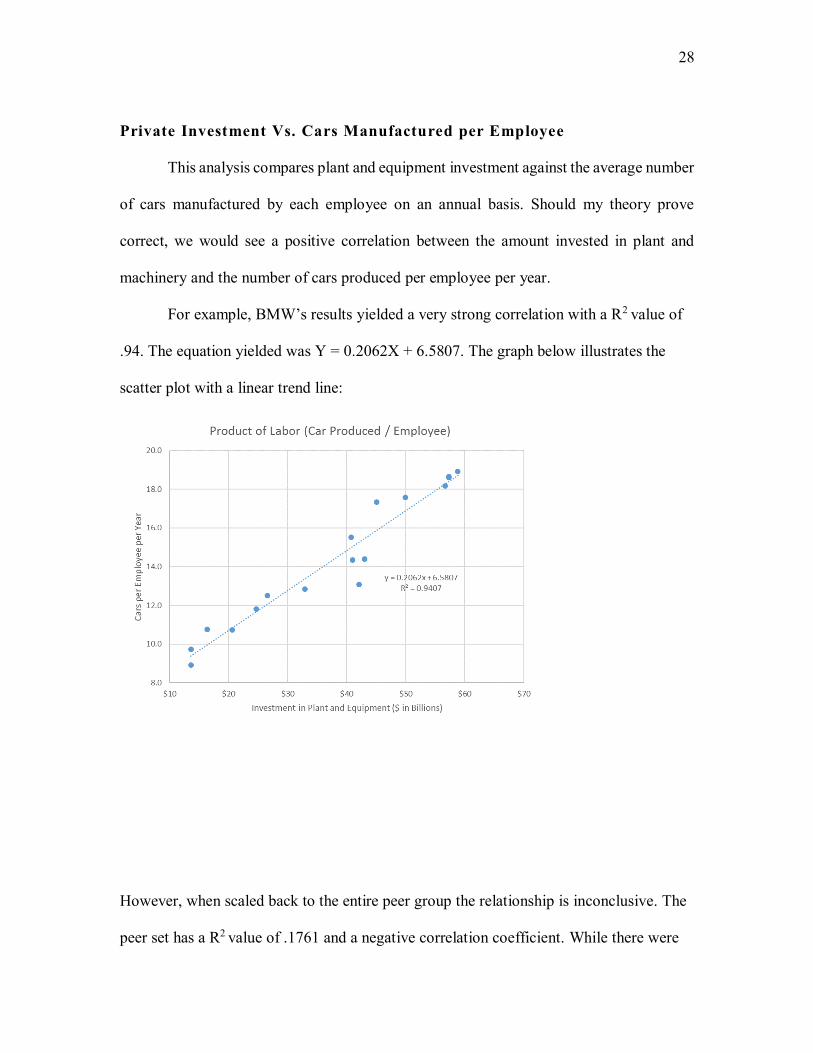
Private Investment Vs. Cars Manufactured per Employee
This analysis compares plant and equipment investment against the average number
of cars manufactured by each employee on an annual basis. Should my theory prove
correct, we would see a positive correlation between the amount invested in plant and
machinery and the number of cars produced per employee per year.
For example, BMW’s results yielded a very strong correlation with a R2 value of
.94. The equation yielded was Y = 0.2062X + 6.5807. The graph below illustrates the
scatter plot with a linear trend line:
However, when scaled back to the entire peer group the relationship is inconclusive. The
peer set has a R2 value of .1761 and a negative correlation coefficient. While there were

29
specific companies which could give credit to an argument that increased investment in
plant and machinery increases productivity, the overall set of data suggests the data is
inconclusive.
Robots Installed Vs. Product of Labor
The International Federation of Robotics provides annual data on the total amount
of robots installed for various industries. I was able to uncover this data between 2009 and
2015, and attempted a regression analysis. While the data suggests there may be
relationship, there wasn’t enough historical data on robot installations to draw a conclusion.
30
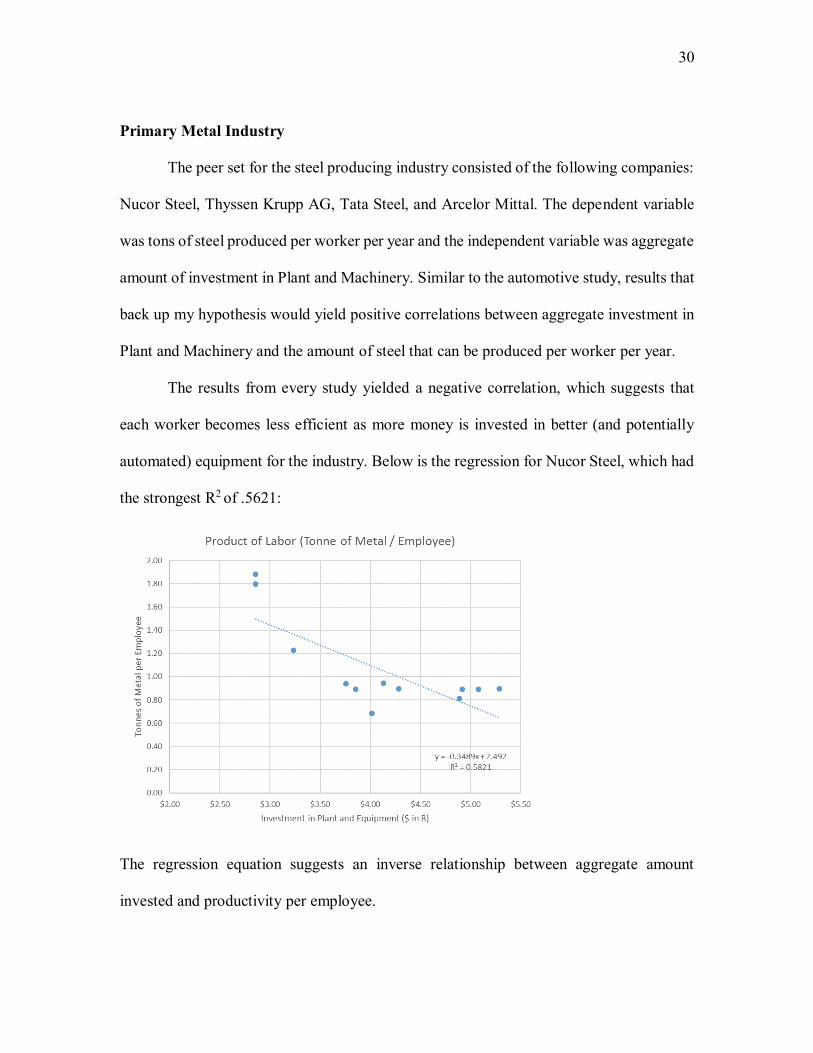
Primary Metal Industry
The peer set for the steel producing industry consisted of the following companies:
Nucor Steel, Thyssen Krupp AG, Tata Steel, and Arcelor Mittal. The dependent variable
was tons of steel produced per worker per year and the independent variable was aggregate
amount of investment in Plant and Machinery. Similar to the automotive study, results that
back up my hypothesis would yield positive correlations between aggregate investment in
Plant and Machinery and the amount of steel that can be produced per worker per year.
The results from every study yielded a negative correlation, which suggests that
each worker becomes less efficient as more money is invested in better (and potentially
automated) equipment for the industry. Below is the regression for Nucor Steel, which had
the strongest R2 of .5621:
The regression equation suggests an inverse relationship between aggregate amount
invested and productivity per employee.

31
A similar study was performed which examined the relationship between
installations of robots and product of labor for the steel producing industry. The results
were inconclusive and showed little to no correlation.
Interpretation of the Results
Overall, the results of my regressions were a mixed bag. While there were certain
companies such as BMW that yielded data that supported my hypothesis, the broader peer
group had inconclusive evidence. In some cases, there was even a negative correlation
which suggests that employees became less productive as more money was invested in
machinery and automation technology. This was the case for Ford Motor Company as well
as the whole steel producing industry. Within each industry exist certain circumstances that
could explain why the data contradicts my hypothesis.
When considering the results of the automotive industry, I believe one must
consider unionization. The United Automobile Workers group (UAW) is a union that was
established in 1935 to protect the rights on blue-collar automobile laborers. The
organization has rapidly grown since the great recession, peaking at over 400,000 members
in 2015 (Open Secrets, 2017). As a greater portion of automobile laborers join the union,
there is more of a push to maintain employment. This means that auto manufacturers may
have to practice work-sharing programs which employ more people across a specific task
while requiring less hours of labor per person. So, while the capabilities of each worker
expands with automation, the output may not advance nearly as quickly. In regard to the
steel producing industry, a similar argument could be made for unionization.
Another reason could be the evolving product mix of these automobile
manufacturers. Demand among certain companies may change from simple to luxurious

32
and complex. These more expensive cars require much more time to manufacture. If Ford’s
production focus shifted from simple and cheap pickup trucks to hybrids with significant
amounts of electronics and technology, the company may be producing a smaller volume
of vehicles even though revenue and earnings are still growing. This shift in demand could
explain why vehicle production per employee has not increased significantly over the last
decade.

33
Discussion and Implications: What is the solution?
If the question asked in my thesis turns out to be true, there are several existing
theories that embrace automation and prepare man for a scenario of increasing population
growth matched with un-manned productivity. Some mimic policy changes that evolve
with technology while others challenge the principles of traditional economics and
globalized capitalism.
I. The Collapse of Capitalism
The Communist Manifesto is Karl Marx’s attempt to describe the goals of
communism and explain how late stage capitalism and class polarization ultimately lead to
a revolution among the labor class against the employer class. This movement occurs in
the first ‘section’, which describes a shift of power between the Bourgeoisie (the class of
capitalistic employers, and owners of production) and the Proletariat (the class of laborers,
whose only method of survival is through exchanging labor for other resources) (Marx,
1848).
In the first half of section one, Marx talks about the rise of the Bourgeoisie, who
started off as a widespread manufacturing middle class that is pressured to constantly
increase productivity in line with demand. Eventually, technological innovation drives
down the production costs and increases competitive advantage. In the nineteenth century
this was the Industrial Revolution, in the twentieth century this was information
technology, and today this is artificial intelligence and automation. Some of the
manufacturing middle class prosper and become employers. The Bourgeoisie’s identity is
no longer the middle class worker, but the business owner which is the new powerful entity.

34
Globalization and modern industry increase the class’s power beyond country borders.
There is general prosperity for all of those involved in capitalism; the government’s agenda
is to advance capitalism, increasing the standard of living and gross production.
Productivity advancement is the new norm; to not evolve would stifle competitive
advantage and risk the Bourgeoisie of losing power.
In the second half of section one, Marx describes the Proletarians. This class is the
majority of the population but struggles under the power of the ruling class. The artisan
nature of many crafts has been stripped of these people, who are now menial workers. As
production becomes streamlined, the laborers lose bargaining power. Wages fall and each
individual’s power in society is marginalized. Property shifts from commoner to the
controlling class, further belittling the laborer. As communication technology advances,
the proletarians grow in number and sophistication to form unions. To every other class,
the proletariat is an exploitable resource. However, the proletariat grows in size and
frustration, inevitably leading to a revolution. The climax of Marx’s manifestation is the
successful revolution that creates one united class, stripped of materialistic necessities and
oppression.
My purpose of this discussion is not to validate communism or challenge the idea
of freedom, as the American Dream is at its core the opposite of communism. Where
communism aims to standardize and guarantee a lifestyle for the masses, the American
Dream describes an individual’s unique journey to success through achievement and
competition. There are several figures worth examining, painting a picture of the modern
day bourgeoisie and proletarians.

35
In 2012, the World Economic Forum identified rising economic inequality as a
major threat to social stability (WEF, 2012). The most daunting figure is that the 8 richest
people in the world have more money than the poorest half of the world (about 3.7 billion
people) (Hardoon, 2017). This is the result of Crony Capitalism, which Oxfam (Hardoon,
2017) summarizes perfectly:
Crony capitalism benefits the rich, the people who own and run these
corporations, at the expense of the common good and of poverty reduction.
It means that smaller businesses struggle to compete and ordinary people
end up paying more for goods and services as they face cartels and
monopoly power of corporations and those with close connections with
government (Hardoon, 2017).
The wealth gap is an issue that will not go away should current trends persist. The existence
of automation technology that furthers the agenda of the business owners rather than the
laborers could lead to an eventual social collapse.
II. Policy Responses – The Robotic Tax and Universal Basic Income
Some of the world’s greatest minds believe there exists a proactive solution to the
threat of automation and income polarization. Bill Gates, arguably the world’s most
important software visionary, believes that automated robots could be taxed based on their
production akin to an income tax (James, 2017). The proceeds would be used to retrain the
structurally unemployed workforce and transition them to health care, education, or other
service based careers that would hopefully still require human-to-human interaction. The
tax would also slow the adoption of automation for a certain period, giving laborers time

36
to adapt to other careers. The proceeds could also be used to subsidize human labor, further
delaying adoption of automation.
A much more controversial option is Universal Basic Income (UBI). Milton
Friedman originated the idea following World War II as a negative income tax. The tax
effectively charge an increasingly greater rate for those earning above a certain threshold,
and would inversely grant households an increasing amount of income below a certain
threshold. This philosophy was greatly opposed by free market economists, as it would
disincentivize those to seek better jobs and reward the unemployed. Since then, the idea
has evolved into UBI, which would completely replace welfare. UBI was hypothetically a
reality, when 77 percent of Switzerland rejected the referendum in 2016 (BBC, 2017).
III. New Industry will Replace Outdated Occupations
Shifts in occupation demographics are constantly occurring. The Obama
Administration’s report on Artificial Intelligence, Automation, and the Economy claims
that every three months about 6 percent of occupations are lost due to shrinking or closing
business. Over that same period, a larger percentage of jobs are added which results in
rising employment and a steady unemployment rate (Obama Administration, 2016). Ray
Kurzweil, the man who was referred to as “the ultimate thinking machine” by the Wall
Street Journal, shares a similar sentiment with Obama’s administration. When the Director
of Engineering of Google was asked about the susceptibility of jobs lost to automation he
responded:
You could point at almost every job and it seemed only a matter of time
before those jobs were automated and eliminated. Indeed, that happened.
Those jobs were automated and went away. Yet somehow, employment

37
went up… New industries emerged making and servicing these machines
(Kurzweil, 2015).
In 1940, 20 percent of employment was in the agriculture industry. Seventy years
before that, that statistic was 50 percent (BLS, 2017). For many, two to three generations
of the family lived and worked on their farm their entire life. Advancements in agriculture
technology such as tractors, automated irrigation systems, and other processing machinery
reduced the need for as many people to work on the fields and employment as a percentage
of the workforce rapidly decreased. By 1980, agriculture employment represented just over
3 percent of the workforce (BLS, 2017). While there was widespread structural
unemployment in the industry, demand for blue-collar and white-collar jobs increased at a
faster rate. Many rural Americans were granted the opportunity to gain the necessary skills
for these higher paying jobs. By 1960, 50 percent of Americans had obtained the GED. By
1980, over 75 percent had the same education. In general, the quality of life increased for
American households (King, et al., 2011).

38
Conclusion
Will automation lead to widespread structural unemployment? Automation, much
like previous productivity-increasing innovations, will continue to lessen the need for
certain occupations. And if Frey and Osborne are correct, 47 percent of existing jobs are at
risk of this phenomenon.
Over the next decade, those without college or trade school education will start to
fall behind. Working-class jobs which merely require a high school degree will not be
available to the masses like they were in the previous century. According to the
Georgetown University Center on Education and the Workforce, 65 percent of jobs
demanded will require education beyond a GED by 2020. At the same time the U.S. will
fall short of 5 million workers with postsecondary education, requiring companies to
import talent from other nations (Carnevale, Smith, and Strohl, 2013).
What industries are rapidly expanding today? In 2014, The Bureau of Labor
Statistics published a study of what occupations it anticipates the fastest growth through
2024. Service-providing sectors were identified as the core area of growth, with over 9.3
million jobs expected to be added to the workforce by 2024. Of these 9.3 million jobs,
almost 4 million are expected to be attributable to healthcare and social assistance
occupations (BLS, 2017). Healthcare and social assistance require significant human-to-
human interaction, which could be a safe-haven as automation evolves to cover more and
more information processing tasks.
The statistics today do not paint an overly optimistic picture. According to the Pew
Research Center, 32 percent of millennials still live at home and 36 percent of college

39
seniors graduating this year will be joining them (Fry, 2016). Many undergraduates are
having trouble securing their first job. And while unemployment levels are near recent
lows, wage growth has been more than slow at around 2.5 percent per year (BLS, 2017).
The Federal Reserve considers the labor market healthy when wage growth is near 3.5
percent per year (Bils, 1985).
There does not exist a concrete solution to this problem, but rather a necessity to
continue an open dialogue. Policy leaders will need to carefully examine which approach
will be the best for society. Those with more progressive views may argue for a universal
basic income or taxation to delay the inevitable diffusion of automation technology. On the
opposite end of the spectrum, there may be a belief that increased business investment will
drive innovation which will continue adding occupations to the economy that don’t even
exist yet.
If the oncoming challenge is left unaddressed, there may be serious consequences
that will negatively impact the upcoming generation of workers. The manufacturing sector
is the first of many to have an increasing level of structural unemployment. Almost half of
the existing jobs could be replaced, leading to widespread unemployment among the
newest members of the workforce. The problem could compound over generations,
resulting in anemic production growth, stagnant wages, and little capital available for
investment. If this impact is permanent, expect the wealth gap to increase as company
owners exploit cheaper means of production.

40
References
Aeppel, Timothy. "Workers Aren't Included In Lights-Out Factories." The Wall Street
Journal. Dow Jones & Company, 19 Nov. 2002. Web. 01 May 2017.
"Artificial Intelligence: The New Frontier for Hedge Funds." EurekaHedge.com. Eureka
Hedge, 5 Jan. 2017. Web. 01 May 2017.
Attewell, Paul. "The Deskilling Controversy." Work and Occupations. State University of
New York at Stony Brook, 1987. Web. 01 Mar. 2017.
Autor, David H. 2015. “Polanyi’s Paradox and the Shape of Employment Growth.” In
Re-Evaluating Labor Market Dynamics, pp. 129–79. Federal Reserve Bank of
Kansas City.
Autor, David. H., & Dorn, D. 2013. The growth of low-skill service job and the
polarization of the US labor market. American Economic Review 103 No. 5
(August): 1553-1597.
Autor, D. H., Levy, F., & Murnane, R. J. 2003. The skill content of recent technological
change: An empirical exploration. Quarterly Journal of Economics 118 No.4
(November): 1279-1333.
Bils, Mark J. 1985. “Real Wages over the Business Cycle: Evidence from Panel Data.”
Journal of Political Economy 93(4), pp. 666–689.
Boden, M.A. (2003). The creative mind: Myths and mechanisms. Routledge.
Bort, Julie. "An IBM Scientist Taught His Supercomputer To Swear Like A Sailor."
Business Insider. Business Insider, 09 Jan. 2013. Web. 01 Nov. 2016.
41
Bowen, Harold R. (Chairman). 1966. “Report of the National Commission on
Technology, Automation, and Economic Progress: Volume I.” Washington: U.S.
Government Printing Office.
Broekens, J., Heerink, M. and Rosendal, H. (2009). Assistive social robots in elderly
care: a review. Gerontechnology, vol. 8, no. 2, pp. 94–103.
Bureau of Labor Statistics, U.S. Department of Labor, Occupational Employment
Statistics, 01 March 2017 [www.bls.gov/oes/].
Carnevale, Anthony P., Nicole Smith, and Jeff Strohl. "Recovery: Job Growth and
Education Requirements Through 2020." CEW Georgetown. Georgetown
University, 1 June 2013. Web. 04 May 2017.
Clark, Gregory (2005) : The condition of the working-class in England, 1209 - 2004,
Working papers // University of California, Department of Economics, No. 05,39
Cowen, Tyler. "Industrial Revolution Comparisons Aren't Comforting." Bloomberg.com.
Bloomberg, 16 Feb. 2017. Web. 22 Mar. 2017.
Diamandis, Peter. "Ray Kurzweil's Mind-Boggling Predictions for the Next 25 Years."
Singularity Hub. Singularity University, 26 Jan. 2015. Web. 06 May 2017.
Frey, C. B., & Osborne, M. A. 2013. The future of employment: how susceptible are jobs
to computerisation? Oxford University (September).
Fry, Richard. "For First Time in Modern Era, Living With Parents Edges Out Other
Living Arrangements for 18- to 34-Year-Olds." Pew Research Center's Social &
Demographic Trends Project. Pew Research Center, 24 May 2016. Web. 03 May
2017.
Graetz, Georg and Michaels, Guy, Robots at Work. IZA Discussion Paper No. 8938.

42
Goertzel, Ben. "KurzweilAI | Accelerating Intelligence." The Real Reasons We Dont
Have AGI Yet Comments. KurzweilAI, 08 Oct. 2012. Web. 01 May 2017.
Goos, M., Manning, A., & Salomons, A. 2010. Explaining job polarization in Europe:
The roles of technology, globalization and institutions. Centre for Economic
Performance Discussion Papers. No. 1026. (November).
Gupta, Rajat. Automation Industry: J.P. Morgan/CSIA System Integrator Survey - Some
Stabilization in Overall Demand Trends; IoT Adoption Remains Slow. Rep. New
York, NY: J.P Morgan, 2016. Print.
Hardoon, Deborah. "An Economy for the 99%: It’s Time to Build a Human Economy
That Benefits Everyone, Not Just the Privileged Few." OXFAM Report (2017): n.
pag. Oxfam America. Oxfam America, 1 Jan. 2017. Web. 22 Mar. 2017.
Harley, C., & Crafts, N. (2000). Simulating the Two Views of the British Industrial
Revolution. <i>The Journal of Economic History,</i> <i>60</i>(3), 819-841.
doi:10.1017/S0022050700025778
Hicks, Michael J. "The Myth and Reality of Manufacturing in America." (n.d.): n. pag.
CBER. Ball State University, 1 June 2015. Web. 8 Apr. 2017.
Hill, David J. "Kurzweil Responds to 'When Robots Are Everywhere, What Will Humans
Be Good For?' [Video]." Singularity Hub. Singularity Hub, 05 Dec. 2016. Web.
01 May 2017.
James, Malcolm. "Here's How Bill Gates' Plan to Tax Robots Could Actually Happen."
Business Insider. Business Insider, 20 Mar. 2017. Web. 01 Apr. 2017.
Keynes, J.M. (1933). Economic possibilities for our grandchildren (1930). Essays in
persuasion, pp. 358–73.

43
Krouse, Sarah. "BlackRock Bets on Robots to Improve Its Stock Picking." The Wall
Street Journal. Dow Jones & Company, 28 Mar. 2017. Web. 01 Apr. 2017.
"Making the Future." The Economist. The Economist Newspaper, 21 Apr. 2012. Web. 16
Oct. 2016.
Mantoux, P. (2006). The industrial revolution in the eighteenth century: An outline of the
beginnings of the modern factory system in England. Taylor & Francis US.
Marx, K. 1867. Capital: A Critique of Political Economy. Penguin Classics Vol 1 (1992).
Masnick, Mike. "No, A 'Supercomputer' Did NOT Pass The Turing Test For The First
Time And Everyone Should Know Better." Techdirt. TechDirt, 4 June 2014.
Web. 01 Apr. 2017.
Morriss, David. "Bill Gates Says Robots Should Be Taxed Like Workers." Fortune.
Fortune, 1 Feb. 2017. Web. 22 Mar. 2017.
Murray, Charles. "A Guaranteed Income for Every American." The Wall Street Journal.
Dow Jones & Company, 03 June 2016. Web. 22 Mar. 2017.
Nordhaus, William D. 2007. “Two Centuries of Productivity Growth in Computing.”
Journal of Economic History 67(1): 17–22.
Obama, Barack H. "Artificial Intelligence, Automation, and the Economy." National
Archives and Records Administration. National Archives and Records
Administration, 20 Dec. 2016. Web. 02 Mar. 2017.
Polanyi, Michael. 1966. The Tacit Dimension. New York: Doubleday.
Snavely, Brent. "UAW Membership Tops 400,000 for First Time since 2008." USA
Today. Gannett Satellite Information Network, 31 Mar. 2015. Web. 01 May 2017.

44
"Switzerland's Voters Reject Basic Income Plan." BBC News. BBC, 05 June 2016. Web.
03 Apr. 2017.
"The Center for Responsive Politics." OpenSecrets.org. Open Secrets, n.d. Web. 01 Apr.
2017.
TIME. 1961. “The Automation Jobless.” February 24.
Tracy, Phillip. "Lights out Manufacturing and Its Impact on Society." RCR Wireless
News. RCR Wireless News, 10 Aug. 2016. Web. 01 Mar. 2017.
U.S. Bureau of Labor Statistics, Average Hourly Earnings of All Employees: Total
Private [CES0500000003], retrieved from FRED, Federal Reserve Bank of St.
Louis; https://fred.stlouisfed.org/series/CES0500000003, May 1, 2017.
US Department of Labor (1899). Thirteenth Annual Report of the Commissioner of
Labor. Two Volumes, Government Printing Office, Washington, DC.
World Economic Forum. (2012). „Global Risk
Report2012‟.http://reports.weforum.org/global-risks-
2012/?doing_wp_cron=1478086016.0533339977264404296875
45
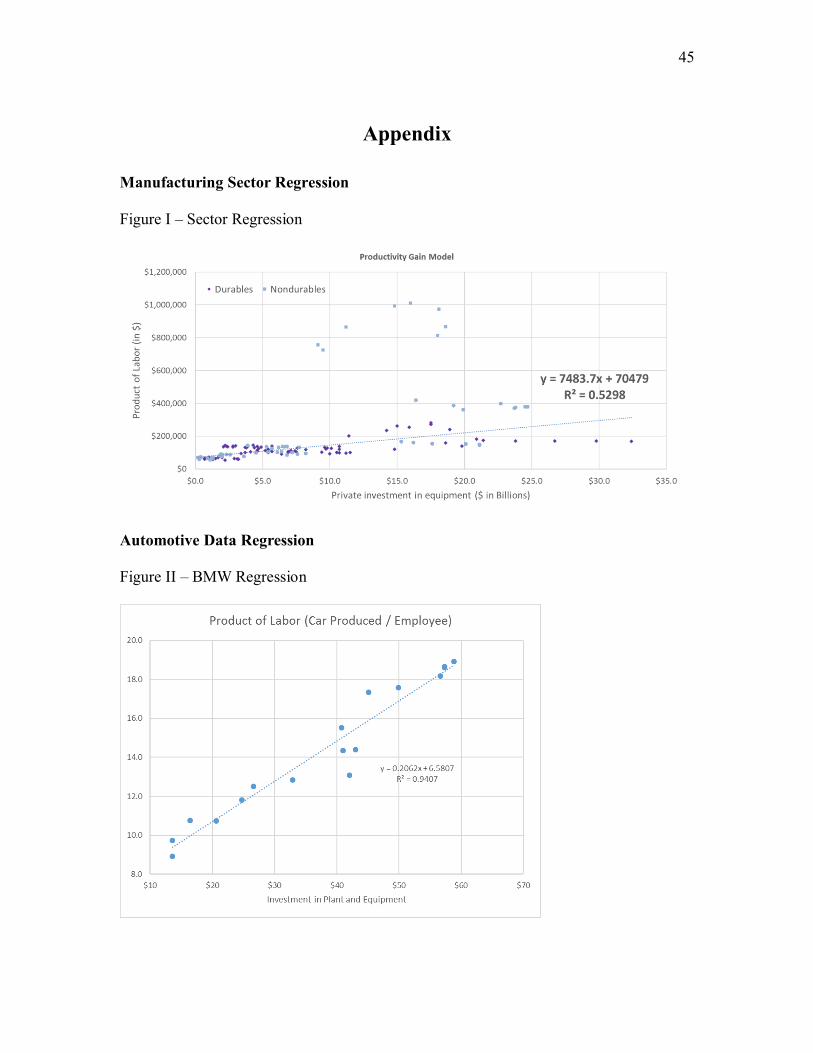
Appendix
Manufacturing Sector Regression
Figure I – Sector Regression
Automotive Data Regression
Figure II – BMW Regression

46
Figure III – Daimler Regression
Figure IV – Ford

47
Figure V – Honda
Figure VI – Nissan

48
Figure VII – Selected Peer Set
Figure VIII – Robot Installations vs. Product of Labor

49
Steel Producer Data Regression
Figure IX – Nucor
Figure X – Thyssen Krupp AG

50
Figure XI – TATA Steel
Figure XII – Arcelor Mittal

51
Figure XIII – Steel Producing Industry vs Annual Robot Installations