Embed Size (px)
Citation preview
1
BAAMA Asset Management &
GASB 34 Education Session: City of Oakland
Curb Ramp Inventory ProjectPrepared by
Geotopo TeamJanuary 23,2003

2
Project Background
Curb Ramps are an important element of the City of Oakland’s Transition Plan for the Disabled Community.The location and inventory of existing curb ramps needs to be determined for the city to be responsive to the Disabled Community.The consultant team of Geotopo and 3D Visions was hired to create a geospatial database of curb ramp locations with City limits.
3
Project GoalsConduct an inventory of the location, type, and condition for City curb ramps. Use GIS technology for efficiently collecting of high quality dataProvide quality assurance for data collection accuracy and completeness. Produce maps to show curb ramp status.
4
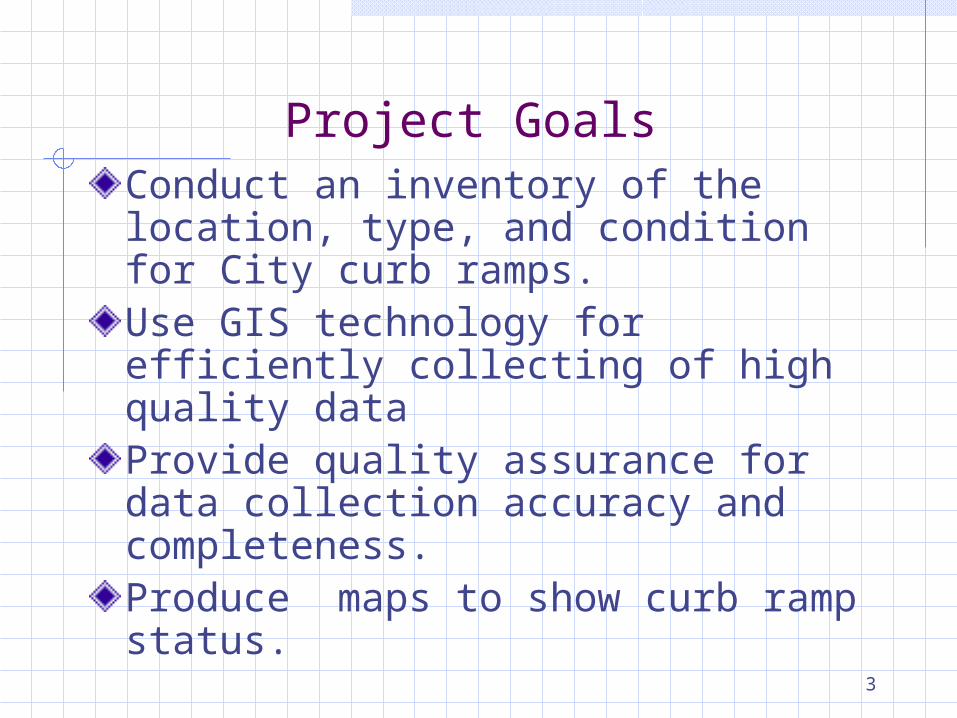
Inventory: Methodology & Process
Collected field data using an electronic hand-held device- PDA (Personal Data Assistant)Daily updates to Desktop computer using ArcViewQuality assurance checks for completeness and accuracy.

5
iPaq Programming
Determine Field Data Collection Work FlowProgramming & TestingPrototyping Training Users
6
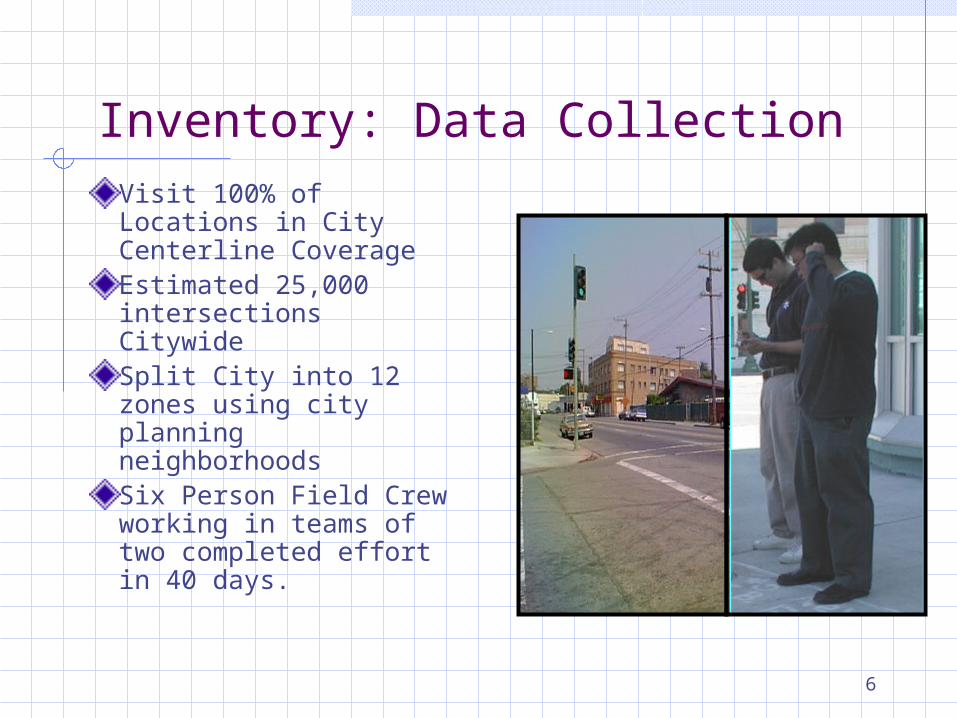
Inventory: Data CollectionVisit 100% of Locations in City Centerline Coverage Estimated 25,000 intersections CitywideSplit City into 12 zones using city planning neighborhoodsSix Person Field Crew working in teams of two completed effort in 40 days.
7
Inventory:Visual Compliance Standard
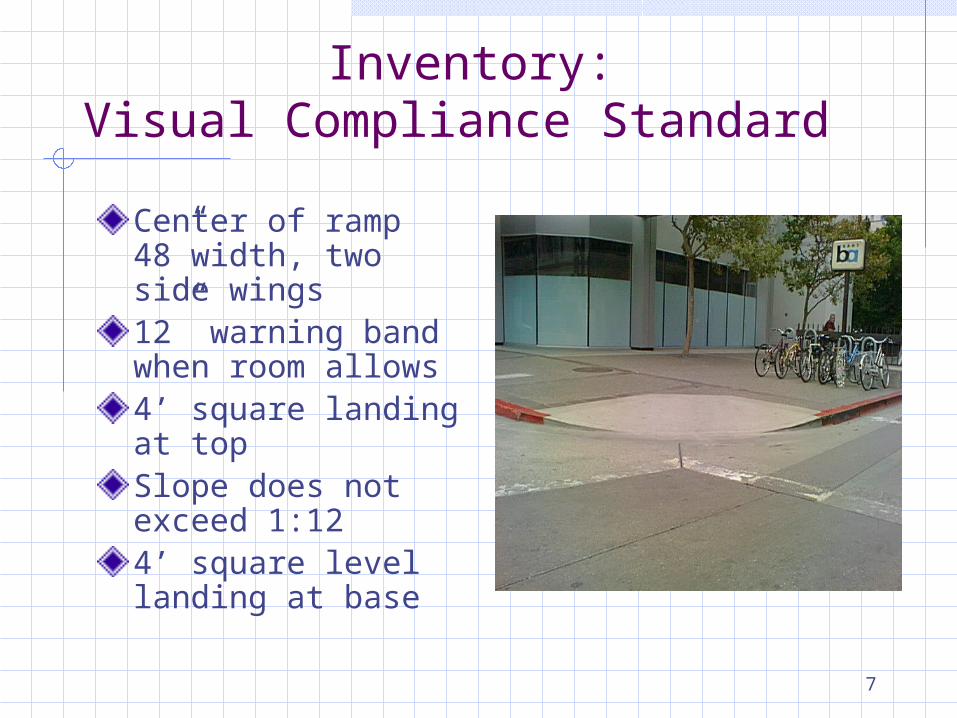
Center of ramp 48”width, two side wings12” warning band when room allows4’ square landing at topSlope does not exceed 1:12 4’ square level landing at base
8
Inventory: Curb Ramp vs. No Curb Ramp
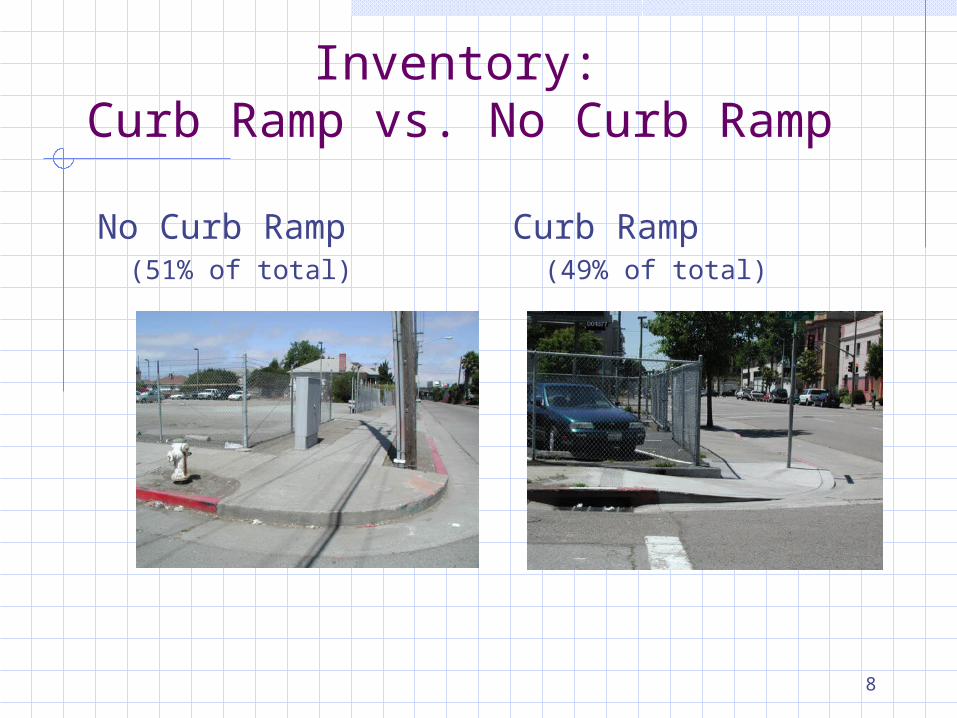
No Curb Ramp (51% of total)
Curb Ramp (49% of total)
9
Inventory: Locations
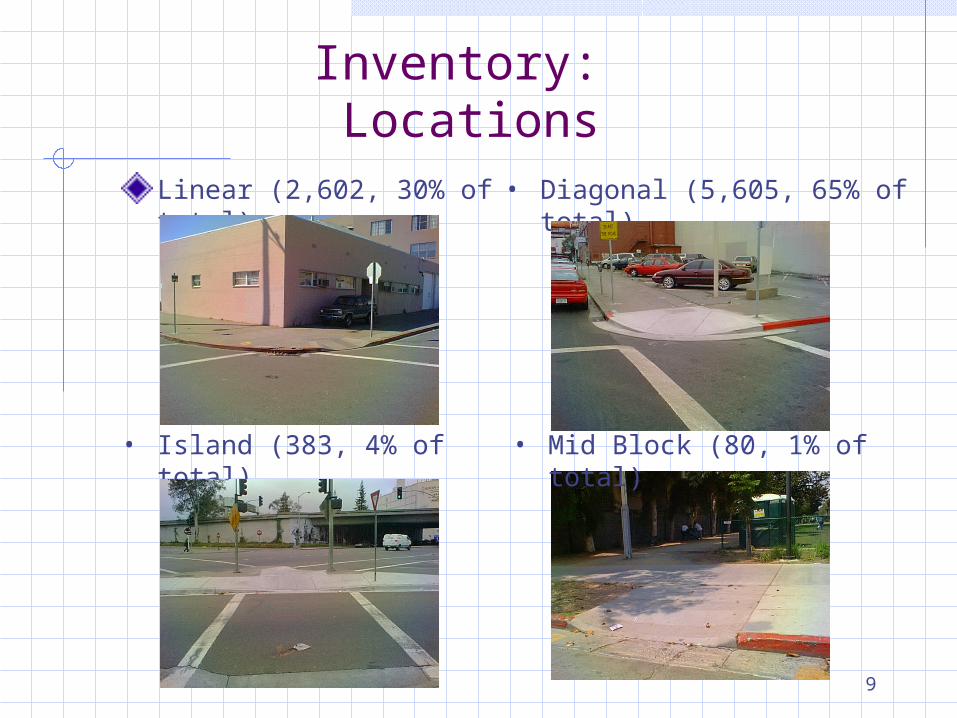
Linear (2,602, 30% of total) • Diagonal (5,605, 65% of total)
• Island (383, 4% of total) • Mid Block (80, 1% of total)
10
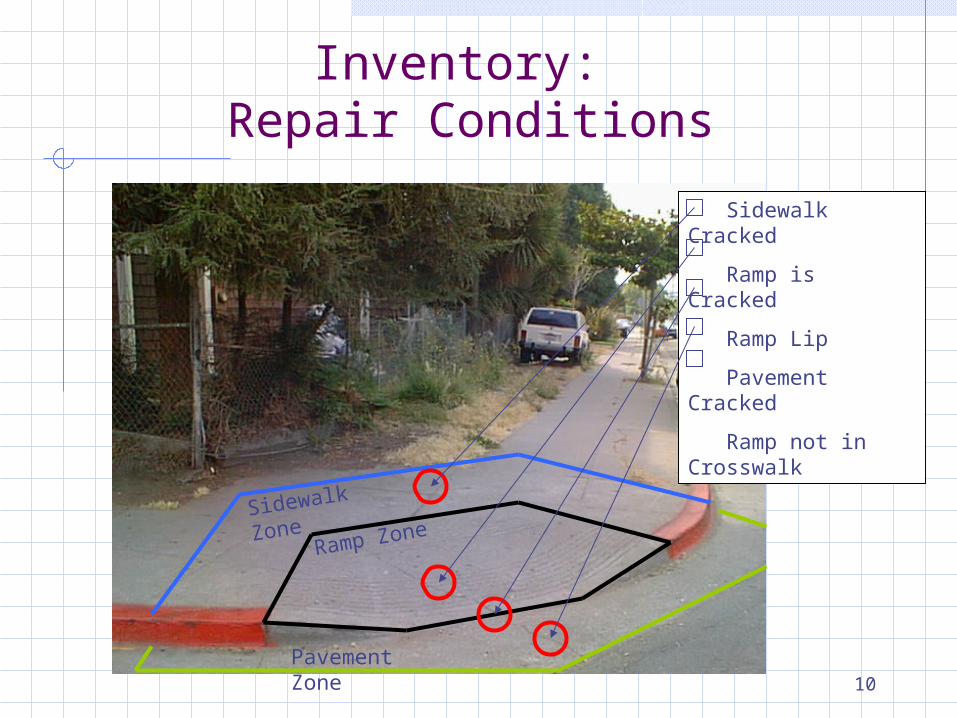
Inventory: Repair Conditions
Ramp ZoneSidewalk Zone
Pavement Zone
Sidewalk Cracked
Ramp is Cracked
Ramp Lip
Pavement Cracked
Ramp not in Crosswalk
11
Inventory: Data Collection Exceptions
Locations may be missing from Database if… Streets exist, but not in City database Streets in database, but not found in City Mid-blocks were collected when found Private Property and Private Streets were
excluded from the inventory
12
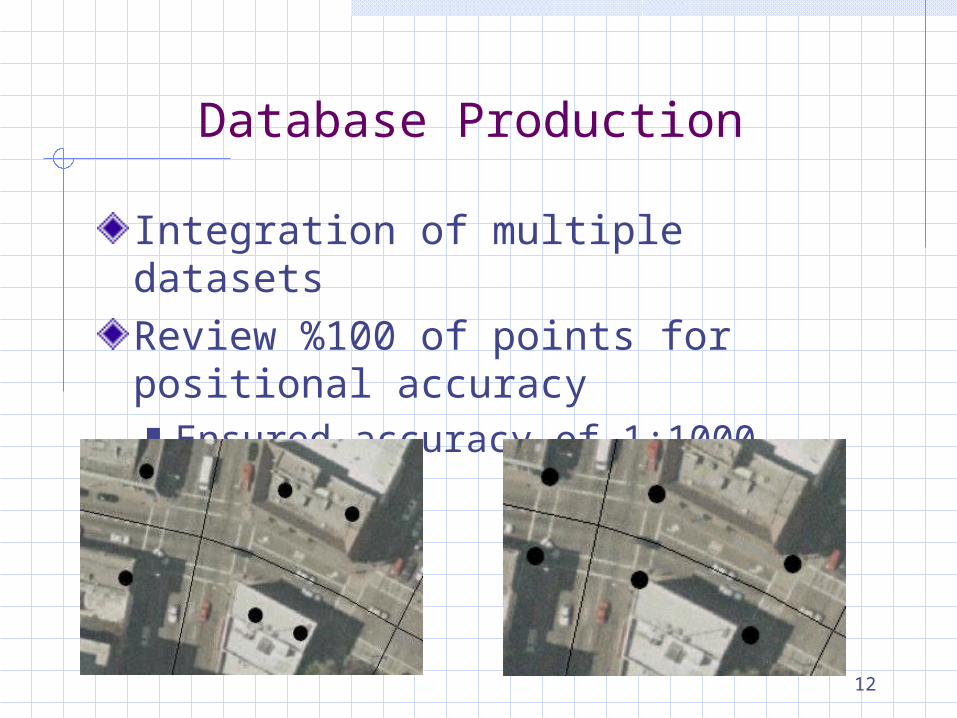
Database Production
Integration of multiple datasetsReview %100 of points for positional accuracy Ensured accuracy of 1:1000
13
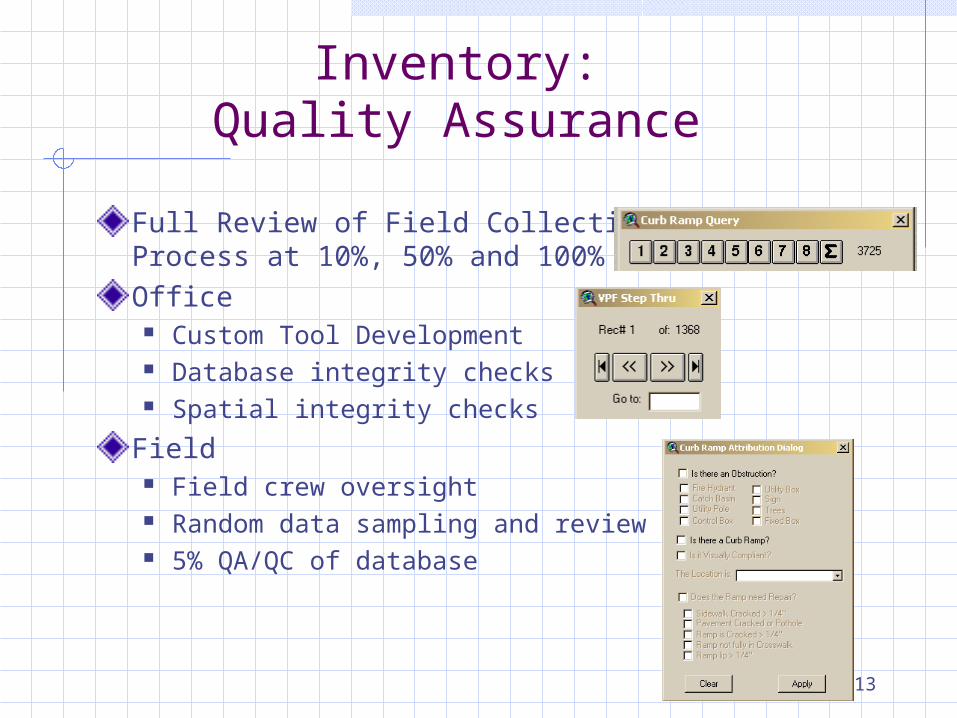
Inventory: Quality Assurance
Full Review of Field Collection Process at 10%, 50% and 100%Office
Custom Tool Development Database integrity checks Spatial integrity checks
Field Field crew oversight Random data sampling and review 5% QA/QC of database

14
Inventory Results
Summary Graphs Summary Charts Field Pictures and Statistics Map Production
15
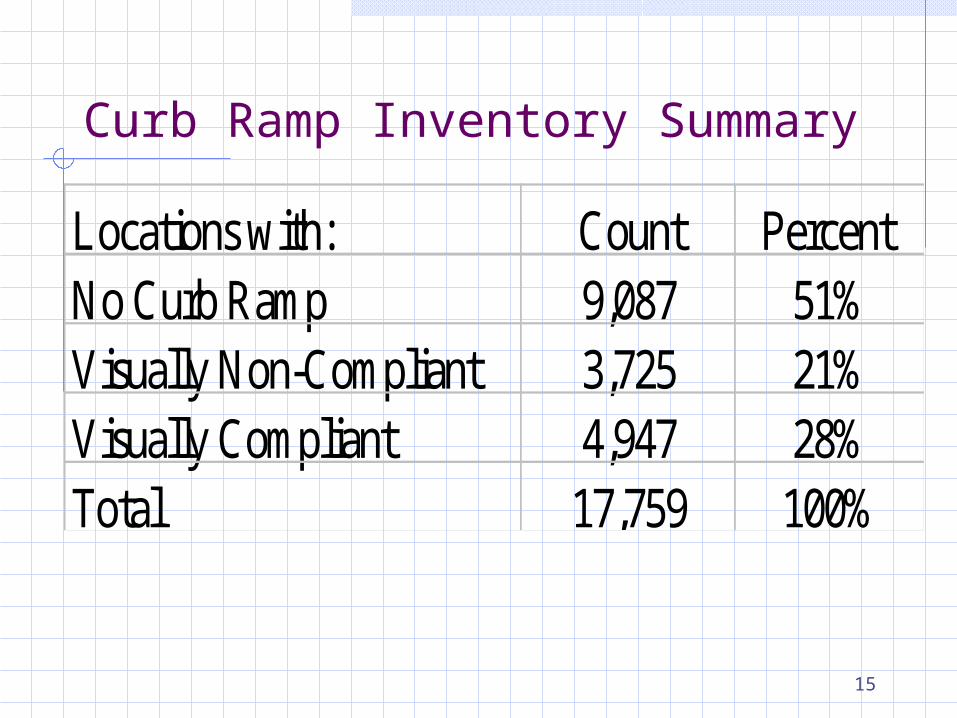
Curb Ramp Inventory Summary
Locations with: Count Percent No Curb Ramp 9,087 51%Visually Non-Compliant 3,725 21%Visually Compliant 4,947 28%Total 17,759 100%
16
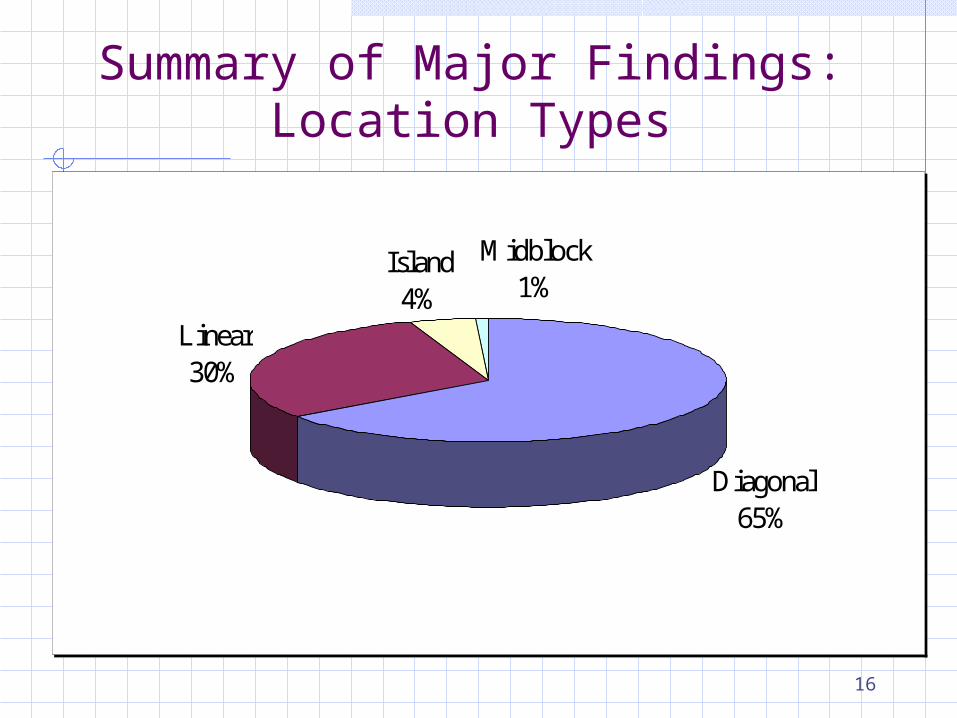
Summary of Major Findings: Location Types
Diagonal65%
Linear30%
Island4%
Midblock1%

17
Map Production Strategy
Council District Maps
Planning Area Maps

18
Lessons Learned:What Worked…
Collection Methodology iPaq Use Point Movement in ArcView Quality Assurance Technical Report Writing Stakeholder Involvement

19
Lessons Learned:What Could Be Better…
Full Time Field Manager Additional Training and Validation of field Staff More Conditional Statements in Ipaq Receipts