Embed Size (px)
Citation preview

1
Beyond Re-grouping and Re-teaching: Using Data to Dramatically Improve Instruction

2
Data
List the data sources available to you in your classrooms and/or buildings.Circle the data sources you use to inform your teaching and/or leadership.Write examples of how teaching changes based on these data sourcesShare out
0:04

3
Overview
Examine how the increase of data in education is impacting schools
Clarify why data is naturally leading to regrouping and reteaching
Explore how we can better leverage student data to improve instruction and impact student learning
Identify concrete next steps
0:05

4
Data-driven reform
2010 US Department of Education Study
Examine how the increase of data in education is impacting schools
0:06

5
We are collecting a lot of data
Instructional/curriculum management system
Data Warehouse
Assessment system
Student information system
64%
77%
79%
>99%
Source: USDOE
US Districts with Electronic Student Data Systems by Type
0:07

6
What can that data tell us?
Type of Query% of Districts with
This System Capability
Individual student history over time 83%
Drill-down capability 76%
Individual student assessment performance over time 72%
Student performance linked to specific teachers 67%
Student performance linked to specific instructional programs 42%
Student performance linked to teacher information or characteristics 38%
Source: USDOE
Most data provides historical information, little is connected to instruction.
0:08

7
What is the result of all that data?
1971 1975 1980 1984 1988 1990 1992 1994 1996 1999 2004 2008200210220230240250260270280290300
National Scores in Reading
Ave
rage
Sca
le S
core
(out
of a
pos
sibl
e 50
0)
Year Source: NAEP
No Child Left Behind
0:09

8
Explanations
Data-driven reform might be a flop
Insufficient time has passed to witness the impact
There are flaws in the implementation of data systems and reform
Why are we not seeing results from data-driven reform?
0:10

9
Question
Why does the data we generate lead to minimal improvement?
0:11

10
State Data
Result: Re-Teaching– Spend more time
teaching standards that last year’s students failed to understand
0:12
State DataTest in the spring,
receive data in the fall
Good:Identify general areas of needed improvement
Bad:-Received after the students have left our classrooms-Will past data apply to new students?
11
Result: Regrouping and reteaching
– Regrouping students according to their performance on standards
– Reteaching the standards on which students performed poorly
Interim & Formative Data
0:13
Interim & Formative DataTest several times a year, receive feedback
immediately or within 2-3 weeks
Good:-Data more timely and pertinent to specific groups of students
Bad:-Intense focus on counting and trends— while the numbers provide some information, they do not explicitly provide insight into student thinking-Often cannot break down data by sub-standards

12
Feedback and change
Teachers receive feedback from standardized assessments
Feedback leads to reteaching and
regrouping by design
Reteaching and regrouping are not
dramatically impacting student
learning
0:14

13
Reteaching and Regrouping
Why aren’t they “game changers”?Teachers often work in isolation, making it tough to learn new strategies that may improve reteaching or regrouping
Reteaching often involves teaching something the same way we taught it the first time
Regrouping students does not directly address the specific reasons why students do not understand a skill or content area
0:16

14
The goal: Better student outcomes
We are giving teachers the same flawed feedback and expecting different results
Enabling better teaching
“Insanity: doing the same thing over and over again and expecting different results.”
– Albert Einstein
0:17

15
Question
What is the greatest data need among districts?
0:17

16
Greatest data needs
Collaborating and sharing ideas with colleagues regarding data inquiry and analysis issues
Adapting instructional activities to meet students' individual needs
Examining student data to identify which practices work best for which students
0% 20% 40% 60% 80% 100%
Source: USDOE, “Use of Educational Data at the Local Level”, 2010
84%
84%
80%
Answer: “The greatest perceived area of need… is how to connect student data to instructional practice.” – US DOE 2010
Ranked #1, #2 and #4 on list of data needs for districts nationwide.
0:19

17
Question
How can we better connect data to improving instruction?
0:20

18
Instructional Core
A Guiding Belief:– Effective reforms focus on that which is in our
control: instruction– The most effective reforms intervene at the level of
the instructional core
TEACHER STUDENT
CONTENT
Richard Elmore, HGSE
0:22

19
From Data to Improving Instruction
0:23
Standardized Test Data
Teaching Practice
Data
Student Work Data

Roosevelt Middle School
Home of the Rockets
What do you see?
0:25
Writing Reading Math0%
10%
20%
30%
40%
50%
60%
70%
80%
90%
100%
4% 3% 7%4% 7%
10%
39% 33%
38%
47%49%
40%
6% 8% 5%
Roosevelt 8th GradeProficiency by Subject
AdvancedProficientBasicBelow BasicFar Below Basic

Roosevelt Middle School
Home of the Rockets
What do you see?
0:27
Number Sense
Statistics and Probability
Measurement and Geometry
Algebra and Functions
Mathematical Reasoning
0% 10% 20% 30% 40% 50% 60% 70% 80% 90% 100%
4%
7%
7%
10%
4%
8%
8%
10%
16%
9%
40%
41%
40%
44%
41%
43%
41%
39%
28%
41%
5%
3%
4%
2%
5%
Math Proficiency by Standard - 8th Grade
Far Below BasicBelow BasicBasicProficientAdvanced

22
QuestionsWhat other questions do the state data data raise?What other data would you like to see?Are you ready to improve instruction?
0:30
Let’s examine typical interim data…

Roosevelt Middle School
Home of the Rockets
What do you see?
0:32
Students solve simple linear equations and inequalities over the rational numbers
Students interpret and evaluate expressions involving integer powers and simple roots
Students graph and interpret linear and nonlinear functions
Students express quantitative relationships by using algebraic terminology, expressions, equations, inequalities, and graphs
9%
7%
11%
13%
16%
14%
16%
18%
42%
37%
44%
52%
31%
39%
27%
15%
2%
3%
2%
2%
8th Grade Proficiency"Algebra and Functions" Sub-
StandardsFar Be-low Basic
Below Basic
Basic
Pro-fi-cientAd-vanced

24
Now What?
What recommendations would you make to improve proficiency based on the data you have examined?
0:35

25
From data to improving instruction
Started with one source of state data
Identified math as a possible problem area
Looked deeper and found Algebra and Functions is an area of difficulty
Found that students were least proficient in “expressing quantitative relationships using algebraic terminology”
Standardized Test Data
Teaching Practice
Data
Student Work Data
0:37

26
Looking at Student Work
Let’s examine student thinking
0:38

Roosevelt Middle School
Home of the Rockets
Looking at Student Work
Solve this problem (2 minutes)
0:40

Roosevelt Middle School
Home of the Rockets
Looking at Student Work
0:47
What does each student understand and not understand?
How does this student work examination help us understand student thinking?
Pair (3 minutes) Share out (3
minutes)

29
Next StepsWhat recommendations would you make to improve proficiency based on the data you have examined?
Are the suggestions different now that we have examined a second layer of data?
What other questions would we want to answer before committing to a specific change or reform?
0:51

30
Are we there yet?
Standardized Test Data
Teaching Practice
Data
Student Work Data
0:52
Roosevelt Middle School
Home of the Rockets
Observing Practice
0:54
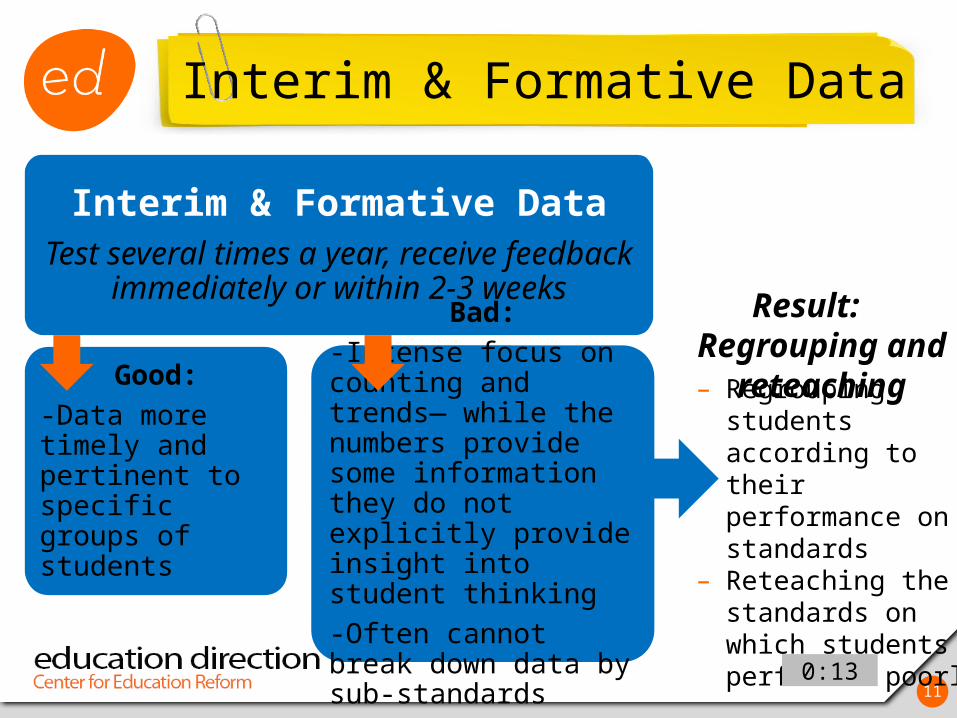
In their observations, teachers observed that while teachers frequently used variables in their instruction, most often they were used to represent a fixed amount. For example:
Solve for x. 3x=15 Chantel bought three songs (s) on iTunes. Using the
formula below, determine how much she spent. (0.99)(s)=Total spent
They determined students had little exposure to variables that clearly could represent a variety of values.

32
From data to improving instruction
Standardized Test Data
Teaching Practice
Data
Student Work Data
0:55

33
What was necessary?What did we need for this level of understanding to occur?– A broader definition of data (student work, observation
of practice)• Revisit the list you created at the beginning of the session—Is
there anything you would now add?
– Relevant data (timely, predictable)– Best leverage resources
• Knowledge/expertise• Time
– To examine data (student work, observe teachers)– To collaborate with colleagues
0:56

34
Why does this matter?Using data for accountability is not going awayPopular U.S. reform efforts miss the target– Merit pay– One-to-one computing– Extended learning time– Charter schools
Reforms that are most impactful focus on the core
TEACHER STUDENT
CONTENT
Richard Elmore, HGSE
0:57

35
Now what?
Reflect: – What does this mean for the way you use data
within your school?– What can you do to collect and collaboratively
analyze more classroom relevant data in your schools?
0:58

36
Session Survey
You are currently attending session 1102. Please visit www.ascd.org/evaluations to provide
feedback on this session.Thank you!
0:59