Embed Size (px)
Citation preview
11
ByBy
Assoc. Prof. Dr.Somjai PhagaphasvivatAssoc. Prof. Dr.Somjai Phagaphasvivat
Thailand Economy
Update : Mar 2012
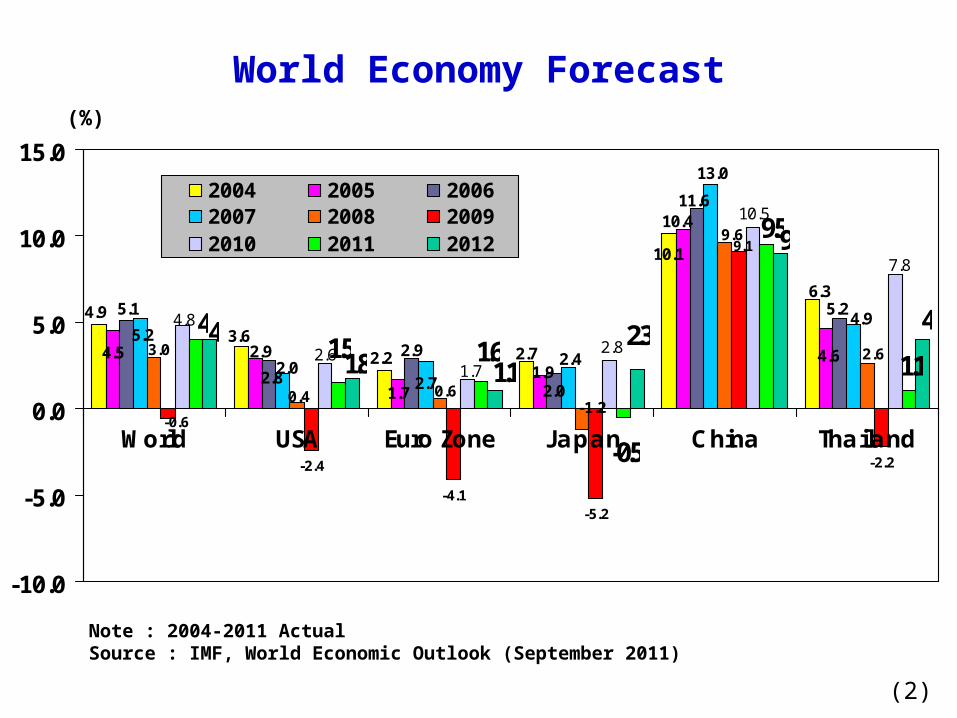
World Economy Forecast
-2.4
-4.1-5.2
-2.2
1.5
-0.5
2.34.9
3.62.2
6.3
10.1
2.7 4.61.9
1.7
2.94.5
10.4
5.1
2.8
2.9
2.0
11.6
5.2
13.0
4.9
2.4
2.72.0
5.22.6
9.6
-1.20.60.4
3.0
-0.6
9.17.8
10.5
2.8
1.72.6
4.8
1.1
4
9.5
1.64
9
1.8 1.1
4
-10.0
-5.0
0.0
5.0
10.0
15.0
World USA Euro Zone Japan China Thailand
2004 2005 20062007 2008 20092010 2011 2012
Note : 2004-2011 Actual Source : IMF, World Economic Outlook (September 2011)
(2)
(%)
(3)
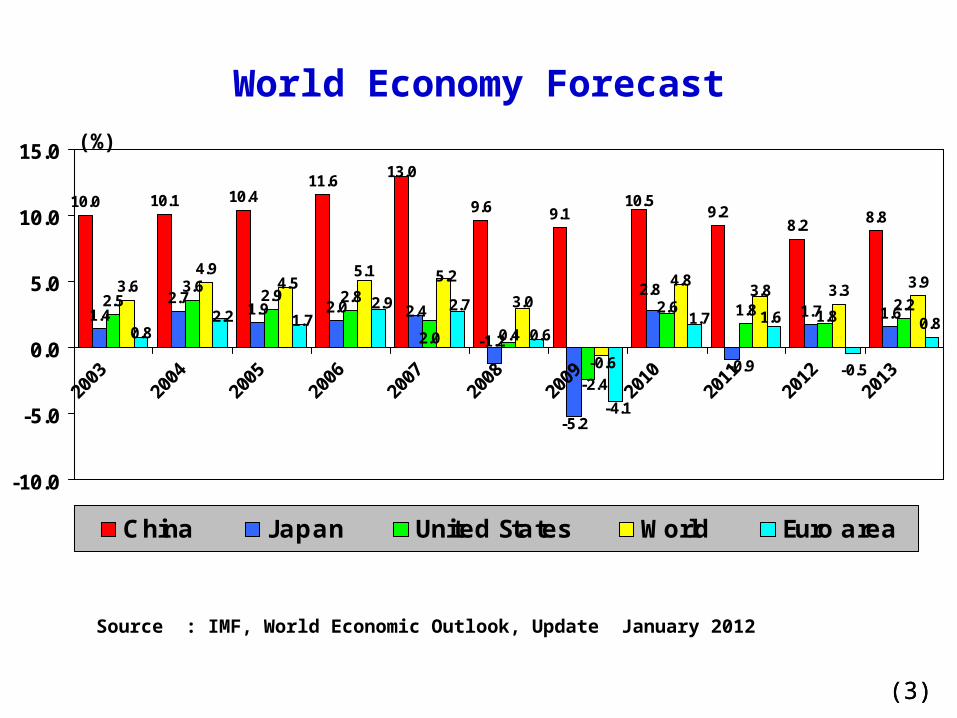
World Economy Forecast
Source : IMF, World Economic Outlook, Update January 2012
(3)
10.0 10.1 10.411.6
9.6 9.1 9.28.2 8.8
1.42.7
1.9 2.0 1.7 1.62.5
3.62.9 2.8
1.8 2.23.6
4.93.3 3.9
-0.5
0.8
10.5
13.0
-0.9
2.42.8
-5.2
-1.2
1.82.6
-2.4
0.42.0
5.2
3.0
-0.6
4.83.8
5.14.5
0.82.2 1.7
2.9 2.7
0.6
-4.1
1.7 1.6
-10.0
-5.0
0.0
5.0
10.0
15.0
2003
2004
2005
2006
2007
2008
2009
2010
2011
2012
2013
China Japan United States World Euro area
(%)
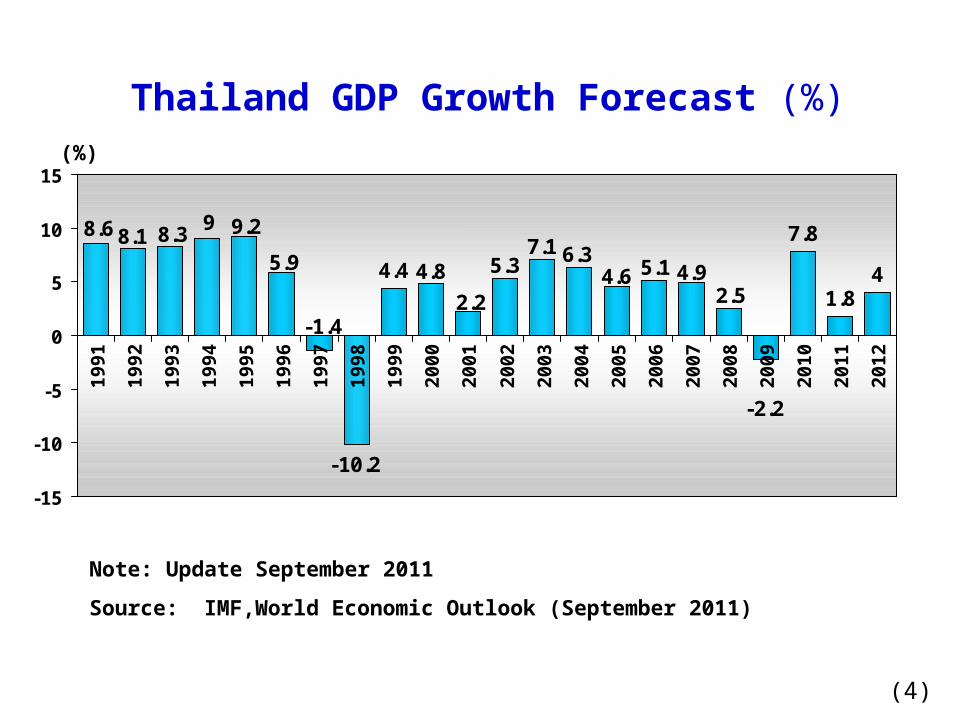
Note: Update September 2011
Source: IMF,World Economic Outlook (September 2011)
Thailand GDP Growth Forecast (%)
4.41.8
45.14.92.5
-2.2
4.66.37.1
5.3
2.2
4.8
-10.2
-1.4
5.9
9.298.38.18.6 7.8
-15
-10
-5
0
5
10
15
1991
1992
1993
1994
1995
1996
1997
1998
1999
2000
2001
2002
2003
2004
2005
2006
2007
2008
2009
2010
2011
2012
(4)
(%)
(5)
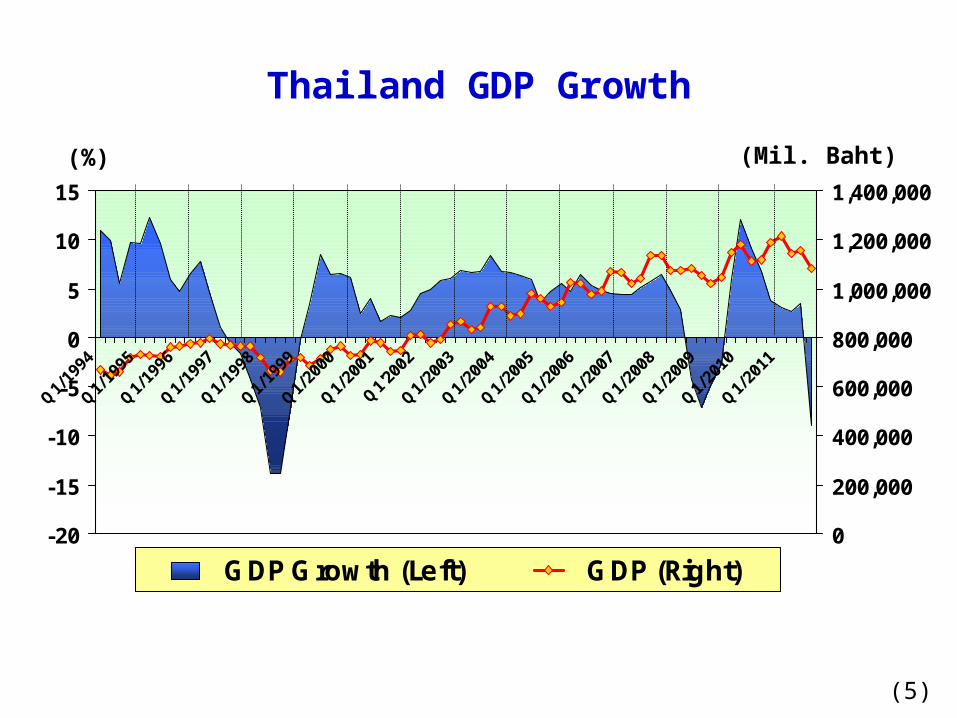
Thailand GDP Growth
-20
-15
-10
-5
0
5
10
15
0
200,000
400,000
600,000
800,000
1,000,000
1,200,000
1,400,000
GDP Growth (Left) GDP (Right)
(%) (Mil. Baht)
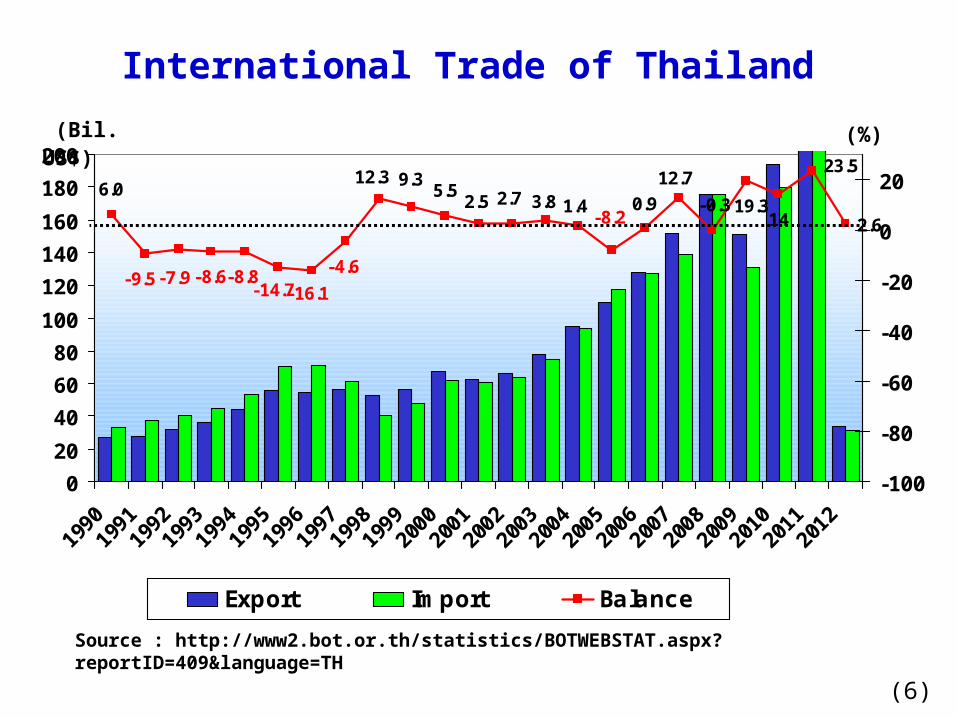
International Trade of Thailand
2.6
23.5
1419.3
-16.1-14.7-4.6
-0.3
12.70.9
-8.21.43.82.72.5
5.59.312.3
-8.8-8.6-7.9-9.5
6.0
0
20
40
60
80
100
120
140
160
180
200
1990
1991
1992
1993
1994
1995
1996
1997
1998
1999
2000
2001
2002
2003
2004
2005
2006
2007
2008
2009
2010
2011
2012
-100
-80
-60
-40
-20
0
20
Export Import Balance
(Bil. US$)
Source : http://www2.bot.or.th/statistics/BOTWEBSTAT.aspx?reportID=409&language=TH
(6)
(%)
(7)
0.0
5.0
10.0
15.0
20.0
25.0
Mar-0
9
May
-09
Jul-0
9
Sep-
09
Nov-0
9
Jan-
10
Mar-1
0
May
-10
Jul-1
0
Sep-
10
Nov-1
0
Jan-
11
Mar-1
1
May
-11
Jul-1
1
Sep-
11
Nov-1
1
Jan-
12-2,000
-1,0000
1,000
2,000
3,0004,000
5,000
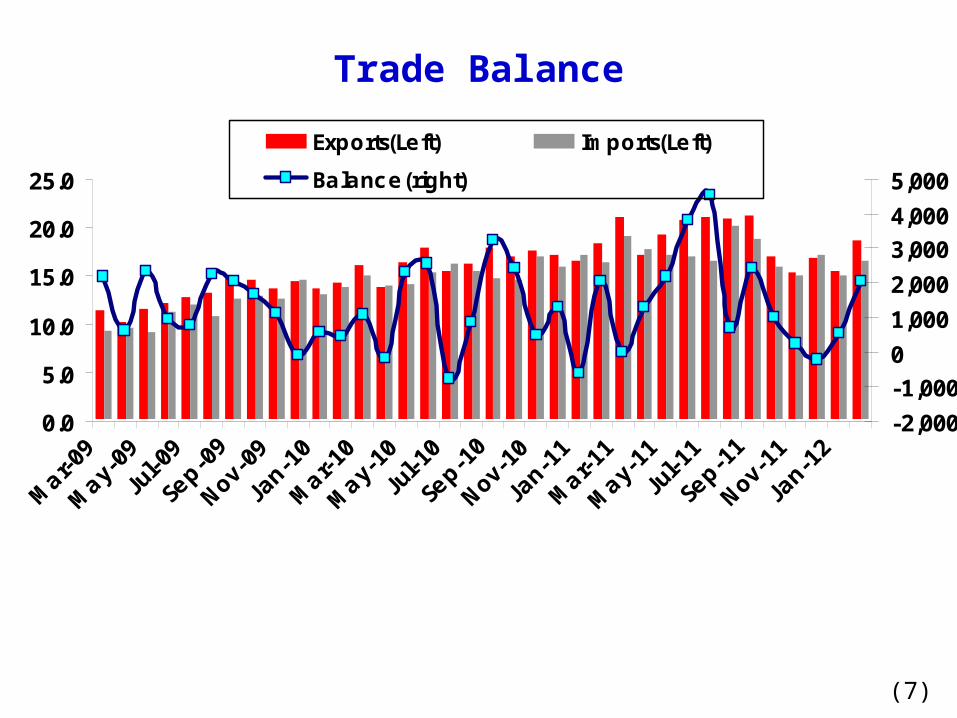
Exports(Left) Imports(Left)
Balance(right)
(Bil. US$) (Mil. US$)
Trade Balance
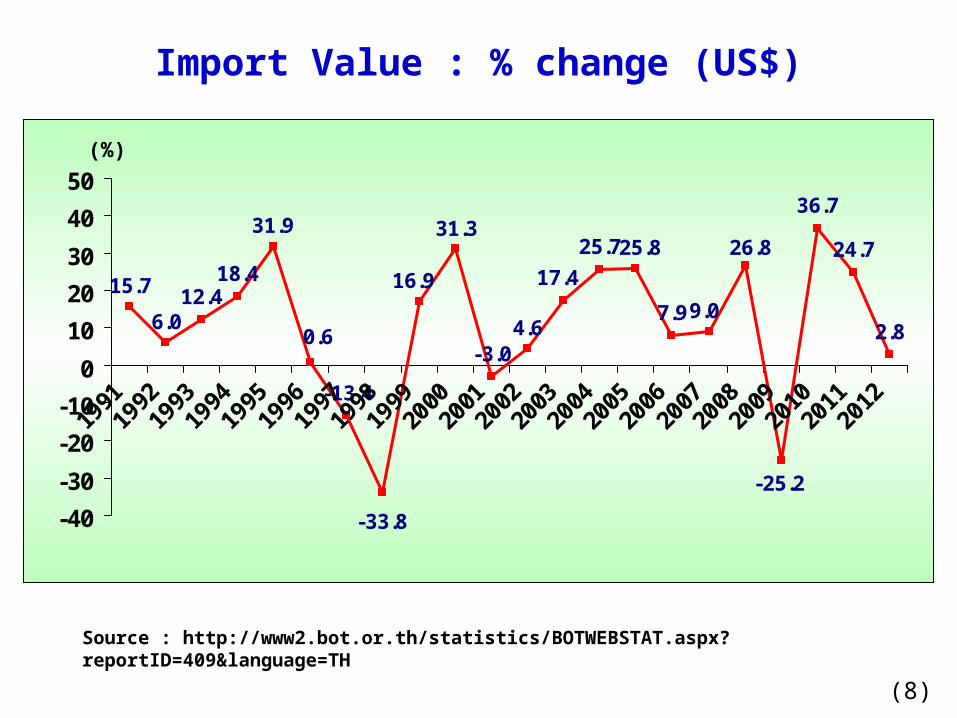
Import Value : % change (US$)
36.7
24.7
2.8
-25.2
15.7
-13.4
17.4
4.6
16.9
-33.8
0.66.0
18.412.4
-3.0
31.331.925.725.8
9.0
26.8
7.9
-40
-30
-20
-10
0
10
20
30
40
50
1991
1992
1993
1994
1995
1996
1997
1998
1999
2000
2001
2002
2003
2004
2005
2006
2007
2008
2009
2010
2011
2012
Source : http://www2.bot.or.th/statistics/BOTWEBSTAT.aspx?reportID=409&language=TH
(8)
(%)
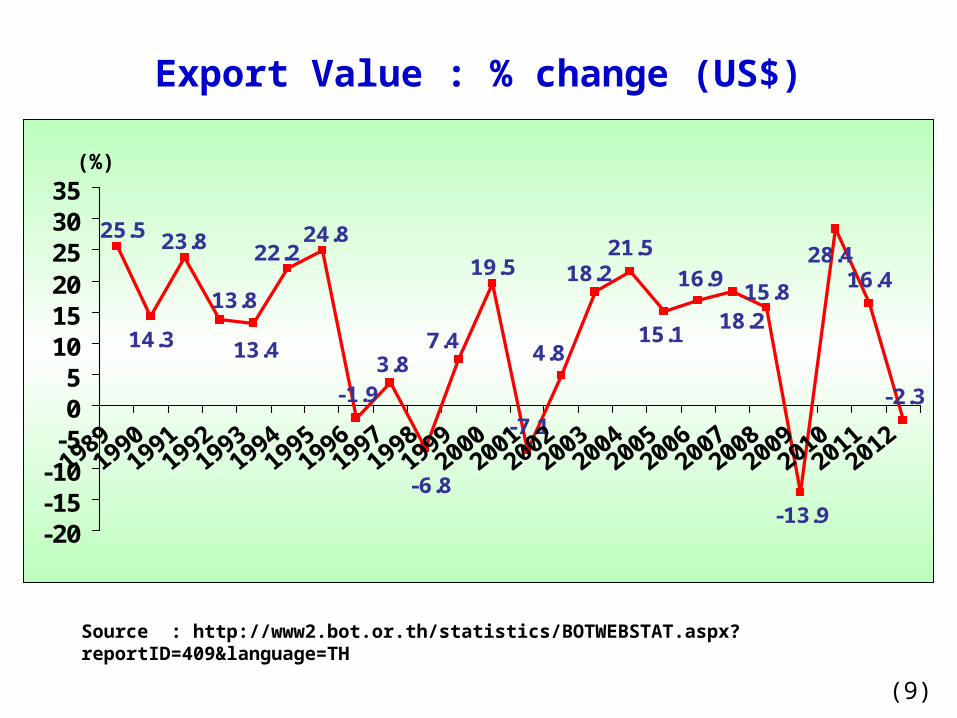
Export Value : % change (US$)
21.5
16.4
-2.3
28.4
-13.9
25.5
15.818.2
16.9
15.1
18.2
4.813.4
-6.8
7.4
23.8
13.8
14.3
22.2
-1.93.8
19.5
-7.1
24.8
-20-15-10-505
101520253035
Source : http://www2.bot.or.th/statistics/BOTWEBSTAT.aspx?reportID=409&language=TH
(9)
(%)
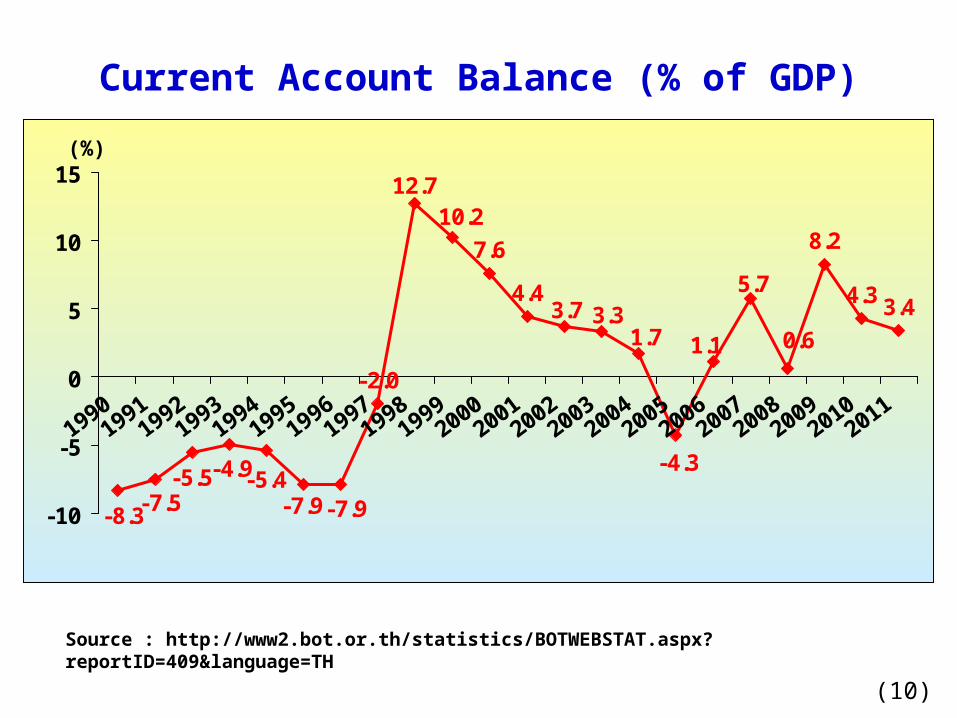
Current Account Balance (% of GDP)
8.2
4.33.40.6
3.3
-4.3
5.7
1.11.73.7
4.4
7.610.2
12.7
-2.0
-7.9-7.9-5.4-4.9-5.5
-7.5-8.3-10
-5
0
5
10
15
1990
1991
1992
1993
1994
1995
1996
1997
1998
1999
2000
2001
2002
2003
2004
2005
2006
2007
2008
2009
2010
2011
Source : http://www2.bot.or.th/statistics/BOTWEBSTAT.aspx?reportID=409&language=TH
(10)
(%)
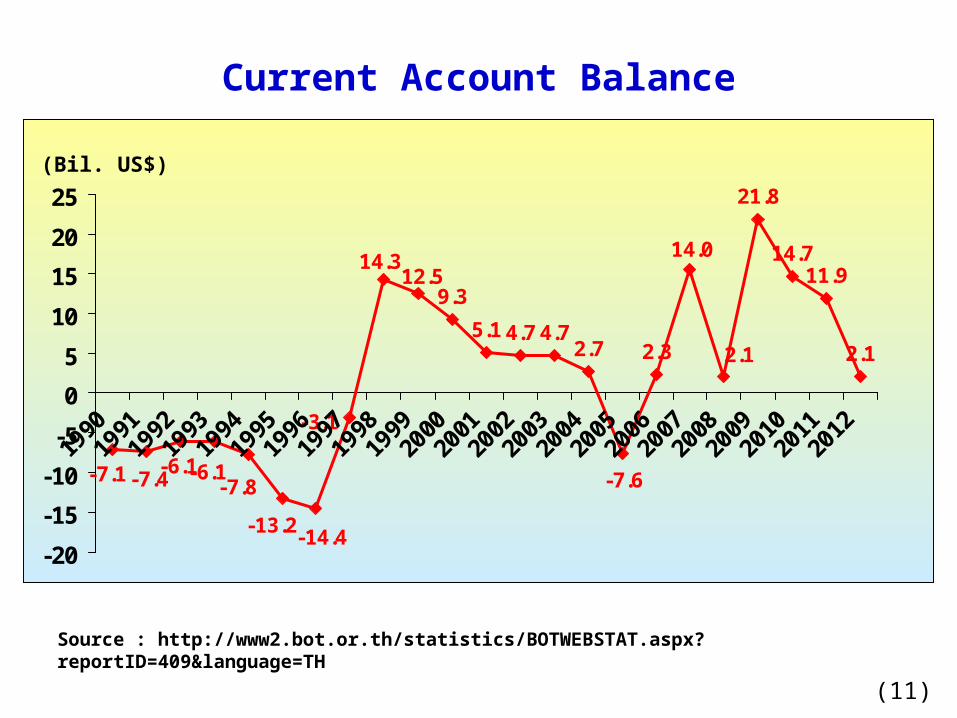
Current Account Balance
2.7
21.8
14.711.9
2.1
-7.1-7.4-6.1-6.1
-7.8
-13.2-14.4
-3.1
14.312.5
9.3
5.14.74.7
-7.6
2.3
14.0
2.1
-20
-15
-10
-5
0
5
10
15
20
25
199019
9119
9219
9319
9419
9519
9619
9719
9819
9920
0020
0120
0220
0320
0420
0520
0620
0720
0820
0920
1020
1120
12
(Bil. US$)
Source : http://www2.bot.or.th/statistics/BOTWEBSTAT.aspx?reportID=409&language=TH
(11)
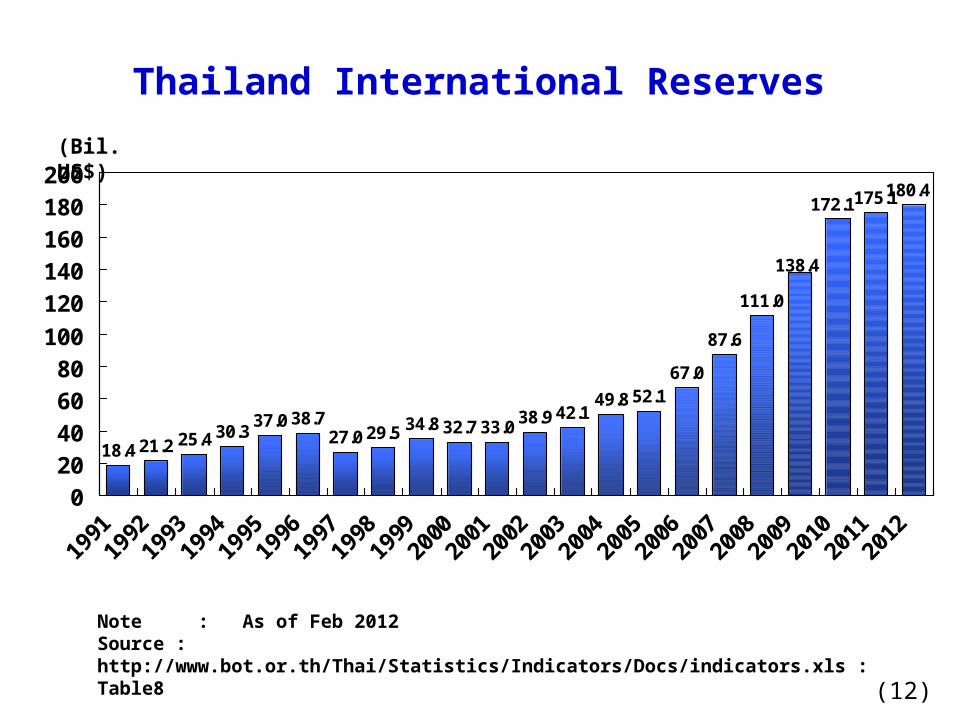
Thailand International Reserves
18.421.225.430.337.038.7
27.029.534.832.733.038.942.149.852.1
67.0
87.6
111.0
175.1180.4172.1
138.4
020406080
100120140160180200
1991
1992
1993
1994
1995
1996
1997
1998
1999
2000
2001
2002
2003
2004
2005
2006
2007
2008
2009
2010
2011
2012
(Bil. US$)
Note : As of Feb 2012Source : http://www.bot.or.th/Thai/Statistics/Indicators/Docs/indicators.xls : Table8 (12)
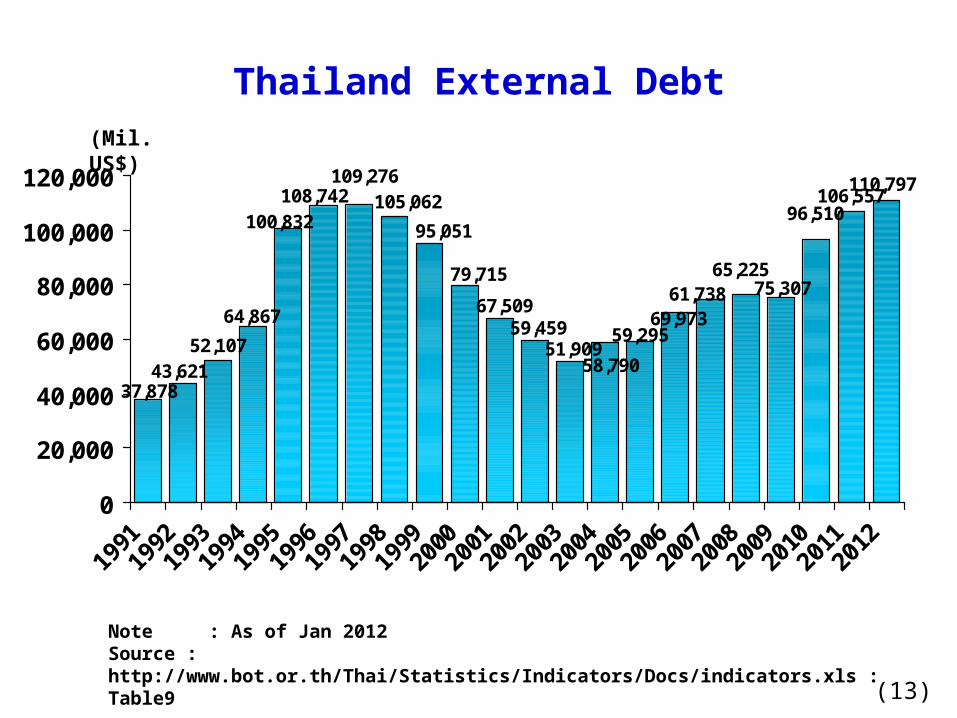
Thailand External Debt
106,557110,797
96,510
75,30765,225
61,73869,973
59,295
58,79051,909
59,45967,509
79,715
95,051
105,062109,276
108,742
64,867
52,10743,621
37,878
100,832
0
20,000
40,000
60,000
80,000
100,000
120,000
199119
9219
9319
9419
9519
9619
9719
9819
9920
0020
0120
0220
0320
0420
0520
0620
0720
0820
0920
1020
1120
12
(Mil. US$)
Note : As of Jan 2012Source : http://www.bot.or.th/Thai/Statistics/Indicators/Docs/indicators.xls : Table9
(13)
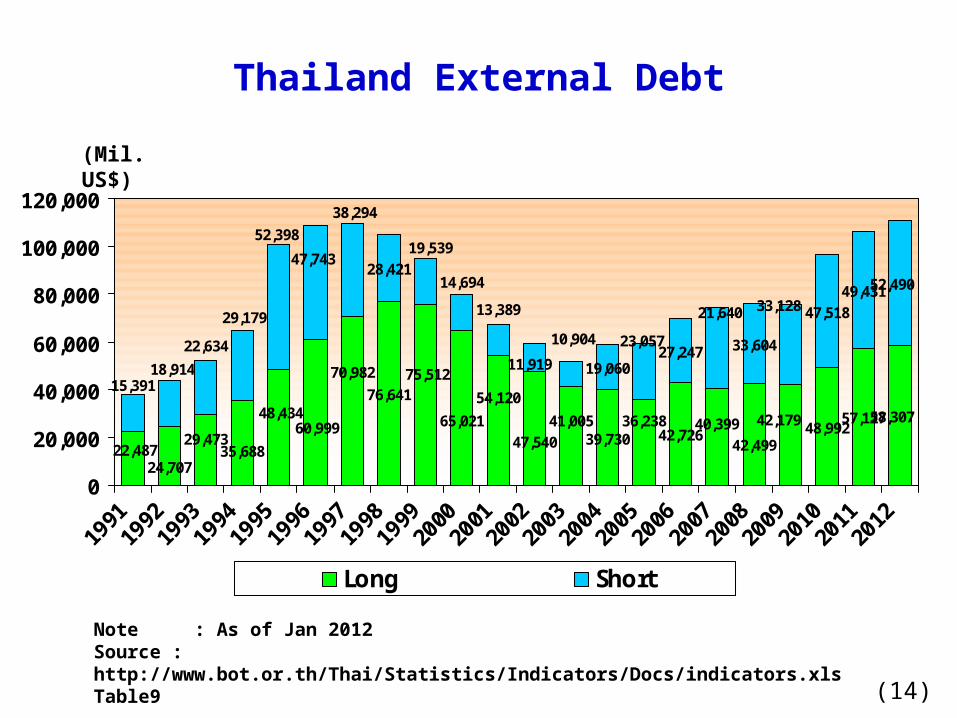
Thailand External Debt
76,641
39,730 42,726 48,99257,12758,307
28,421
19,06027,247 33,604
47,51849,43152,490
47,54065,021
22,48724,707
35,68829,473
60,99948,434
70,982 75,512
54,120
41,005 36,238
42,49940,399 42,179
15,39118,914
29,179
14,694
11,91922,634
52,398
47,743
38,294
19,539
13,389
10,904 23,057
21,640 33,128
0
20,000
40,000
60,000
80,000
100,000
120,000
1991
1992
1993
1994
1995
1996
1997
1998
1999
2000
2001
2002
2003
2004
2005
2006
2007
2008
2009
2010
2011
2012
Long Short
(Mil. US$)
Note : As of Jan 2012Source : http://www.bot.or.th/Thai/Statistics/Indicators/Docs/indicators.xls Table9
(14)
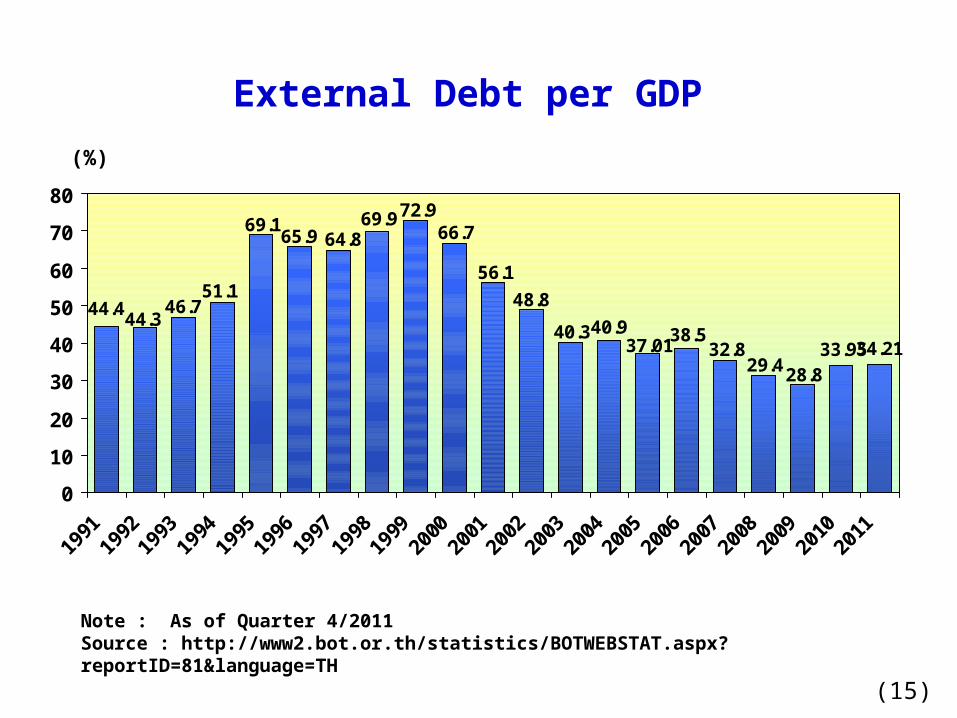
External Debt per GDP
34.2133.9528.829.4
32.838.537.01
40.940.3
48.8
56.1
66.772.969.9
64.865.969.1
51.146.7
44.344.4
0
10
20
30
40
50
60
70
80
1991
1992
1993
1994
1995
1996
1997
1998
1999
2000
2001
2002
2003
2004
2005
2006
2007
2008
2009
2010
2011
(%)
Note : As of Quarter 4/2011Source : http://www2.bot.or.th/statistics/BOTWEBSTAT.aspx?reportID=81&language=TH
(15)
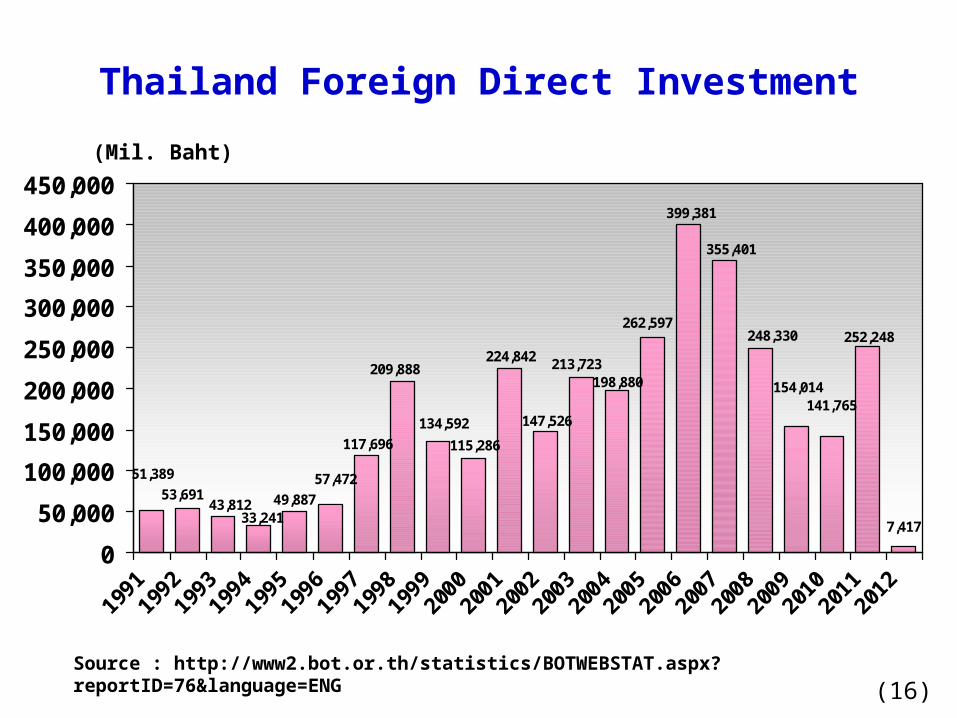
Thailand Foreign Direct Investment
7,417
141,765
252,248
198,880
51,389
43,81233,241
53,69157,472
49,887
117,696
209,888
115,286
224,842 213,723
147,526
262,597
399,381
355,401
248,330
154,014
134,592
0
50,000
100,000
150,000
200,000
250,000
300,000
350,000
400,000
450,000(Mil. Baht)
Source : http://www2.bot.or.th/statistics/BOTWEBSTAT.aspx?reportID=76&language=ENG (16)
(17)
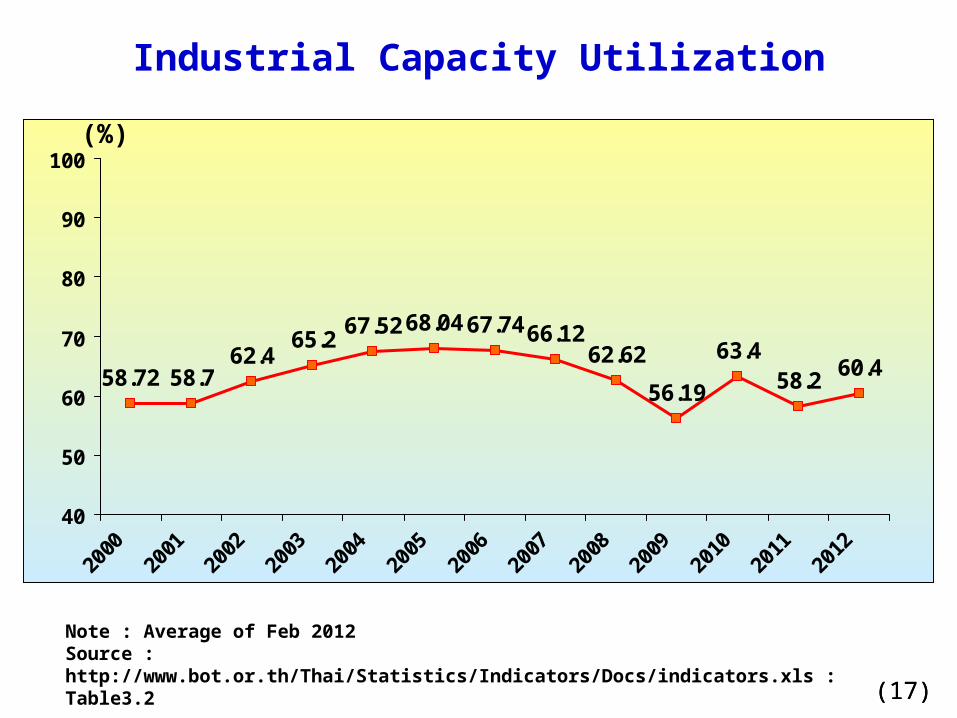
Industrial Capacity Utilization
58.72 58.762.4
65.267.5268.0467.7466.12
62.62
56.19
63.458.2 60.4
40
50
60
70
80
90
100
2000
2001
2002
2003
2004
2005
2006
2007
2008
2009
2010
2011
2012
Note : Average of Feb 2012Source : http://www.bot.or.th/Thai/Statistics/Indicators/Docs/indicators.xls : Table3.2
(17)
(%)
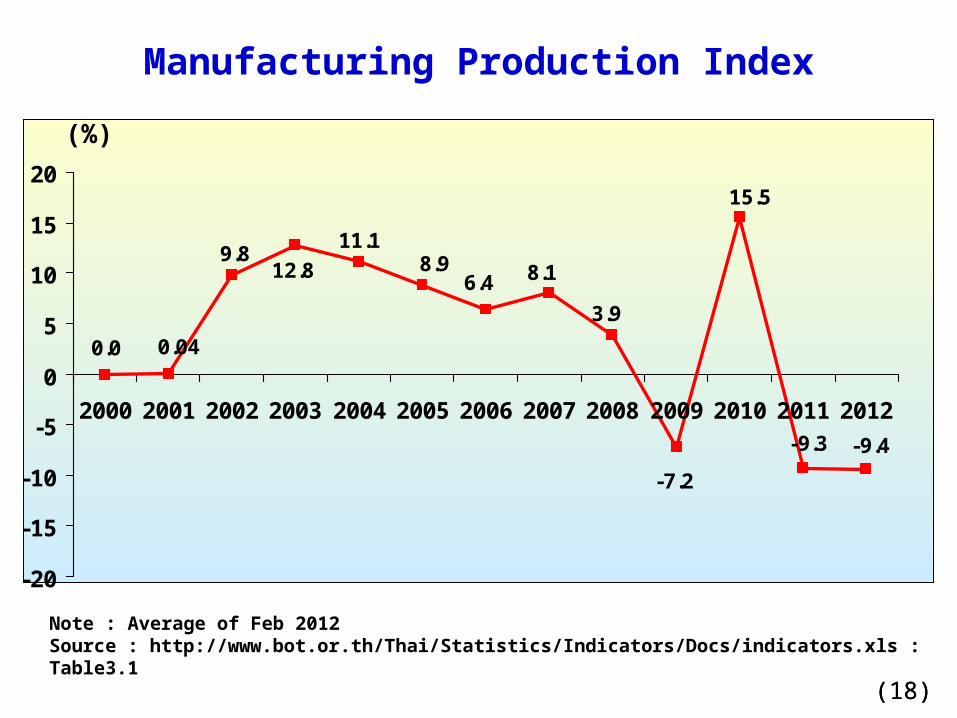
(18)
Manufacturing Production Index
-9.4-9.3
15.5
-7.2
3.9
8.16.48.9
11.19.8
0.040.0
12.8
-20
-15
-10
-5
0
5
10
15
20
2000 2001 2002 2003 2004 2005 2006 2007 2008 2009 2010 2011 2012
Note : Average of Feb 2012Source : http://www.bot.or.th/Thai/Statistics/Indicators/Docs/indicators.xls : Table3.1
(18)
(%)
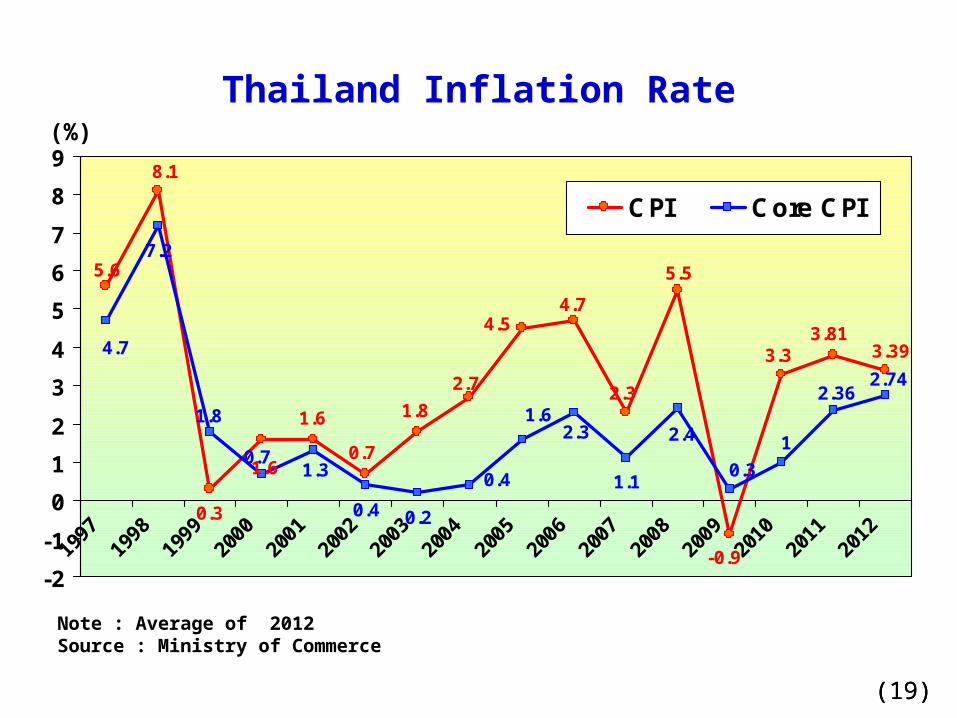
(19)
Thailand Inflation Rate
3.3
0.7
5.6
8.1
0.3
1.6 1.8
1.6
2.7
4.7
2.3
5.5
-0.9
4.5 3.813.39
1
4.7
1.8
0.71.3
0.4 0.2
7.2
0.4
2.3
1.1
2.4
0.3
2.742.36
1.6
-2
-1
0
1
2
3
4
5
6
7
8
9
1997
1998
1999
2000
2001
2002
2003
2004
2005
2006
2007
2008
2009
2010
2011
2012
CPI Core CPI
Note : Average of 2012Source : Ministry of Commerce
(19)
(%)
(20)
-6
-4
-2
0
2
4
6
Jan-
09
May
-09
Sep-
09
Jan-
10
May
-10
Sep-
10
Jan-
11
May
-11
Sep-
11
Jan-
12
CPI Core CPI
(%)
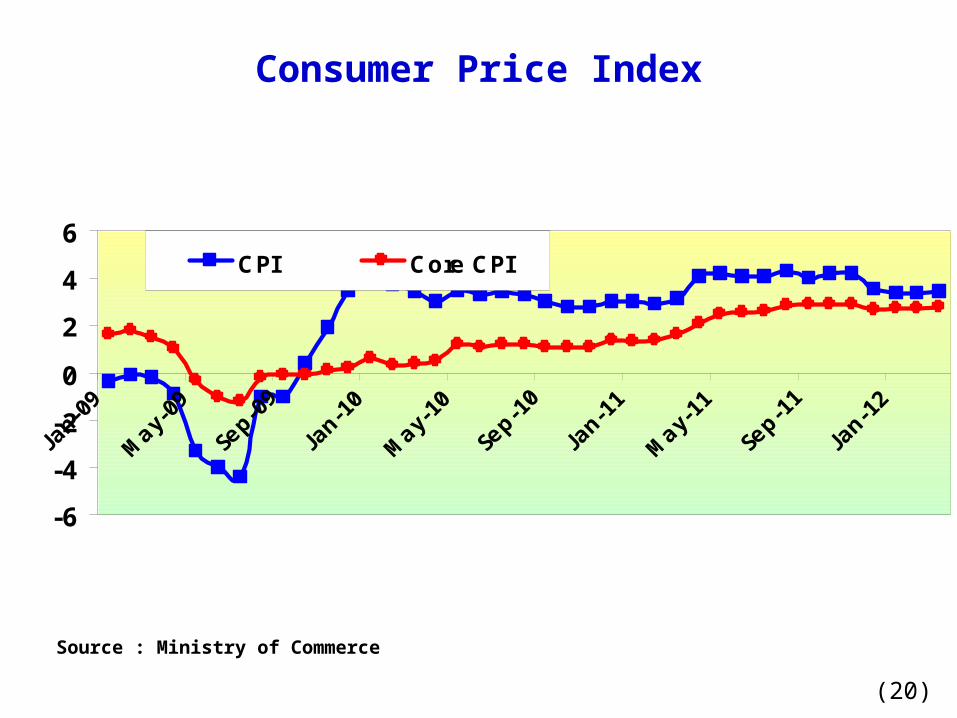
Consumer Price Index
Source : Ministry of Commerce
(21)
115
120
125
130
135
140
145
150
Jan-05
Apr-0
5
Jul-0
5
Oct-05
Jan-06
Apr-0
6
Jul-0
6
Oct-06
Jan-07
Apr-0
7
Jul-0
7
Oct-07
Jan-08
Apr-0
8
Jul-0
8
Oct-08
Jan-09
Apr-0
9
July-09
Oct-09
Jan-10
Apr-1
0
Jul-1
0
oct-1
0
Jan-11
Apr-1
1
Jul-1
1
Oct-11
Jan-12
-8
-4
0
4
8
12
PCI %YOY
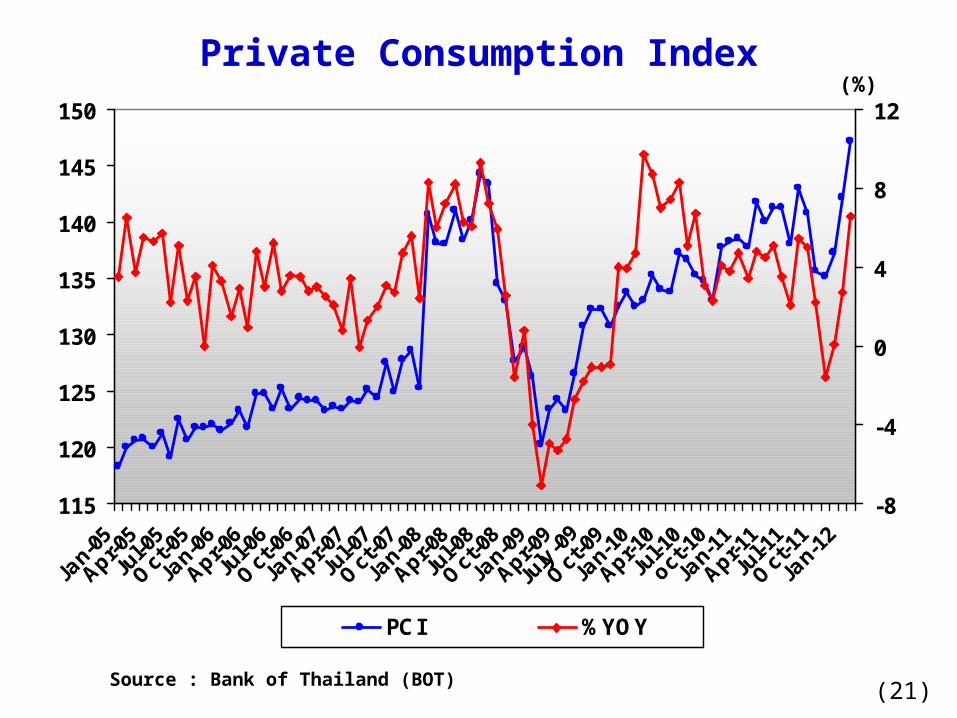
Private Consumption Index(%)
Source : Bank of Thailand (BOT)
(22)
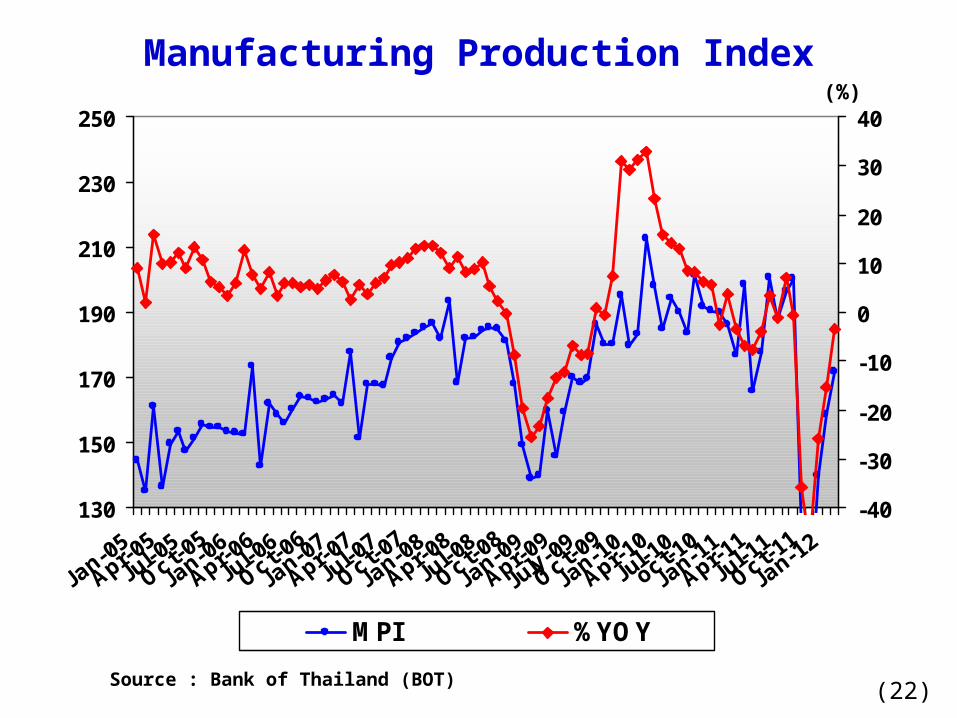
Manufacturing Production Index
130
150
170
190
210
230
250
Jan-
05
Apr-0
5
Jul-0
5
Oct-05
Jan-
06
Apr-0
6
Jul-0
6
Oct-06
Jan-
07
Apr-0
7
Jul-0
7
Oct-07
Jan-
08
Apr-0
8
Jul-0
8
Oct-08
Jan-
09
Apr-0
9
July-
09
Oct-09
Jan-
10
Apr-1
0
Jul-1
0
oct-1
0
Jan-
11
Apr-1
1
Jul-1
1
Oct-11
Jan-
12
-40
-30
-20
-10
0
10
20
30
40
MPI %YOY
Source : Bank of Thailand (BOT)
(%)
(23)
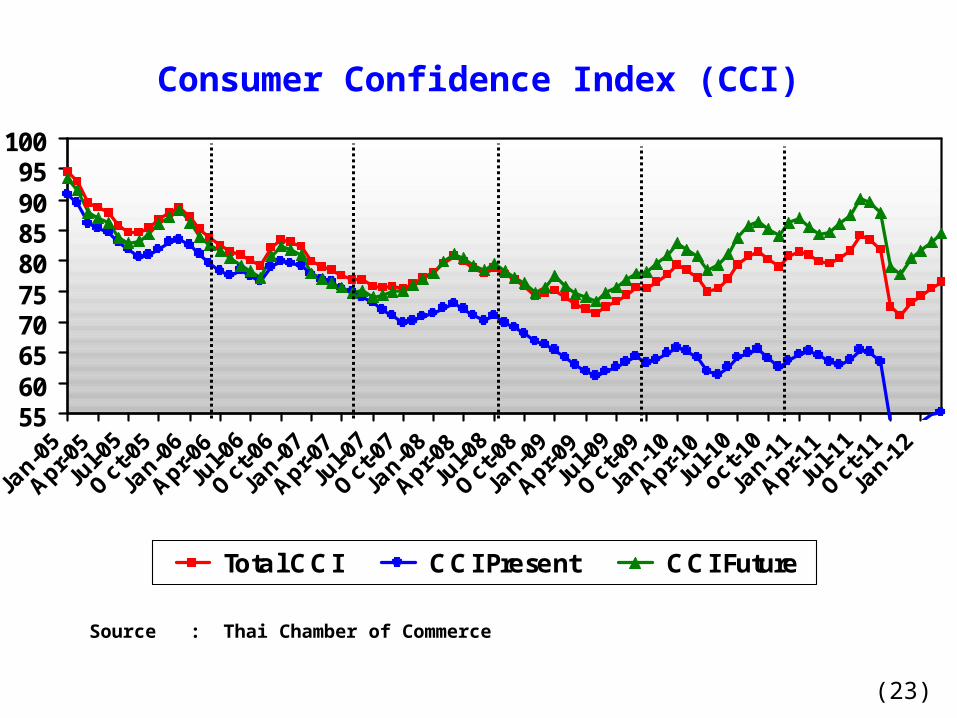
Consumer Confidence Index (CCI)
556065707580859095
100
Total CCI CCI Present CCI Future
Source : Thai Chamber of Commerce
(24)
30
40
50
60
Jan-
05
Apr-05
Jul-0
5
Oct-05
Jan-
06
Apr-06
Jul-0
6
Oct-06
Jan-
07
Apr-07
Jul-0
7
Oct-07
Jan-
08
Apr-08
Jul-0
8
Oct-08
Jan-
09
Apr-09
July-09
Oct-09
Jan-
10
April-10
Jul-1
0
Oct-10
Jan-
11
Apr-11
Jul-1
1
Oct-11
Jan-
12
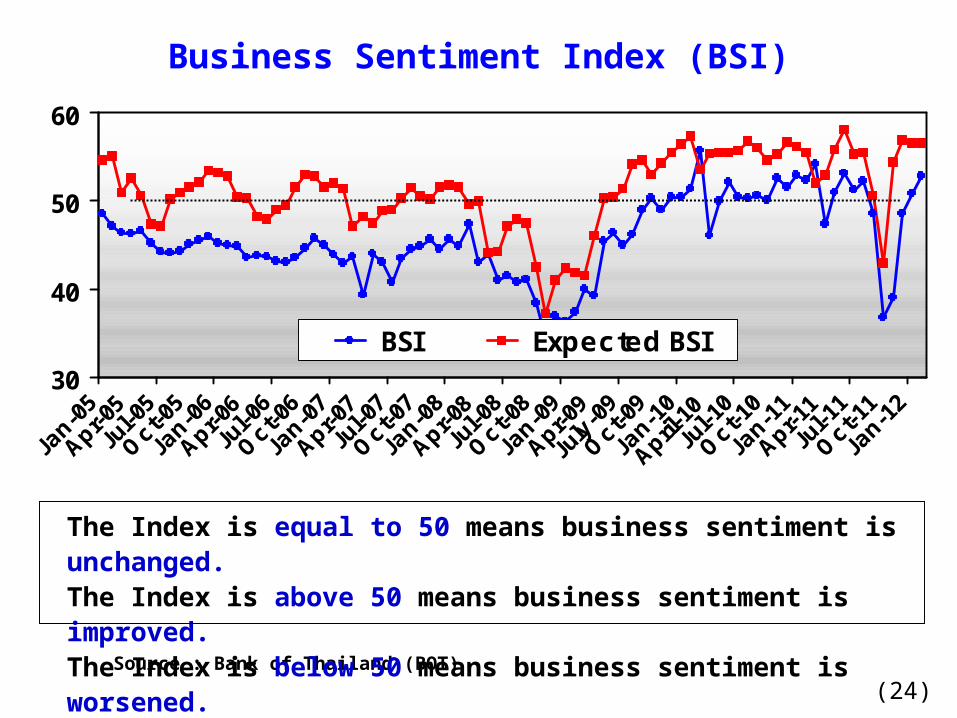
BSI Expected BSI
Source : Bank of Thailand (BOT)
Business Sentiment Index (BSI)
The Index is equal to 50 means business sentiment is unchanged.The Index is above 50 means business sentiment is improved.The Index is below 50 means business sentiment is worsened.
(25)
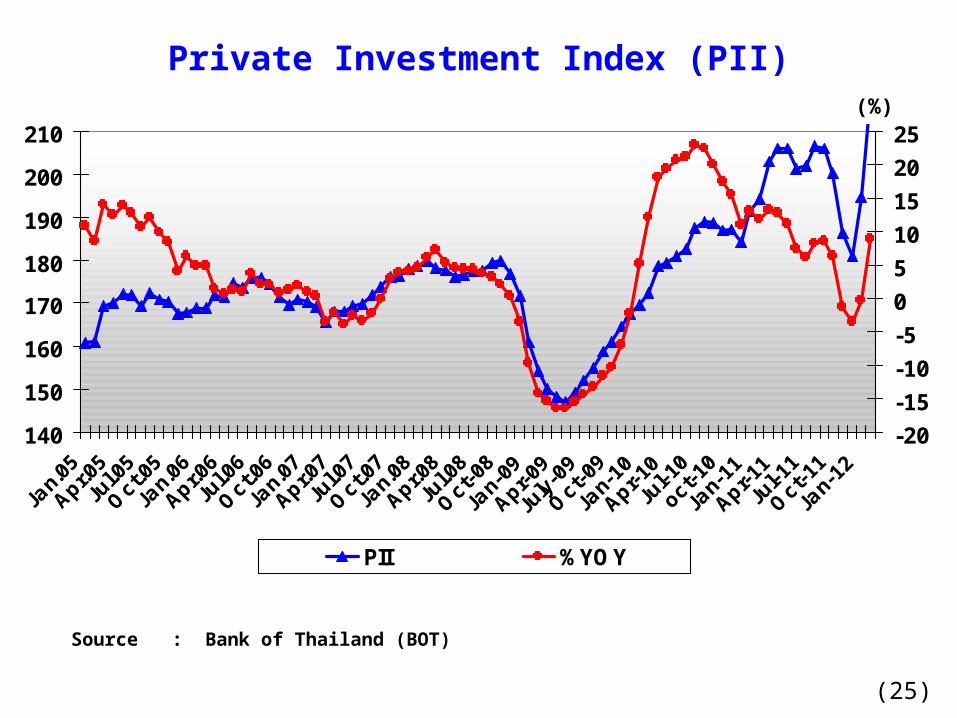
Private Investment Index (PII)
140
150
160
170
180
190
200
210
Jan.05
Apr.05
Jul.0
5
Oct.05
Jan.06
Apr.06
Jul.0
6
Oct.06
Jan.07
Apr.07
Jul.0
7
Oct.07
Jan.08
Apr.08
Jul.0
8
Oct-0
8
Jan-
09
Apr-0
9
July-
09
Oct-0
9
Jan-
10
Apr-1
0
Jul-1
0
oct-1
0
Jan-
11
Apr-1
1
Jul-1
1
Oct-1
1
Jan-
12
-20
-15
-10
-5
0
5
10
15
20
25
PII %YOY
Source : Bank of Thailand (BOT)
(%)
(26)
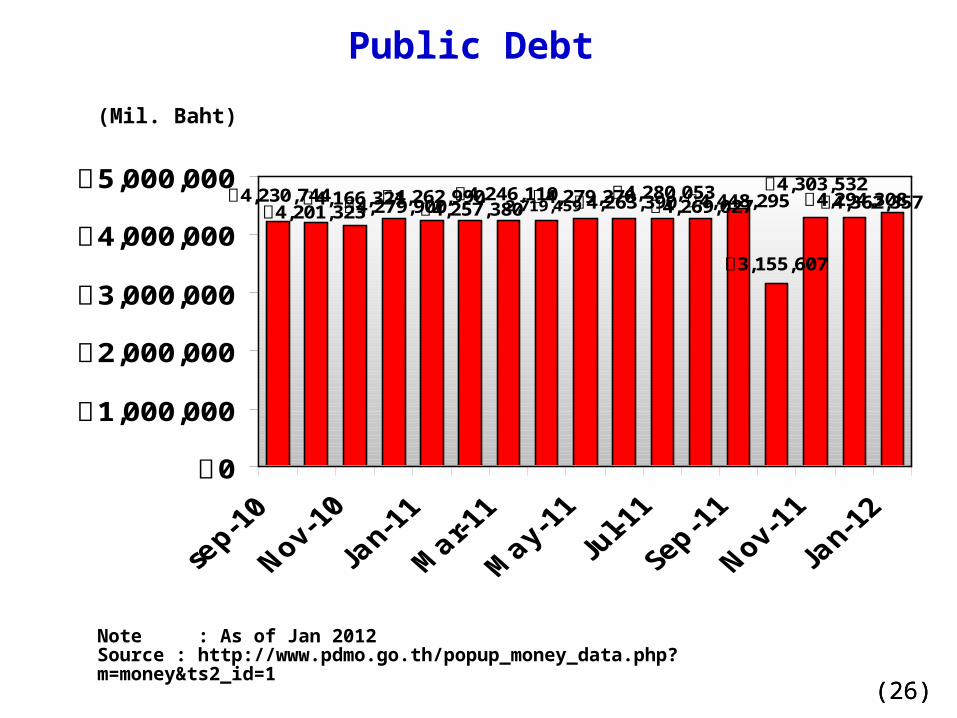
Public Debt
฿4,294,308฿4,230,744฿4,201,323
฿4,166,321฿4,279,900฿4,262,990฿4,257,380
฿4,246,1102,719,459฿4,279,270฿4,263,390฿4,280,053
฿4,269,027฿4,448,295
฿3,155,607
฿4,303,532฿4,362,357
฿0
฿1,000,000
฿2,000,000
฿3,000,000
฿4,000,000
฿5,000,000
(Mil. Baht)
Note : As of Jan 2012Source : http://www.pdmo.go.th/popup_money_data.php?m=money&ts2_id=1
(26)
(27)
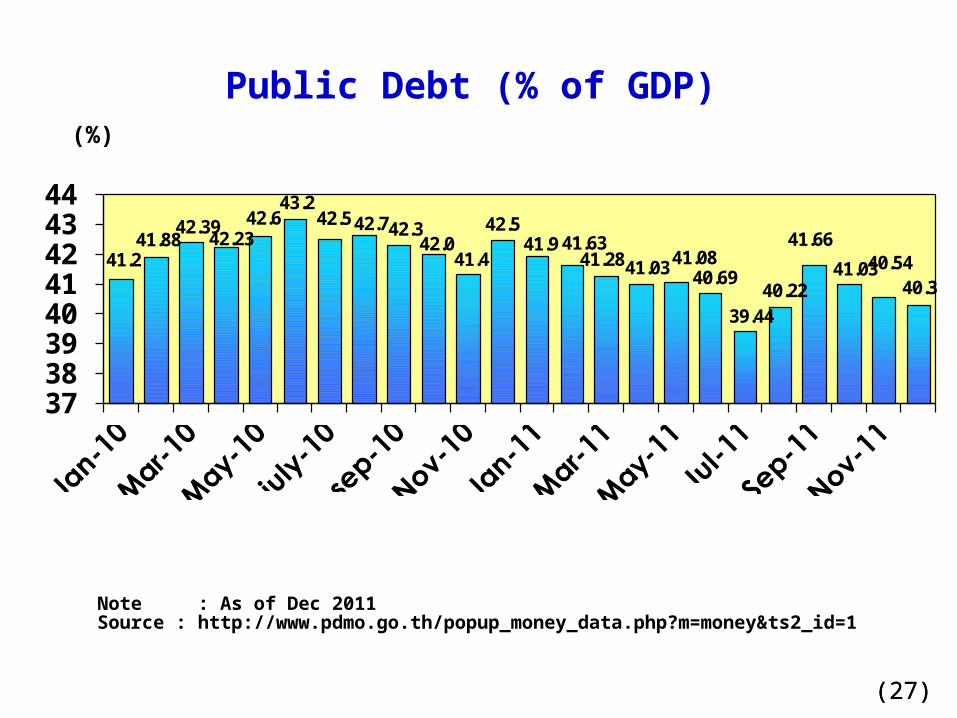
41.241.88
42.3942.23
42.643.2
42.542.742.342.0
41.4
42.541.941.63
41.2841.0341.0840.69
39.4440.22
41.66
41.0340.5440.3
3738394041424344
(%)
(27)
Note : As of Dec 2011 Source : http://www.pdmo.go.th/popup_money_data.php?m=money&ts2_id=1
Public Debt (% of GDP)
(28)
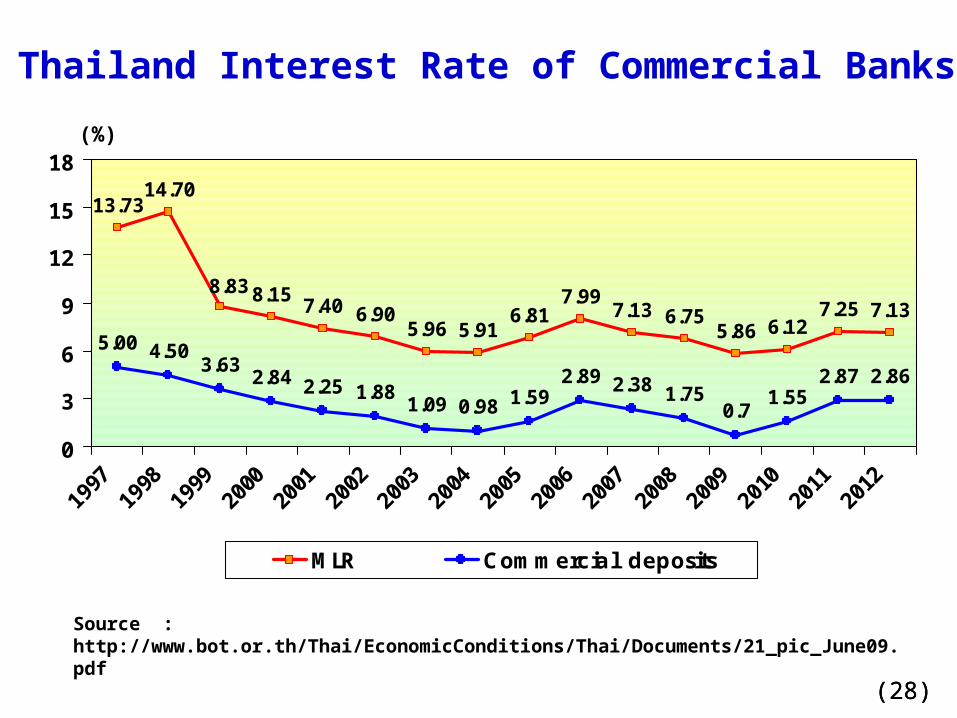
Thailand Interest Rate of Commercial Banks
13.7314.70
8.15 7.40 6.905.96 5.91
6.817.99
7.13 6.755.86 6.12
7.25 7.13
5.00 4.503.63
2.84 2.25 1.881.09 0.98 1.59
2.89 2.38 1.750.7
1.552.87 2.86
8.83
0
3
6
9
12
15
18
1997
1998
1999
2000
2001
2002
2003
2004
2005
2006
2007
2008
2009
2010
2011
2012
MLR Commercial deposits
Source : http://www.bot.or.th/Thai/EconomicConditions/Thai/Documents/21_pic_June09.pdf
(28)
(%)
(29)
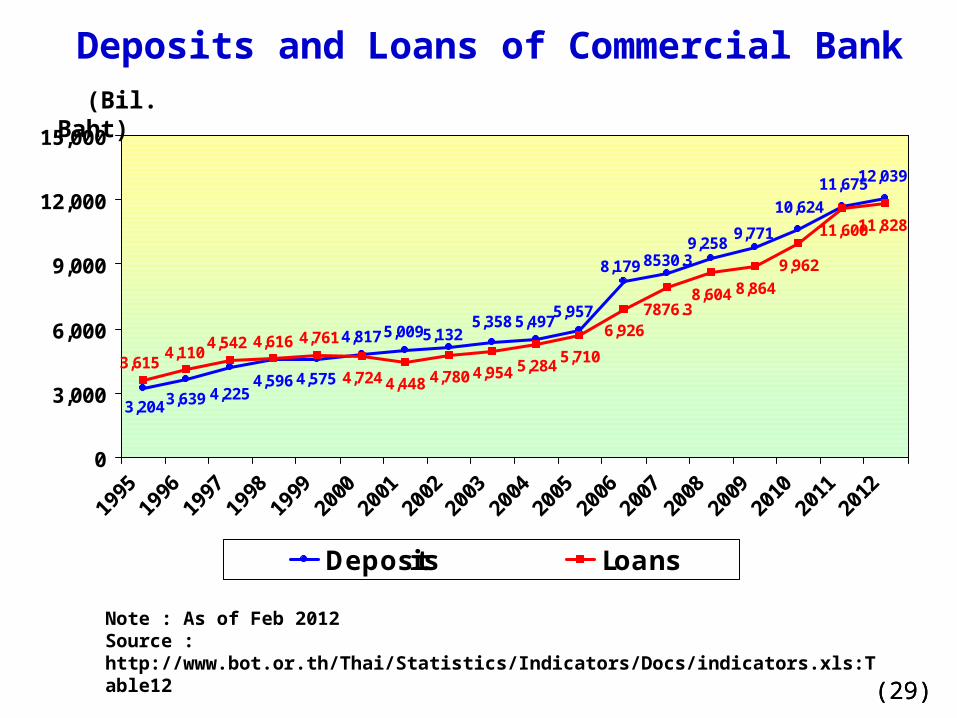
Deposits and Loans of Commercial Bank
10,62411,67512,039
4,780
8,6048,8649,962
11,60011,8289,771
4,2253,639
9,2588530.38,179
4,817
3,204
4,5964,575
5,1325,0095,3585,497
5,957 7876.3
4,4483,615
4,1104,542 4,616 4,761
4,724 4,9545,2845,710
6,926
0
3,000
6,000
9,000
12,000
15,000
1995
1996
1997
1998
1999
2000
2001
2002
2003
2004
2005
2006
2007
2008
2009
2010
2011
2012
Deposits Loans
(Bil. Baht)
Note : As of Feb 2012Source : http://www.bot.or.th/Thai/Statistics/Indicators/Docs/indicators.xls:Table12 (29)
(30)
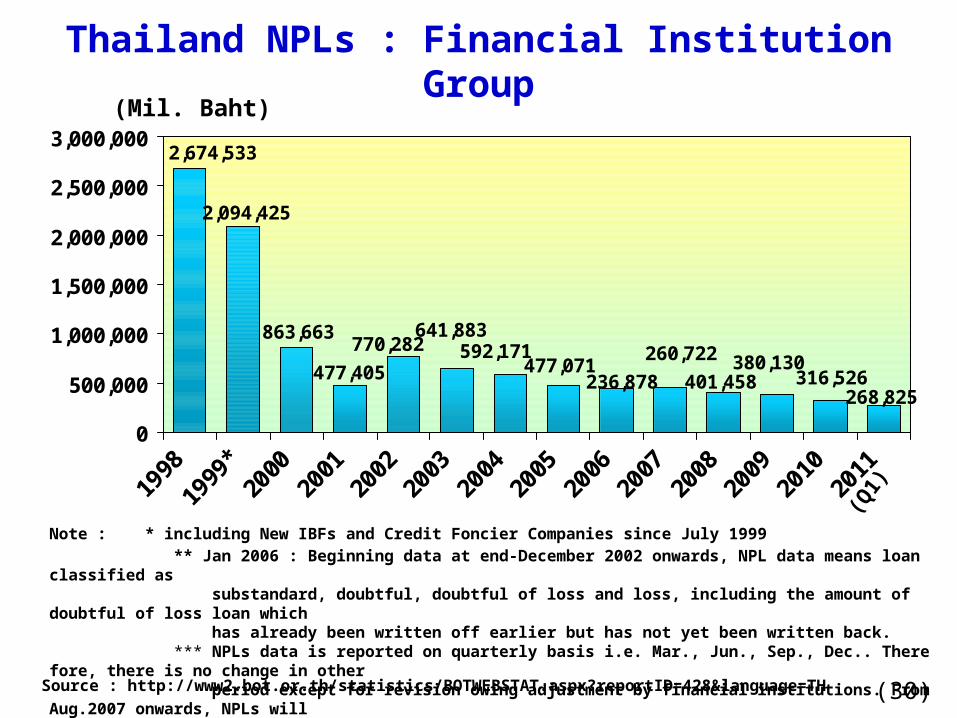
Thailand NPLs : Financial Institution Group
316,526268,825
380,130401,458
477,071592,171
641,883770,282
477,405
863,663
2,094,425
2,674,533
236,878
260,722
0
500,000
1,000,000
1,500,000
2,000,000
2,500,000
3,000,000
1998
1999
*20
0020
0120
0220
0320
0420
0520
0620
0720
0820
0920
1020
11
Note : * including New IBFs and Credit Foncier Companies since July 1999 ** Jan 2006 : Beginning data at end-December 2002 onwards, NPL data means loan classified as substandard, doubtful, doubtful of loss and loss, including the amount of doubtful of loss loan which has already been written off earlier but has not yet been written back. *** NPLs data is reported on quarterly basis i.e. Mar., Jun., Sep., Dec.. Therefore, there is
no change in other period except for revision owing adjustment by financial institutions. From Aug.2007 onwa
rds, NPLs will be reported at month ending q
Source : http://www2.bot.or.th/statistics/BOTWEBSTAT.aspx?reportID=428&language=TH
(Mil. Baht)
(Q1)
(31)
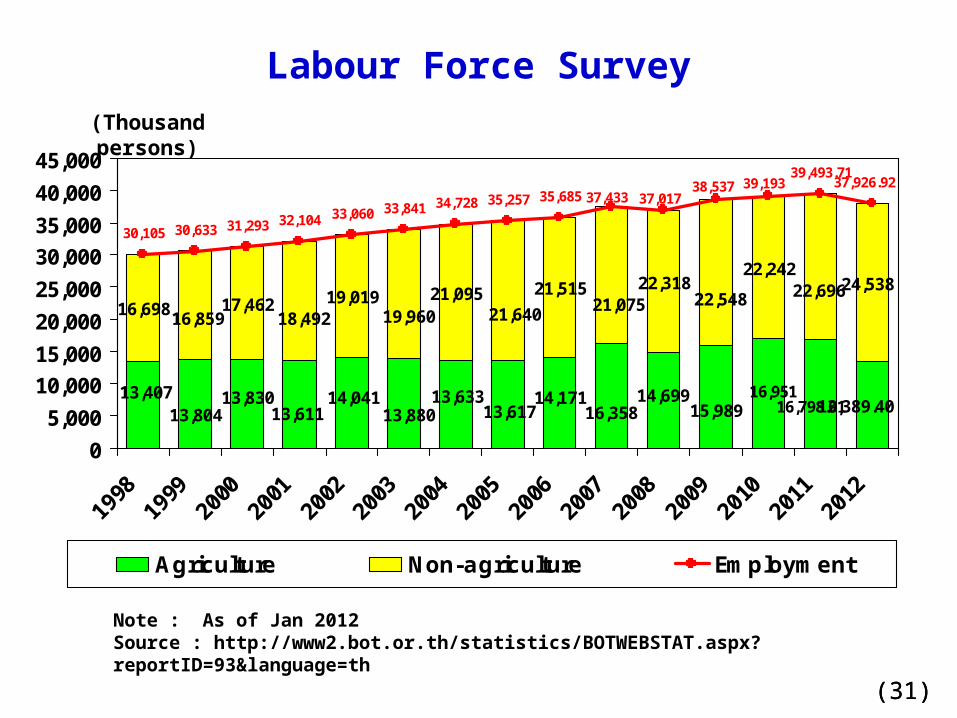
Labour Force Survey
13,389.40
16,698 17,462 19,019 21,09522,318
22,24224,538
15,98914,699
13,61713,63314,041
13,61113,830
13,80413,407 16,951
16,798.0116,35814,171
13,880
22,69622,54821,64018,49216,859
21,07521,515
19,960
34,728 35,257
39,493.7137,926.9239,19338,537
37,01737,43335,68533,84133,06032,10431,29330,63330,105
0
5,000
10,00015,000
20,000
25,000
30,00035,000
40,000
45,000
1998
1999
2000
2001
2002
2003
2004
2005
2006
2007
2008
2009
2010
2011
2012
Agriculture Non-agriculture Employment
(Thousand persons)
Note : As of Jan 2012Source : http://www2.bot.or.th/statistics/BOTWEBSTAT.aspx?reportID=93&language=th
(31)
(32)
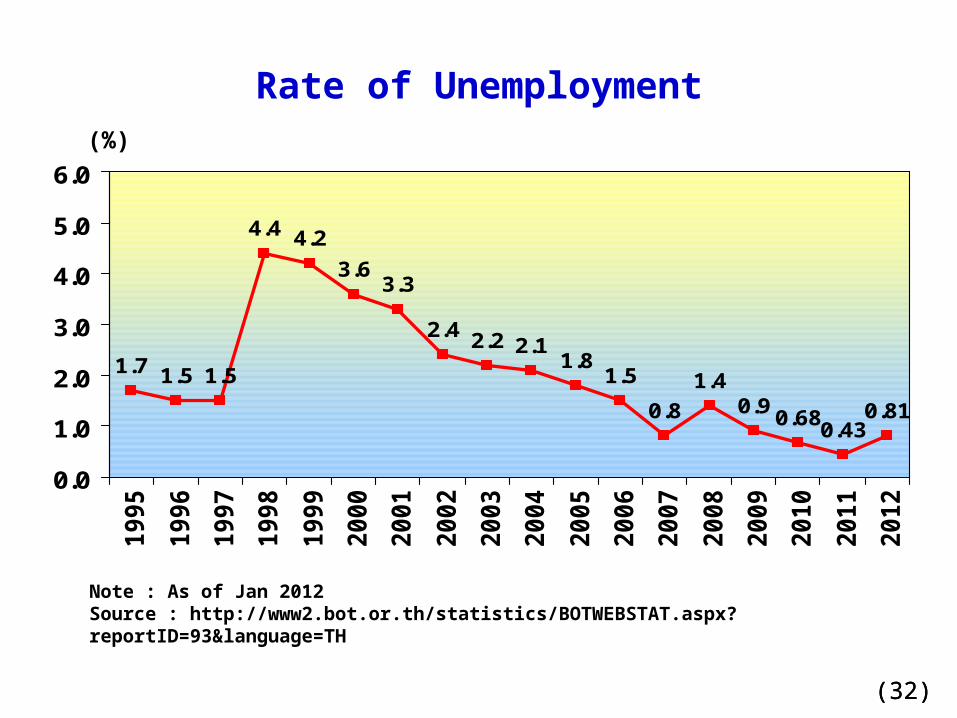
Rate of Unemployment
1.7 1.5 1.5
2.4 2.2 2.11.8
1.40.90.680.43
0.810.8
1.5
3.33.6
4.24.4
0.0
1.0
2.0
3.0
4.0
5.0
6.0
1995
1996
1997
1998
1999
2000
2001
2002
2003
2004
2005
2006
2007
2008
2009
2010
2011
2012
(%)
Note : As of Jan 2012Source : http://www2.bot.or.th/statistics/BOTWEBSTAT.aspx?reportID=93&language=TH
(32)