Embed Size (px)
Citation preview
Random matrix theory analysis of cross-correlation in the Nigerian Stock Exchange
C. P. Nnanwa1*, T. C. Urama, P. O. Ezepue
Statistics Information Modelling and Financial Mathematics Research Group
Materials and Engineering Research Institute, Sheffield Hallam University, S1 1WB UK.
Email: [email protected], [email protected],
Abstract
In this paper we use Random Matrix Theory (RMT) to analyse the eigenstructure of the
empirical correlations of 82 stocks which are consistently traded in the Nigerian Stock
Exchange (NSE) over a 4-year study period 3 August 2009 to 26 August 2013. We apply the
Marcenko-Pastur distribution of eigenvalues of a purely random matrix to investigate the
presence of investment-pertinent information contained in the empirical correlation matrix of
the selected stocks. We use hypothesised standard normal distribution of eigenvector
components from RMT to assess deviations of the empirical eigenvectors to this distribution
for different eigenvalues. We also use the Inverse Participation Ratio to measure the
deviation of eigenvectors of the empirical correlation matrix from RMT results. These
preliminary results on the dynamics of asset price correlations in the NSE are important for
improving risk-return trade-offs associated with Markowitz’s portfolio optimization in the
stock exchange, which we achieve by cleaning up the correlation matrix. We propose to
measure extent of closeness or otherwise in selected sectors of the NSE and the Johannesburg
Stock Exchange (JSE) in our future work.
Key terms: Random matrix theory; Correlation matrix; Inverse participation ratio;
Eigenvalue and eigenvector; Portfolio optimization.
1. Introduction
Estimation of risk and expected returns based on the standard deviation and expected value of
returns was the main work of Markowitz's model in (1952). Since then, researchers have been
working to improve the model and develop other models to manage and optimize portfolios.
Random matrix theory (RMT) which was first proposed and introduced by (Wigner 1951) to
explain statistical fluctuations of neutron resonances in the compound nucleus, became a
popular technical tool for investigating the dynamics of financial markets using cross-
correlations of selected financial data in the markets. (Wigner 1955) describes the general
properties of the energy levels of highly excited states of heavy nuclei as measured in nuclear
reactions, (Izenman 2008). He assumes that the interactions between the constituents of the
nucleus are so complex that they should be modelled as random fluctuations. He represents it
by Hermitian operator H (called Hamiltonian), which behaves like a large random matrix.
The energy level of the system was approximated by the eigenvalues of this matrix, and the
1 Permanent address: Department of Mathematics, Nnamdi Azikiwe University, Awka
Nigeria * Corresponding author

spacing between the energy levels of the nuclei could be modelled by the spacing of the
eigenvalues of the matrix.
Analogically, the complex interrelationships and correlations among different assets in a
globalised financial market, with open access to assets and information across markets, can
be modelled against a baseline of random correlation matrix behaviour which represents
complete unpredictability of a market. Hence, investors will be able to construct more
optimal portfolios if they can locate within the correlation structure of a large number of
assets those features that identify significant or pertinent information, compared to a null
hypothesis purely random correlation matrix. While these lines of RMT work have been
attempted in many markets (see examples below), there are no studies known to the authors
which use such techniques in exploring the dynamics of correlation matrices among stocks
from the Nigerian Stock Exchange. This paper presents related preliminary results.
Researchers like (Dyson 1962), (Dyson and Mehta 1963) and (Mehta 1991) work on
RMT, which is a vestige of techniques used in mathematical physics, (Mehta 2004). (Laloux
et al. 1999) and (Plerou et al. 1999) introduce RMT in financial markets where it is used in
studying the statistical properties of cross-correlations of financial variables in the markets.
(Sharifi et al. 2003) apply RMT to an empirically measured financial correlation matrix and
show that the matrix contains a large amount of noise. They also attempt to separate the noisy
part from the non-noisy part of the matrix, a process that is fondly referred to as cleaning the
correction matrix (Alaoui, 2015).
(Rak et al. 2007, 2008) apply RMT in the Warsaw stock market, by using the correlation
matrix approach to study the temporal evolution of the Warsaw Stock Market as represented
by the WIG20 index in 2006. Their 2007 paper investigates the inter-stock correlation for the
largest companies listed on Warsaw Stock Exchange and WIG20 index. Their results infer
that Warsaw Stock Market can be well described by a one factor model. A useful insight
from this focus on large stocks is that RMT can be used to systematically characterise a stock
market by a) using as many stocks as possible to model inter-stock correlations at an overall
market level, and b) performing similar analyses for distinct sectors of the market, for
example banking and financial services, agriculture, conglomerates, consumer goods, ICT,
healthcare, industrial goods, oil and gas. This paper addresses the overall market perspective
and informs subsequent work on sector-based systematic stock market characterisation and
development (Ezepue and Omar, 2012).
A related insight is the need to run comparative RMT-based characterisation analyses
across different epochs likely to correspond with policy in economic policy, structural
macroeconomic and market structure environments in a financial system. Examples of these
epochal events are the 2004 bank reforms in Nigeria, the 2007-09 global financial crisis and
the recent UK Brexit by which UK will leave the European Union.
For an overview of RMT applications in different contexts, (Wilcox and Gebbie 2007)
construct correlation matrix from 10 years daily data obtained from the Johannesburg Stock
Exchange, and apply RMT to compare correlation matrix estimator obtained from the market
with similar-sized random matrix. (Kulkarni and Deo 2007) and (Pan and Sinha 2007) work
on the Indian stock market, while (Curkur et al. 2007) analyse the Istanbul stock market.
(Wang et al. 2013) examine the statistical properties of cross-correlations in the US market
and note that the detrended cross-correlation analysis (DCCA) coefficient method has similar
2

results and properties with Pearson's correlation coefficient (PCC). (El Alaoui 2015) study
cross-correlations among stocks of Casablanca Stock Exchange using RMT. They tried to
observe if the difference between predicted risk and realized risk will be reduced by cleaning
the noisy element of the correlation matrix.
In this paper, we use the methods of (El Alaoui 2015) to perform the overall market
characterisation analysis foreshadowed above. We also analyse the eigenvectors through their
distributions and computation of the inverse participation ratio, a statistical measure of the
inherent dynamics of the stock market linked to the cross-correlations of stock returns; see
further notes below. We also explain how the information from RMT eigenstructure analysis
that could be used to clean the correlation matrix of Nigerian Stock Exchange in order to
reduce the gap between predicted risk and realized risks reflected in Markowitz’s mean-
variance Efficient Frontiers.
The rest of the paper is organised as follows. In section 2, we describe the empirical data
used. Section 3 presents the methodologies and theoretical background on Random Matrix
Theory. Section 4 shows and discusses the main empirical results and Section 5 concludes
the paper.
2. Data
The Nigerian stock Exchange (NSE) has 188 stocks listed under eleven (11) sectors, namely:
Agriculture with 5 stocks, Conglomerates with 6 stocks, Construction/Real estate with 9
stocks, Consumer goods with 28 stocks, Financial services with 57 stocks, ICT with 9 stocks,
Health care with 11, Industrial goods with 21, Natural resources, Oil and Gas, and Services
with 5, 14 and 23 stocks, respectively.
The data set used is the daily closing price of 4 years stock data listed in the NSE. We
have 1019 daily closing prices running from 3rd
August 2009 to 26th
August 2013, excluding
weekends and public holidays in Nigeria (Nationwide). These stock price data were
converted into 1018 logarithmic returns. These data were screened to remove stocks that were
delisted, infrequently traded or not traded at all during the study period. This reduced the data
to 82 securities only.
Let 𝑃𝑖(𝑡) be the closing price of the index on day (𝑡) of stock 𝑖 and define the natural
logarithmic returns of the index (i.e. the log-difference of 𝑃𝑖(𝑡 + 1) 𝑎𝑛𝑑 𝑃𝑖(𝑡)) as
𝑟𝑖(𝑡) = ln 𝑃𝑖(𝑡 + 1) − ln 𝑃𝑖(𝑡) (1)
where 𝑟𝑖(𝑡) has 1018 observation.
Before establishing the portfolio selection process, we compute the mean return and standard
deviation of each stock 𝑖.
3. Theoretical background and methodology
We first calculate the price change of the stocks 𝑖 = 1, . . . , 𝑁, over a time scale 𝛥𝑡 (otherwise
known as returns) in order to quantify correlations, see (Plerou et al 2001) and (Sharifi et al.
2004). Denote the price of thi asset at time 𝑡 as 𝑆𝑖(𝑡), and define its price change as

𝐺𝑖(𝑡) = ln 𝑆𝑖(𝑡 + ∆𝑡) − ln 𝑆𝑖 (𝑡)
Since there is variation in the levels of volatility (standard deviation) of different stocks, we
use returns that are normalized with respect to standard deviations 𝜎𝑖 as follows:
𝑔𝑖(𝑡) =𝐺𝑖(𝑡)− ⟨𝐺𝑖⟩
𝜎𝑖 (2)
where 𝜎𝑖 = √⟨𝐺𝑖2⟩ − ⟨𝐺𝑖⟩2 is the standard deviation of 𝐺𝑖 for the assets 𝑖 = 1, . . . , 𝑁 and ⟨. . . ⟩
is denoted as the time average of 𝐺𝑖 over the period studied which can be computed as
follows, ⟨𝐺𝑖⟩ =1
𝐿 ∑ 𝐺𝑖
𝐿−1𝑙=0 .
In this paper, our 𝑁 = 82 and 𝐿 = 1018, where 𝑁 and 𝐿 correspond respectively to the
numbers of the stocks listed in NSE and the days studied. Although NSE has about 188
stocks listed, so many stocks were not consistently traded over the study period. Hence, we
choose 82 stocks that were consistent in the market during the period studied. We then
compute the equal-time cross-correlation matrix 𝐶 with elements:
𝐶𝑖𝑗 ≡ ⟨𝑔𝑖(𝑡), 𝑔𝑗(𝑡)⟩ (3)
Being correlation coefficients, the elements of 𝐶𝑖𝑗 are restricted to domain −1 ≤ 𝐶𝑖𝑗 ≤ 1
during construction of the 𝐶𝑖𝑗 , where 𝐶𝑖𝑗 = 1 corresponds to perfect positive correlation,
𝐶𝑖𝑗 = 0 corresponds to uncorrelated pairs of stocks and 𝐶𝑖𝑗 = −1 corresponds to perfect
negative correlation.
(Plerou et al. 2001, 2000) and (El Alaoui 2015) note that two main difficulties arise in the
analysis of the correlations between any two stocks or more generally, the correlation
structure of a portfolio of assets in a financial market. Firstly, market conditions change with
time. Hence, the correlation 𝐶𝑖𝑗 between any two pairs 𝑖, 𝑗 of the stocks may not be stationary.
Secondly, time averaging over a finite time series introduces ‘measurement noise’. These
facts have implications for portfolio selection and optimisation, given the centrality of cross-
correlations among assets to Markowitz portfolio optimization. Recall that the basic tenets of
Markowitz’s theory of optimal portfolios are a) to determine the optimal weights of assets
with given average returns and risks which maximizes the overall returns for a fixed level of
risk, or b) minimises the risk for a given level of overall return. For this purpose, if }{ iR are
expected returns of the portfolio assets, }{ ip are the relative amounts of capital invested in the
assets, and C = )( ijC is the matrix of covariances of asset returns, then Markowitz’s
optimization uses Langrangian multiplier approach to minimize the overall portfolio variance
N
ji ijjiP Cpp1,
2 for a given value of overall return .1
N
i iiP Rpr The results of this
scheme are summarised graphically in mean-variance Efficient Frontiers which shows the
range of optimal risk-return combinations possible.
The point, therefore, of Random Matrix Theory (RMT) is to compare the structure of the
empirical cross-correlations (in effect covariances) among portfolio assets with the behaviour

of a purely random matrix in which the assets are independent. For this, both eigenstructure
and time dependence (or stability) of the matrix C are of interest, and constitute what is
known in RMT as dynamics of the correlation matrix. The following notes summarise what is
known about these dynamics. For a portfolio of N assets, the matrix C has N(N-1)/2 entries to
be determined from N time series of length L (for example N = 82 and L = 1018 in this
paper). If L is not very large relative to N, we are basically estimating too many model
parameters from sparse information, which introduces the above-mentioned ‘measurement
noise’ in empirical correlation matrices. This makes the use of such matrices in applications
less accurate in portfolio optimization than alternative matrices filtered for pertinent
information using key results of RMT summarised below. Indeed, in RMT this information is
gleaned from the behaviour of eigenvalues and eigenvectors of C, compared to a ‘null
hypothesis’ purely random matrix such as represented by a finite time series of strictly
independent and uncorrelated assets.
In matrix notation, the correlation matrix based on equation (2) above can be expressed as
𝐶 =1
𝐿 𝐺𝐺𝑇 (4)
where 𝐺 is an 𝑁 × 𝐿 matrix with elements {𝑔𝑖𝑚 ≡ 𝑔𝑖(𝑚∆𝑡): 𝑖 = 1, . . . , 𝑁; 𝑚 = 0, . . . , 𝐿 − 1},
and 𝐺𝑇is the transpose of 𝐺. The RMT method used here is to compare the empirical cross-
correlation matrix 𝐶 against the null hypothesis of a random matrix of the same type. Hence
we consider a random correlation matrix
𝑅 =1
𝐿 𝐴𝐴𝑇 (5)
where 𝐴 is an 𝑁 × 𝐿 matrix containing 𝑁 time series of 𝐿 random element 𝑎𝑖𝑚 , with zero
mean and unit variance that are mutually uncorrelated. (Muirhead 1982) refers to 𝑅 as
Wishart matrices. Deviations from the random matrix results determine the location of
pertinent information among set financial assets. By diagonalizing matrix C, we obtain
𝐶𝑢𝑘 = 𝜆𝑘𝑢𝑘 (6)
where 𝜆𝑘are the eigenvalues and 𝑢𝑘 the eigenvectors, and 𝑘 = 1, . . . , 𝑁 is arranged in order of
increasing eigenvalues. Statistical properties of random matrices such as 𝑅 are known; see
(Dyson 1971) and (Sengupta & Mitra 1999). In particular, in the limit 𝑁 → ∞, 𝐿 → ∞ such
that 𝑄 ≡𝐿
𝑁 (> 1) is fixed, (Sengupta & Mitra 1999) show analytically that the probability
density function 𝑃𝑟𝑚(𝜆) of eigenvalues 𝜆 of the random correlation matrix 𝑅 is given by
𝑃𝑟𝑚(𝜆) =𝑄
2𝜋𝜎2 √(𝜆+−𝜆)(𝜆−𝜆−)
𝜆 (7)
for 𝜆 within the bounds 𝜆− ≤ 𝜆𝑖− ≤ 𝜆+, where 𝜆− and 𝜆+are the minimum and maximum
eigenvalues of 𝑅, respectively, given by
𝜆± = 𝜎2 (1 +1
𝑄 ± 2√
1
𝑄) (8)

where 𝜎2 is equal to the variance of the elements 𝑅 , Sengupta & Mitra (1999). The
eigenvalues of 𝑅 falls within the interval [𝜆−, 𝜆+] as predicted by Random matrix theory,
Rosenow et al. (2003). 𝜎2 is equal to unity in the case of a normalised matrix 𝐴. Also, the
maximum and minimum (theoretical) eigenvalues determine the (theoretical) bounds of the
eigenvalues distribution and if some eigenvalues of the matrix C are beyond these bounds,
they are said to deviate from the random bound which suggests that they contain pertinent
investment information. Being able to detect assets with such real information as opposed to
random market noise will enable investors to include them in portfolio constructions for more
optimal risk control.
It is also known that the first three eigenvalues represent the overall market information
based on the random behaviour of investment returns (random walk hypothesis), which the
random matrix represents. Hence, deviations between realised values of the first three
eigenvalues (especially the first one) and the predicted maximum eigenvalue indicate the
extent to which a stock market is consistent with the RMT assumptions.
In line with the assumption of pure randomness and independence, the distribution of the
components {𝒖𝒌(𝑙)|𝑙 = 1, 2, . . . , 𝑁} of an eigenvector 𝒖𝒌 of a random correlation
matrix 𝑅 should obey the standard normal distribution with zero mean and unit variance
given by
𝑃𝑅(𝑢) = 1
√2𝜋 𝑒𝑥𝑝 (−
𝑢2
2) (9)
Inverse Participation Ratio (IPR)
The Inverse participation ratio IPR is used to analyse the structure of the eigenvectors whose
eigenvalues are lying outside the noisy band of RMT predicted eigenvalues (Plerou et al 1999,
2000). It measures the number of components that participate significantly in each
eigenvector (Gurh et al. 1998). It also indicates the degree to which the distribution of
eigenvectors of the empirical correlation matrix deviate from RMT results, particularly
distinguishing an eigenvector with roughly equal components and another with a small
number of large components.
Let 𝑢𝑙𝑘 denote the
thl component of the eigenvector 𝑢𝑘 . The IPR is defined as
𝐼𝑘 = ∑ (𝑢𝑙𝑘)
4𝑁𝑙=1 , 82,...,2,1l (10)
where N = 82 is the number of assets.
The IPR can be seen as the reciprocal of the number of eigenvector components
significantly different from zero (El Alaoui, 2015). This can be illustrated by two limiting
cases: (i) if the components of the eigenvector are identical 𝑢1𝑘 ≡ 1/ N has 𝐼𝑘 = 1/𝑁, and
(ii) a vector with one component 𝑢𝑖𝑘 ≡ 1 and the remainder zero has 𝐼𝑘 = 1. Practically,
inverting an observed IPR estimates the number of active elements in the time series of a
financial asset, that is, the number of eigenvector components that contribute more than
random noise to the portfolio risk-return characteristics.

4. The Analysis of the empirical results
Eigenvalue analysis
We analysed N = 82 stocks from NSE which a total of L = 1019 daily closing prices. We
found out that the theoretical eigenvalue bounds of the correlation matrix (from RMT
predicted), are 𝜆+ = 1.6484 𝑎𝑛𝑑 𝜆− = 0.5128 as maximum and minimum eigenvalues
respectively. The value of our 𝑄 is 𝐿/𝑁 = 12.4146. Also, from the results, it is observed that
the largest eigenvalue 1 = 4.87 which is 2.95 (approximately 3) times larger than the
predicted RMT value above. The corresponding eigenvector is the ‘market’ itself which has
approximately equal components on all the 82 stocks. The pure noise RMT hypothesis may
therefore not be consistent with the NSE stocks.
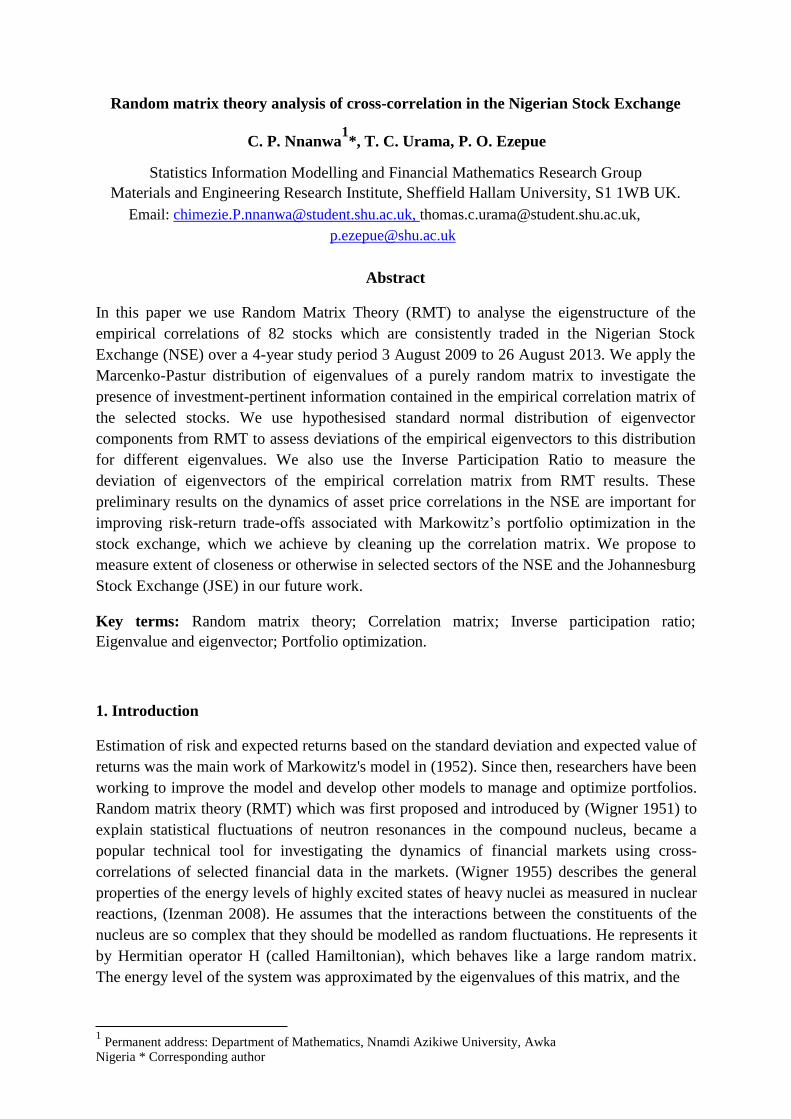
Also 6 out of our eigenvalues deviated from the above RMT eigenvalue spectrum, which
accounts for 10.98% of the total eigenvalues (see fig.1a and 1b.). Therefore, this suggests the
presence of true information about the stock market in about 11% of the selected stocks and
purely random information in the remaining 89% associated with the purely random matrix,
(Laloux et al. 1999) and (Plerou et al. 1999).
Distribution of eigenvectors component analysis
Using Figures Fig 2a, Fig 2b, Fig 2c, Fig 2d and Fig 2e below we analyse the distribution of
the eigenvectors by comparing the distribution of the eigenvector components that are inside
the bound of the RMT prediction (i.e. [𝜆−, 𝜆+]) with those outside the bound. The normal
distribution of the eigenvectors 𝑢1 of the first eigenvalue (which represents the market on the
selected stocks) is clearly right-tail asymmetric with a positive mean. The data are also non-
normal and therefore inconsistent with RMT predictions.
Fig 1a: Empirical distr. of eigenvalues
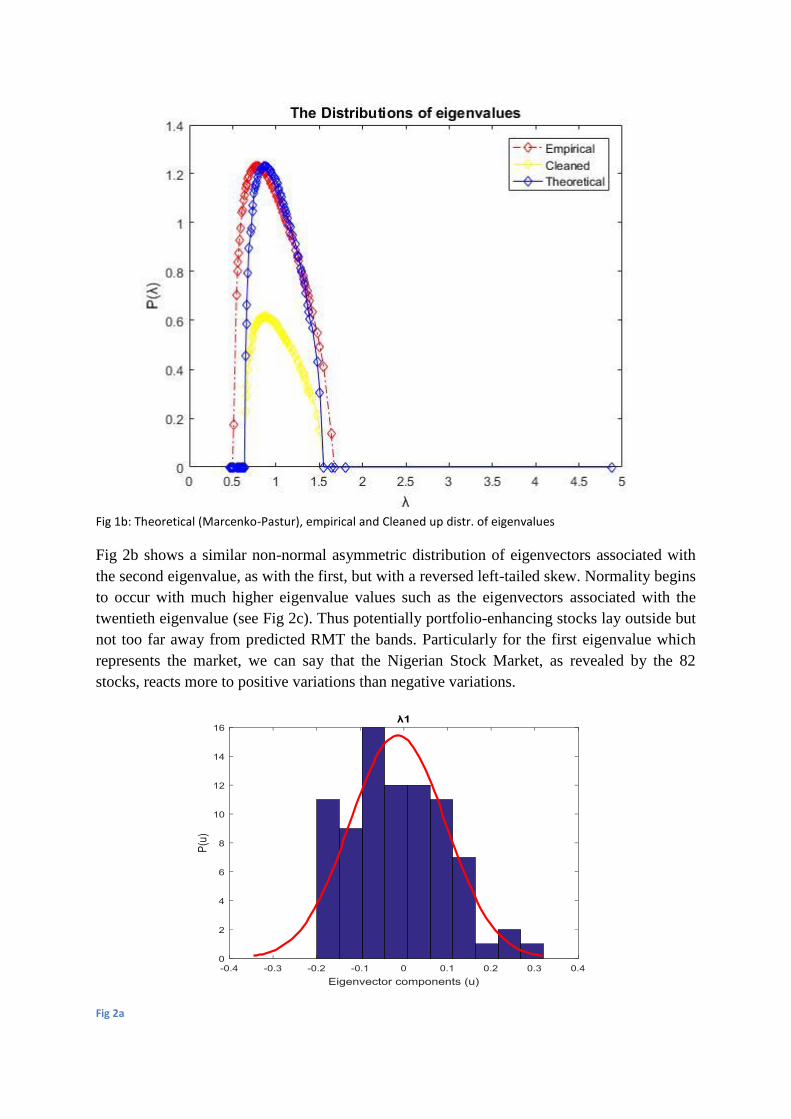
Fig 1b: Theoretical (Marcenko-Pastur), empirical and Cleaned up distr. of eigenvalues
Fig 2b shows a similar non-normal asymmetric distribution of eigenvectors associated with
the second eigenvalue, as with the first, but with a reversed left-tailed skew. Normality begins
to occur with much higher eigenvalue values such as the eigenvectors associated with the
twentieth eigenvalue (see Fig 2c). Thus potentially portfolio-enhancing stocks lay outside but
not too far away from predicted RMT the bands. Particularly for the first eigenvalue which
represents the market, we can say that the Nigerian Stock Market, as revealed by the 82
stocks, reacts more to positive variations than negative variations.
Fig 2a

Fig 2b
Fig 2c
Fig 2d

Fig 2e
Inverse participation ratio Analysis
The theoretical mean IPR is approximately equal to 3/N = 3/82 = 0.0366. A look at Fig. 3
shows that the IPR values are close to a mean level of noise (0.04) indicating that a few
stocks do not dominate the dynamics and most stocks participate in the correlation dynamics
of asset returns. However, the deviations in IPR values are strong for a few initial elements
(17 times more for the highest score 0.17 compared with the lowest non-zero score of about
0.01 between elements 1-6). Overall, there does not appear to be a localisation effect in the
spread of IPR values, with very large values for a few elements and very small values for the
rest (Alaoui, 2015). It would be interesting to compare this overall market behaviour against
sectorial results as mentioned in the introduction to this paper.
Fig 3: Inverse participation ratio and their rank
00.020.040.060.08
0.10.120.140.160.18
1 4 7 10131619222528313437404346495255586164677073767982
IPR and their ranks

Cleaning empirical correlation matrices and stock market characterisation
We noted earlier in the introduction to this paper that estimating empirical correlation
matrices introduces measure noise because of the large number of correlation parameters
required. Using such matrices further in portfolio optimisation as depicted by Markowitz’s
mean-variance Efficient Frontiers is therefore subject to inaccuracies in predicting portfolio
risks. We examine this in more detail when constructing suitable investment portfolios from
overall and sector-based RMT results. For this, we explain briefly how the process works.
The first step is to divide the observed series of stock prices and returns into two fairly equal
sub-periods. The first period analyses predicted risk and the second realised risk. The second
step filters RMT eigenvalues into noisy and non-noisy elements, with the latter situated
outside the RMT eigenvalue spectrum. These eigenvalues are maintained and those in RMT
bound ],[ are cleaned by replacing them with their average values while maintaining the
same matrix trace. The third step uses known methods to construct the cleaned correlation
matrix from the noisy elements (Alaoui, 2015; Laloux et al. 1999, 2000). After cleaning up
the correlation matrix, the return increases and the risk is reduced by 13.7% (see Fig 4 below).
Fig 4
Hints on future work
Stock characterisation using RMT theory will, as noted in the introduction, be used to
perform similar analyses as in this paper for different sectors of the Nigerian Stock Market
(NSM) and the results compared. Also, portfolio optimisation with cleaned empirical
correlation matrices and stocks and bonds selected within and across different market sectors
will reveal a menu of potential investment options for market participants. Hence, RMT
characterisation should be applied to returns from asset classes and trade-related indices
(bond yields, interest dividends, exchange rates, for example). These are potentially
interesting directions of future work which this paper engenders in the NSM. The same
techniques can also apply to other emerging African markets and combinations of assets
across markets.
We also feel that RMT characterisation has potential in measuring extent of closeness or
otherwise in selected sectors of these markets, for example the financial services sectors of
the NSM and the Johannesburg Stock Exchange (JSE). This benchmarking motive has
powerful implications for developing instruments in markets where they are not yet
operational (NSM for example) using information from those in which they are traded (the
JSE in this case). This line of work is currently in progress by the authors.
5. Conclusion
RMT enabled us to analyse in some detail the correlation structure of stock returns in the
Nigerian Stock Exchange. Marcenko-Pastur distribution predicted a theoretical eigenvalue
range of between 0.52 and 1.65 approximately. About 6 out of 82 eigenvalues of the selected
stocks were outside this eigenvalue spectrum, indicating that about 11% of the stocks have
important information that can be used in constructing portfolios with more stable returns and
risk characteristics, than a null hypothesis purely random market allows in the remaining 89%
cases.
The eigenvectors associated with the most important eigenvalues ( ), 21 are non-normal
and highly asymmetric which is inconsistent with RMT. This fact suggests the presence of
market signals such as depicted also in the information-carrying stocks. Given that the first
eigenvalue represents the market, it also suggests that the Nigerian Stock Market (NSM) is
inefficient, a fact that is consistent with known results in (Ezepue and Omar 2012), for
example. Importantly, this positive asymmetry in distribution of eigenvectors of 1 shows
that the NSM reacts more strongly to positive variations (and news) than negative variations.
Whilst the RMT bounds imply that the majority of stocks analysed (89%) will suitably
follow a zero-mean normal distribution in their returns, the normal distribution is not a good
enough fit for the materially informative stocks outside the RMT eigenvalue bounds. Finally,
the inverse participation ratio gives additional insights about the spread or localisation of
eigenvectors by their ranks. It shows a fairly even spread which suggest that there are no
dominant stocks in among the 82 stocks.
These insights are useful for constructing more optimal portfolios. For example, RMT
eigenstructure results are used to clean the empirical correlation matrices and thereby
improve the realised and predicted risks associated with Markowitz mean-variance Efficient
Frontier. Also, detailed risk analysis of individual stock and portfolio returns outside RMT
bounds should use suitable non-normal distributions.
Future lines of work along these lines also include the development of financial
derivatives in the NSM using information on NSM-JSE market affinities which we
foreshadowed in this paper.
References
Bouchaud, J.-P. Potters, M. (2003). Theory of Financial Risk and Derivative Pricing: From
Statistical. Physics to Risk Management Cambridge University Press, Cambridge

Cao, G. Longbing, X. Cao, J. (2012). Multifractal detrended cross-correlations between the
Chinese exchange and stock market. Physica A, 391, pp. 4855–4866
Cao, G. Cao, J. Xu, L. He, L.-Y. (2014). Detrended cross-correlation analysis approach for
assessing asymmetric multifractal detrended cross-correlations and their application to the
Chinese financial market. Physica A, 393, pp. 460–469
Çukura, S. Eryiğita, M. Eryiğitb, R. (2007). Cross correlations in an emerging market
financial data. Physica A 376, pp 555 - 564.
Daly, J. Crane, M. Ruskin, H. (2008). Random matrix theory filters in portfolio
optimisation: A stability and risk assessment. Physica A, 387, pp. 4248–4260
Dyson, F. (1962). Statistical theory of the energy levels of complex systems I, II and III. J.
Math. Phys., 3 (1), pp. 140–175
Dyson, F. (1971). Distribution of eigenvalues for a class of real symmetric matrices. Rev.
Mexicana Fís, 20, pp. 231–237
Dyson, F. Mehta, M. L. (1963). Statistical theory of the energy levels of complex systems IV.
J. Math. Phys. Vol.4, no.5, 701-712;
El Alaoui, M. Benbachir, S. (2013). Multifractal detrended cross-correlation analysis in the
MENA area. Physica A, 392, pp. 5985–5993.
El Alaoui, M. (2015). Random matrix theory and portfolio optimization in Moroccan Stock
Exchange. Physica A, 433, 92-99.
Ezepue, P. O. Omar, M. A. T. (2012). Weak-form market efficiency of the Nigerian Stock
Market in the context of financial reforms and global financial crisis. Journal of African
Business, 13(2), pp. 209-220.
Fyodorov, Y.V. Mirlin, A.D. (1992). Analytical derivation of the scaling law for the inverse
participation ratio in quasi-one-dimensional disordered systems. Phys. Rev. Lett., 69, p. 1093
Fyodorov, Y.V. Mirlin, A.D. (1993). Level-to-level fluctuations of the inverse participation
ratio in finite 1D disordered systems. Phys. Rev. Lett., 71, p. 412
Fyodorov, Y.V. Mirlin, A.D. (1994). Statistical properties of eigenfunctions of random quasi
1D one-particle Hamiltonians. Internat. J. Modern Phys. B, 8, p. 3795
Guhr, T. Müller-Groeling, A. Weidenmüller, H. (1998). Random matrix theory in quantum
physics. Phys. Rep., 299, pp. 198–425
He, L.-Y. Chen, S.-P. (2011). A new approach to quantify power-law cross-correlation and its
application to commodity markets. Physica A, 390, pp. 3806–3814

He, L.-Y. Chen, S.-P. (2011). Nonlinear bivariate dependency of price–volume relationships
in agricultural commodity futures markets: A perspective from multifractal detrended cross-
correlation analysis. Physica A, 390, pp. 297–308
Izenman, A. J. Introduction to Random matrix theory.
http://astro.ocis.temple.edu/~alan/MMST/IntroRMT.PDF
Kulkarni, V. Deo, N. (2007). Correlation and volatility in an Indian stock market: A random
matrix approach. Eur. Phys. J. B 60: 101. doi:10.1140/epjb/e2007-00322-1
Laloux, L. Cizeau, P. Bouchaud, J.-P. Potters, M. (1999). Noise dressing of financial
correlation matrices. Phys. Rev. Lett., 83, pp. 1467–1470
Laloux, L. Cizeau, P. Potters, M. Bouchaud, J.-P. (2000). Random matrix theory and
financial correlations. Int. J. Theor. Appl. Finance, 3, pp. 1–6
Lee, P. Ramakrishnan, T. (1985). Disordered electronic systems. Rev. Modern Phys., 57, p.
287
Markowitz, H. (1952). Portfolio selection. J. Finance, 7, pp. 77–91
Mehta, M. L. (2004). Random Matrices. 3rd
Edition, Pure and applied mathematics
(Amsterdam), 142, Amsterdam, Netherlands: Elsevier/Academic Press.
Mehta, M. L. (1991) "Random Matrices." Spectral statistics in elastodynamics (1881).
Mirlin, A. Fyodorov, Y. (1993). The statistics of eigenvector components of random band
matrices: analytical results. J. Phys. A: Math. Gen., 26, p. 551
Mu, G.-H. Zhou, W.-X. Chen, W. Kertész, J. (2010). Long-term correlations and
multifractality in trading volumes for Chinese stocks. Physics Procedia, 3, pp. 1631–1640
Pafka, S. Kondor, I. (2003). Noisy covariance matrices and portfolio optimization II.
Physica A, 319, pp. 487–494
Pafka, S. Kondor, I. (2004). Estimated correlation matrices and portfolio optimization.
Physica A, 343, pp. 623–634
Pan, R.K. Sinha, S. (2007). Collective behaviour of stock price movements in an emerging
market. Phys. Rev. E 76, 046116
Plerou, V. Gopikrishnan, P. Rosenow, B. Amaral, L.A. Stanley, H.E. (1999). Universal and
non-universal properties of cross correlations in financial time series. Phys. Rev. Lett., 83, pp.
1471–1474.
Plerou, V. Gopikrishnan, P. Rosenow, B. Amaral, L.A. Stanley, H.E. (2000). A random
matrix theory approach to financial cross-correlations. Physica A, 287, 374-382.
Plerou, V. Gopikrishnan, P. Rosenow, B. Amaral, L.A. Stanley, H.E. (2001). Collective
behaviour of stock price movements: A random matrix theory approach. Physica A, 299, 175-
180.

Plerou, V. Gopikrishnan, P. Rosenow, B. Amaral, L.A. Guhr, T. Stanley, H.E. (2002).
Random matrix approach to cross correlations in financial data. Phys. Rev. E, 65, p. 066126
Podobnik, B. Stanley, H. (2008). Detrended cross-correlation analysis: A new method for
analyzing two nonstationary time series. Phys. Rev. Lett., 100, p. 084102
Podobnik, B. Horvatic, D. Petersen, A.M. Stanley, H.E. (2009). Cross-correlations between
volume change and price change. Proc. Natl. Acad. Sci. USA, 106, pp. 22079–22084
Rak, R. Drozdz, S. Kwapien, J. (2007). Nonextensive statistical features of the Polish stock
market fluctuations. Physica A 374, pp 315–324
Rak, R. Kwapie, J. Drozdz, S. Oswiecimka, P. (09/2008). Cross-correlations in Warsaw
Stock Exchange. Acta Physica Polonica A, Vol.114 (3), pp.561-568
Sengupta, A.M. Mitra, P.P. (1999). Distributions of singular values for some random
matrices. Phys. Rev. E, 60, pp. 3389–3392.
Sharifi, S. Crane, M. Shamaie, A. Ruskin, H. (2004). Random matrix theory for portfolio
optimisation: a stability approach. Physica A, 335, 629-643.
Wang, D.-H. Suo, Y.-Y. Yu, X.-W. Lei, M. (2013). Price-volume cross-correlation analysis
of CSI300 index futures. Physica A, 392, pp. 1172–1179
Wang, G.-J. Xie, C. He, L.-Y. Chen, S. (2014). Detrended minimum-variance hedge ratio: A
new method for hedge ratio at different time scales. Physica A, 405, pp. 70–79
Wang, G.-J. Xie, C. Chen, S. Yang, J.-J. Yang, M.-Y. (2013). Random matrix theory analysis
of cross-correlations in the US stock market: Evidence from Pearson’s correlation coefficient
and detrended cross-correlation coefficient. Physica A, 392, pp. 3715–3730
Wigner, E. (1951). On a class of analytic functions from the quantum theory of collisions.
Ann. of Math., 53, pp. 36–67
Wigner, E.P. (1955). Characteristic vectors of bordered matrices with infinite dimensions.
Ann. of Math., 62, pp. 548–564.
Wilcox D. Gebbie, T. (2007). An Analysis of cross-correlations in an emerging market.
Physica A, 375, pp584-598.
Zebende, G.F. (2011). DCCA cross-correlation coefficient: Quantifying level of cross-
correlation. Physica A, 390, p. 614
Zhou, W.-X. (2008). Multifractal detrended cross-correlation analysis for two nonstationary
signals. Phys. Rev. E, 77 (6), p. 066211


![Untitled-1 [] · GOLD PATCHES VESTIGE detox footpatches . Detox & Rejuvenation dietary . Plus Vestige Hoodia Plus Fitness + Diet VESTIGE slimming capsules Fitness + Diet VESTIGE protein](https://img.pdfslide.net/doc/110x75/5f4881605320ff26161a56ca/untitled-1-gold-patches-vestige-detox-footpatches-detox-rejuvenation.jpg)