Embed Size (px)
DESCRIPTION
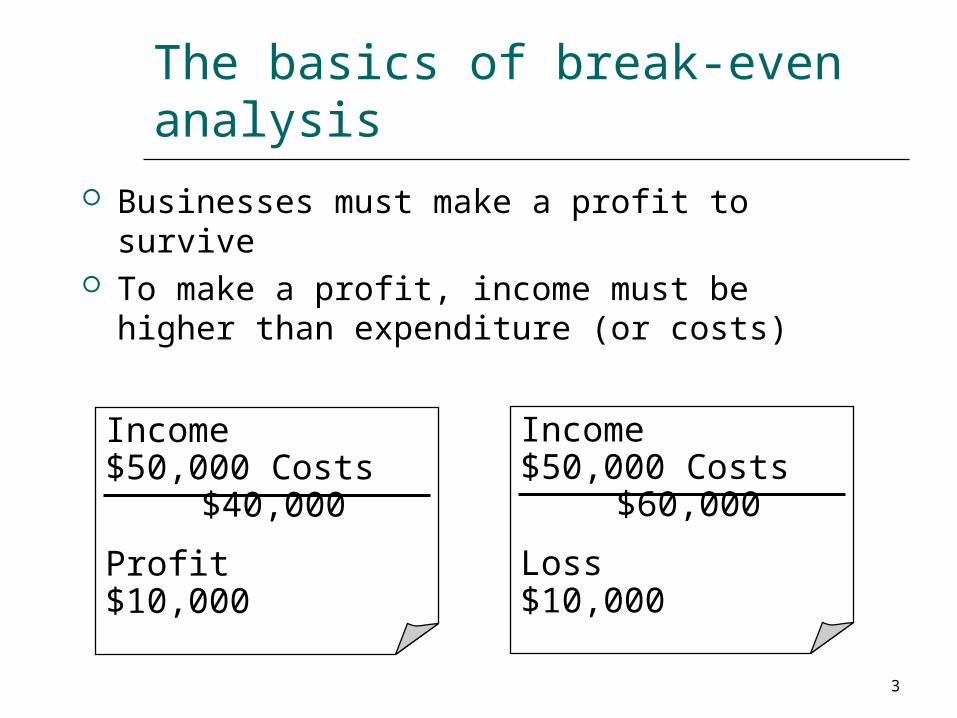
3 The basics of break-even analysis Businesses must make a profit to survive To make a profit, income must be higher than expenditure (or costs) Income$50,000 Costs $40,000 Profit $10,000 Income$50,000 Costs $60,000 Loss $10,000
Citation preview
1
Calculating a break-even point
• Calculate the break-even quantity, profit and margin of safety
• Use these methods to analyse the effects of changes in price or cost on break-even, profit and margin of safety HL
• Calculate the required output level for a given target revenue or profit HL
• Analyse the assumptions and limitations of break-even analysis HL
2
Keywords – recap last section
Fixed cost Variable cost Start up costs Running Costs Profit Total cost Semi-variable cost Unit Revenue
3
The basics of break-even analysis Businesses must make a profit to survive To make a profit, income must be higher
than expenditure (or costs)
Income $50,000 Costs $40,000
Profit $10,000
Income $50,000 Costs $60,000
Loss $10,000

4
The break-even point
Variable + fixed costs = total costs When total costs = sales revenue, this is
called the break-even point, eg total costs = $5,000 total sales revenue = $5,000
At this point the business isn’t making a profit or a loss – it is simply breaking even.
5
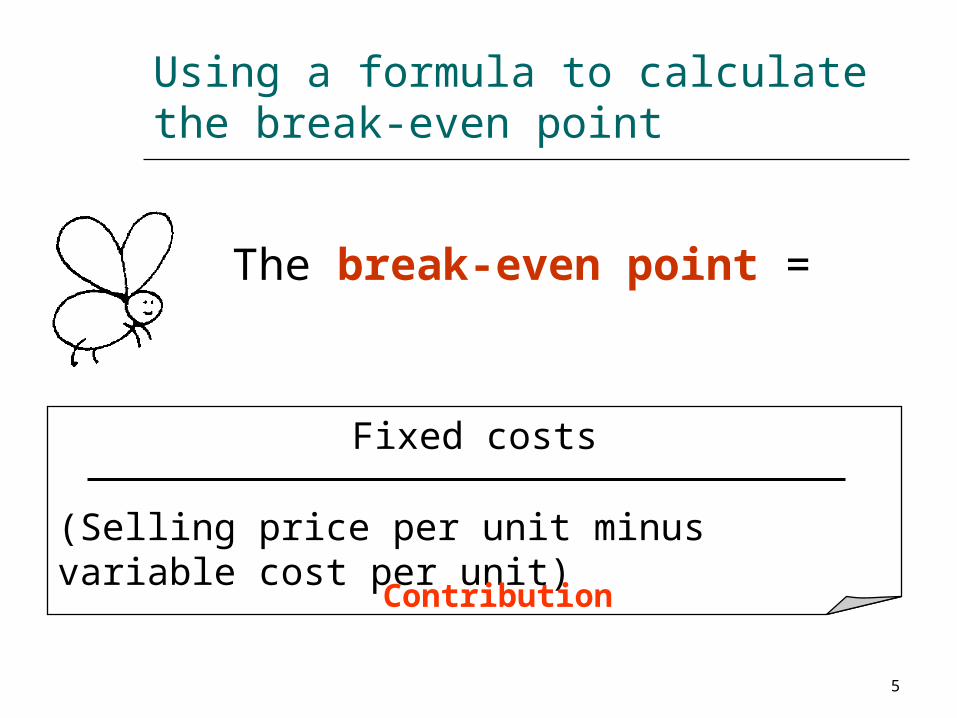
Using a formula to calculate the break-even point
The break-even point =
Fixed costs
(Selling price per unit minus variable cost per unit)
Contribution
6
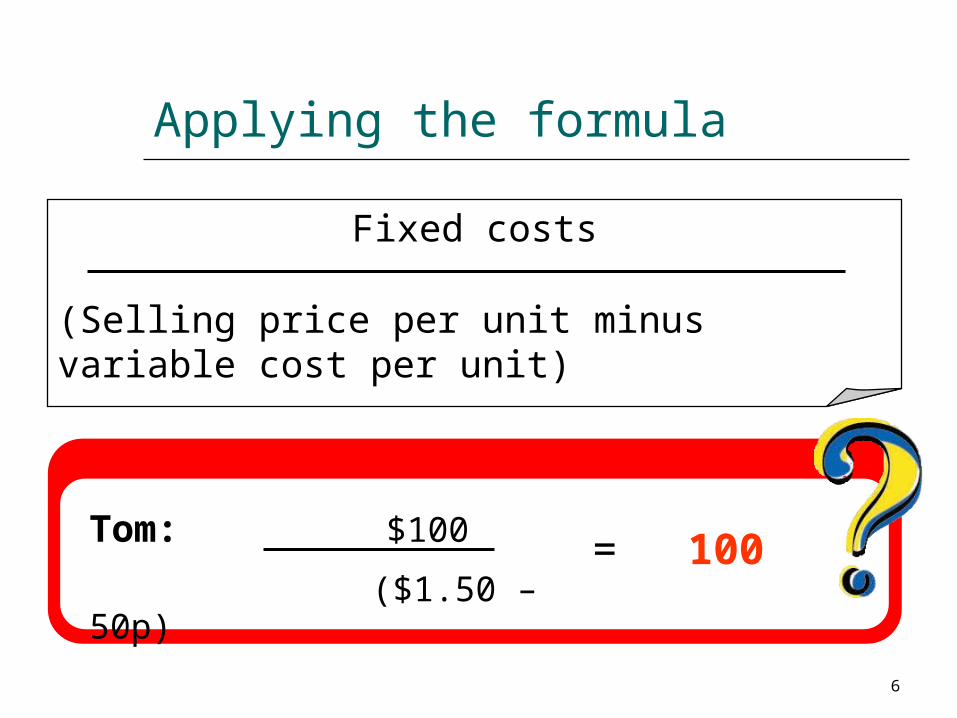
Applying the formula
Fixed costs
(Selling price per unit minus variable cost per unit)
Tom: $100
($1.50 – 50p)= 100

7
Activity: 3.2.1 – draw the breakeven graph
8
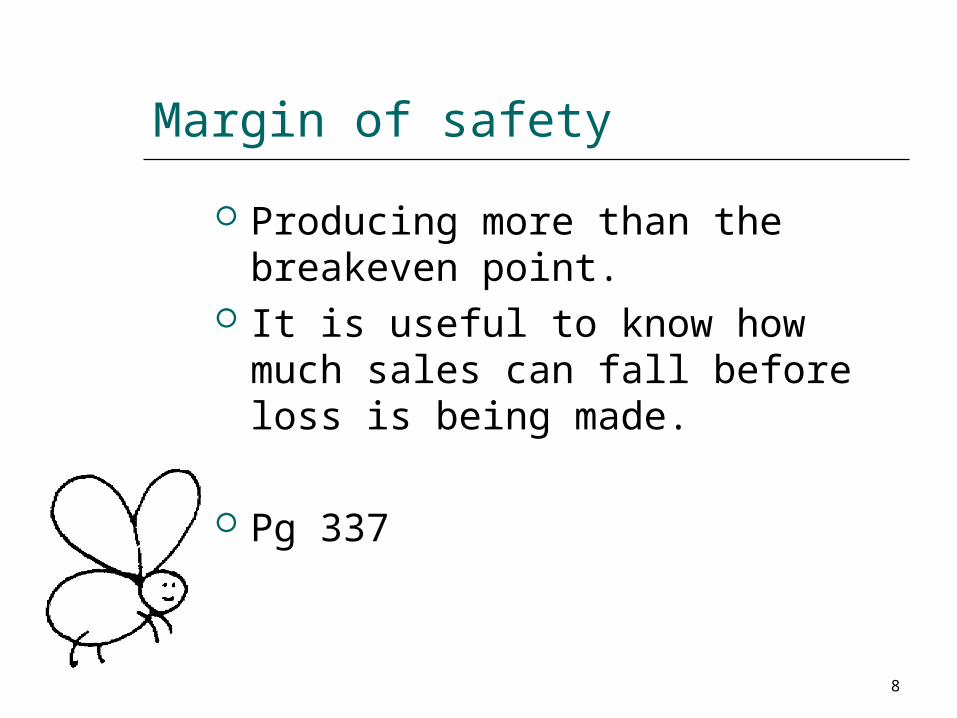
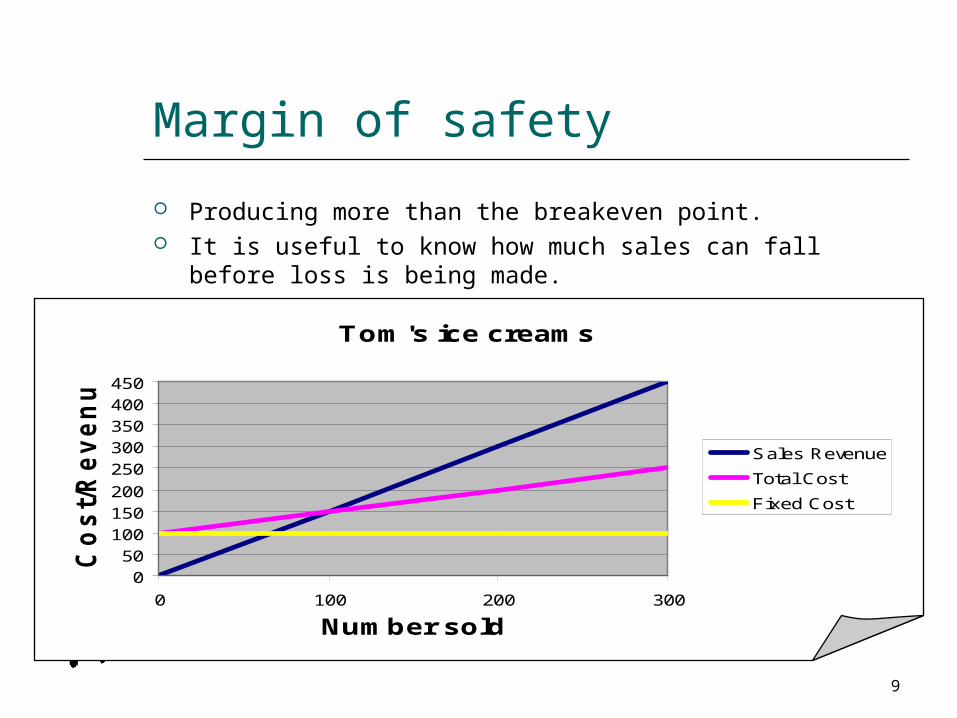
Margin of safety
Producing more than the breakeven point.
It is useful to know how much sales can fall before loss is being made.
Pg 337
9
Margin of safety
Producing more than the breakeven point. It is useful to know how much sales can fall before loss is
being made.
Tom's ice creams
050
100150200250300350400450
0 100 200 300
Number sold
Cos
t/Rev
enue
£
Sales Revenue
Total Cost
Fixed Cost
10
Breakeven test - 2
11
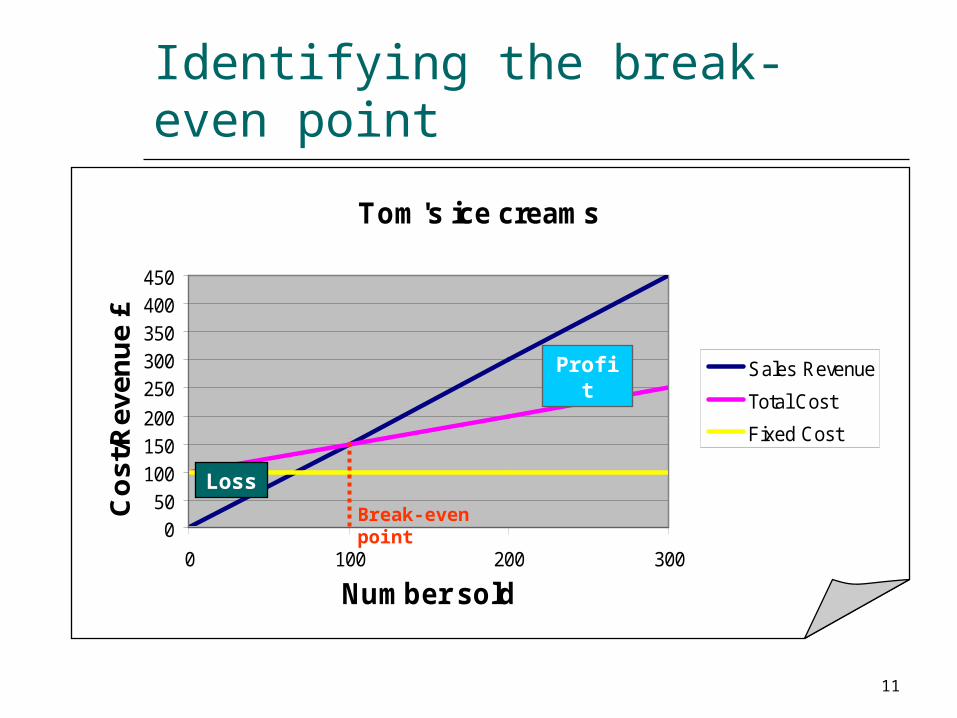
Identifying the break-even point
Tom's ice creams
050
100150200250300350400450
0 100 200 300
Number sold
Cos
t/Rev
enue
£
Sales Revenue
Total Cost
Fixed Cost
Loss
Profit
Break-even point
12
Contribution:
It can be increased by increasing selling revenue
It can be increased by reducing variable costs per unit
It is not the same as profit (fixed costs haven’t been subtracted)
An increase in contribution per unit raises the potential profit
13
Strengths and weakness of breakeven analysis – HL (pg 339)
Hwk produce a spider diagram of Strengths and weaknesses.
14
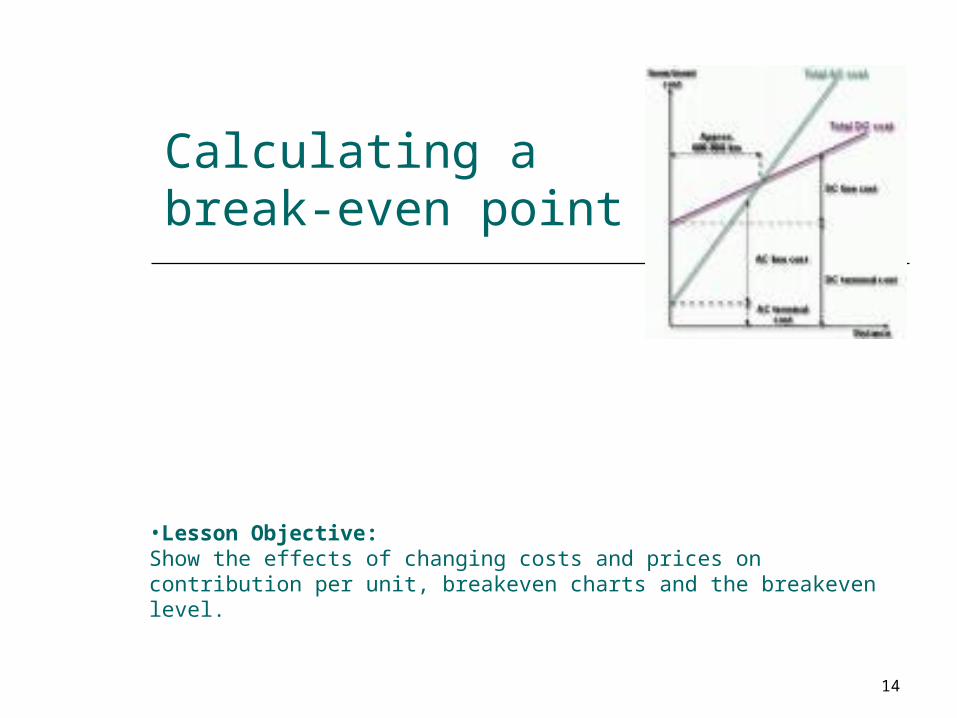
Calculating a break-even point
•Lesson Objective: Show the effects of changing costs and prices on contribution per unit, breakeven charts and the breakeven level.
15
Recap
Define: Start up costs Running Costs Fixed cost Variable cost Revenue Contribution
16
Strengths and weakness of breakeven analysis - HL
Strengths Weakness
17
Changes in variables
Change in price Changes in fixed costs Changes in variable costs.

18
Changes in variables
Change in price
Changes in fixed costs
Changes in variable costs.
Tom's ice creams
050
100150200250300350400450
0 100 200 300
Number sold
Cos
t/Rev
enue
£
Sales Revenue
Total Cost
Fixed Cost
19
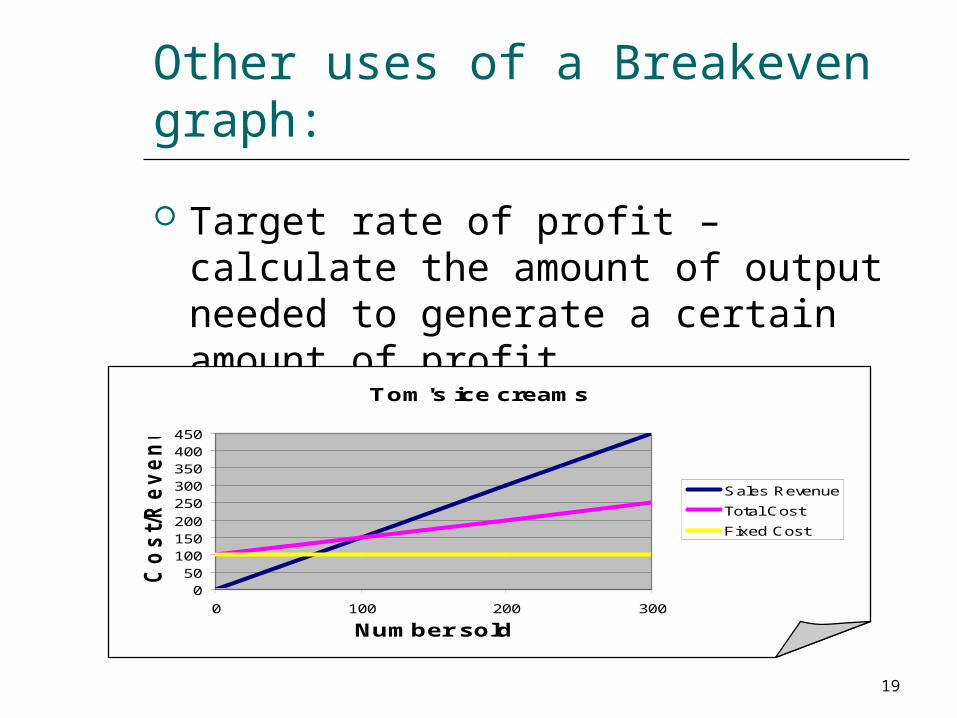
Other uses of a Breakeven graph:
Target rate of profit – calculate the amount of output needed to generate a certain amount of profit.
Tom's ice creams
050
100150200250300350400450
0 100 200 300
Number sold
Cos
t/Rev
enue
£
Sales Revenue
Total Cost
Fixed Cost

20
Further uses of a Breakeven graph (HL) pg 338
Breakeven – price May want to know how much to
charge for its product to break-even.
To do this a business must know how much it is going to product to sell.

21
Other uses of a Breakeven graph:
Price needed to reach a target rate of profit.
Target Revenue & Profit
Pg 339
22
Break-Even Revenue
Pg 339
23

24
What is the Breakeven point?
Define…….
Do use the term in your answer as it helps you to
focus…..
In a question HIGHLIGHT key words and any answers.It is QUALITY not Quantity.

Break-even and the Dome 3.2
25

26
1. What is mean by Breakeven? (2)
Answers may include: When the level of input equals the level of output.
C2 Ap 3 An3 Content 2 marks Good understanding 1 mark Some understanding 0 marks No relevant content points made.
27
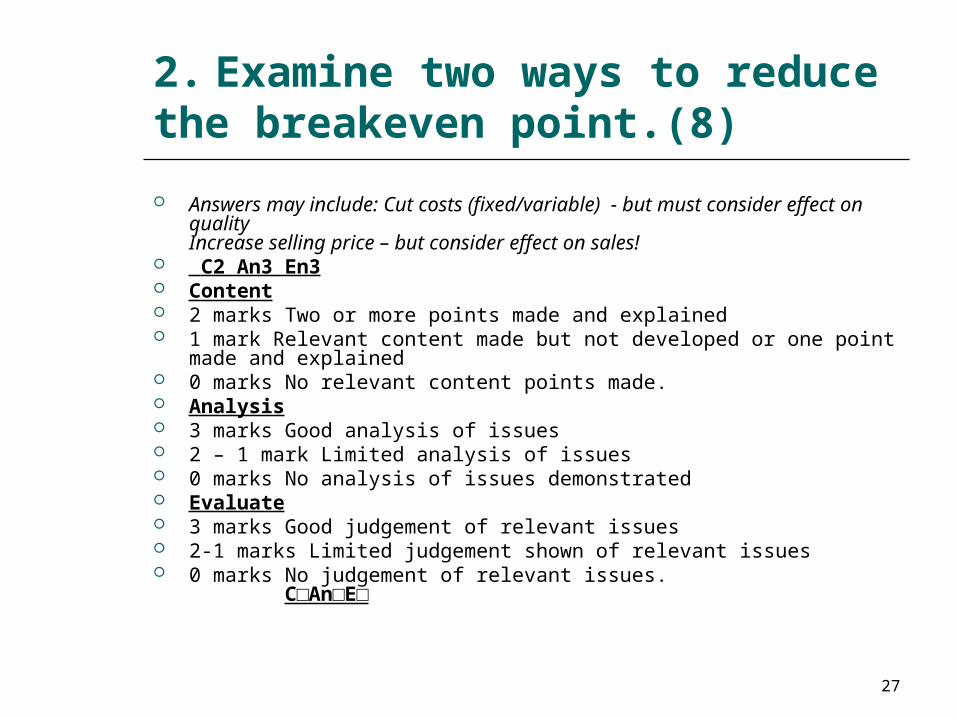
2. Examine two ways to reduce the breakeven point.(8) Answers may include: Cut costs (fixed/variable) - but must consider
effect on qualityIncrease selling price – but consider effect on sales!
C2 An3 En3 Content 2 marks Two or more points made and explained 1 mark Relevant content made but not developed or one point made
and explained 0 marks No relevant content points made. Analysis 3 marks Good analysis of issues 2 – 1 mark Limited analysis of issues 0 marks No analysis of issues demonstrated Evaluate 3 marks Good judgement of relevant issues 2-1 marks Limited judgement shown of relevant issues 0 marks No judgement of relevant issues.
C□An□E□

28
3. Discus the limitations of using Breakeven analysis (12) Answers may include: simplistic e.g all units sold at one price); data may be out of date/
assumes what is made is sold; does not take into account competition e.g price cut; doesn’t consider economy of scale; prices always changing (won’t stay valid for long);accuracy of data.
C2 Ap 2 An4 E 4 Content 2 marks Two or more points made and explained 1 mark Relevant content made but not developed or one point made and explained 0 marks No relevant content points made. Application 2 marks Points effectively applied to the case 1 mark An attempt to apply knowledge to the case 0 marks No attempt at application Analysis 4 – 3 marks Good analysis of issues 2 – 1 mark Limited analysis of issues 0 marks No analysis of issues demonstrated Evaluate 4 - 3 marks Good judgement of relevant issues 2-1 marks Limited judgement shown of relevant issues 0 marks No judgement of relevant issues. C□Ap□An□E□
29
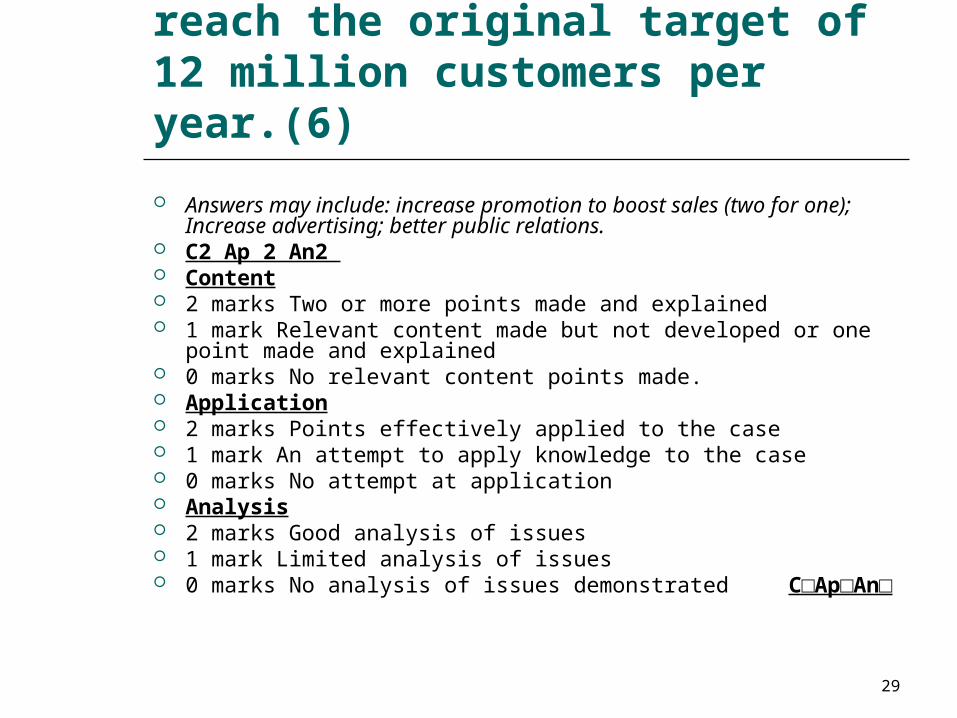
2. Two actions to take to reach the original target of 12 million customers per year.(6) Answers may include: increase promotion to boost sales (two
for one); Increase advertising; better public relations. C2 Ap 2 An2 Content 2 marks Two or more points made and explained 1 mark Relevant content made but not developed or one point
made and explained 0 marks No relevant content points made. Application 2 marks Points effectively applied to the case 1 mark An attempt to apply knowledge to the case 0 marks No attempt at application Analysis 2 marks Good analysis of issues 1 mark Limited analysis of issues 0 marks No analysis of issues demonstrated C□Ap□An□

30
What do you need to improve?