Embed Size (px)
Citation preview

1

2
Research purpose-Export is very important factor in economical growth and consequently in
increasing welfare of countries.-Research and development activities are the main factors of economical
growth and prosperity that lead to the innovation and thereby lead to the improvement of quality, variety of goods and services and also reduction of production costs.
-Petroleum export does not considerably reflect relative effort, planning and ourscientific and economical position toward the world and this is considered as a exogenous fact, thus it's necessary to consider the amount of non-oil exports, the way of its change, composition exportation, technology degree of exportation and changes in these factors over time.
-Therefore, aim of the present study is to examine non-oil export challenges and opportunities from knowledge components standpoint with the approach of dealing with economical boycott during 1970-2010 period.
2

3
Experimental results:
-Foreign studie: according to foreign studies, the accumulation of inland research and development, the accumulation of foreign research and development, foreign direct investment, human capital, global income and exchange rate are known as the most important export determinant factors.
-Inland studies: according to these studies exchange rate, inflation rate, global imports, gross domestic product, imports, exchange rate and labor productivity are known as the determinant factors of exports.
3

44
-Gross domestic product of Iran is nearly twice as much as the smallest country with the organization for economic cooperation and development (New Zealand). Of
course, major part of gross domestic products of Iran economy is from direct and indirect effects of petroleum which indicates to remarkable gap between the actual capacity of Iran economy with the potential and actual capacity of global economy.
-During this period, the highest per capita gross domecapita stic product belongs to Switzerland, America and Japan and Greece has the least per gross domestic products among the studied countries.
-The average of per capita gross domestic product of seven group countries has been 23544$ during this period.
-Per capita gross domestic product were respectively 1874, 1346 and 1478 in Iran during 70th, 80th and 90th and it was 1802 in the first decade of the recent century.
-The average of per capita gross domestic product in Iran has been 1598 during this period that is one-sixth of per capita gross domestic product of Greece that is the smallest economical number of the organization for economic cooperation and development. High level of per capita income in the organization for economic cooperation and development compared to results from economic dynamics and attention to new production factors and creating relative acquisitional advantages and reducing the role of advantage in the economy of countries with the organization for economic cooperation and development. However, a remarkable portion of per capita of Iran economy is earned from petroleum selling that is natural wealth and natural relative advantage and has not been derived from
endogenous factors .

55
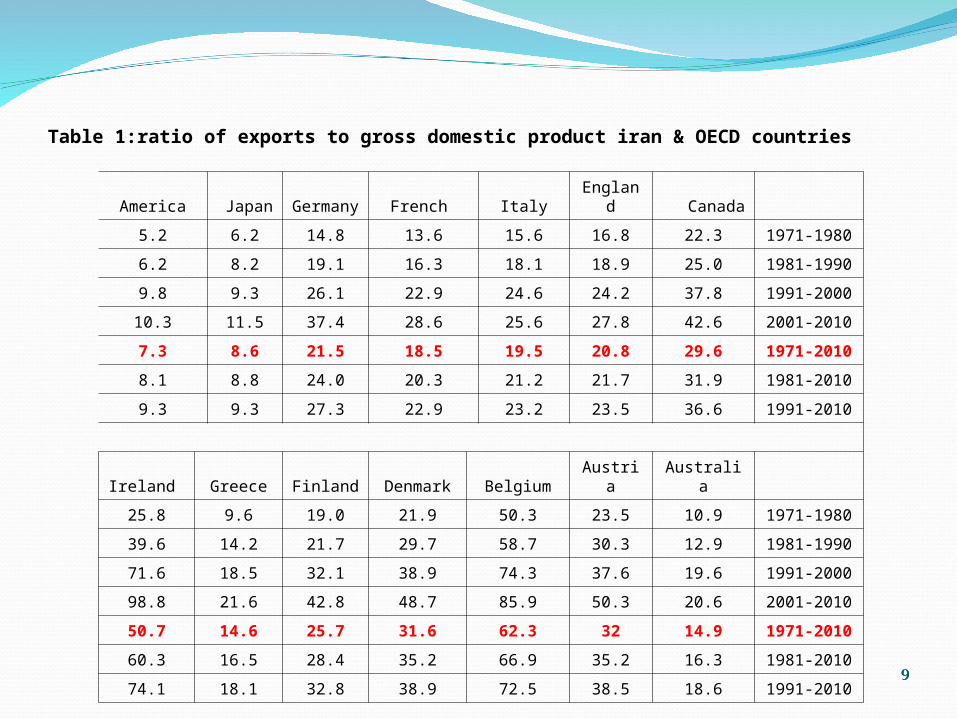
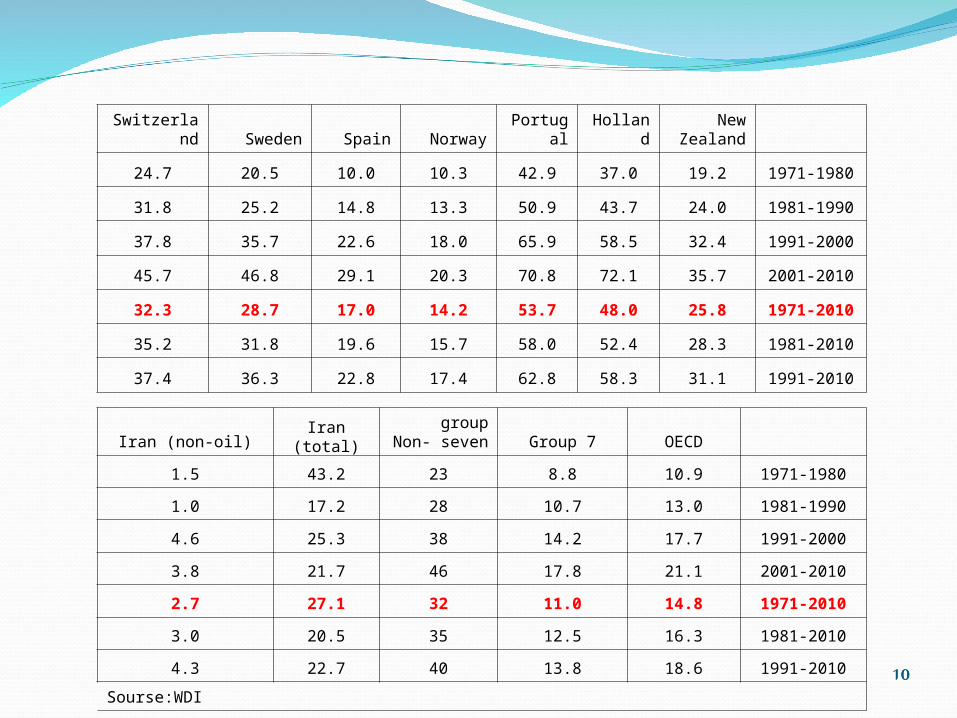
-The ratio of exports to gross domestic product of Iran economy (1970-2010 period) is nearly 0.27.
-The high ratio of exports to gross domestic product for Iran economy is apparently advantageous but since the main exportable goods is petroleum, not only it is not advantageous but it is also a weak point.
-The ratio of exports to gross domestic product for Iran economy has strong fluctuations (due to strong fluctuations in petroleum price and economical sanctions). In the 70th, 80th and 90th decades of 20th century AD. These ratios are respectively 43, 17, and 25 and this ratio is 21 for the first decade of the recent century.
-During this period (1970-2010) the ratio of exports to gross domestic product for seven group countries is nearly 11percent (that is mainly industrial exports and is related to endogenous factors, meanwhile its fluctuations are negligible).
-For 70th, 80th and 90th AD. Centuries the ratio of exports to gross domestic product for seven group countries are respectively 8, 7, 10, 14.2 and this ratio is 17.9 percent for the new century.
-The average ratio of non-oil exports of Iran to gross domestic product is 2.7 percent during the studied period.
-More than one –third of gross domestic product in countries with the organization for economic cooperation and development belongs to American economy and New Zealand has the least share of gross domestic product in countries with the organization for economic cooperation and development among the examined countries.
Data analysis

-Increasing the competitiveness power and exports development of each country depends on technical and industrial progress and this is done in the light of natural research and development activities and international research and development overflow through goods imports.
-Industrial countries undergo large position of research and development costs and countries with the organization for economic cooperation and development undergo more than 90 percent of these costs in industrial world. Surely. High concentration of research and development in this countries leads to technology progress, improvement of new production process and also improvement of products quality.
-Nearly half of domestic research and development capital of countries with the organization for economic cooperation and development belongs to America, approximately 0.93 of domestic research and development capital of centuries with the organization for economic cooperation and development belongs to seven group countries and the remaining 0.7 belongs to members other than seven group
6

-Nearly 1 to 5 percent of gross domestic product are spent to research and development costs, however this amount 2 to 3 percent at the developed countries with the organization for economic cooperation and development.
-Is it possible to be successful by allocating small percentage of gross domestic product to research and development to fill deep gap of technology and increase competitiveness power of Iran economy in order to develop non-oil exports and society welfare?
-According to the new theories of international economy it's possible to transfer bulk of trade partners' research and development capital of to the country and this can result in increasing competitiveness power and consequently exports growth of the country.
7

-Global experience shows that one of the appropriate ways to fill the deep technology gap is the overflow of crystallized technology in imports of intermediate and capital goods.
-During the studied period (1970-2010) the average share of goods imports of Iran economy from countries with the organization for economic cooperation and development and group seven have been respectively 65 and 50 percent.
-The highest goods imports share in Iran economy belongs to Germany (Germany is Iran's most important trading partner) and among countries with the organization for economic cooperation and development Portugal has the least share in supplying goods imports in Iran economy.
-During the studied period more than half of Iran imports is from countries with the organization for economic cooperation and development that more than 0.90 of research and development costs in the world and large portion of world income belong to these countries.
-In general, after the Islamic Revolution, there has been attempt to change trade partners' composition, so we can see decline in goods imports from developed countries.
-Nowadays, large portion of Iran's imports is from countries with the organization for economic cooperation and development that have high research and development capital stock. Consequently, attraction and institutionalization of crystallized technology is possible through purposeful imports of intermediate and capital goods.
8
99
CanadaEnglan
dItalyFrench German
yJapanAmerica
1971-198022.316.815.613.614.86.25.2
1981-199025.018.918.116.319.18.26.2
1991-200037.824.224.622.926.19.39.8
2001-201042.627.825.628.637.411.510.3
1971-201029.620.819.518.521.58.67.3
1981-201031.921.721.220.324.08.88.1
1991-201036.623.523.222.927.39.39.3
AustraliaAustriaBelgiumDenmarkFinland GreeceIreland
1971-198010.923.550.321.919.09.625.8
1981-199012.930.358.729.721.714.239.6
1991-200019.637.674.338.932.118.571.6
2001-201020.650.385.948.742.821.698.8
1971-201014.93262.331.625.714.650.7
1981-201016.335.266.935.228.416.560.3
1991-201018.638.572.538.932.818.174.1
Table 1:ratio of exports to gross domestic product iran & OECD countries
1010
New Zealand
Holland
Portugal Norway Spain Sweden
Switzerland
1971-198019.237.042.910.310.020.524.7
1981-199024.043.750.913.314.825.231.8
1991-200032.458.565.918.022.635.737.8
2001-201035.772.170.820.329.146.845.7
1971-201025.848.053.714.217.028.732.3
1981-201028.352.458.015.719.631.835.2
1991-201031.158.362.817.422.836.337.4
OECDGroup 7group
Non- seven Iran (total)Iran (non-oil)
1971-198010.98.82343.21.5
1981-199013.010.72817.21.0
1991-200017.714.23825.34.6
2001-201021.117.84621.73.8
1971-201014.811.03227.12.7
1981-201016.312.53520.53.0
1991-201018.613.84022.74.3
Sourse:WDI

1111
CanadaEnglan
dItal
yFrenc
h GermanyJapanAmerica
1971-19802.886.755.126.099.0219.2337.16
1981-19902.936.165.135.948.3120.8737.71
1991-20002.825.924.765.598.2321.0738.95
2001-20103.046.124.465.507.6918.9841.07
1971-20102.976.274.925.838.3820.1538.4
1981-20102.916.064.855.718.1520.5838.88
1991-20102.905.994.665.568.0520.3839.65
Ireland
Greece
Finland
DenmarkBelgiumAustriaAustralia
1971-19800.230.600.530.821.110.871.51
1981-19900.250.530.550.721.030.821.52
1991-20000.310.470.480.670.980.811.60
2001-20100.450.520.510.650.960.801.75
1971-20100.300.540.510.731.040.841.58
1981-20100.310.510.510.691.000.811.60
1991-20100.360.490.490.660.970.811.65
Table 2. Gross domestic product share in every countries with OECD

1212
Switzerland Sweden Spain Norway Portugal Holland
New Zealand
1971-19801.401.222.450.610.421.720.27
1981-19901.211.112.310.650.431.570.24
1991-20001.081.002.340.680.461.570.22
2001-20101.001.012.520.700.461.570.23
1971-20101.201.102.390.660.441.610.24
1981-20101.121.052.360.670.451.570.23
1991-20101.051.002.400.680.461.570.22
OECDGroup 7group
Non- seven Iran to CanadaIran to New Zealand
1971-198010086147.76194
1981-1990100871318.14167
1991-2000100871313.62191
2001-2010100871314.72200
1971-2010100871316.06184
1981-2010100871313.93182
1991-2010100871315.60193
Sourse:WDI

1313
CanadaEnglandItalyFrench German
yJapanAmerica
1971-198015073145831126014055139802094920794
1981-199017989174781459017258170832786225404
1991-200020255214771768720404213203542830788
2001-201024222259031949823118235093755835637
1971-2010186951899815224180811832529435270888
1981-201020142207621681019688200633282829604
1991-201021577229521829021308220503613832404
IrelandGreeceFinland Denmar
kBelgiumAustriaAustralia
1971-1980868479101356519552138271402713176
1981-19901125186071796322620168121746915395
1991-20001833894321984926887204062165718595
2001-201028268118912457330577232742475722257
1971-20101497491141819024099179101872416657
1981-20101748995942003925918195422060218047
1991-201021648102522142428117213622269119815
Table 3.Capita gross domestic product of OECD countries and Iran

1414
Switzerland Sweden Spain
Norway
Portugal Holland New Zealand
1971-1980265451804783328162128351526710737
1981-19902995921375969010559167331732211620
1991-200032354239741252414259220792147812500
2001-201034327286011516516978252892440914782
1971-201030294221951089511849183691893212071
1981-201031791238601191913323205832040212604
1991-201033012255161340515165231492245513261
OECDiranG7nog7
1971-19801669118741701512502
1981-19902077913462159014665
1991-20002556614782678817876
2001-20102909018023100620891
1971-20102216515982354415704
1981-20102435614.452595717040
1991-20102674115.002852518737
Sourse:WDI

1515
CanadaEnglan
dItalyFrench GermanyJapanAmerica
1971-19800.9210.851.606.128.4313.1351.90
1981-19901.058.271.775.579.3218.0849.09
1991-20001.585.972.005.248.8523.2145.32
2001-20101.975.252.035.158.3823.9544.66
1971-20101.37.931.825.588.8818.9648.19
1981-20101.446.741.915.368.9521.3046.69
1991-20101.715.732.015.218.7023.4645.10
IrelandGreec
eFinlan
d Denmar
kBelgiumAustriaAustralia
1971-19800.040.010.150.290.740.250.17
1981-19900.060.020.220.300.760.330.26
1991-20000.100.070.410.430.780.480.65
2001-20100.150.100.540.530.800.570.90
1971-20100.080.040.300.370.770.380.44
1981-20100.090.050.360.400.780.440.54
1991-20100.120.080.450.460.790.510.73
Table 4. OECD domestic research and development capital and Iran

1616
Switzerland
Sweden Spain Norway
Portugal
Holland
New Zealand
1971-19802.150.810.190.210.031.970.04
1981-19901.611.050.310.290.031.580.04
1991-20001.321.340.610.280.161.110.10
2001-20101.211.490.790.250.240.900.14
1971-20101.631.140.470.250.111.460.08
1981-20101.411.250.530.280.121.260.08
1991-20101.281.390.670.270.191.040.11
OECDاG7nog7Iran to
CanadaIran to Greece
1971-19801009371.951116
1981-19901009376.05269
1991-20001009283.8463
2001-20101009192.5047
1971-20101009372.52432
1981-20101009643.42146
1991-20101009283.8258
Sourse:WDI

1717
CanadaEnglandItalyFrenc
hGermanyJapanAmerica
1971-19800.810.35.66.020.918.718.4
1981-19902.28.88.02.826.217.21.1
1991-20004.76.011.06.825.012.32.7
2001-20102.16.912.315.124.37.60.5
1971-20102.68.28.86.524.114.76.4
1981-20103.27.310.06.825.313.31.7
1991-20103.86.311.49.624.810.72.0
IrelandGreeceFinland Denmar
kBelgiumAustriaAustrali
a
1971-19800.10.31.30.92.91.61.8
1981-19900.40.30.81.44.92.85.7
1991-20000.30.11.01.07.03.24.0
2001-20100.50.11.10.94.02.82.5
1971-20100.30.21.11.14.92.63.7
1981-20100.40.21.01.15.62.94.4
1991-20100.40.11.01.06.03.13.5
Table 5. Share of Iran imports from OECD

1818
Switzerland
SwedenSpain Norway
Portugal HollandNew Zealand
1971-19803.31.81.40.20.03.20.5
1981-19904.53.42.80.20.14.12.2
1991-20005.02.33.10.10.23.50.6
2001-20108.24.52.80.20.23.20.2
1971-20104.82.62.50.20.13.61.0
1981-20105.53.22.90.20.13.71.2
1991-20106.13.03.00.10.23.40.5
OECDImports from 21 countries to
overall importsImports from group
seven
1971-19801000.760.62
1981-19901000.680.45
1991-20001000.620.42
2001-20101000.500.35
1971-20101000.650.50
1981-20101000.620.47
1991-20101000.570.41

19
Opportunities-Abundance of rich underground resources and considerable petroleum
income -Ratio of employed specialists is growing compared to overall employers of
Iran economy-Geopolitical situation and the existence of regional markets to exports
development to deal with economic sanctionVery high potential
19

20
Challenges-Supply-driven components of knowledge based economy (research and
development, human capital and so on) resulting from relative price deviation because of adopting wrong economical policies
-Significant gap between goods supply and demand (demand excess) because of population explosion, information explosion, explosion of financial and monetary expansionary policies and expectations
-Low elasticity of domestic production supply and exports of Iran economy-Change in trade partners' composition from developed countries to
developing countries after Islamic Revolution-The deep gap between Iran economy technology and world economy and as
a result traditional nature of exports composition-High dependence of industrial products exports to imports technology
(Petrochemical) Lowness of ratio of research and development costs to added value of Iran
economy-Lack of incentives of private sector to do research and development
activities due to lack of profitability-Dependency of exports of industrial products to various subsidies
20

21
-Adopting wrong economical policies (monetary, financial, exchange and trade) which lead to the deviation of factors relative price in favor of using physical capital and exports technology and to the detriment of other production factors
-High amount of oil revenues in exports of the country-Lack of proper and purposeful planning in order to uptake bulk of foreign
research and development from imports channel-Lack of success in FDI attract compared to most of the countries as China
and MalaysiaExpensiveness of production inputs needed to knowledge based economy
and cheapness of production inputs needed to resource and capital based economy due to wrong economical policies
21

22
Viewpoint: while continuity of the existent condition-Fluctuation in non-oil growth rate of Iran economy compared to other
countries-Lowness of non-oil exports role and share, particularly exportation with high
technology in Iran economy-Increasing deep technology gap and strong dependency of Iran economy
activities to import technologies and raw material, intermediate and capital goods
-Lack of private sector tendency to do research and development activities and human capital
-of competitiveness power due to lowness of exportable goods and services quality in Iran on one side and highness of cost of exportable goods and services compared to developed countries on the other hand due to adopting wrong economical policies that lead to the deviation of inputs relative price
-High dependency of economical structure, exports and budget of government to oil exports derived incomes
-Lowness of competitiveness power and challenge in accession to WTO
22

23
Viewpoint: appropriate choice-Reducing economical dependency of country to non-renewable wealth to
deal with economical sanctions-Converting non-renewable wealth to renewable ones-Expanding market of knowledge-based economy components (human capital,
research and development, …) -Increasing non-oil exports share in country economy to deal with economical
sanction-Increasing exports share dependent on research and development activities
and knowledge. -Expanding innovation using basic and applied research to fill deep
technology gap -Attracting bulk of foreign research and development through intermediate
and capital goods imports-Increasing competitiveness power and ability to adapt with supply and
demand changes to deal with economical sanction-Increasing knowledge management role, resource management, futurist
technology and electronic training in Iran economy-Decreasing government incumbencies and serious and principled support of
private sector investment in order to explain Article 44 of Constitution
23

24
-In order to decrease deep technological gap the following steps are essential: moving from resource-based and capital-based economy toward knowledge-based economy, increasing competitiveness power in order to fulfill goals of twenty-year viewpoint document, diversifying non-oil exports and seriously addressing any type of economical sanctions
-Coordination between macroeconomic policies and research and educational activities more advantageous
-Overall emphasis on research and development activities in order to diversify expands to create interdependence
-Correct selection of trade partners and improvement of country's ability in attracting and localizing foreign research and development capital
-Provision of economical infrastructures (such as creating stability in macroeconomic, creating competitive environment in Iran economy, focusing on IT and ICT, improving capital system) based on knowledge
-Protection of foreign direct investments with new knowledge attraction intention, new management, day technology and financing
24