Embed Size (px)
Citation preview

1
Chapter 24Scale Development and Statistical
Analysis Methods for Scale Data

2
ContentContent
• Introduction
• Scale development methods
• Scale evaluation methods
• Statistical analysis of scale data

3
§1 Introduction
1 Definition
Measurement instrument that are collections of items combined
into a composite score, and to reveal levels of a certain state,
behavior or attitude of the research objects are referred to as scale.

4
Example24-1 How to evaluate the treatment of pain? Or how can we measure different degree of pain?

5
Characteristics of scale:
Quantitative
Standardization

6
Ways to obtain the variable value:
1) Measurement ----to get the
quantitative data
2) questionnaire or inquiring---- to
get the quantitative or
qualitative data

7
Structure design of a scale is similar to a questionnaire, but they are different:
questionnaire ----different independent contents can be included in
scale----describe one characteristic of the object, and the items are associated with each other

8
2 Scales are used in the situations of:
measure variable that can not assess directly. Eg:
some physical, psychological and social
characteristics.
1) Variables can not be measured directly
2) Nonobjective conceptions and attitudes
3) Complicated behaviors or psychological states

9
3 merits and demerits of the scale
measurement
merits : Strong objectivity, standardized process,
comparable and easy to implement
demerits : large variation with different
individual, high quality are request in scale
development

10
1 Structure of a scale
Scale----domain(subscale) ---- facet
---- item
§2 Methods of scale development

11
2 principle of scale development
An ideal scale: exactly measure the aim
characteristics, and obtain reliable data
( 1 ) principle of suitability
( 2 ) principle of validity
( 3 ) principle of feasibility

12
3 Approaches of scale development1) Make sure the research aim and measurement content
nominal group
focus group
2) Define dimensions and facets

13
3) Establish item pool and select items
4) Design operable items
Make sure the format of items and response

14
Table 24-1 response scale analysis of importance quantifiers
quantifiers Average score
quantifiers Average score
Very unimportant 0.90 important 5.96
unimportant 1.10 More important 7.14
More unimportant 2.40 Quite important 8.04
important 4.41 Very important 8.59
Some important 4.72 highly important 8.69
15
5) Qualitative evaluation of scales
Expert consultation methods
Delphi method
16
6) Pilot test of the scale and it’s quantitative
evaluation
7) Establish the norm

17
4 quantitative analysis and selection of items
Similar to the indicator selection in
comprehensive evaluation, a good item should
have good importance, sensitivity, independency,
and acceptability,and be representative, ascertain.

18
Methods of item selection:
( 1 ) subjective evaluation method--importance
( 2 ) discrete tendency method—sensitivity
( 3 ) correlation coefficient method–
representative and independency
( 4 ) principal components analysis and
factor
analysis method-- representative

19
( 5 ) clustering analysis method--
representative
( 6 ) stepwise selection method based on
importance
( 7 ) stepwise regression -- importance
( 8 ) stepwise discriminant method –
discriminative ability

20
Example 24-2 Analyze the quality of
12 items of 3 facets (ache, energy and
sleeping) in physical domain of 206 cases
of general people and hypertension
patients
21
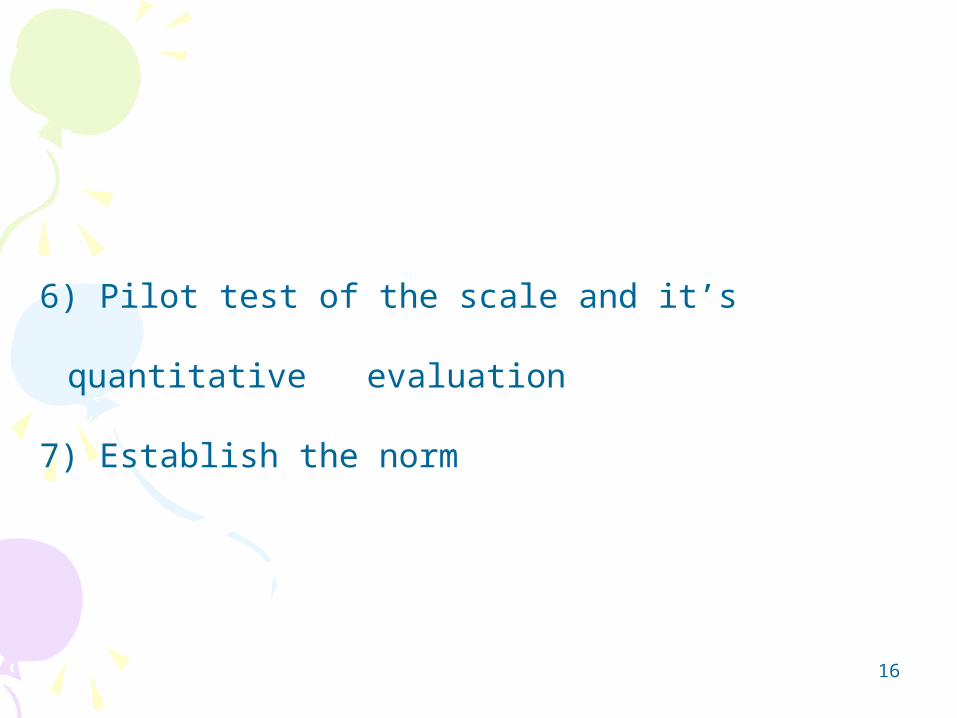
Table 24-2 results of item selectionitem Correlation
coefficient CV Factor loadings Stepwise regression
Stepwise discrimin
ant
(%) F1 F2 F3
F11 -0.166 * 40.90 0.222 0.013 -0.478
F12 -0.226 ** 42.51 0.762 -0.046 -0.143
F13 -0.240 ** 44.25 0.812 -0.069 -0.175
F14 -0.089 40.58 0.706 0.020 -0.265
F21 0.243 ** 42.06 -0.112 0.233 0.801
F22 -0.181 * 39.09 0.657 -0.255 -0.197
F23 0.227 ** 32.24 -0.126 0.224 0.812
F24 -0.276 ** 41.15 0.741 -0.293 -0.016
F31 0.212 ** 32.14 0.025 0.830 0.297
F32 -0.317 ** 51.74 0.512 -0.665 -0.017
F33 0.237 ** 35.24 -0.037 0.824 0.308
F34 -0.316 ** 55.73 0.480 -0.669 0.112

22
5 Notice
1) Quantity of items 30-50
2) wording of items should be explicit and
material
3) Objective index and subjective index

23
§3 Methods of scale evaluation

24
1 qualitative evaluation of scale
experts colloquia or experts consultation
Improve the structure of the scale, wording of
items, item selection, and so on.

25
2 reliability analysis
Reliability is used to evaluate the accuracy,
stability and consistency of a scale.
( 1 ) test-retest reliability ≥: 0.7。( 2 ) split-half reliability : ( 24-1
)( 3 ) Cronbach’s alpha coefficient : ( 24-2 )K-number of items , -the score variance of the ith
item , -the total score variance of a scale
2
1
rR
r
2
2(1 )
1i
T
Sk
k S
2iS 2
TS

26
Example 24-4 A doctor measured Quality of life
with 50 people using WHOQOL-100 , and a retest
was done one week later, results were showed in
table 24-4.

27
…
表 24-4 50 名正常人生存质量调查得分
Q1 F1 F2 F3 F4 F5 F6 F7 F8 F9 F10 F11 F12 F13 F14 F15 F16 F17 F18 F19 F20 F21 F22 F23 F24 T1 T2
80 10 11 9 14 12 14 9 6 13 10 4 16 12 13 13 13 14 10 14 14 13 11 10 13 278 296
80 7 12 11 11 15 15 13 9 18 12 4 17 13 13 10 10 9 9 11 9 12 11 8 13 272 257
90 6 12 10 13 15 16 9 8 18 12 4 18 11 14 8 11 12 12 13 12 15 11 10 13 283 270
98 8 11 10 17 18 19 12 8 17 11 4 20 13 18 12 12 8 8 11 12 17 11 10 19 306 317
60 12 13 13 11 13 16 9 10 14 9 8 15 10 7 13 11 10 8 11 13 14 10 14 11 275 281
75 14 11 11 8 13 7 12 14 13 13 7 14 8 10 10 7 9 12 8 10 9 6 11 4 241 257
90 8 12 11 15 16 16 12 7 19 11 4 17 12 15 9 13 7 7 11 15 15 5 8 15 280 259
60 6 12 9 12 13 12 9 11 18 11 5 16 12 13 17 11 15 11 14 12 13 8 9 6 275 278
96 5 10 9 12 14 14 12 7 12 12 4 16 11 14 11 11 14 8 12 13 15 10 9 8 263 264
70 9 12 10 10 14 13 11 10 12 11 4 18 12 14 11 11 4 9 15 16 12 9 11 9 267 284
50 9 12 10 7 9 9 10 13 16 10 5 12 12 8 10 10 5 8 11 11 10 10 9 6 232 243
75 10 13 11 13 12 16 13 9 18 12 5 17 13 14 13 10 4 10 11 12 12 11 9 16 284 304
60 7 9 11 10 13 14 11 9 13 11 4 17 12 14 10 10 4 11 9 10 13 8 9 18 257 264
70 8 10 9 11 12 12 9 10 14 11 4 16 11 11 11 10 7 9 9 8 8 10 11 11 242 238
80 8 13 12 16 16 16 12 8 14 12 4 16 14 13 13 14 12 11 13 12 14 11 11 16 301 328
Table 24-4 QOL score of 50 persons

28
Results:
① test-retest reliability : r=0.82;
②mean difference =3.87 , t=1.544 , P=0.129 ;
③ Cronbach’s alpha coefficient :
d
24 (6.2551 3.3571 13.8371 24 151.3710(1 ) (1 ) 0.80
23 661.3588 23 661.3588
29
3 validity analysis of a scale
Validity is used to evaluate the veracity,
validity of a scale. The accordance of
practice results and the anticipate results.

30
1) content validity
2) criterion-related validity
3) contract validity
(evaluating:confirmatory factor analysis, CFA)

31
4 responsibility analysis of a scale
Responsibility is the capability of a scale to observe the changes
between different objects or the changes with in an object at
different time. The statistic is effect size:
( 24-3)
: Scale socre
X
X X
S
af ter treatment before treatment
before treatment
Example 24-5

32
§4 statistical analysis methods of scale data

33
1 characteristic of scale data
1) grouping the objects and compare the scores
between groups;
2) Repeated measure data;
3) multi-domain data

34
1) inevitable
2) Deal with missing data
Missing data:

35
2 statistical analysis of scale data
Statistical description
Statistical inference

36
Statistical inference1) For situation if one time point, more than one
group
one variable analysis: t-test, F test, rank sum test

37
some comprehensive evaluation methods:
Fuzzy discriminant method, O’Brien
synthetic method, rank sum method,
TOPSIS method.

38
2) Compare of longitudinal data
Hotelling T2 test, multi-variable variance analysis,
variance analysis of repeated measure, profile
analysis

39
3 Examples of scale data analysis
Example 24-6 , Example 24-7

40
4 Application of scalespsychology, pedagogy, and sociology----
medicine
( 1 ) psychology and psychiatry ( 2 ) evaluation of disease treatment in clinical research

41
( 3 ) disease statistics and health
statistics
( 4 ) nursing research
( 5 ) health management

42
THANKSTHANKS!!


![Statistical Methods [Jadhav]](https://img.pdfslide.net/doc/110x75/577d20151a28ab4e1e91f270/statistical-methods-jadhav.jpg)