Embed Size (px)
Citation preview
1
Chapter 7Hypothesis Testing
7-1 Basics of Hypothesis Testing
7-2 Testing a Claim about a Mean: Large Samples
7-3 Testing a Claim about a Mean: Small Samples
7-4 Testing a Claim about a Proportion
7- 5 Testing a Claim about a Standard Deviation (will cover with chap 8)

2
7-1
Basics of
Hypothesis Testing
3
Definition
Hypothesis
in statistics, is a statement regarding a characteristic of one or more populations
4
Steps in Hypothesis Testing
1. Statement is made about the population
2. Evidence in collected to test the statement
3. Data is analyzed to assess the plausibility of the statement
5
Components of aFormal Hypothesis
Test
6
Components of a Hypothesis Test
1. Form Hypothesis
2. Calculate Test Statistic
3. Choose Significance Level
4. Find Critical Value(s)
5. Conclusion
7
Null Hypothesis: H0
A hypothesis set up to be nullified or refuted in order to support an alternate hypothesis. When used, the null hypothesis is presumed true until statistical evidence in the form of a hypothesis test indicates otherwise.
8
Null Hypothesis: H0
Statement about value of population parameter like , p or
Must contain condition of equality
=, , or
Test the Null Hypothesis directly
Reject H0 or fail to reject H0
9
Alternative Hypothesis: H1
Must be true if H0 is false
, <, >
‘opposite’ of Null
sometimes used instead of HaH1
10
Note about Forming Your Own Claims (Hypotheses)
• If you are conducting a study and want to use a hypothesis test to support your claim, the claim must be worded so that it becomes the alternative hypothesis.
• The null hypothesis must contain the condition of equality
11
ExamplesSet up the null and alternative hypothesis
1. The packaging on a lightbulb states that the bulb will last 500 hours. A consumer advocate would like to know if the mean lifetime of a bulb is different than 500 hours.
2. A drug to lower blood pressure advertises that it drops blood pressure by 20%. A doctor that prescribes this medication believes that it is less. Set up the null and alternative hypothesis. (see hw # 1)
12
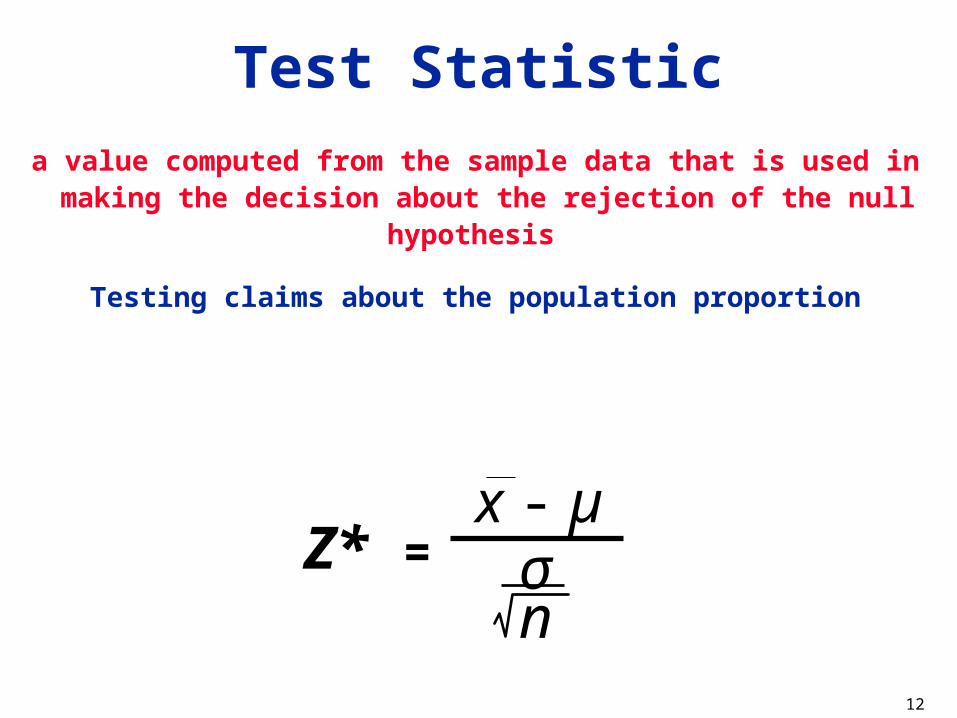
Test Statistic
a value computed from the sample data that is used in making the decision about the rejection of the null hypothesis
Testing claims about the population proportion
Z* =x - µ
σn
13
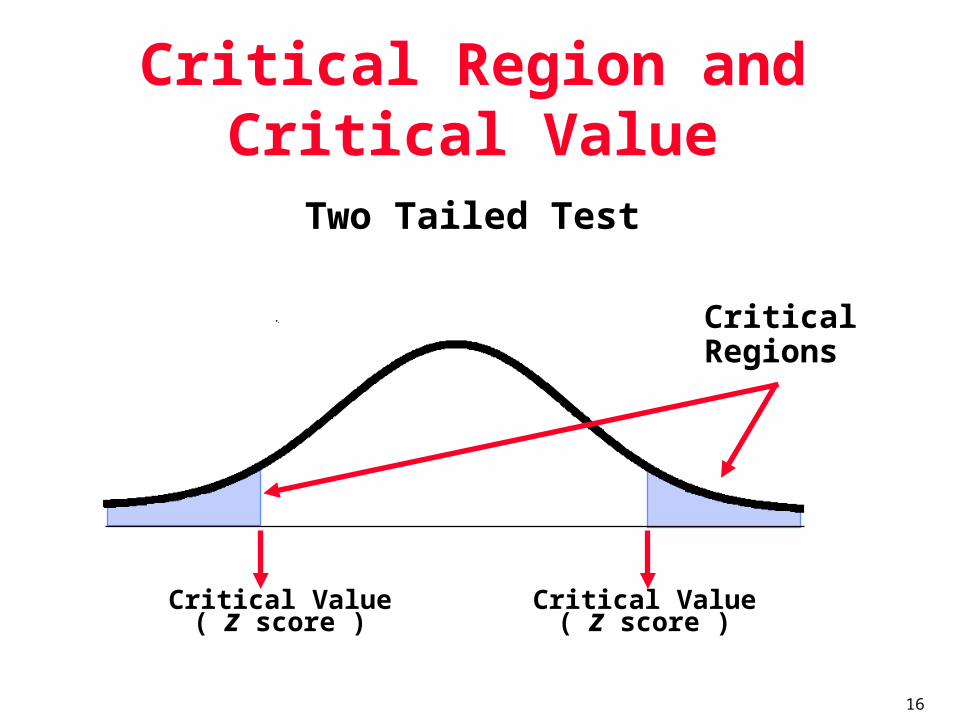
• Critical Region - Set of all values of the test statistic that would cause a rejection of the null hypothesis
• Critical Value - Value or values that separate the critical region from the values of the test statistics that do not lead to a rejection of the null hypothesis
14
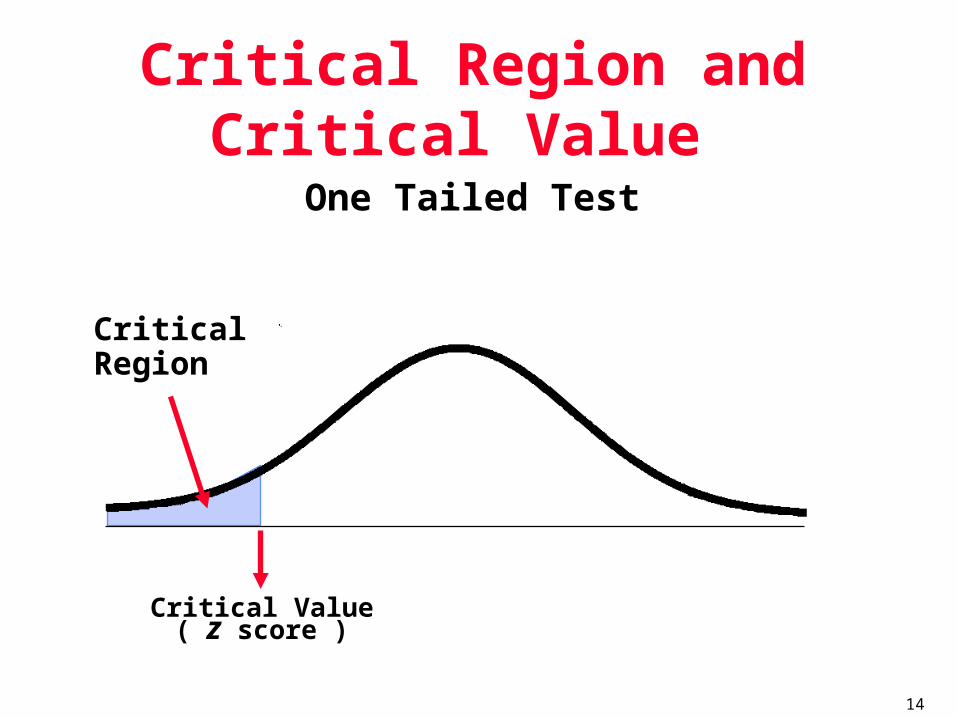
Critical Region and Critical Value
One Tailed Test
CriticalRegion
Critical Value( z score )
15
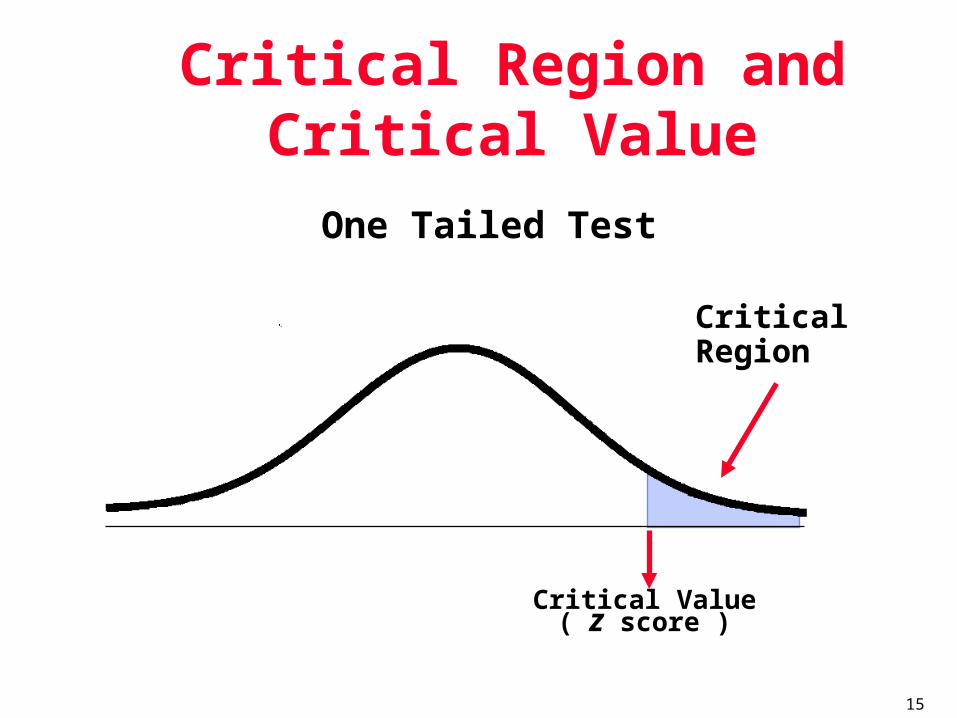
Critical Region and Critical Value
One Tailed Test
CriticalRegion
Critical Value( z score )
16
Critical Region and Critical Value
Two Tailed Test
CriticalRegions
Critical Value( z score )
Critical Value( z score )
17
Significance Level Denoted by The probability that the test
statistic will fall in the critical region when the null hypothesis is actually true.
Common choices are 0.05, 0.01, and 0.10
18
Two-tailed,Right-tailed,Left-tailed Tests
The tails in a distribution are the extreme regions bounded
by critical values.
19
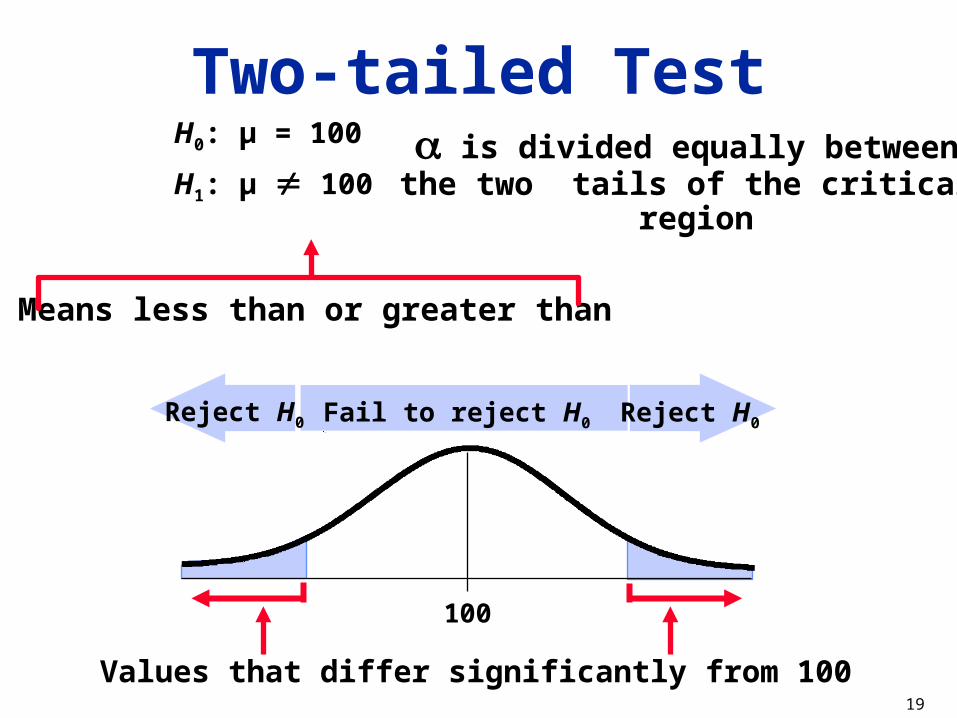
Two-tailed TestH0: µ = 100
H1: µ 100
Means less than or greater than
100
Values that differ significantly from 100
is divided equally between the two tails of the critical
region
Fail to reject H0Reject H0 Reject H0
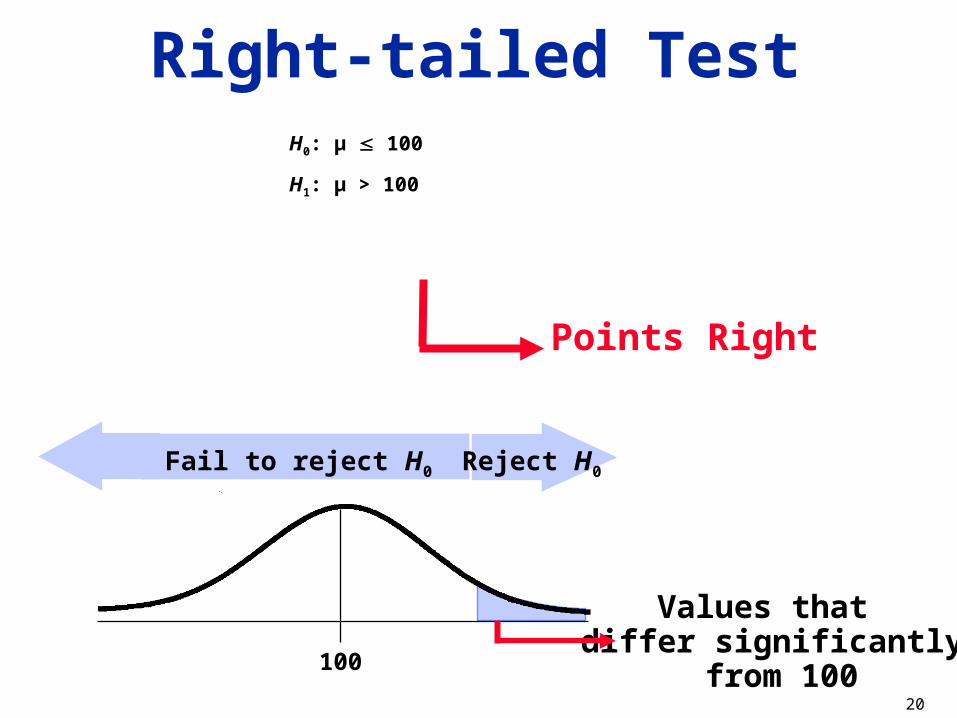
20
Right-tailed TestH0: µ 100
H1: µ > 100
Values that differ significantly
from 100100
Points Right
Fail to reject H0 Reject H0
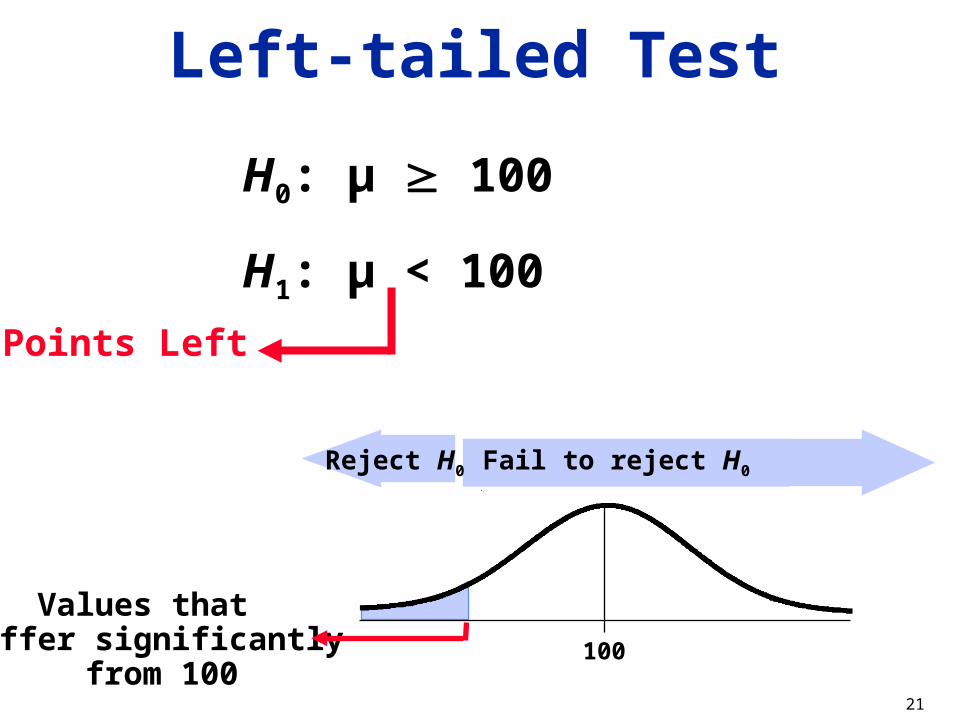
21
Left-tailed Test
H0: µ 100
H1: µ < 100
100
Values that differ significantly
from 100
Points Left
Fail to reject H0Reject H0
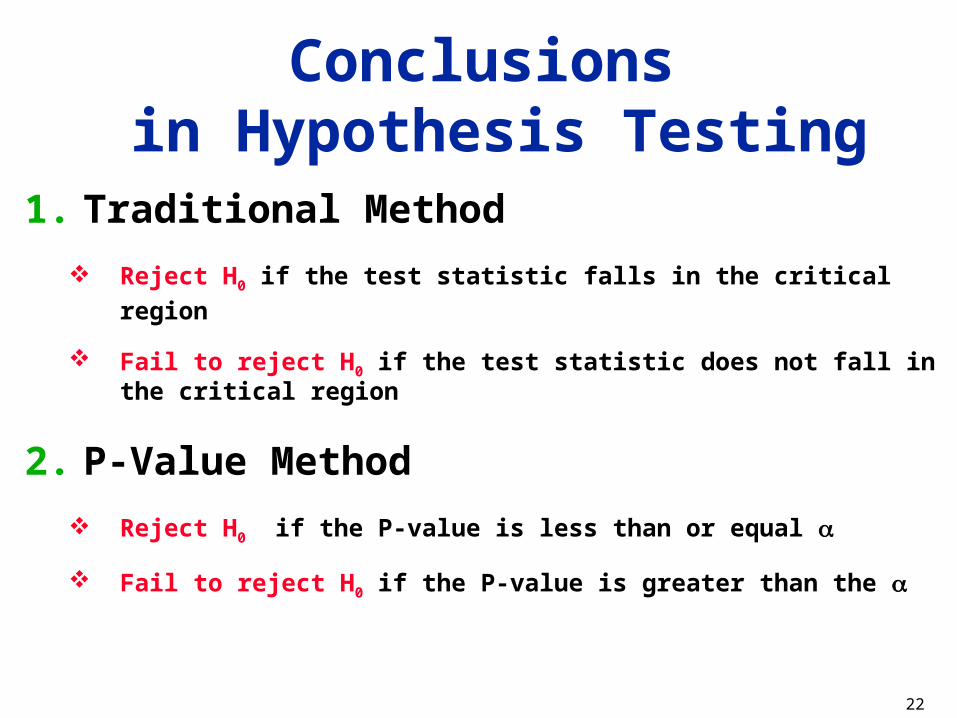
22
Conclusions in Hypothesis Testing
1. Traditional Method
Reject H0 if the test statistic falls in the critical region
Fail to reject H0 if the test statistic does not fall in the critical region
2. P-Value Method
Reject H0 if the P-value is less than or equal
Fail to reject H0 if the P-value is greater than the
23
P-Value Methodof Testing Hypotheses
Finds the probability (P-value) of getting a result and rejects the null hypothesis if that probability is very low
Uses test statistic to find the probability.
Method used by most computer programs and calculators.
Will prefer that you use the traditional method on HW and Tests
24
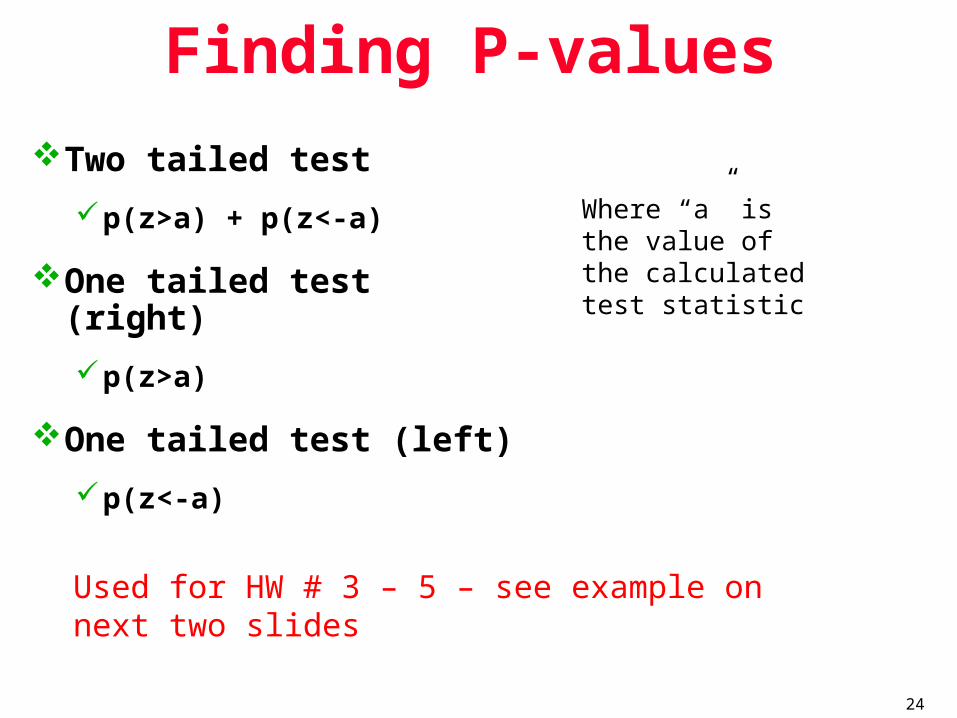
Finding P-values
Two tailed test
p(z>a) + p(z<-a)
One tailed test (right)
p(z>a)
One tailed test (left)
p(z<-a)
Where “a” is the value of the calculated test statistic
Used for HW # 3 – 5 – see example on next two slides
25
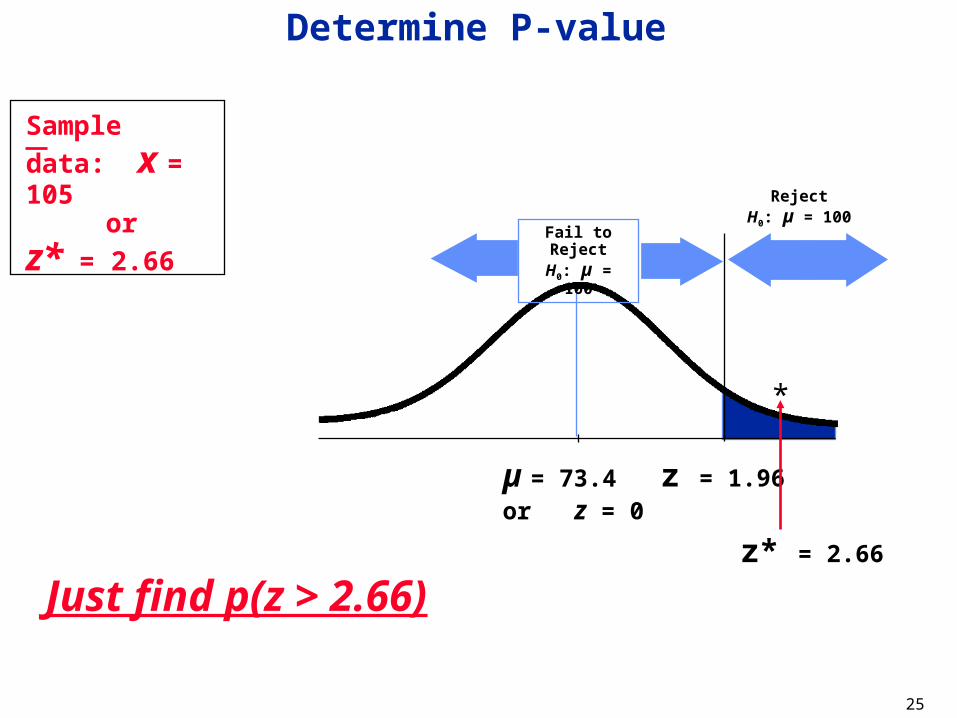
Determine P-value
RejectH0: µ = 100
Sample data:
x = 105 or
z* = 2.66
µ = 73.4or z = 0
z = 1.96
z* = 2.66
Fail to RejectH0: µ = 100
*
Just find p(z > 2.66)
26
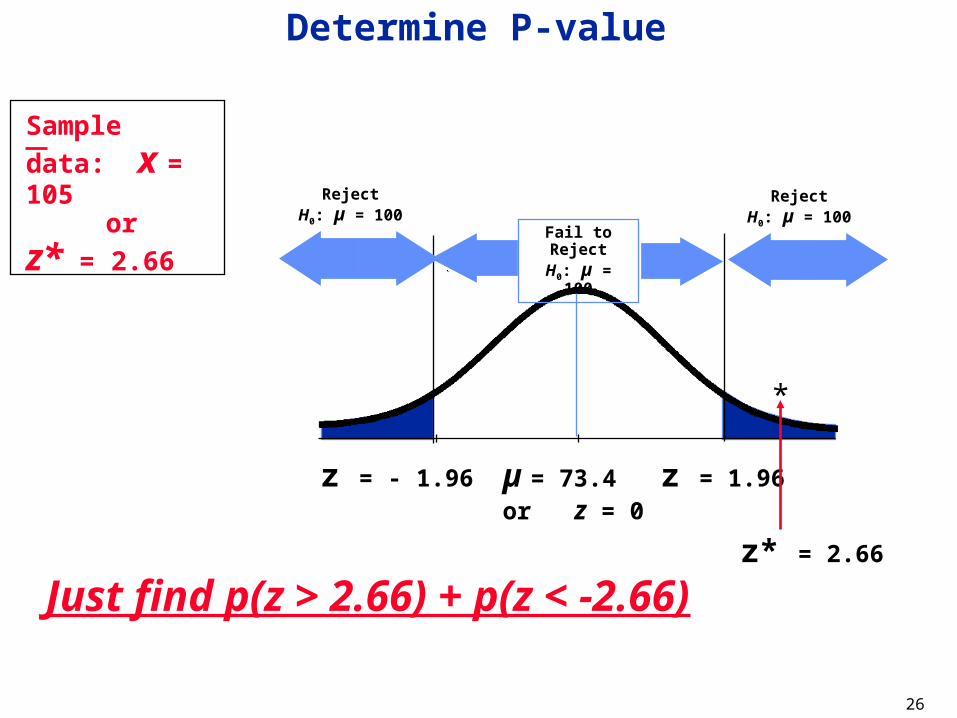
Determine P-value
RejectH0: µ = 100
RejectH0: µ = 100
Sample data:
x = 105 or
z* = 2.66
z = - 1.96 µ = 73.4or z = 0
z = 1.96
z* = 2.66
Fail to RejectH0: µ = 100
*
Just find p(z > 2.66) + p(z < -2.66)
27
Conclusions in Hypothesis Testing
Always test the null hypothesis
Choose one of two possible conclusions
1. Reject the H0
2. Fail to reject the H0
28
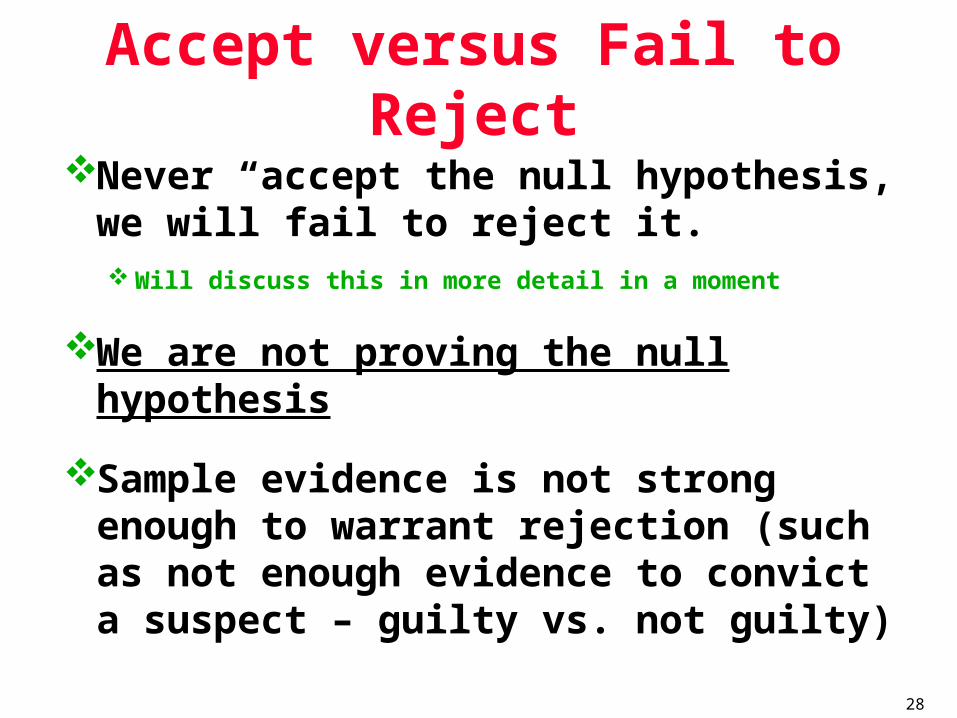
Accept versus Fail to Reject
Never “accept the null hypothesis, we will fail to reject it. Will discuss this in more detail in a moment
We are not proving the null hypothesis
Sample evidence is not strong enough to warrant rejection (such as not enough evidence to convict a suspect – guilty vs. not guilty)
29
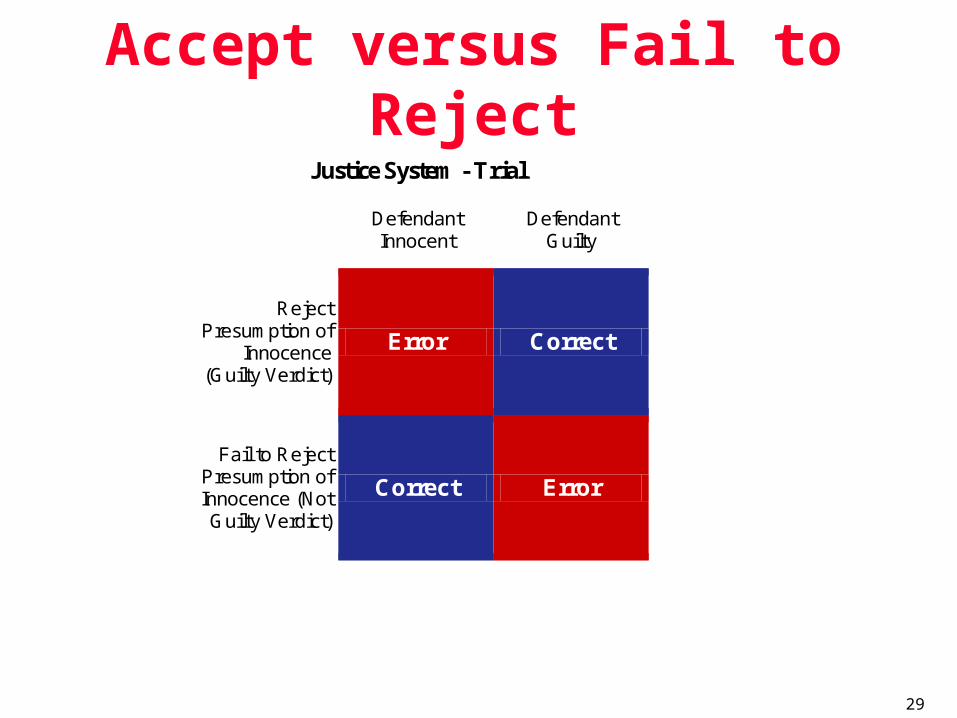
Accept versus Fail to RejectJustice System - Trial
Defendant Innocent
Defendant Guilty
Reject Presumption of
Innocence (Guilty Verdict)
Error Correct
Fail to Reject Presumption of Innocence (Not Guilty Verdict)
Correct Error
30
Conclusions in Hypothesis Testing
Need to formulate correct wording of final conclusion
31
Conclusions in Hypothesis Testing
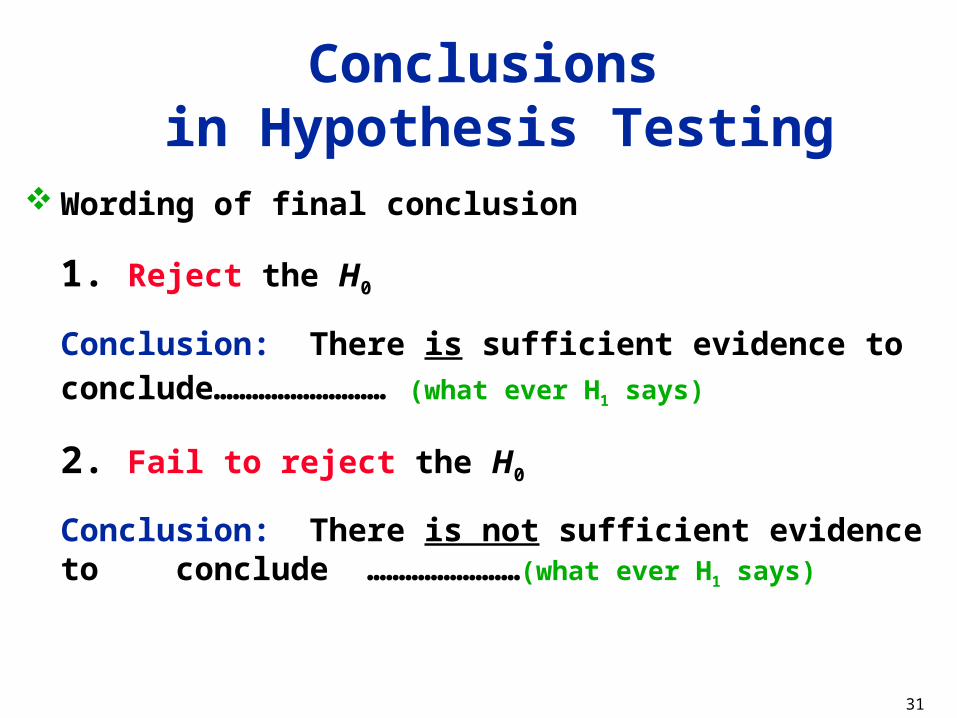
Wording of final conclusion
1. Reject the H0
Conclusion: There is sufficient evidence to conclude……………………… (what ever H1 says)
2. Fail to reject the H0
Conclusion: There is not sufficient evidence to conclude ……………………(what ever H1 says)
32
Example
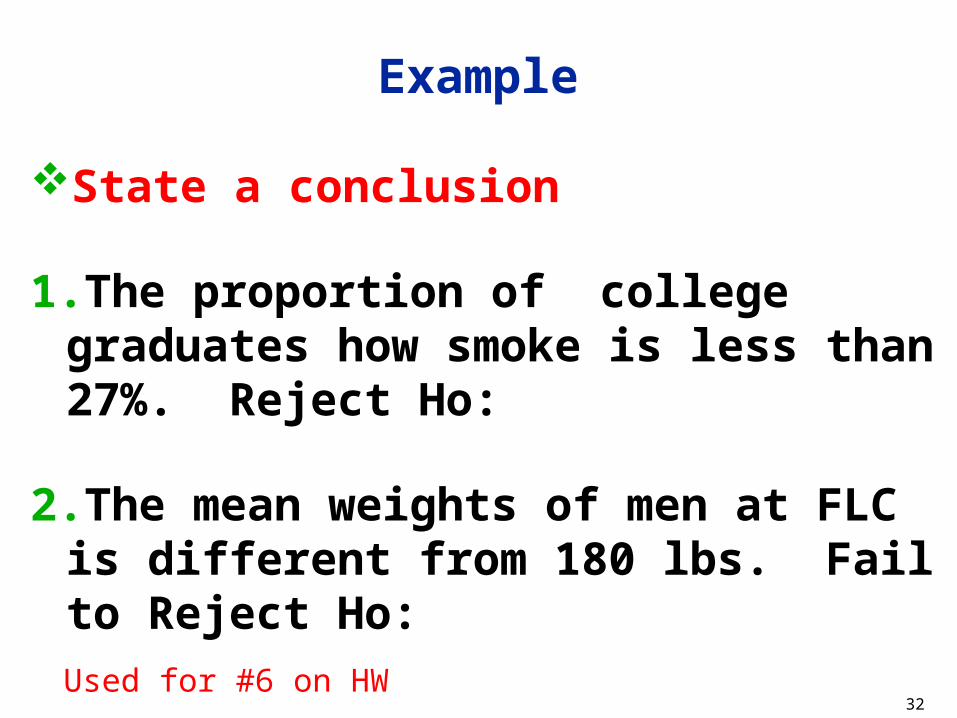
State a conclusion
1.The proportion of college graduates how smoke is less than 27%. Reject Ho:
2.The mean weights of men at FLC is different from 180 lbs. Fail to Reject Ho:
Used for #6 on HW
33
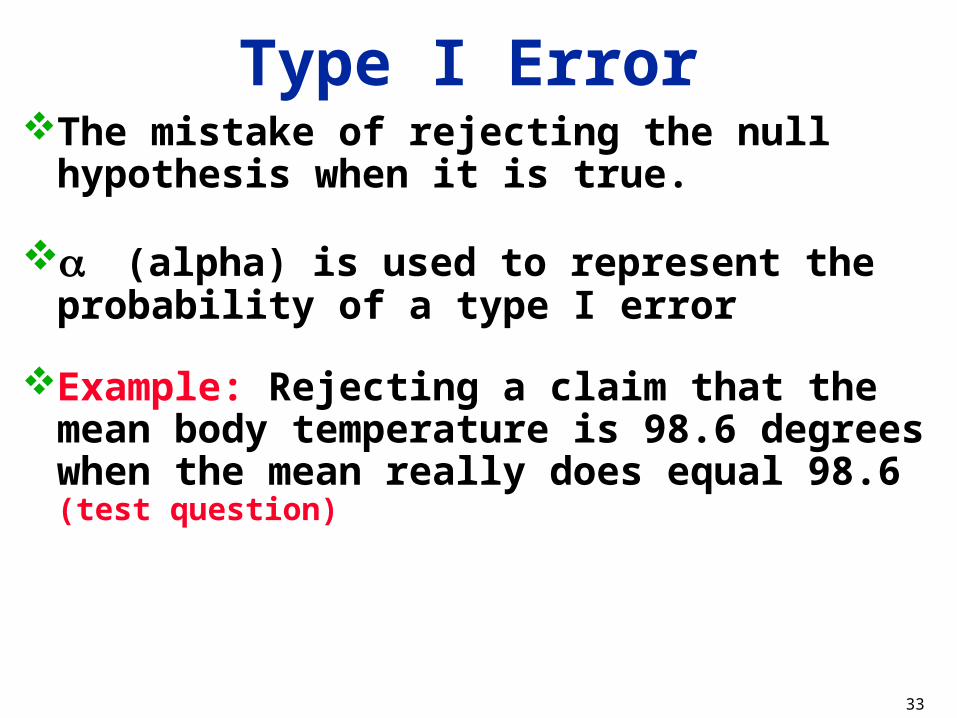
Type I ErrorThe mistake of rejecting the null hypothesis
when it is true.
(alpha) is used to represent the probability of a type I error
Example: Rejecting a claim that the mean body temperature is 98.6 degrees when the mean really does equal 98.6 (test question)
34
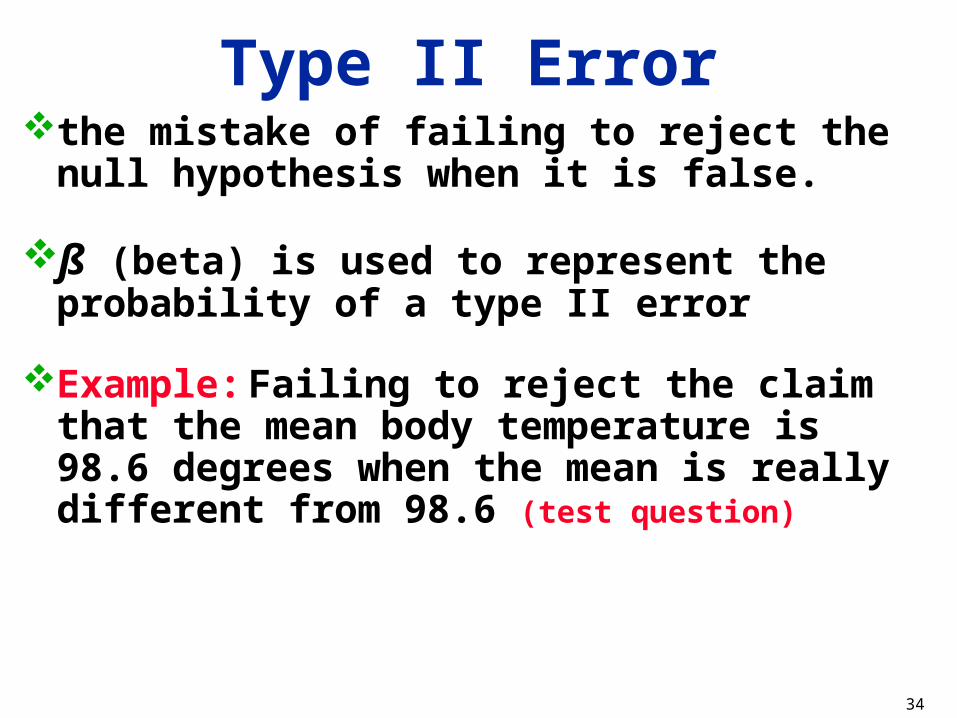
Type II Errorthe mistake of failing to reject the null
hypothesis when it is false.
ß (beta) is used to represent the probability of a type II error
Example: Failing to reject the claim that the mean body temperature is 98.6 degrees when the mean is really different from 98.6 (test question)
35
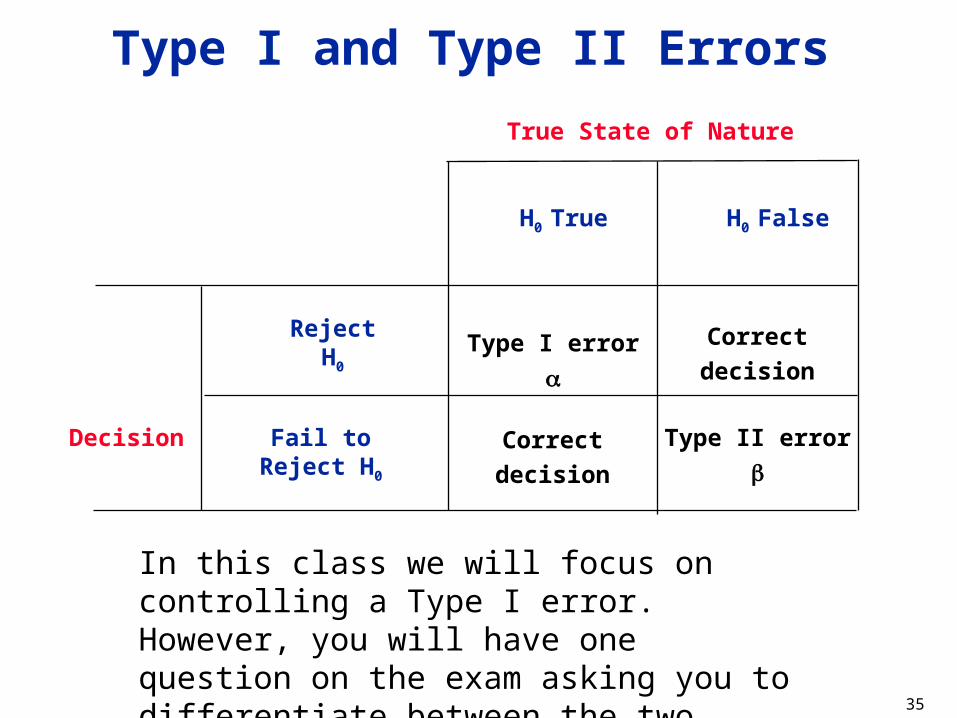
Type I and Type II Errors
True State of Nature
Reject H0 Type I error
Type II error
Correct
decision
Correct
decision
Decision
H0 FalseH0 True
Fail to Reject H0
In this class we will focus on controlling a Type I error. However, you will have one question on the exam asking you to differentiate between the two.
36
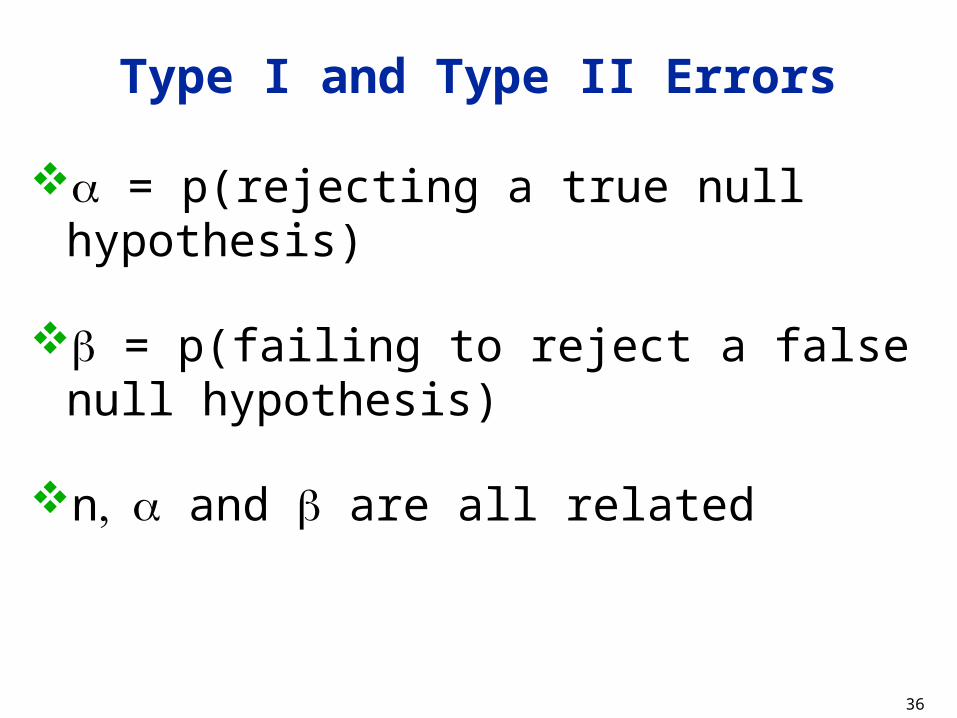
Type I and Type II Errors
= p(rejecting a true null hypothesis)
= p(failing to reject a false null hypothesis)
n and are all related
37
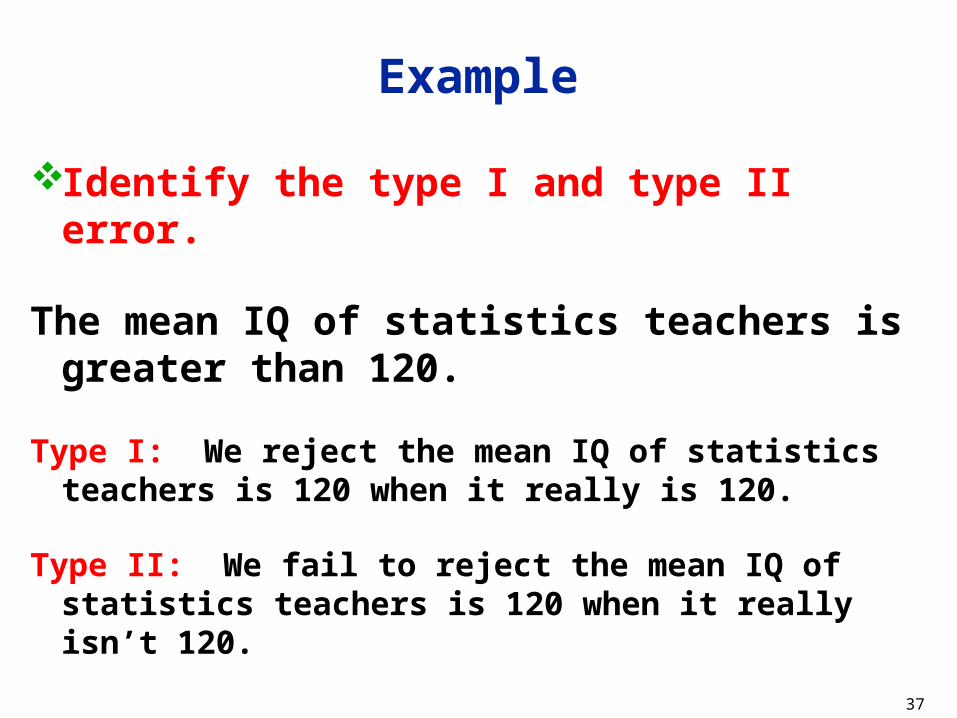
Example
Identify the type I and type II error.
The mean IQ of statistics teachers is greater than 120.
Type I: We reject the mean IQ of statistics teachers is 120 when it really is 120.
Type II: We fail to reject the mean IQ of statistics teachers is 120 when it really isn’t 120.
38
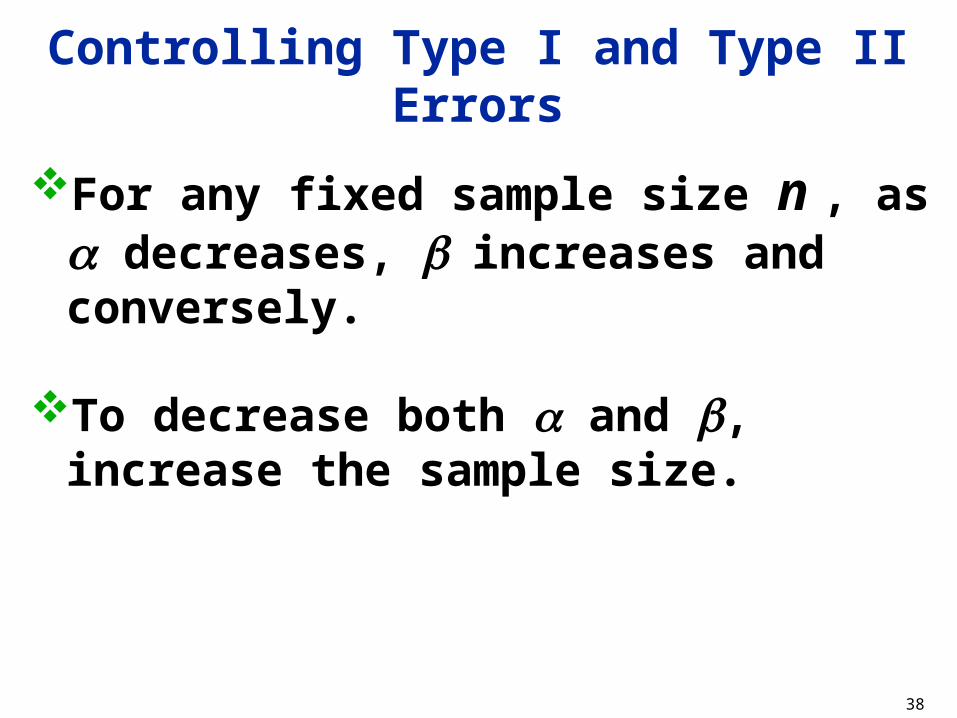
Controlling Type I and Type II Errors
For any fixed sample size n , as decreases, increases and conversely.
To decrease both and , increase the sample size.
39
Definition
Power of a Hypothesis Test
is the probability (1 - ) of rejecting a false null hypothesis.
Note: No exam questions on this. Usually covered in a more advanced class in statistics.
40
7-2
Testing a claim about the mean
(large samples)
41
Traditional (or Classical) Method of Testing Hypotheses
Goal
Identify a sample result that is significantly different from the claimed value
By
Comparing the test statistic to the critical value
42
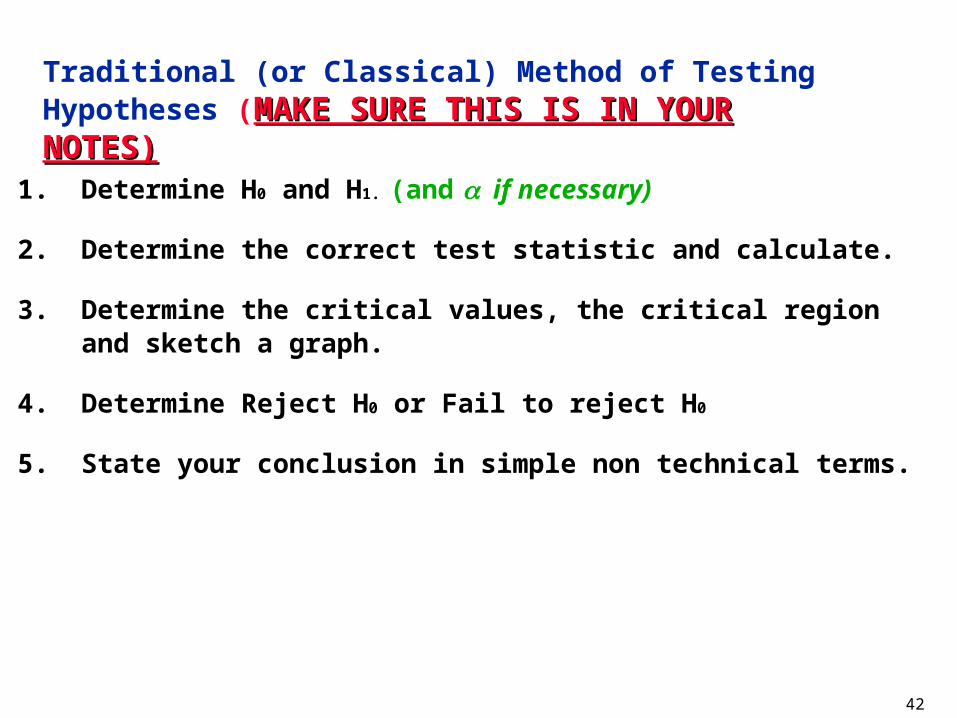
1. Determine H0 and H1. (and if necessary)
2. Determine the correct test statistic and calculate.
3. Determine the critical values, the critical region and sketch a graph.
4. Determine Reject H0 or Fail to reject H0
5. State your conclusion in simple non technical terms.
Traditional (or Classical) Method of Testing Hypotheses (MAKE SURE THIS IS IN YOUR NOTES)MAKE SURE THIS IS IN YOUR NOTES)
43
Can Use
Traditional method
Or
P-value method
Test Statistic for Testing a Claim about a Proportion
44
Three Methods Discussed
1) Traditional method
2) P-value method
3) Confidence intervals
45
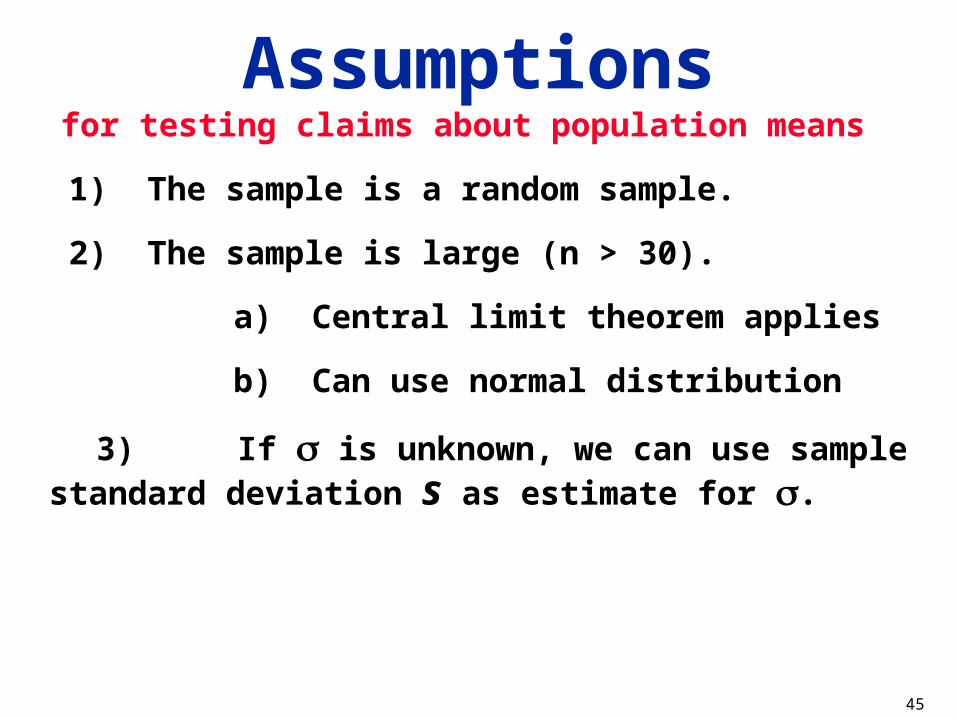
Assumptionsfor testing claims about population means
1) The sample is a random sample.
2) The sample is large (n > 30).
a) Central limit theorem applies
b) Can use normal distribution
3) If is unknown, we can use sample standard deviation s as estimate for .
46
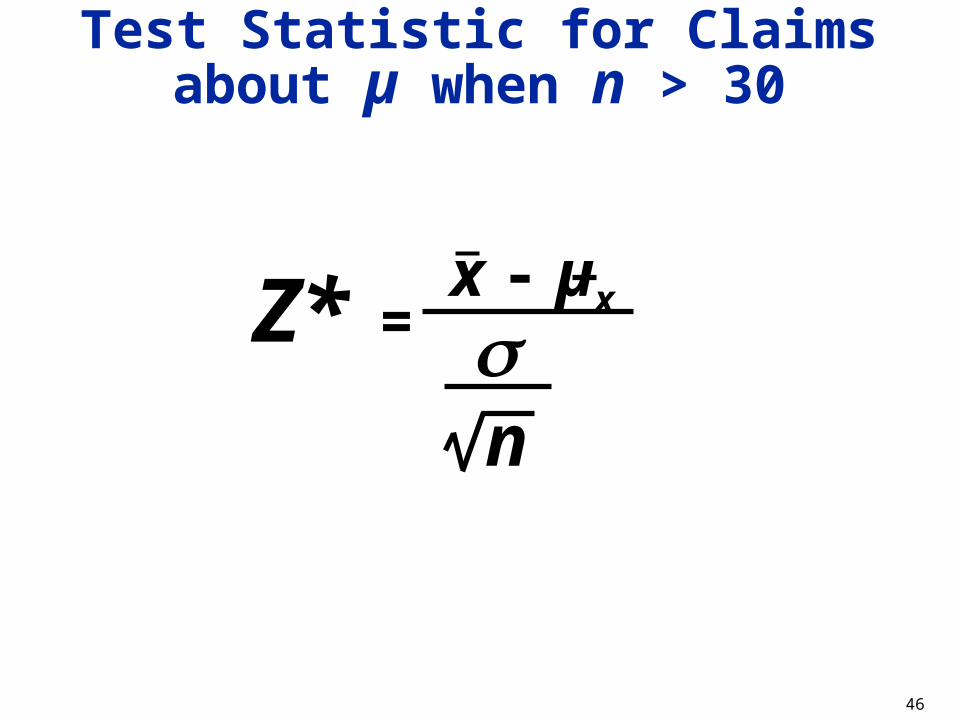
n
x - µx
Test Statistic for Claims about µ when n > 30
Z* =
47
Decision Criterion
Reject the null hypothesis if the test statistic is in the critical region
Fail to reject the null hypothesis if the test statistic is not in the critical region
48
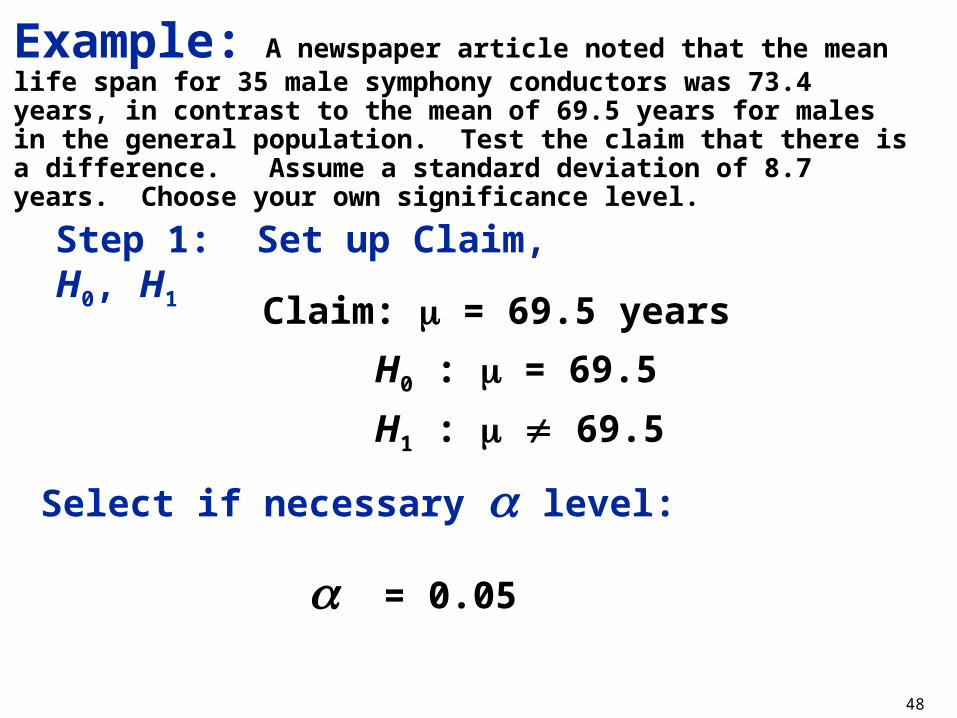
Claim: = 69.5 years
H0 : = 69.5
H1 : 69.5
Step 1: Set up Claim, H0, H1
Select if necessary level:
= 0.05
Example: A newspaper article noted that the mean life span for 35 male symphony conductors was 73.4 years, in contrast to the mean of 69.5 years for males in the general population. Test the claim that there is a difference. Assume a standard deviation of 8.7 years. Choose your own significance level.
49
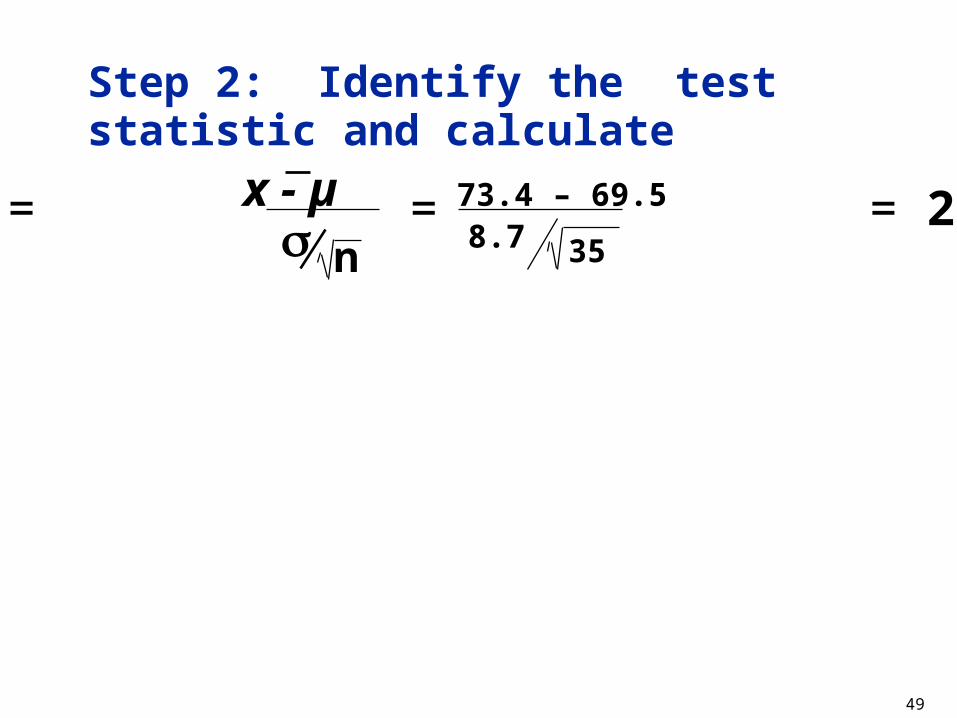
Step 2: Identify the test statistic and calculate
z* = = = 2.65x - µ 73.4 – 69.5
n8.7 35
50
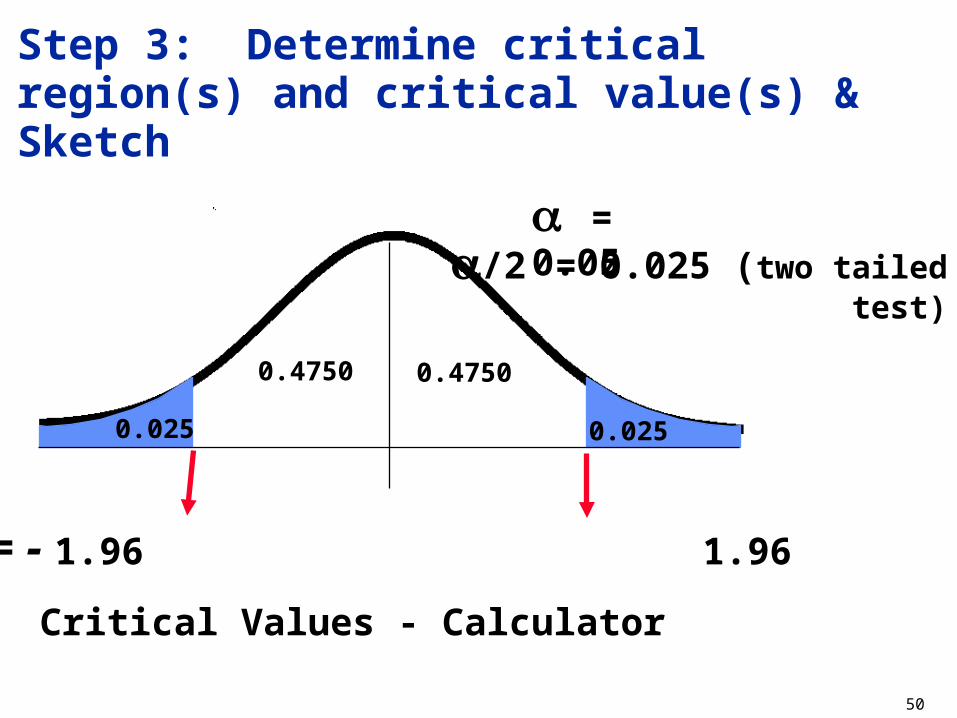
Step 3: Determine critical region(s) and critical value(s) & Sketch
z = - 1.96 1.96
0.0250.025
0.47500.4750
= 0.05/2 = 0.025 (two tailed test)
Critical Values - Calculator
51
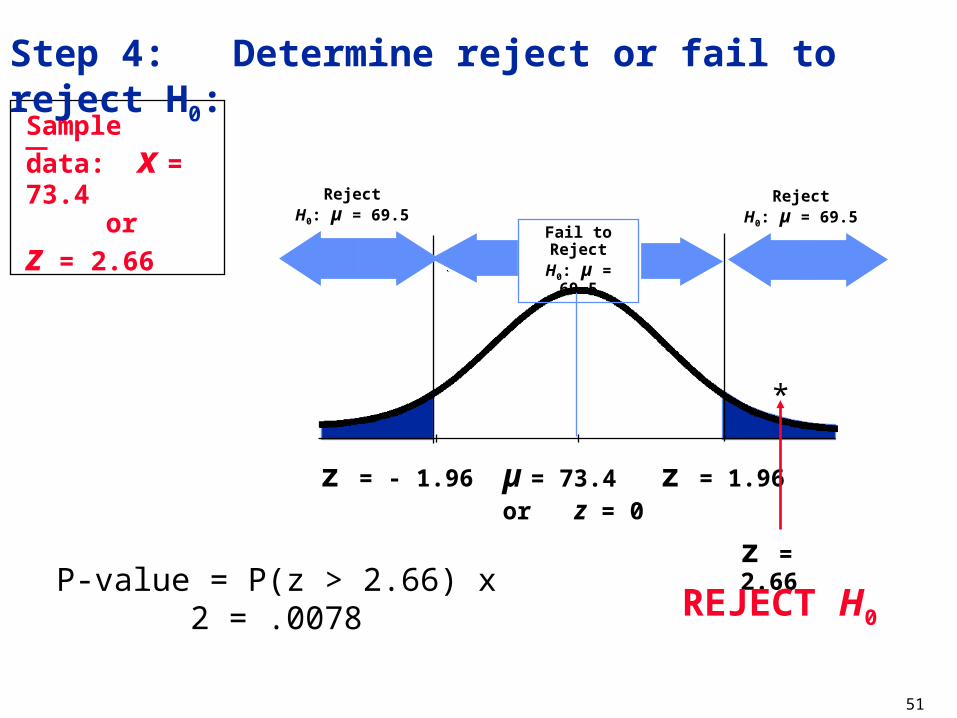
Step 4: Determine reject or fail to reject H0:
RejectH0: µ = 69.5
RejectH0: µ = 69.5
Sample data:
x = 73.4 or
z = 2.66
z = - 1.96 µ = 73.4or z = 0
z = 1.96
z = 2.66
Fail to RejectH0: µ = 69.5
*
REJECT H0
P-value = P(z > 2.66) x 2 = .0078
52
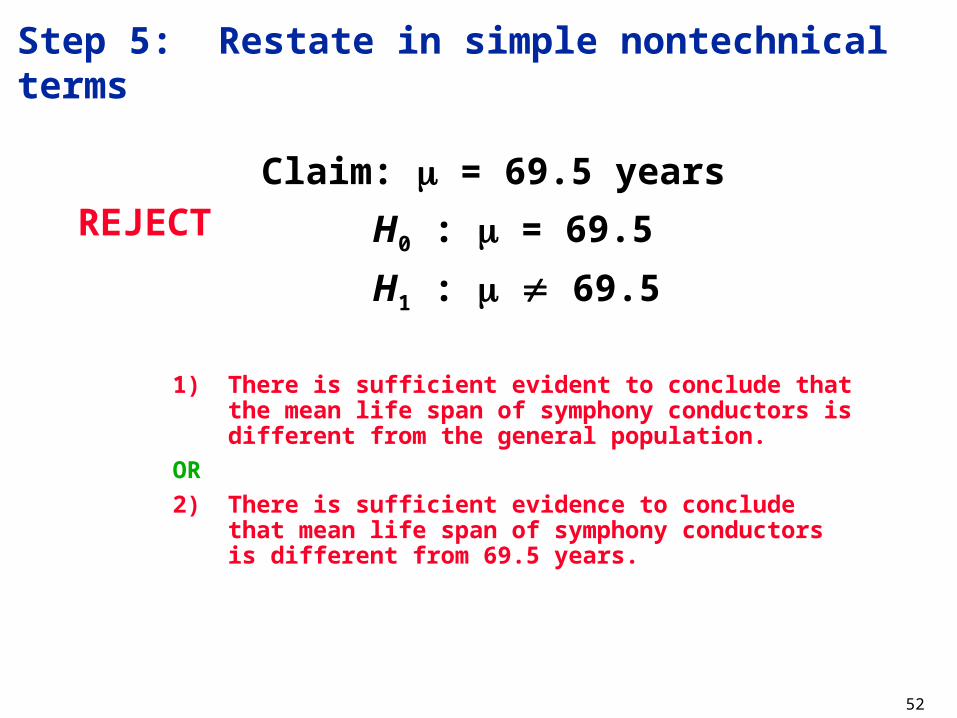
Step 5: Restate in simple nontechnical terms
REJECT Claim: = 69.5 years
H0 : = 69.5
H1 : 69.5
1) There is sufficient evident to conclude that the mean life span of symphony conductors is different from the general population.
OR
2) There is sufficient evidence to conclude that mean life span of symphony conductors is different from 69.5 years.
53
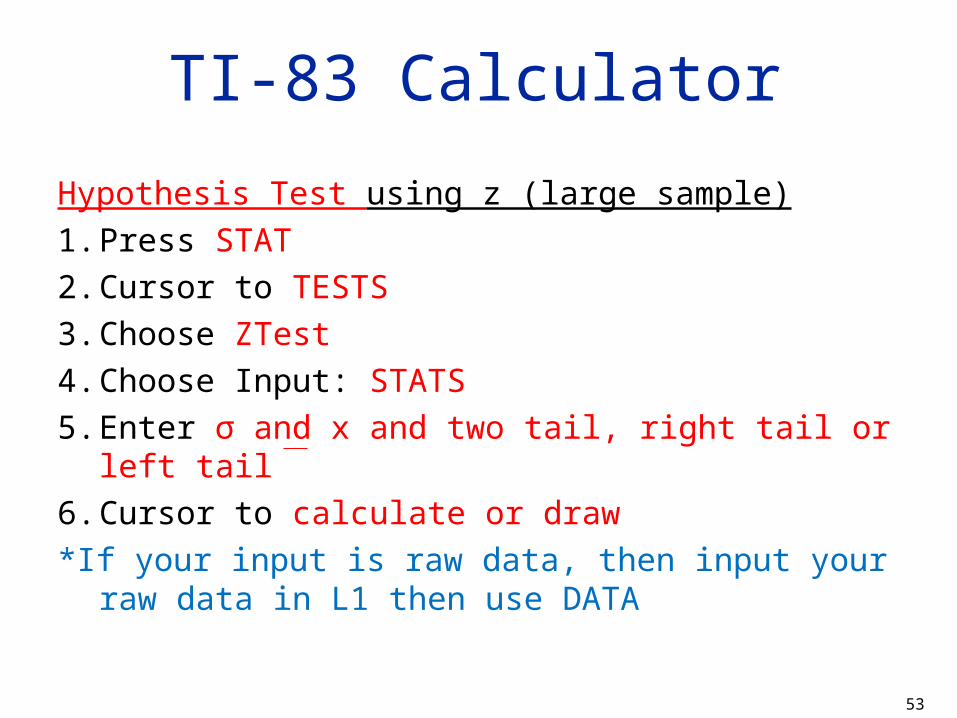
TI-83 Calculator
Hypothesis Test using z (large sample)
1. Press STAT
2. Cursor to TESTS
3. Choose ZTest
4. Choose Input: STATS
5. Enter σ and x and two tail, right tail or left tail 6. Cursor to calculate or draw
*If your input is raw data, then input your raw data in L1 then use DATA
54
Testing Claims with Confidence Intervals
• We reject a claim that the population parameter has a value that is not included in the confidence interval
• Typically only used for two-tailed tests
• For one-tailed test the degree of confidence would be 1 – 2(don’t worry about this)
55
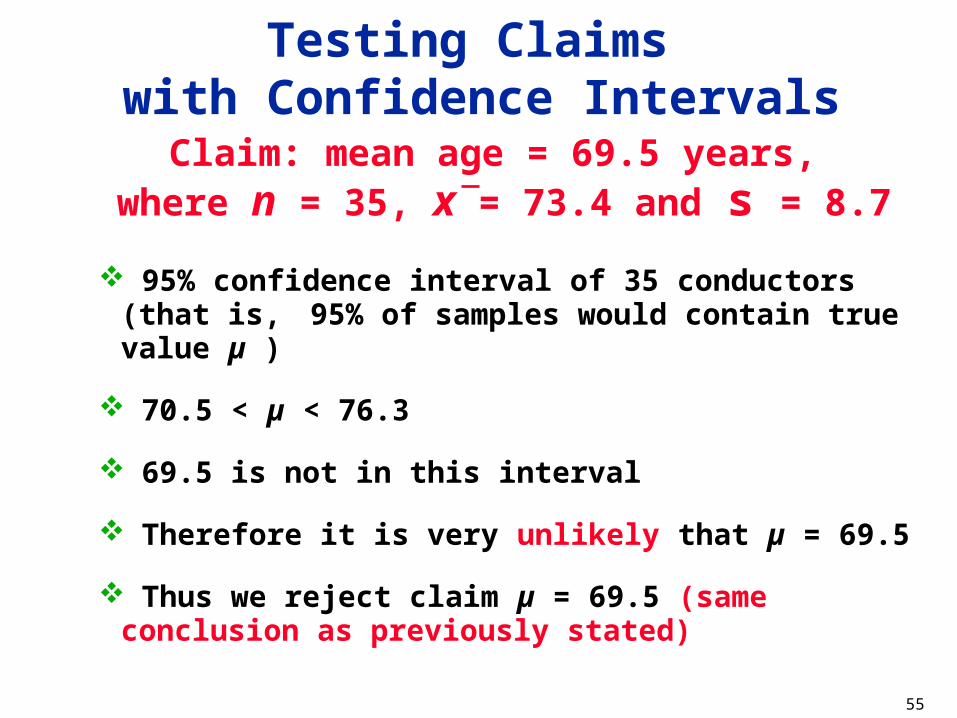
Testing Claims with Confidence Intervals
95% confidence interval of 35 conductors (that is, 95% of samples would contain true value µ )
70.5 < µ < 76.3
69.5 is not in this interval
Therefore it is very unlikely that µ = 69.5
Thus we reject claim µ = 69.5 (same conclusion as previously stated)
Claim: mean age = 69.5 years, where n = 35, x = 73.4 and s = 8.7
56
7- 3
Testing a claim about the mean
(small samples)
57
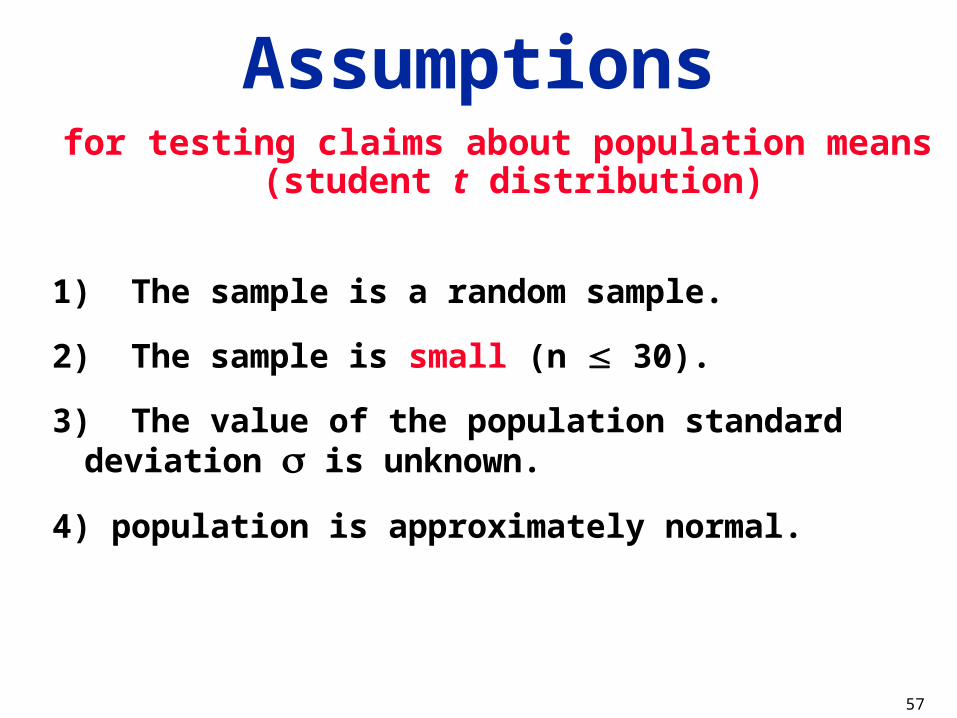
Assumptionsfor testing claims about population means (student
t distribution)
1) The sample is a random sample.
2) The sample is small (n 30).
3) The value of the population standard deviation is unknown.
4) population is approximately normal.
58
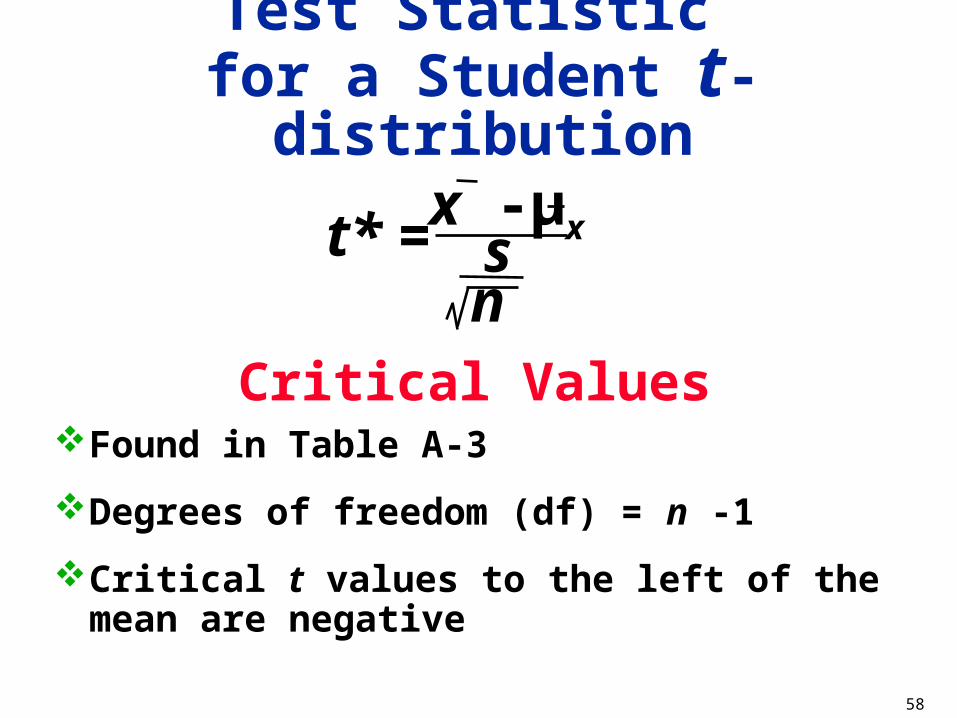
Test Statistic for a Student t-distribution
Critical ValuesFound in Table A-3
Degrees of freedom (df) = n -1
Critical t values to the left of the mean are negative
t* = x -µxsn
59
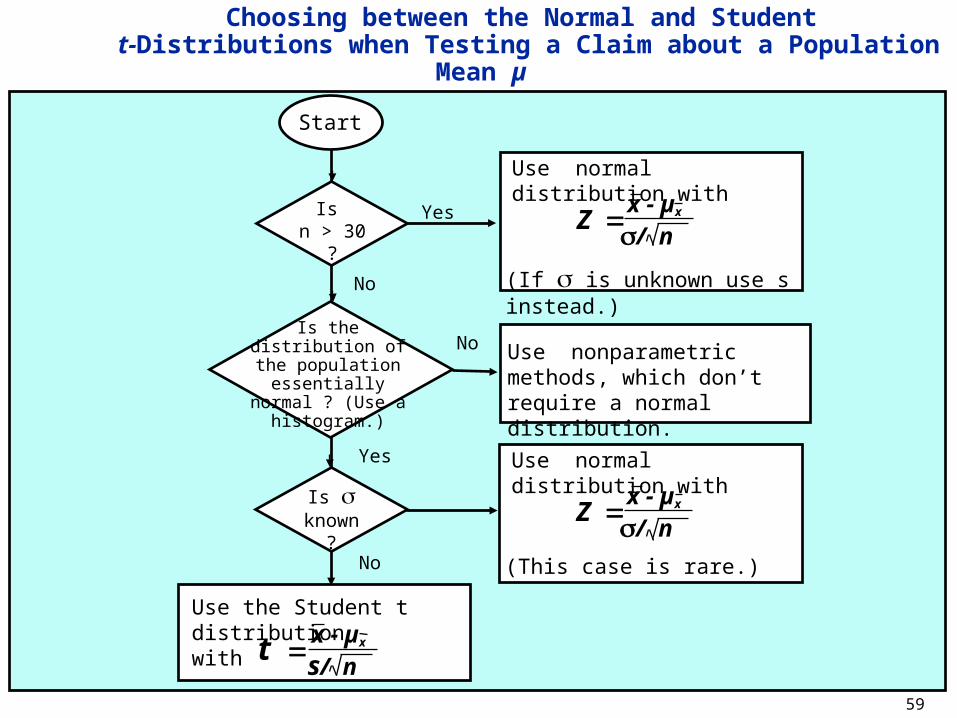
Choosing between the Normal and Student t-Distributions when Testing a Claim about a Population Mean µ
Is n > 30
?
Is thedistribution of
the population essentiallynormal ? (Use a
histogram.)
No
Yes
Yes
No
No
Is known
?
Use normal distribution with
x - µx
/ nZ
(If is unknown use s instead.)
Use nonparametric methods, which don’t require a normal distribution.
Use normal distribution with
x - µx
/ nZ
(This case is rare.)
Use the Student t distributionwith x - µx
s/ nt
Start
60
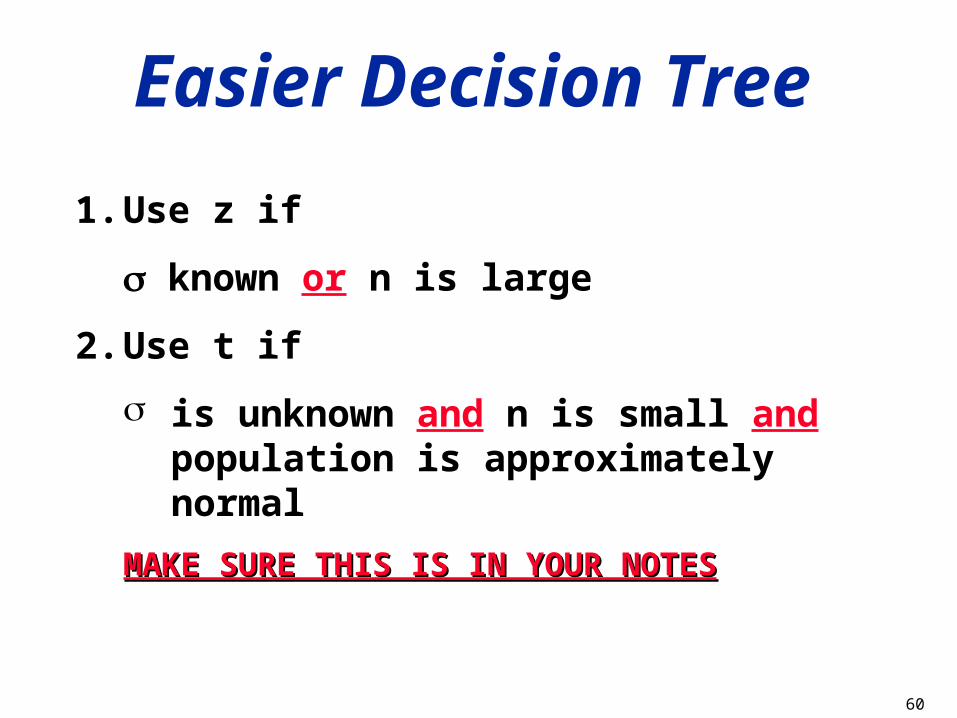
Easier Decision Tree
1. Use z if
known or n is large
2. Use t if
is unknown and n is small and population is approximately normal
MAKE SURE THIS IS IN YOUR NOTESMAKE SURE THIS IS IN YOUR NOTES
61
P-Value Method
Table A-3 includes only selected values of
Specific P-values usually cannot be found from table
Use Table to identify limits that contain the P-value – very confusing
Some calculators and computer programs will find exact P-values

62
TI-83 Calculator
Hypothesis Test using t (small sample)
1. Press STAT
2. Cursor to TESTS
3. Choose TTest
4. Choose Input: STATS
5. Enter s and x and two tail, right tail or left tail 6. Cursor to calculate or draw
*If your input is raw data, then input your raw data in L1 then use DATA
63
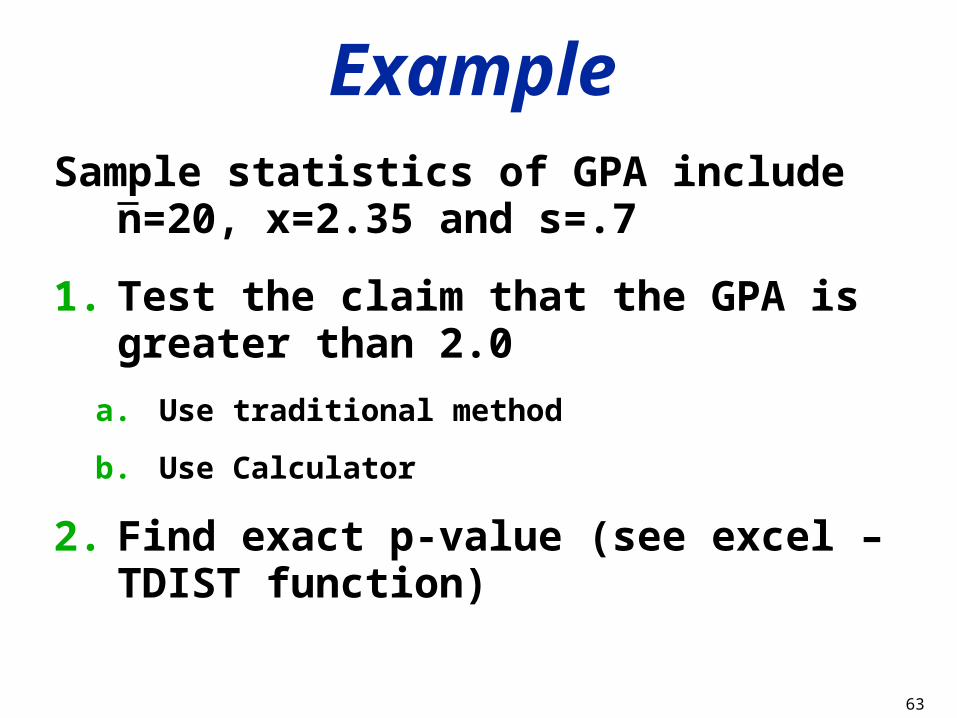
ExampleSample statistics of GPA include n=20,
x=2.35 and s=.7
1. Test the claim that the GPA is greater than 2.0
a. Use traditional method
b. Use Calculator
2. Find exact p-value (see excel – TDIST function)
64
7-4
Testing a claim about a proportion
65
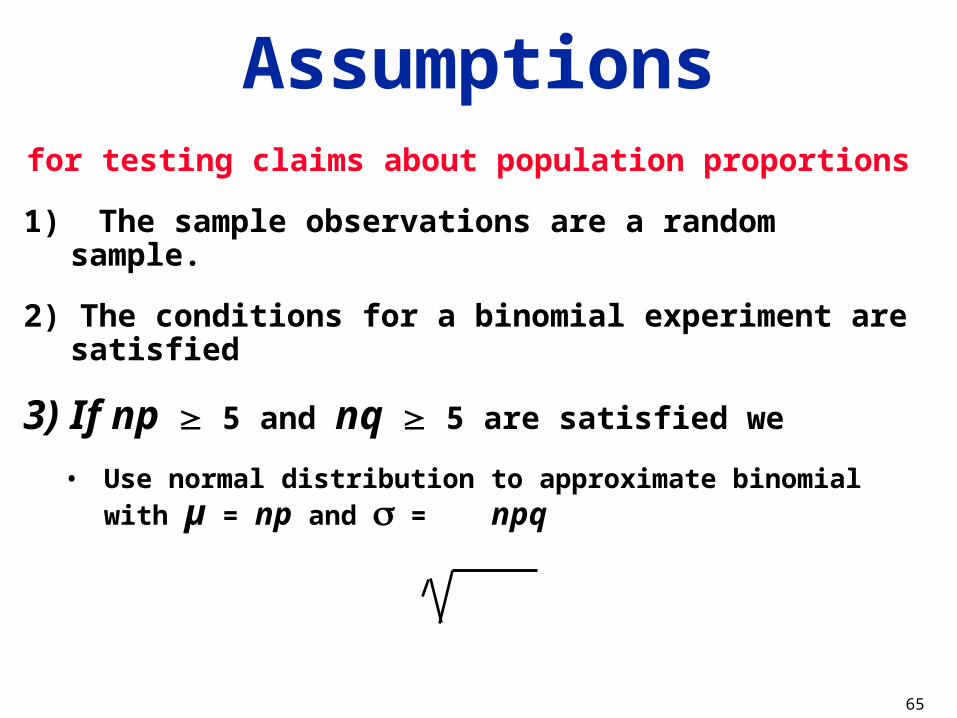
Assumptionsfor testing claims about population proportions
1) The sample observations are a random sample.
2) The conditions for a binomial experiment are satisfied
3) If np 5 and nq 5 are satisfied we
• Use normal distribution to approximate binomial with µ = np and = npq
66
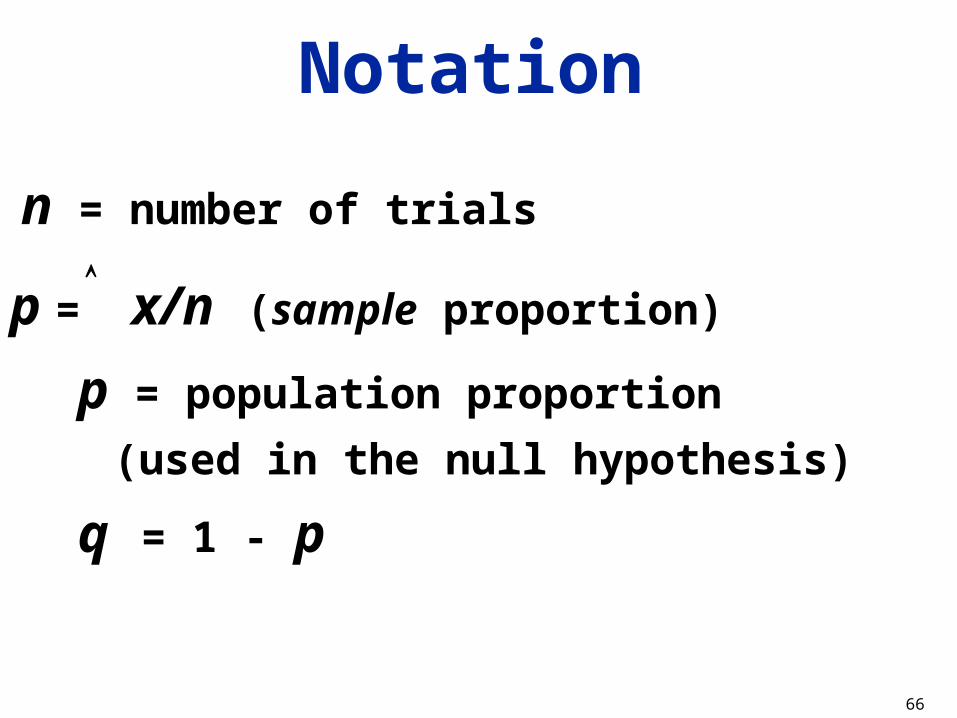
Notation
p = population proportion (used in the
null hypothesis)
q = 1 - p
n = number of trials
p = x/n (sample proportion)
67
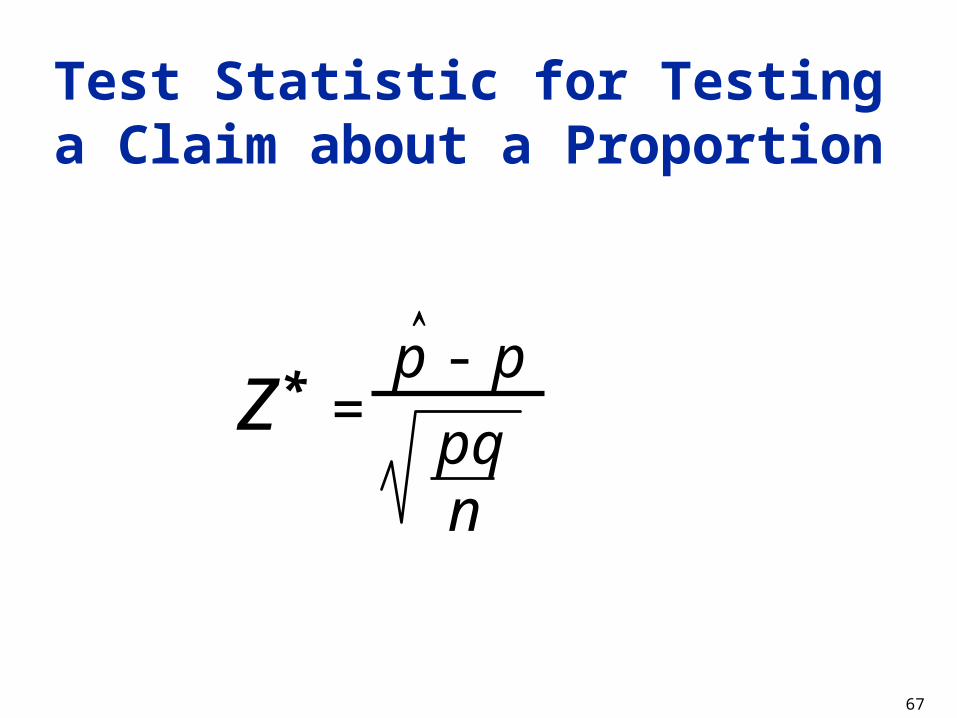
p - p
pqn
z* =
Test Statistic for Testing a Claim about a Proportion
68
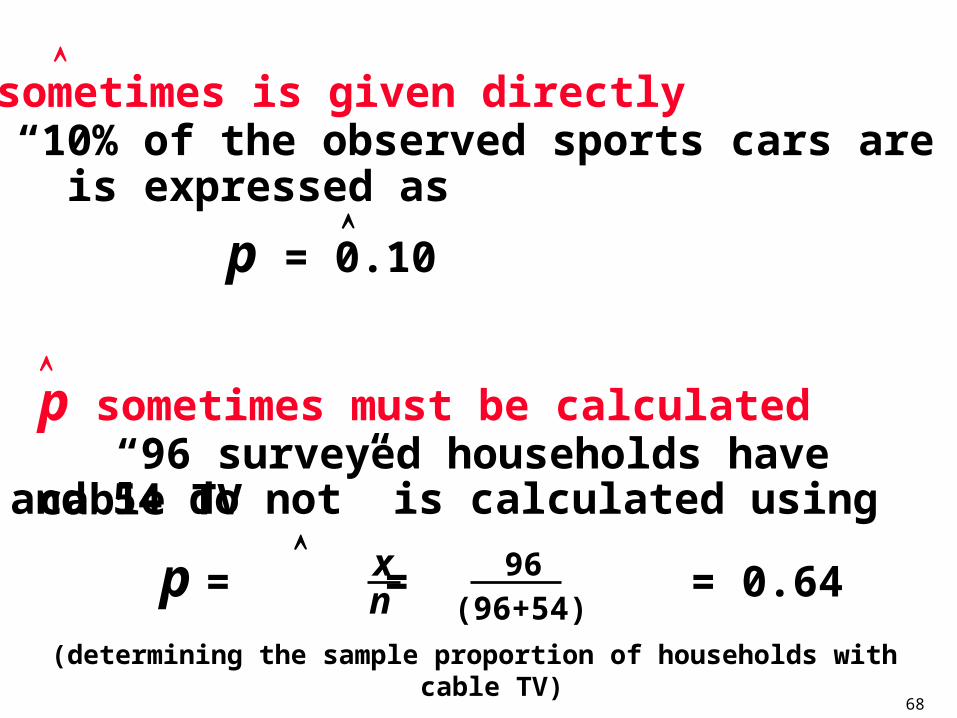
(determining the sample proportion of households with cable TV)
p sometimes is given directly “10% of the observed sports cars are red” is expressed as
p = 0.10
p sometimes must be calculated “96 surveyed households have cable TV
and 54 do not” is calculated using
p = = = 0.64xn
96 (96+54)
69
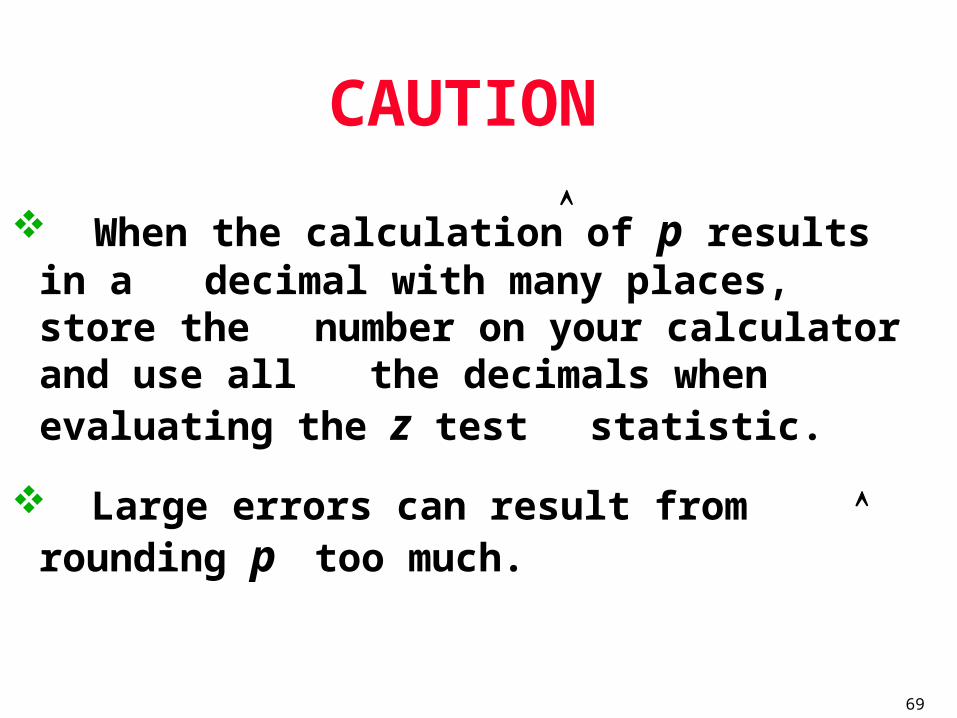
CAUTION
When the calculation of p results in a decimal with many places, store the number on your calculator and use all the decimals when evaluating the z test statistic.
Large errors can result from rounding p too much.
70
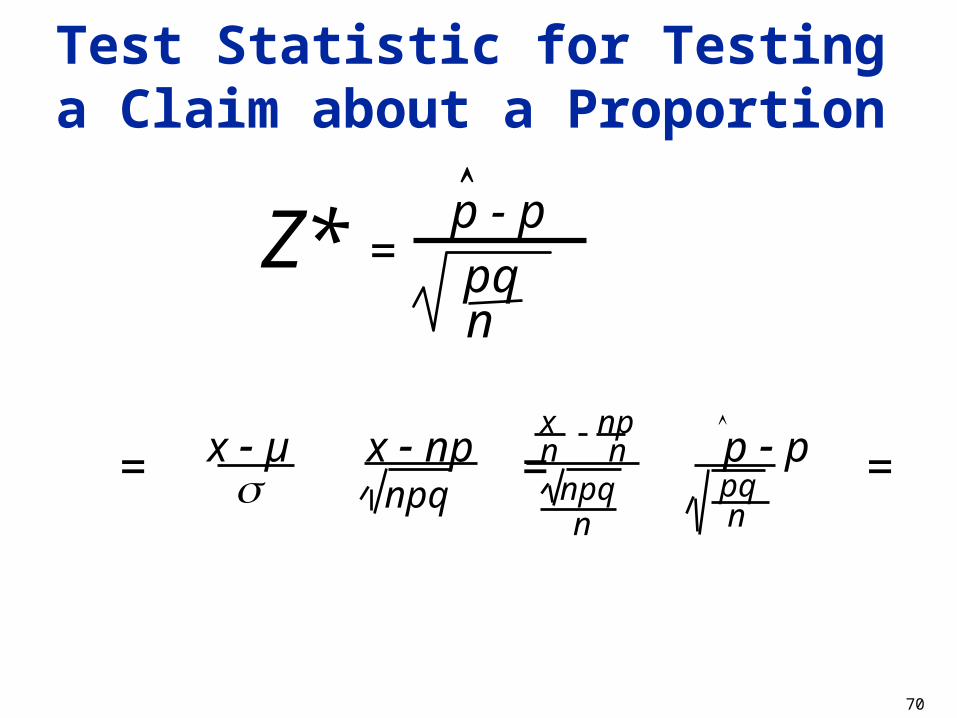
Test Statistic for Testing a Claim about a Proportion
p - ppqn
Z* =
z = = = = x - µ x - np n n p - px np
npq npq pqn n
71
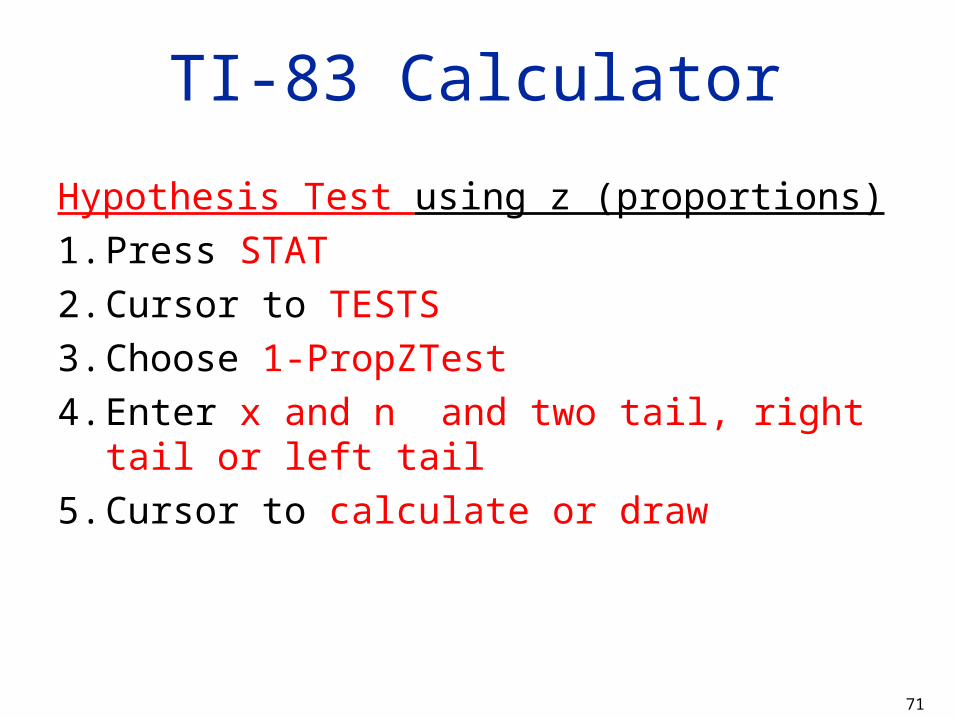
TI-83 Calculator
Hypothesis Test using z (proportions)
1. Press STAT
2. Cursor to TESTS
3. Choose 1-PropZTest
4. Enter x and n and two tail, right tail or left tail 5. Cursor to calculate or draw