Embed Size (px)
Citation preview

1
Class 7
Measurement Issues in Research with Diverse Populations Including Health Disparities
Research
November 5, 2009
Anita L. Stewart Institute for Health & Aging
University of California, San Francisco

2
Overview of Class 7
Background: culture-specific versus generic measures
Conceptual and psychometric adequacy and equivalence– Adequacy in one group
– Equivalence across groups

3
Background
U.S. population becoming more diverse Minority groups are being included in
research due to:– NIH mandate (1993 – women and
minorities)
– Health disparities initiatives

4
Types of Diverse Groups
Health disparities research focuses on differences in health between …– Minority vs. non-minority
– Lower income vs. others
– Lower education vs. others
– Limited English Proficiency (LEP) vs. others
– …. and many others
5
Measurement Implications of Research in Diverse Groups
Most self-reported measures were developed and tested in mainstream, well-educated groups
Little information is available on appropriateness, reliability, validity, and responsiveness in diverse groups– Although this is changing rapidly

6
Measurement Adequacy vs. Measurement Equivalence
Adequacy - within a “diverse” group– concepts are appropriate and relevant– psychometric properties meet minimal criteria
» Good variability » Reliable and valid» Sensitive to change over time
Equivalence - between “diverse” groups– conceptual and psychometric properties are
comparable

7
Why Not Use Culture-Specific Measures?
Measurement goal is to identify measures that can be used across all groups in one study, yet maintain sensitivity to diversity and have minimal bias
Most health disparities studies compare mean scores across diverse groups

8
Generic/Universal vs Group-Specific(Etic versus Emic)
Concepts unlikely to be defined exactly the same way across diverse ethnic groups
Generic/universal (etic)– features of a concept that are appropriate across
groups Group-Specific (emic)
– idiosyncratic or culture-specific portions of a concept

9
Etic versus Emic (cont.)
Goal in health disparities research with more than one group:– identify generic/universal portion of a concept that are
applicable across all groups For within-group studies:
– the culture-specific portion is also relevant

10
Overview of Class 7
Background: culture-specific versus generic measures
Conceptual and psychometric adequacy and equivalence– Adequacy in one group
– Equivalence across groups

11
Conceptual and Psychometric Adequacy and Equivalence
Conceptual
Psychometric
Adequacyin 1 Group
EquivalenceAcross Groups
Concept equivalentacross groups
Psychometric propertiesmeet minimal standards
within one group
Psychometric propertiesinvariant (equivalent)
across groups
Concept meaningfulwithin one group

12
Left Side of Matrix: Adequacy in a Single Group
Conceptual
Psychometric
Adequacyin 1 Group
EquivalenceAcross Groups
Concept equivalentacross groups
Psychometric propertiesmeet minimal standards
within one group
Psychometric propertiesinvariant (equivalent)
across groups
Concept meaningfulwithin one group

13
Ride Side of Matrix: Equivalence in More Than One Group
Conceptual
Psychometric
Adequacyin 1 Group
EquivalenceAcross Groups
Concept equivalentacross groups
Psychometric propertiesmeet minimal standards
within one group
Psychometric propertiesinvariant (equivalent)
across groups
Concept meaningfulwithin one group

14
Overview of Class 7
Background: culture-specific versus generic measures
Conceptual and psychometric adequacy and equivalence– Adequacy in one group
– Equivalence across groups

15
Approaches to Explore Conceptual Adequacy in Diverse Groups
Literature reviews of concepts and measures
In-depth interviews and focus groups – discuss concepts, obtain their views
Expert consultation from diverse groups– review concept definitions– rate relevance of items

16
Basis: Published Review - Physical Activity Measures for Minority Women
WHI convened experts to identify issues in measuring PA in minority and older women
Some conclusions:– Add culturally sensitive activities (e.g., walking for
transportation and errands)– Measure intermittent activities – Phrases “leisure time, free time, spare time” (used to denote
non-occupational activities) not understood Review can help select appropriate measures and adapt
as needed
LC Masse et al., J Women’s Health, 1998;7:57-67.

17
Basis: Published Review - Measures of Dietary Intake in Minority Populations
Reviewed food frequency questionnaires for appropriateness for minority populations– method of development, minority-group specific
features, reliability, validity, and systematic bias Group differences that could affect scores:
– Portion sizes differ– Missing common foods of minority groups/cultures
Would underestimate total intake and nutrients
RJ Coates et al. Am J Clin Nutr; 1997;65(suppl):1108S-15S.

18
A Structured Method for Examining Conceptual Relevance
Compiled set of 33 HRQL items Assessed relevance to older African Americans After each question, asked “how relevant is this
question to the way you think about your health?”– Response scale: 0-10 scale with endpoints labeled– 0=not at all relevant, 10=extremely relevant
Cunningham WE et al., Qual Life Res, 1999;8:749-768.
19
HRQL Relevance Results
Most relevant items:– Spirituality, weight-related health,
hopefulness
– Spirituality items Least relevant items:
– Physical functioning, role limitations due to emotional problems

20
Qualitative Research: Expert Panel Reviewed Spanish FACT-G
Functional Assessment of Cancer Therapy – General (FACT-G)
Bilingual/bicultural panel reviewed items for conceptual relevance to Hispanics– One item had low relevance (I worry about dying)
» Added new item "I worry my condition will get worse" – One domain missing – spirituality
» Developed new spirituality scale (FACIT-Sp) with input from cancer patients, psychotherapists, and religious experts
D Cella et al. Med Care 1998: 36;1407

21
Example of Inadequate Concept
Patient satisfaction typically conceptualized in mainstream populations in terms of, e.g.,– access, technical care, communication,
continuity, interpersonal style In minority and low income groups,
additional relevant domains include, e.g., – discrimination by health professionals– sensitivity to language barriers
MN Fongwa et al., Ethnicity Dis, 2006;16(3):948-955.

22
Measuring Park/Recreation Environments in Low-Income Communities
New policy focus on how environments promote physical activity– Many good new measures
None considered concerns or environments of lower-income minority communities
MF Floyd et al. Am J Prev Med, 2009;36:S156-S160.

23
Measuring Park/Recreation Environments in Low-Income Communities (cont)
Recommendations: In low-income communities of color:– Identify and address most salient
environmental needs– Incorporate research on preferred
recreational activities– Ensure representation of perceptions of
residents
MF Floyd et al. Am J Prev Med, 2009;36:S156-S160.

24
Psychometric Adequacy in any Group
Minimal standards:– Sufficient variability
– Minimal missing data
– Adequate reliability/reproducibility
– Evidence of construct validity
– Evidence of sensitivity to change

25
Overview of Class 7
Background: culture-specific versus generic measures
Conceptual and psychometric adequacy and equivalence
– Adequacy in one group– Equivalence across groups

26
Conceptual Equivalence Across Groups
Conceptual
Psychometric
Adequacyin 1 Group
EquivalenceAcross Groups
Concept equivalentacross groups
Psychometric propertiesmeet minimal standards
within one group
Psychometric propertiesinvariant (equivalent)
across groups
Concept meaningfulwithin one group

27
Conceptual Equivalence
Is the concept relevant, familiar, acceptable to all diverse groups being studied?
Is the concept defined the same way in all groups? – all relevant “domains” included (none missing)
– interpreted similarly

28
Obtain Perspective of All Diverse Groups on Concept
Develop concept
Create item pool
Pretest/revise
Field survey
Psychometric analyses
Final measures
Obtain perspectives of diverse groups

29
Example: Developing Concept of Interpersonal Processes of Care
IPC IIconceptualframework
IPC Version I frameworkin Milbank Quarterly
19 new focus groups -African American, Latino,and White adults
Literature review of quality
of care in diverse groups

30
IPC-II Conceptual Framework: 91 items
I. COMMUNICATION III. INTERPERSONAL STYLE General clarity Respectfulness Elicitation/responsiveness Courteousness Explanations of Perceived discrimination --processes, condition, Emotional support self-care, meds Cultural sensitivity Empowerment II. DECISION MAKING Responsive to patient preferences Consider ability to comply

31
IPC-II Conceptual Framework (cont)
IV. OFFICE STAFF Respectfulness Discrimination V. FOR LIMITED ENGLISH PROFICIENCY PATIENTS MD’s and office staff’s sensitivity to language

32
Psychometric Equivalence
Conceptual
Psychometric
Adequacyin 1 Group
EquivalenceAcross Groups
Concept equivalentacross groups
Psychometric propertiesmeet minimal standards
within one group
Psychometric propertiesinvariant (equivalent)
across groups
Concept meaningfulwithin one group

33
Psychometric or Measurement Equivalence
When comparing groups (as in health disparities research):– Measures should have similar or equivalent
measurement properties in all diverse groups of interest in your study» e.g., English and Spanish, African Americans
and Caucasians

34
Psychometric Equivalence Across Groups
Psychometric characteristics should be “equivalent” across all groups:– Sufficient variability– Minimal missing data– Reliability/reproducibility– Construct validity– Sensitivity to change

35
Bias (Systematic Error) - A Special Concern
Observed group mean differences in a measure can be due to:– Culturally- or group-mediated differences in
true score (true differences) -- OR --
– Bias - systematic differences between observed scores not attributable to true scores

36
Random versus Systematic Error
Observed true item score score
= + error random
systematic
Relevant to reliability
Relevant to validity
37
Bias (Systematic Error) - A Special Concern (cont)
Measurement bias may make group comparisons invalid
Bias can be due to group differences in:– the meaning of concepts or items – the extent to which measures represent a concept – cognitive processes of responding– use of response scales– appropriateness of data collection methods

38
Bias or “Systematic Difference”?
Bias refers to “deviation from true score” Cannot speak of a measure being “biased” in
one group compared to another w/o knowing true score
Preferred term: differential “item” functioning (DIF)– Item (or measure) that has a different meaning
in one group than another

39
Item Equivalence
Differential Item Functioning (DIF)– Items are non-equivalent if they are
differentially related to the underlying trait Meaning of response categories is
similar across groups Distance between response categories is
similar across groups

40
Methods for Identifying Differential Item Functioning (DIF)
Item Response Theory (IRT) Examines each item in relation to underlying
latent trait Tests if responses to one item predict the
underlying latent “score” similarly in two groups– if not, items have “differential item functioning”

41
Example of Effect of Biased Items
5 CES-D items administered to Black and White men– 1 item subject to differential item functioning (bias)
5-item scale including item suggested that Black men had more somatic symptoms than White men (p < .01)
4-item scale excluding biased item showed no differences
S Gregorich, Med Care, 2006;44:S78-S94.

42
Equivalence of Response Choices: Spanish and English Self-rated Health
Excellent Very good Good Fair Poor
Excelente Muy buena Buena Regular Mala
“Regular” in Spanish may be closer to “good” in English, thus is not comparable to the meaning of “fair”

43
Equivalence of Response Choices: Spanish and English Self-rated Health
Excellent Very good Good Fair Poor
Excelente Muy buena Buena Regular (pasable?) Mala
“Regular” in Spanish may be closer to “good” in English, thus is not comparable to the meaning of “fair”
44
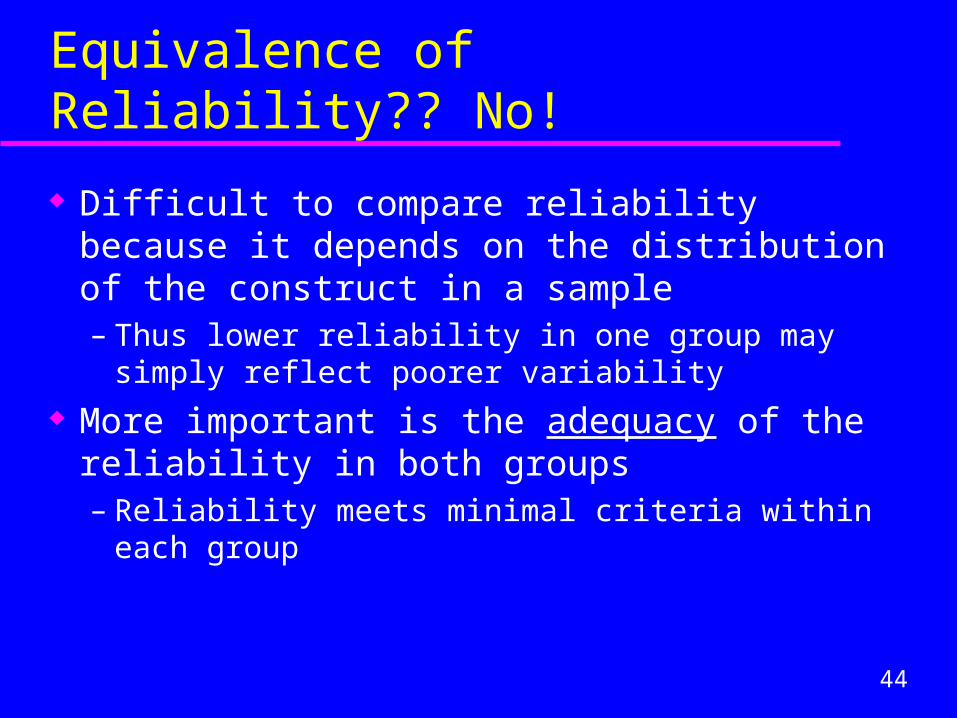
Equivalence of Reliability?? No!
Difficult to compare reliability because it depends on the distribution of the construct in a sample– Thus lower reliability in one group may simply
reflect poorer variability More important is the adequacy of the
reliability in both groups– Reliability meets minimal criteria within each group

45
Example: Adequacy of Reliability of Spanish SF-36 in Argentinean Sample
SF-36 scale Coefficient alpha
Physical functioning .85
Role limitations - physical .84
Bodily pain .80
General health perceptions .69
Vitality .82
Social functioning .76
Role limitations - emotional .75
Mental health .84
F Augustovski et al, J Clin Epid, 2008, in press;

46
Equivalence of Criterion Validity
Determine if hypothesized patterns of associations with specified criteria are confirmed in both groups, e.g.– a measure predicts utilization in both groups
– a cutpoint on a screening measure has the same specificity and sensitivity in identifying a condition in both groups
47
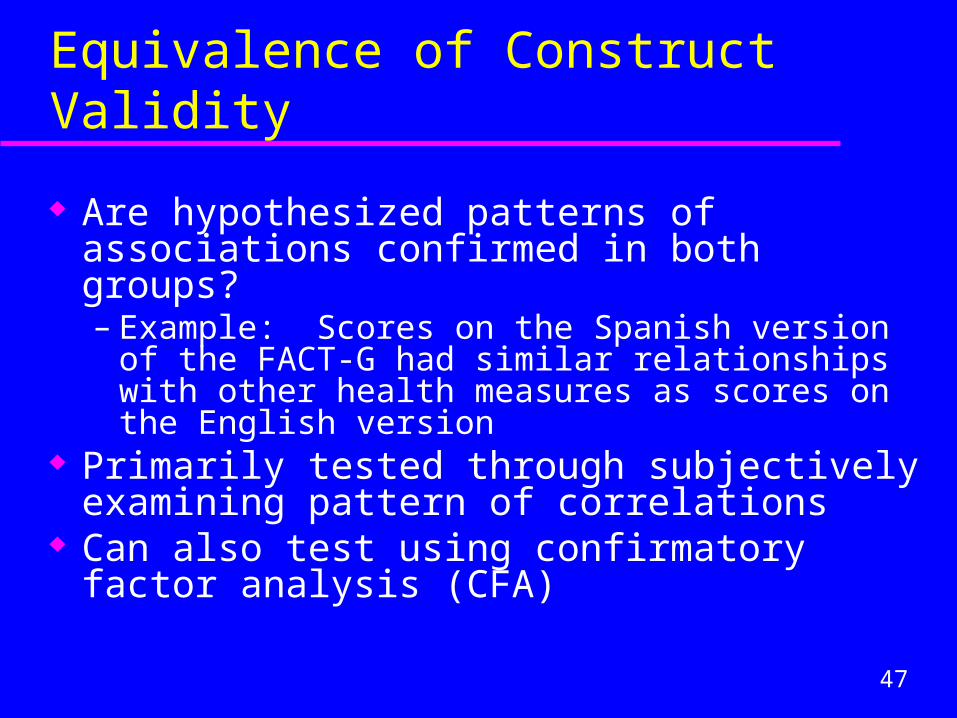
Equivalence of Construct Validity
Are hypothesized patterns of associations confirmed in both groups?– Example: Scores on the Spanish version of the
FACT-G had similar relationships with other health measures as scores on the English version
Primarily tested through subjectively examining pattern of correlations
Can also test using confirmatory factor analysis (CFA)

48
Equivalence of Construct Validity of Spanish SF-36 in Argentinean Sample
Compared Spanish SF-36 construct validity test results to U.S. English SF-36 results
Tested several previously tested hypotheses (which were confirmed):– PCS decreases with age and # of diseases– Relationship of PCS and MCS with utilization– Known groups validity (scores lower for those with
various diseases)

49
Equivalence of Factor Structure
Factor structure is similar in new group to structure in original groups in which measure was tested– measurement model is the same across
groups Methods
– Specify the number of factors you are looking for
– Determine if the hypothesized model fits the data

50
How Evidence for Equivalence of Factor Structure is Obtained
Subjectively– visually compare factor pattern matrixes across
“group-specific” exploratory factor analysis solutions
Empirically– confirmatory factor analysis of data that
includes multiple groups– studies of psychometric invariance

51
Empirical Examination of Equivalence of Factor Structure
Psychometric invariance (equivalence) Important properties of theoretically-based
factor structure (measurement model) do not vary across groups (are invariant)– measurement model is the same across groups
Empirical comparison across groups using confirmatory factor analysis – Not simply by examination

52
Confirmatory Factor Analysis Hierarchical Tests of Equivalence
Across all groups – a sequential process: Same number of factors or dimensions Same items on same factors Same factor loadings No bias on any item across groups Same residuals on items No item or scale bias AND same residuals
53
Measurement or Psychometric Invariance
Gregorich, S.E. Do self-report instruments allow meaningful comparisons across population groups? Testing measurement invariance using the confirmatory factor analysis framework. Med Care, 2006;44 (11, supp 3):S78-S94.

54
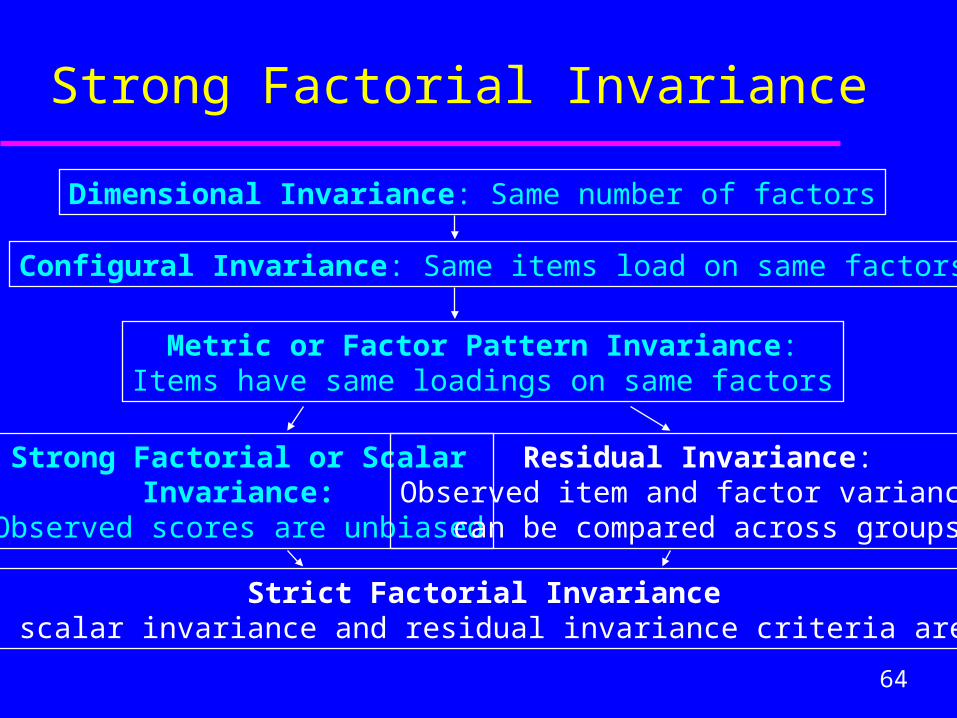
Dimensional Invariance: Same number of factors
Configural Invariance: Same items load on same factors
Metric or Factor Pattern Invariance:Items have same loadings on same factors
Scalar or Strong Factorial Invariance:
Observed scores are unbiased
Residual Invariance:Observed item and factor
variances are unbiased
Strict Factorial InvarianceBoth scalar and residual criteria are met
Criteria for Evaluating Invariance AcrossGroups: Technical Terms

55
Dimensional Invariance of CES-D Definition: same number of factors observed in
all groups Original 4 CES-D factors
– Somatic symptoms– Depressive affect– Interpersonal behavior– Positive affect
LS Radloff, The CES-D scale: A self-report depression scale for research in the general population, Applied Psychol Measurement, 1977;1:385-401.
56
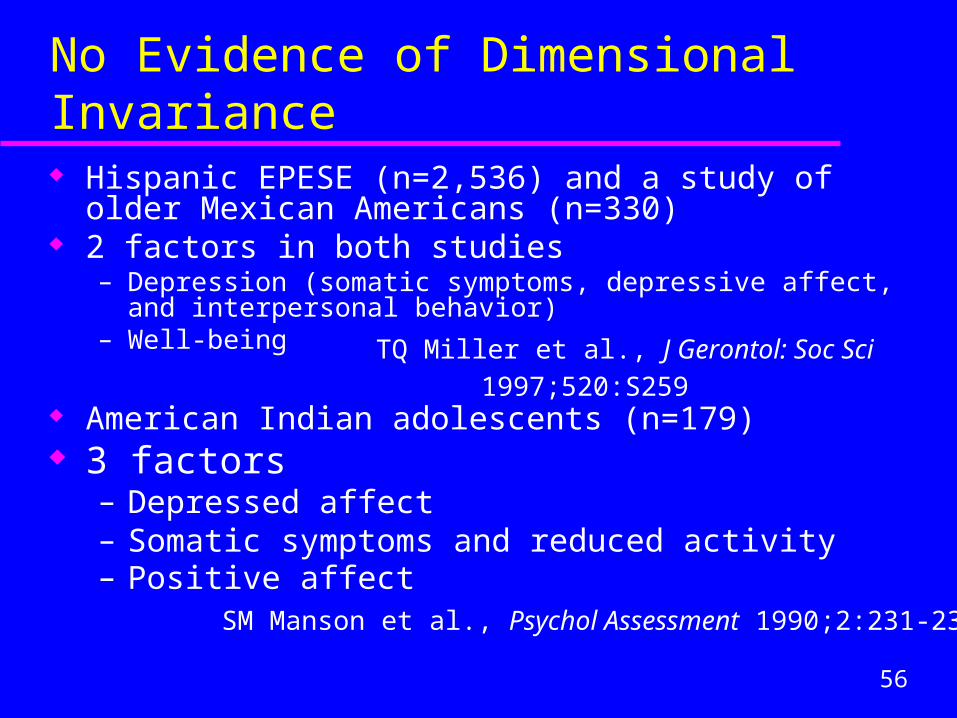
No Evidence of Dimensional Invariance Hispanic EPESE (n=2,536) and a study of older Mexican
Americans (n=330) 2 factors in both studies
– Depression (somatic symptoms, depressive affect, and interpersonal behavior)
– Well-being
American Indian adolescents (n=179) 3 factors
– Depressed affect– Somatic symptoms and reduced activity– Positive affect
TQ Miller et al., J Gerontol: Soc Sci 1997;520:S259
SM Manson et al., Psychol Assessment 1990;2:231-237

57
Configural Invariance
Assumes: dimensional invariance is found (same number of factors)
Definition: Item-factor patterns are the same, i.e., the same items load on the same factors in both groups
CES-D example– 4 factors found in Anglos, Blacks, and Chicanos– Same items loaded on each factor in all groups
RE Roberts et al., Psychiatry Research, 1980;2:125-134

58
Dimensional Invariance: Same number of factors
Configural Invariance: Same items load on same factors
Metric or Factor Pattern Invariance:Items have same loadings on same factors
Strong Factorial or ScalarInvariance:
Observed scores are unbiased
Residual Invariance:Observed item and factor variances
can be compared across groups
Strict Factorial InvarianceBoth scalar invariance and residual invariance criteria are met
Configural Invariance

59
Metric Invariance or Factor Pattern Invariance
Assumes: dimensional and configural invariance are found
Definition: Item loadings are the same across groups– i.e., the correlation of each item with its factor is
the same in all groups

60
Dimensional Invariance: Same number of factors
Configural Invariance: Same items load on same factors
Metric or Factor Pattern Invariance:Items have same loadings on same factors
Strong Factorial or ScalarInvariance:
Observed scores are unbiased
Residual Invariance:Observed item and factor variances
can be compared across groups
Strict Factorial InvarianceBoth scalar invariance and residual invariance criteria are met
Metric Invariance

61
Metric Invariance Example from Interpersonal Processes of Care
Out of 91 items – factor structure of 29 items met criteria of dimensional, configural, and metric invariance across 4 groups– Spanish-speaking Latinos, English speaking Latinos,
African Americans, Whites Dimensional
– Similar factor structure across all 4 groups Configural
– Same items loaded on each factor in all 4 groups Metric
– Same item loadings in all 4 groups

62
Seven “Metric Invariant” Scales:Same Item Loadings Across Groups
I. COMMUNICATION Hurried communication Elicited concerns, responded Explained results, medications
II. DECISION MAKING Patient-centered decision-making
III. INTERPERSONAL STYLE Compassionate, respectful Discriminated Disrespectful office staff

63
Strong Factorial Invariance or Scalar Invariance
Assumes: dimensional, configural, and metric invariance are found
Definition: Observed scores are unbiased, i.e., means can be compared across groups
Requires test of equivalence of mean scores across groups using confirmatory factor analysis
64
Dimensional Invariance: Same number of factors
Configural Invariance: Same items load on same factors
Metric or Factor Pattern Invariance:Items have same loadings on same factors
Strong Factorial or ScalarInvariance:
Observed scores are unbiased
Residual Invariance:Observed item and factor variances
can be compared across groups
Strict Factorial InvarianceBoth scalar invariance and residual invariance criteria are met
Strong Factorial Invariance

65
Seven “Scalar Invariant” (Unbiased) IPC Scales (18 items)
I. COMMUNICATION Hurried communication – lack of clarity Elicited concerns, responded Explained results, medications – explained results
II. DECISION MAKING Patient-centered decision-making – decided together
III. INTERPERSONAL STYLE Compassionate, respectful–(subset) compassionate, respectful Discriminated – discriminated due to race/ethnicity Disrespectful office staff

66
Equivalence of Spanish and English Hospital Quality of Care Survey (H-CAHPS®)
Tested 7 subscales– Nurse communication, MD communication, communication
about meds, nursing services, discharge information, pain control, and physical environment
Report on translation/adaptation, pretesting, item-scale correlations, internal consistency reliability, and construct validity
CFA methods compared factor structure between Spanish and English groups
MP Hurtado et al. Health Serv Res, 2005;40-6, Part II:2140-2161

67
Psychometric or Measurement Equivalence: Second Meaning
Measurement properties of a measure in your diverse group are similar to original (mainstream) groups on which the measures were developed
Subjective comparison and evaluation

68
Mixed Methods for Assessing Equivalence
Use qualitative and quantitative methods in tandem to address issues of cultural equivalence

69
Mixed Methods: Developing IPC Measure of “Cultural Sensitivity”
Initial concept and items from qualitative work 1st survey: In psychometric analyses, did not meet
minimal criteria Second version of concept and items
– new qualitative work, results of first study 2nd survey: In psychometric analyses, measure again
did not meet minimal criteria Analyzed focus group data in more depth
– cultural sensitivity is multidimensional 3rd survey: testing multidimensional measures of
cultural sensitivity

70
Conclusions Measurement in health disparities and
minority health research is a relatively new field
Encourage testing and reporting on adequacy and equivalence of measures tested in any diverse population
As evidence grows, concepts and measures that work better across diverse groups will be identified

71
Resource: Reviews of Measures for Diverse Populations
Multicultural measurement in older populations, JH Skinner et al (eds), Springer Publishing Co: NY, 2002– ALSO published as: Measurement in older ethnically diverse
populations, J Mental Health Aging, Vol 7, Spring 2001
Reviews measures that have been used cross-culturally in: acculturation, socio-economic status, social supports, cognition, health and functionalcapacity, depression, health locus of control, health-related quality of life,and religiosity

72
Resource: Special Journal Issue
Measurement in a multi-ethnic society– Med Care, Vol 44, November 2006
– Qualitative and quantitative methods in addressing measurement in diverse populations

73
Resource: Clinical Research with Diverse Communities
Epi 222, Spring Course Director: Eliseo Pérez-Stable, MD Thursdays 2:45-4:15
– China Basin Summary and syllabus for 2008:
http://www.epibiostat.ucsf.edu/courses/schedule/diverse_pops.html

74
Epi 222 Provides Overview Of….
Meaning of race, ethnicity, social class and culture Multi-level factors that are mechanisms of health
disparities Methodological and measurement considerations in
research in ethnically diverse populations Qualitative methods in developing and pre-testing
instruments Strategies for recruiting ethnically diverse populations
and for expanding the role of communities
75
Homework for Next Week
For those interested in studying any diverse population group:– Finish matrix: complete rows 27-34
» Translations, equivalence across diverse groups, acceptability for your population
For everyone:– Complete row 34: can measure be modified

76
Next Week (Class 8)
Pretesting measures and creating a questionnaire