Embed Size (px)
Citation preview
1
Class Session #2Numerically Summarizing Data
• Measures of Central Tendency
• Measures of Dispersion
• Measures of Central Tendency and Dispersion from Grouped Data
• Measures of Position
2
Recall the Definitions
• Parameter – a descriptive measure of a population
(p = parameter = population, usually in Greek letters)
• Statistic – a descriptive measure of a sample
(s = statistic = sample, usually in Roman letters)
3
Common “descriptions”
• ? Average ? – “typical” as described in the news reports
• Give some of today’s examples• Data distributions’ “characteristics”
– Shape – look at a picture (histogram)– Center – mean, mode, median– Spread – range, variance, std. dev.
4
Central Tendency Definitions
• Arithmetic mean – the sum of all the values of the variable in the data set, divided by the number of observations
• Population arithmetic mean - computed using all the individuals in the population (“mew” = μ) (≠ micro µ)
• Sample arithmetic mean – computed using the sample data (“x-bar”)
• Note: is a statistic, μ is a parameter
x
5
More Central Tendency Defs
• Median – the value that lies in the middle of the data, when arranged in ascending order(think of the median strip of highway in the middle of the road)
• Mode – the most frequent observation of the variable in the data set (think “a la mode” in fashion /on top)
6
Measures of Dispersion Definitions
• Range (R) – the difference between the largest data value (maximum) & the smallest data value (minimum)
• Deviation about the mean – how “spread out” the data is.? for both population and sample variance, the sum of all deviations about the mean equals what ?? the square of a non-zero number is ?
7
More Measures of Dispersion Definitions
• Population Variance – sum of squared deviations about the population mean, divided by the number of observations in the population N (sigma squared)
• ? i.e. population variance is the mean of the ______ _________ ____ __ _________ ___ ?
Answer: Population variance is the mean of the squared deviations about the population mean
8
More Measures of Dispersion Definitions
• Sample Variance – sum of the squared deviations about the sample mean, divided by the number of observations minus one (s squared)
• Degrees of freedom is the “n-1”
9
More Measures of Dispersion Definitions
• Population Standard Deviation – the square root of the population variance (sigma, written as “σ”)
• Sample Standard Deviation – the square root of the sample variance (s, written as “s”)
BTW, later we discover “s” itself is a random variable
10
Empirical Rule for Symmetric Data
• If the distribution is bell shaped: 68% of data within 1 std deviations 95% of data within 2 std deviations 99.7% of data within 3 standard deviations
of the mean
Rule holds for both samples & populations
11
Supposing Grouped Data
• Approximate mean of a variable from a frequency distribution• Use the midpoint of each class• Use the frequency of each class• Use the number of classes
• Population Mean
• Sample Mean
12
Supposing Grouped Data
• Weighted MeanGood to use when certain data
values have higher importance (or weight)
[Sum of each value of variable times its weight] / [sum of weights]
Examples of Grade Point Average (GPA) and mixed nuts pricing
13
Supposing Grouped Data
• Population Variancesum of [(midpoint – mean)2 times
frequency] / [sum of frequencies]
• Sample Varianceas before except “-1” in denominator (the
degrees of freedom thing again)

14
Supposing Grouped Data
• Population Standard Deviationtake square root of population variance
• Sample Standard Deviationtake square root of sample variance
15
Measures of Position Definition
• z-Score – the distance that a data value is from the mean in terms of standard deviations. Equals (data value minus mean) divided by standard deviation]
• Population z-score• Sample z-score
16
Measures of Position Definitions
• z-score equals [(data value minus mean) divided by standard deviation]
• Is a "unitless" measure• Can be “normalized” to get• Mean of zero• Standard Deviation of one
17
Measures of Position Definitions
• z-score purpose is to provide a way to "compare apples and oranges"
• by converting variables with different centers and/or spreads
• to variables with the same center (0) and spread (1).
18
Measures of Position Definition
• Percentiles – k th percentile is a set of data divides the lower k% from the upper (1-k)%• Divide into 100 parts, so 99 percentiles
exist• “P sub k”• Use to give relative standing of the data
19
Measures of Position Definition
• Quartiles – divides the data into four equal parts• Four parts, so three percentiles exist• “Q sub one, two, or three”• Q2 is the median of the data
• Q1 is the median of the lower half
• Q3 is the median of the upper half
20
Numerical summary of data
• Five number summaries
• Interquartile range (Q3 – Q1) is resistant to extreme values
• Compute five number summary
• Min value | Q1 | M | Q3 | max value
21
Building a Box Plot – part 1
• 1. Calculate interquartile range (IQR)
• 2. Compute lower & upper fence
• Lower fence = Q1 – 1.5 (IQR)
• Upper fence = Q3 + 1.5 (IQR)
• 3. Draw scale then mark Q1 and Q3
• 4. Box in Q1 to Q3 then mark M
22
Building a Box Plot – part 2
• 5. Temporarily mark fences with brackets
• 6. Draw line from Q1 to smallest value inside the lower fence and a line from Q3 to largest value inside the upper fence
• 7. Put * for all values outside of the fences
• 8. Erase brackets
23
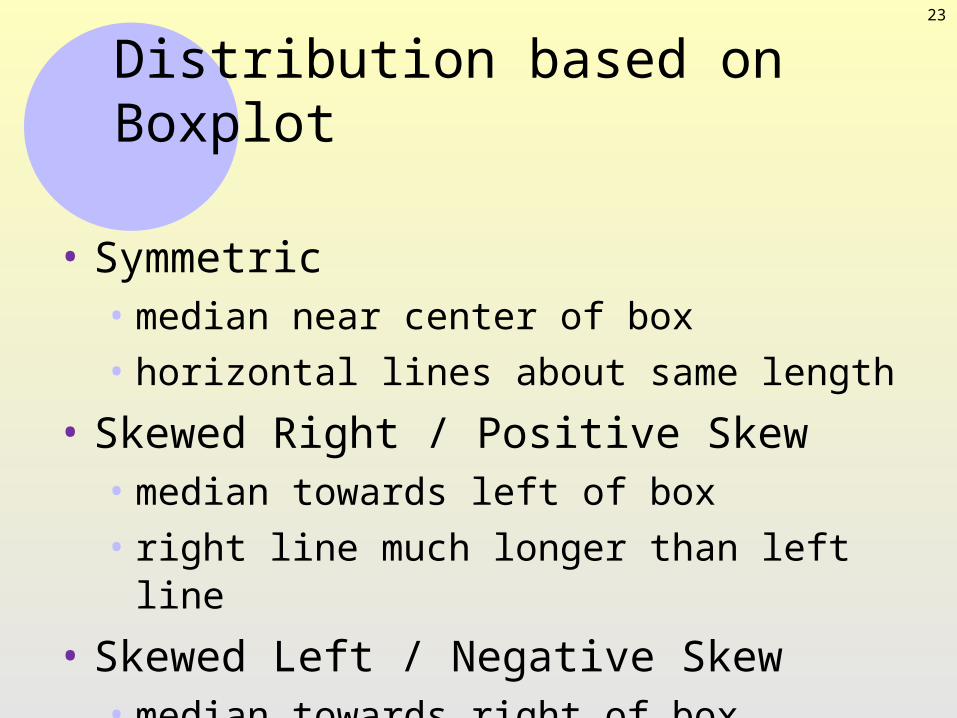
Distribution based on Boxplot
• Symmetric• median near center of box• horizontal lines about same length
• Skewed Right / Positive Skew• median towards left of box• right line much longer than left line
• Skewed Left / Negative Skew• median towards right of box• left line much longer than right line
24
Which measure best to report?
• Symmetric distribution• Mean• Standard Deviation
• Skewed distribution• Median• Interquartile Range
25
Self Quiz
• When can the mean and the median be about equal?
• In the 2000 census conducted by the U.S. Census Bureau, two average household incomes were reported: $41,349 and $55,263. One of these averages is the mean and the other is the median. Which is which and why?
26
Self Quiz
• The U.S. Department of Housing and Urban Development (HUD) uses the median to report the average price of a home in the United States.
• Why do they do that?
27
Self Quiz
• A histogram of a set of data indicates that the distribution of the data is skewed right.
• Which measure of central tendency will be larger, the mean or the median?
• Why?
28
Self Quiz
• If a data set contains 10,000 values arranged in increasing order, where is the median located?
• Matching: (parameter; statistic)• _____ is a descriptive measure of a
population• _____ is a descriptive measure of a
sample.
29
Self Quiz
• A data set will always have exactly one mode. (true or false)
• If the number of observations, n, is odd; then the median, M, is the value calculated by the formula M=(n+1)/2
30
Self Quiz
• Find the Sample Mean:
20, 13, 4, 8, 10• Find the Sample Mean:
83, 65, 91, 87, 84• Find the Population Mean:
3, 6, 10, 12, 14
31
Self Quiz
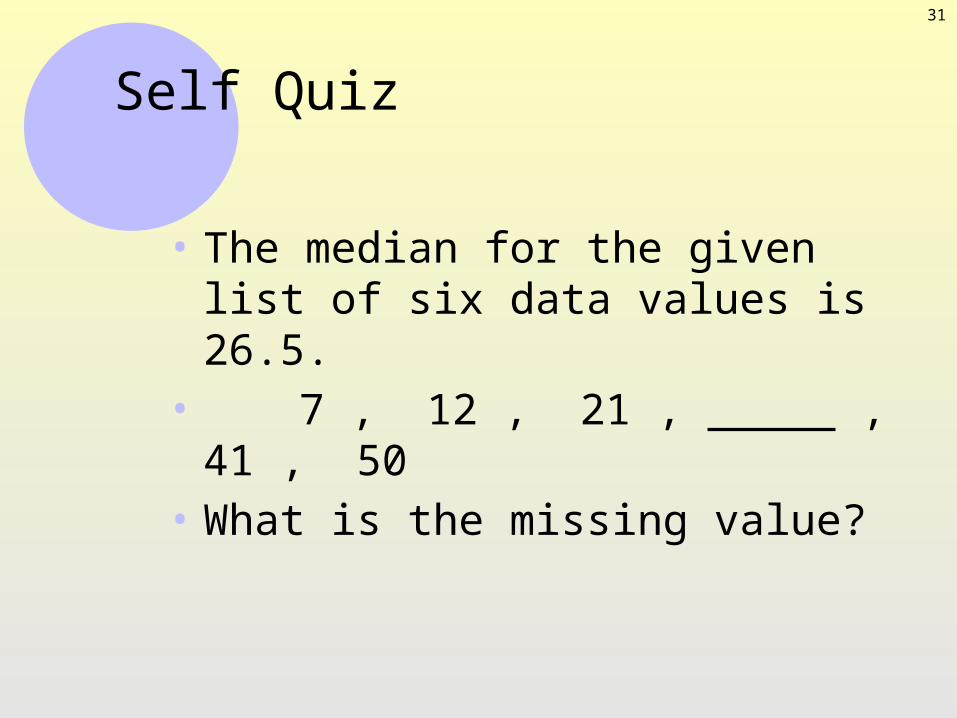
• The median for the given list of six data values is 26.5.
• 7 , 12 , 21 , , 41 , 50
• What is the missing value?
32
Self Quiz
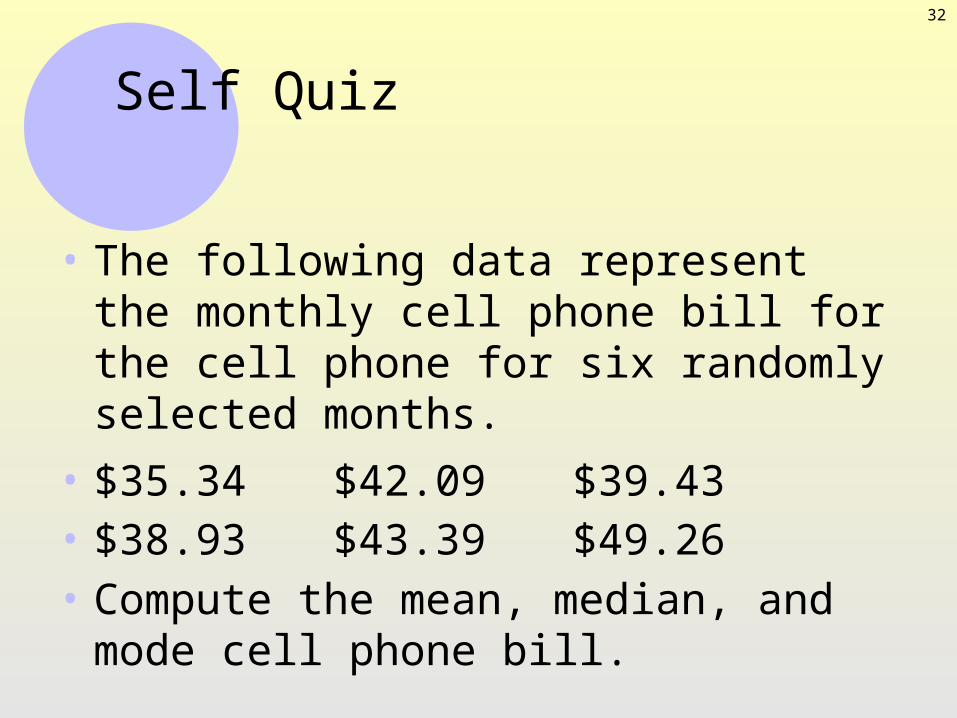
• The following data represent the monthly cell phone bill for the cell phone for six randomly selected months.
• $35.34 $42.09 $39.43• $38.93 $43.39 $49.26• Compute the mean, median, and mode cell
phone bill.
33
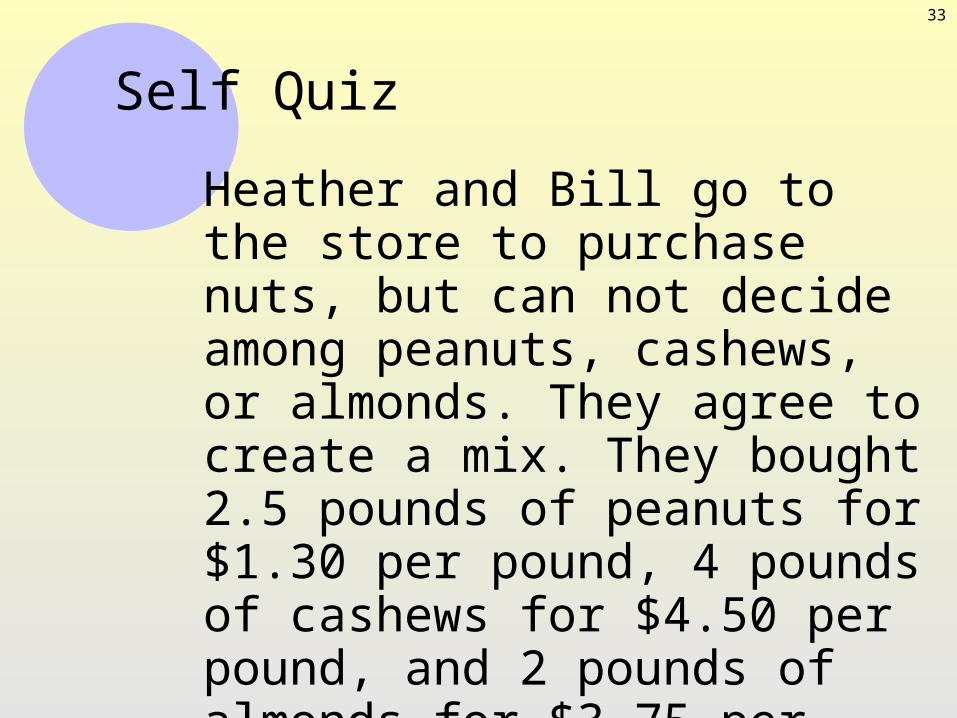
Self Quiz
• Heather and Bill go to the store to purchase nuts, but can not decide among peanuts, cashews, or almonds. They agree to create a mix. They bought 2.5 pounds of peanuts for $1.30 per pound, 4 pounds of cashews for $4.50 per pound, and 2 pounds of almonds for $3.75 per pound. Determine the price per pound of the mix.