Embed Size (px)
Citation preview

1
Climate Warming & California’s Water Future
Jay R. Lund, Richard E. Howitt, Marion W. Jenkins,
Tingju Zhu, Stacy K. Tanaka, Manuel Pulido,
Melanie Taubert, Randall Ritzema, Inês Ferreira, Sarah Null
Civil & Environmental Engineering
Agricultural & Resource Economics
University of California, Davis
http://cee.engr.ucdavis.edu/faculty/lund/CALVIN/

2
Tantalus In Hades, thirsty Tantalus was burdened to have water rise
to his neck threatening to drown him, but receded when he stooped to drink. Above him was a boulder, threatening to crush him at some uncertain future time.
California’s water managers are similarly tantalized by prospects for quenching California’s thirsts, but contend with floods and droughts, living in a world with grave prospects of earthquakes, budgets, population growth, and climate change.

3
Overview1) Major Issues
2) 2100 Population Changes
3) 2100 Climate Changes
4) CALVIN Model
5) Adaptations to the Future
6) Results
7) Conclusions

4
Major Issues
Climate warming effects on California’s water supplies.
Combined population growth and climate change stress.
Could California adapt?
How well could California adapt?
What would life be like?

5
2100 Population & Land Use
1. Future population and land use will greatly affect water demands.
2. With growth to 92 million (UCB), urban demands grow by ~ 7.2 maf/yr
3. Urbanization of irrigated land reduces agricultural demands by ~ 2.7 maf/yr
4. Net effect is big (+4.5 maf/yr) and economically important

6
2100 Climate Changes1. Water availability changes estimated for 12
climate warming scenarios (based on LBNL).
2. Water supply impacts estimated for:
a. Major mountain inflows
b. Groundwater inflows
c. Local streams
d. Reservoir evaporation
3. Effects estimated for 113 inflows distributed throughout California

7
2100 Climate Changes
0
1000
2000
3000
4000
5000
6000
7000
8000
9000
1 2 3 4 5 6 7 8 9 10 11 12
Calendar Month
Tota
l Mo
nth
ly M
ean
Rim
Infl
ow
(TA
F)
1.5T 0%P 1.5T 9%P3.0T 0%P 3.0T 18%P5.0T 0%P 5.0T 30PHCM 2010-2039 HCM 2050-2079HCM 2080-2099 PCM 2010-2039PCM 2050-2079 PCM 2080-2099Historical

8
2100 Raw Water Availability
Climate Scenario
Average Annual Water Availability Climate
Scenario
Average Annual Water Availability
Vol. maf
Changemaf
Volume maf
Changemaf
1) 1.5T 0%P 35.7 -2.1 7) HCM 2025 41.9 4.1
2) 1.5T 9%P 37.7 -0.1 8) HCM 2065 40.5 2.7
3) 3.0T 0%P 33.7 -4.1 9) HCM 2100 42.4 4.6
4) 3.0T 18%P 37.1 -0.8 10) PCM 2025 35.7 -2.1
5) 5.0T 0%P 31.6 -6.2 11) PCM 2065 32.9 -4.9
6) 5.0T 30%P 36.2 -1.6 12) PCM 2100 28.5 -9.4
Historical 37.8 0.0

9
What is CALVIN Model?
• Entire inter-tied California water system
• Surface and groundwater systems; supply and demands
• Economics-driven optimization model • Economic Values for Agricultural, Urban, & Hydropower Uses
• Flow Constraints for Environmental Uses
• Prescribes monthly system operation over a 72-year representative hydrology
Maximizes economic performance within constraints

10
Over 1,200 spatial elements
51 Surface reservoirs 28 Ground water
reservoirs 24 Agricultural regions 19 Urban demand regions 600+ Conveyance Links
CALVIN’s Spatial Coverage

11
Economic Values for Water
• Agricultural: Production model SWAP
• Urban: Demand model based on price elasticities
• Hydropower• Operating Costs: Pumping, treatment, water quality,
etc.
Environmental flows and deliveries as constraints – with first priority

12
Databases of Input & Meta- Data
HECPRM Solution Model
Surface and ground water hydrology
Environmental flow constraints
Urban values of water (elasticities)
Agricultural values of water (SWAP)
Physical facilities & capacities
Values of increased facility capacities
Conjunctive use & cooperative operations
Water operations & delivery reliabilities
Willingness-to-pay for additional water & reliability
Value of more flexible operations
Economic benefits of alternatives
Operating costs
CALVI N Economic Optimization Model:
Data Flow for the CALVIN Model

13
Model Limitations
1) Data:Base hydrology, Tulare Basin, monthly agricultural demands, etc.
2) Network flow formulation, simplifiedcosts, water quality, environmental requirements, hydraulics, hydrologic foresight and coordination
3) Limited range of benefitsNo flood control or recreation

14
Integrated Adaptation Options
• Water allocation (markets?)• System operations
• Conjunctive use• Coordinated operations
• Urban conservation/use efficiencies• Cropping changes and fallowing• Agricultural water use efficiencies• New technologies
• Wastewater reuse• Seawater desalination
15
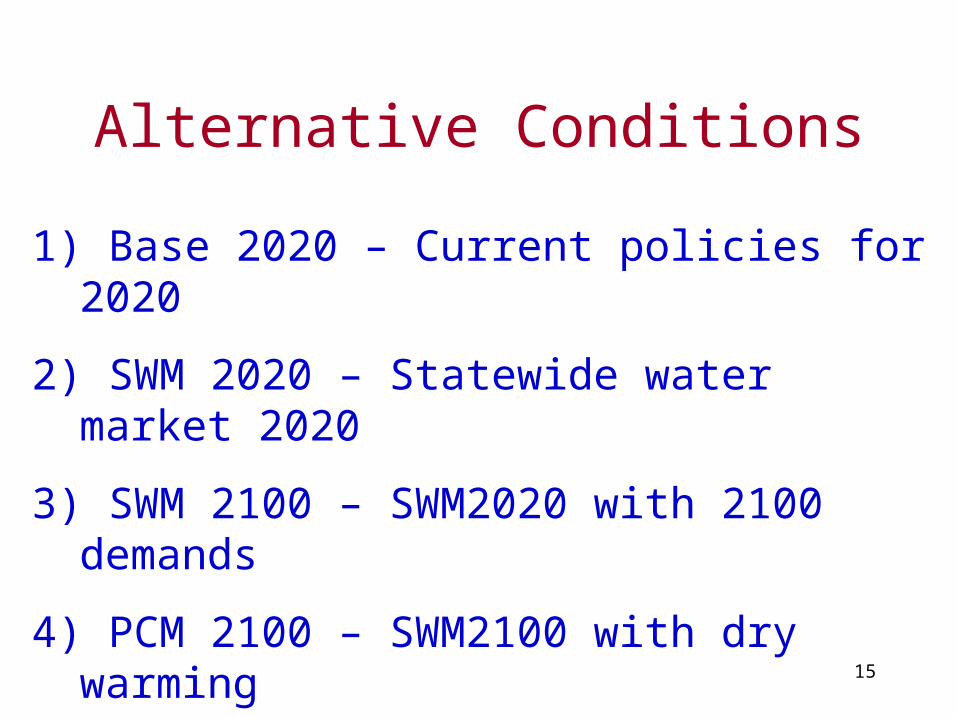
Alternative Conditions
1) Base 2020 – Current policies for 2020
2) SWM 2020 – Statewide water market 2020
3) SWM 2100 – SWM2020 with 2100 demands
4) PCM 2100 – SWM2100 with dry warming
5) HCM 2100 – SWM2100 with wet warming

16
Climate Scenarios by Region
11.3
15.6
8.4
9.9
4.5
8.8
11.8
6.4
8.5
4.2
17.6
26.6
15.2
16.5
4.9
0
5
10
15
20
25
30
Upper Sac. L.Sac&BayDelta S.Joaq&S.Bay Tulare So.CalAcc
reti
on
s -
Dep
leti
on
s +
Rim
In
flo
ws
+ G
rou
nd
wat
er I
nfl
ow
s -
Res
ervo
ir E
vap
(m
af/y
r)
Historical PCM2100 HCM2100

17
Some Early Results
• Delivery, Scarcity, and Economic Performance
• Conjunctive Use and other Operations
• New Technologies
• Costs of Environmental Flows
• Flood Frequency
• Hydropower Performance
• Economic Value of Facility Changes

18
Scarcity, Operating, & Total Costs($ million/yr)
CostBase 2020
SWM2020
SWM2100
PCM2100
HCM2100
Urban Scarcity 1,564 170 785 872 782
Agric. Scarcity 32 29 198 1,774 180
Operating 2,581 2,580 5,918 6,065 5,681
Total Costs 4,176 2,780 6,902 8,711 6,643

19
Total Deliveries and Scarcities
0
5
10
15
20
25
30
35
40
45
50B
ase
20
20
SW
M2
020
SW
M2
100
PC
M2
10
0
HC
M2
100
Ba
se2
02
0
SW
M2
020
SW
M2
100
PC
M2
10
0
HC
M2
100
Ba
se2
02
0
SW
M2
020
SW
M2
100
PC
M2
10
0
HC
M2
100
Ba
se2
02
0
SW
M2
020
SW
M2
100
PC
M2
10
0
HC
M2
100
Ba
se2
02
0
SW
M2
020
SW
M2
100
PC
M2
10
0
HC
M2
100
Ba
se2
02
0
SW
M2
020
SW
M2
100
PC
M2
10
0
HC
M2
100
An
nu
al A
vera
ge
Del
iver
y an
d S
carc
ity
(maf
/yr) Scarcity
Deliveries
Upper Sac L.Sac&BayDelta S.Joaq&So.Bay Tulare So.Cal Statewide

20
Agricultural Deliveries & Scarcities
0
5
10
15
20
25
30B
ase
20
20
SW
M2
020
SW
M2
100
PC
M2
10
0
HC
M2
100
Ba
se2
02
0
SW
M2
020
SW
M2
100
PC
M2
10
0
HC
M2
100
Ba
se2
02
0
SW
M2
020
SW
M2
100
PC
M2
10
0
HC
M2
100
Ba
se2
02
0
SW
M2
020
SW
M2
100
PC
M2
10
0
HC
M2
100
Ba
se2
02
0
SW
M2
020
SW
M2
100
PC
M2
10
0
HC
M2
100
Ba
se2
02
0
SW
M2
020
SW
M2
100
PC
M2
10
0
HC
M2
100
An
nu
al A
vera
ge
Ag
ricu
ltu
ral
Del
iver
y an
d S
carc
ity
(maf
/yr)
Scarcity
Deliveries
Upper Sac L.Sac&BayDelta S.Joaq&So.Bay Tulare So.Cal Statewide

21
Scarcity Costs by Sector
1564
32
170
29
785
198
872
1774
782.1
179.7
0
200
400
600
800
1000
1200
1400
1600
1800
2000
Total Urban Total Agriculture
An
nu
al
Av
era
ge
Pe
na
lty
($
M/y
r)
Base2020 SWM2020 SWM2100 PCM2100 HCM2100

22
Groundwater Operations
480
490
500
510
520
530
540
550O
ct-2
1
Oct
-24
Oct
-27
Oct
-30
Oct
-33
Oct
-36
Oct
-39
Oct
-42
Oct
-45
Oct
-48
Oct
-51
Oct
-54
Oct
-57
Oct
-60
Oct
-63
Oct
-66
Oct
-69
Oct
-72
Oct
-75
Oct
-78
Oct
-81
Oct
-84
Oct
-87
Oct
-90
Gro
un
dw
ate
r S
tora
ge
(m
af/
mo
n)
Base2020 SWM2020 SWM2100
PCM2100 HCM2100

23
Conjunctive Use
0%
10%
20%
30%
40%
50%
60%
0% 20% 40% 60% 80% 100%Annual Exceedence Probability
To
tal A
nn
ual
Su
pp
ly -
%G
ou
nd
wat
er
Base2020 SWM2020 SWM2100 PCM2100 HCM2100

24
New Source Technologies
0
200
400
600
800
1,000
1,200
1,400
1,600
1,8001
92
2
19
25
19
28
19
31
19
34
19
37
19
40
19
43
19
46
19
49
19
52
19
55
19
58
19
61
19
64
19
67
19
70
19
73
19
76
19
79
19
82
19
85
19
88
19
91
To
tal V
olu
me
of
De
sa
lin
atio
n o
r R
eu
se
(ta
f/y
r)
SWM2100-Reuse SWM2100-Desal
PCM2100-Reuse PCM2100-Desal
HCM2100-Reuse HCM2100-Desal

25
Environmental Flow Costs Average WTP ($/af)
Minimum Instream Flows SWM2020 SWM2100 PCM2100 HCM2100 Trinity River 0.6 45.4 1010.9 28.9
Sac. R. at Keswick 0.1 3.9 665.2 3.2 Mokelumne River 0.1 20.7 332.0 0.0
Yuba River 0.0 0.0 1.6 1.0 Merced River 0.7 16.9 70.0 1.2
Mono Lake Inflows 819.0 1254.5 1301.0 63.9 Owens Lk. Dust Mitigation 610.4 1019.1 1046.1 2.5
Refuges Sac West Refuge 0.3 11.1 231.0 0.1
SJ/Mendota Refuges 14.7 32.6 249.7 10.6 Pixley Refuge 24.8 50.6 339.5 12.3 Kern refuge 33.4 57.0 376.9 35.9
Delta Outflow 0.1 9.7 228.9 0.0

26
Trinity River Shadow Costs
0
20
40
60
80
100
120
140
160
180
200
1921 1931 1941 1951 1961 1971 1981 1991Time
No
n-P
CM
2100
Sh
ado
w C
ost
s o
f In
stre
am F
low
($
/af)
0
400
800
1,200
1,600
2,000SWM2020 SWM2100 HCM2100 PCM2100
PC
M21
00 S
had
ow
Co
sts
of
Inst
ream
Flo
w (
$/af
)

27
Annual Flood Frequency(Lower American River)
0
1000
2000
3000
4000
5000
6000
7000
8000
9000
10000
11000
0% 10% 20% 30% 40% 50% 60% 70% 80% 90% 100%
Exceedence Probability
Flo
w (
taf/
mo
)
HCM 2100
Historical 2100
PCM 2100

28
Hydropower Generation
0
2000
4000
6000
8000
10000
12000
14000
16000
18000
200001
92
2
19
26
19
30
19
34
19
38
19
42
19
46
19
50
19
54
19
58
19
62
19
66
19
70
19
74
19
78
19
82
19
86
19
90
An
nu
al
En
erg
y G
en
era
tio
n (
GW
hr/
yr)
Base2020 SWM2100 PCM2100 HCM2100

29
Economic Value of Facility Changes
($/unit-yr) Surface Reservoir (taf) SWM2100 PCM HCM Turlock Reservoir 69 202 56 Santa Clara Aggregate 69 202 56 Pardee Reservoir 68 202 56 Pine Flat Reservoir 66 198 56 New Bullards Bar Reservoir 65 196 56 Conveyance (taf/mo) Lower Cherry Creek Aqueduct 7886 8144 7025 All American Canal 7379 7613 6528 Putah S. Canal 7378 7611 6528 Mokelumne Aqueduct 7180 7609 6301 Coachella Canal 3804 3487 3618 Colorado Aqueduct 1063 970 759 California Aqueduct 669 1823 452

30
Conclusions from Results1) Important to look at climate change impacts
and adaptation in context of future water demands, and the entire range of water sources, facilities, and adaptation options. Must also allow adaptations – Optimization.
2) Climate warming’s hydrologic effects are substantiated and generalized. Magnitude comparable to water demand growth.
3) California’s system can adapt, at some cost.

31
Conclusions from Results (con’t)
4) Central Valley agriculture is most sensitive to dry climate warming.
5) Southern California urban users are not very sensitive to climate warming.
6) Adaptation would be challenging. Institutional change and flexibility needed to respond to both population and climate changes.
7) Study limitations are considerable, but it behooves us to consider management and policy changes.

32
Glimpse at Long-term FutureResults provides a hazy glimpse at the future of
California water management:
1) Integrated mix of many management options:Water use efficiency, conjunctive use, water transfers, reuse, desalination, …
2) Importance of local and regional actions in a statewide context
3) Long-term importance of flexibility4) Some scarcity is optimal

33
Work left to do…
1) CALVIN improvements
2) Flood penalties
3) Sea level rise
4) Agronomic and land use effects in agricultural demands
5) Better hydrology
6) Hydropower and energy cost improvements
http://cee.engr.ucdavis.edu/faculty/lund/CALVIN/