Embed Size (px)
Citation preview
1
Combustion Fundamentals Presentation Outline Average Combustion Process
Cylinder Pressure vs. Crank Angle
Rate of Pressure Change vs. Crank Angle
Cylinder Pressure vs. Cylinder Volume
Mass Fraction Burned vs. Crank Angle
Cycle-to-Cycle Variability
Combustion Limits
Final Thoughts
2
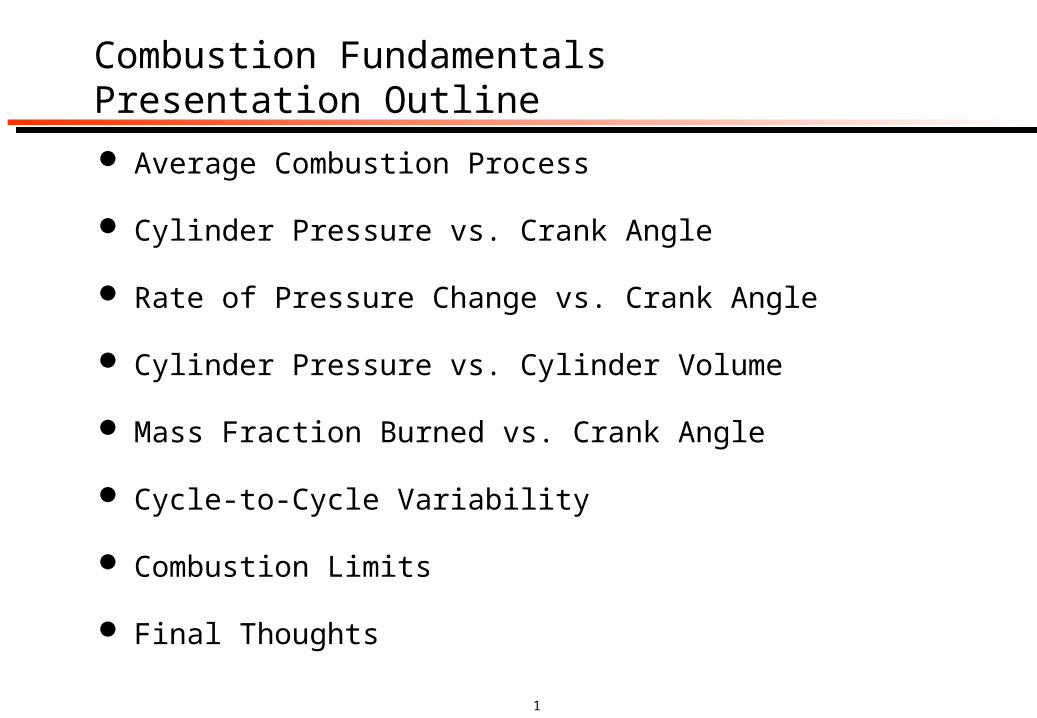
Average Combustion ProcessCylinder Pressure Based Performance Cylinder pressure based parameters commonly used to characterize
the average combustion performance:
Cylinder pressure vs. crank angle
Peak cylinder pressure and its location
Maximum rate of pressure rise and its location
Cylinder pressure vs. cylinder volume
Log cylinder pressure vs. log cylinder volume
Indicated mean effective pressure (IMEP)
Pumping mean effective pressure (PMEP)
Flame formation period and bulk burn duration
Location of 50 % burned
3
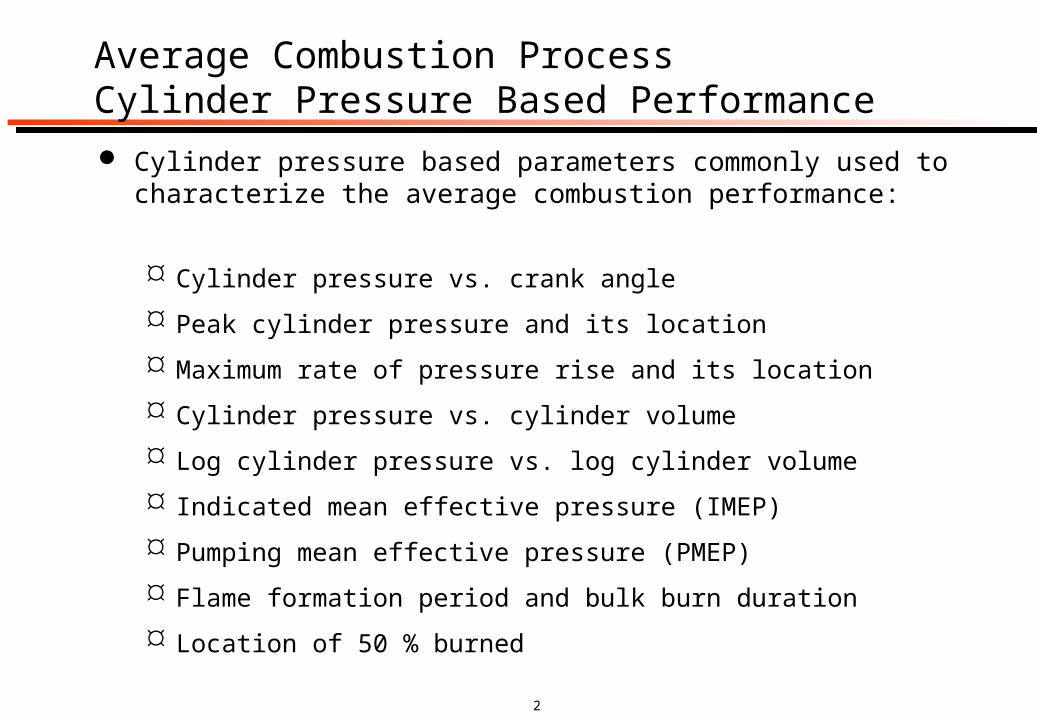
Cylinder Pressure vs. Crank AngleGeneral Information The fundamental measurement of cylinder pressure based combusti
on diagnostics
Also known as the P-T diagram (archaic)
Required to determine the peak cylinder pressure and its location with respect to TDC
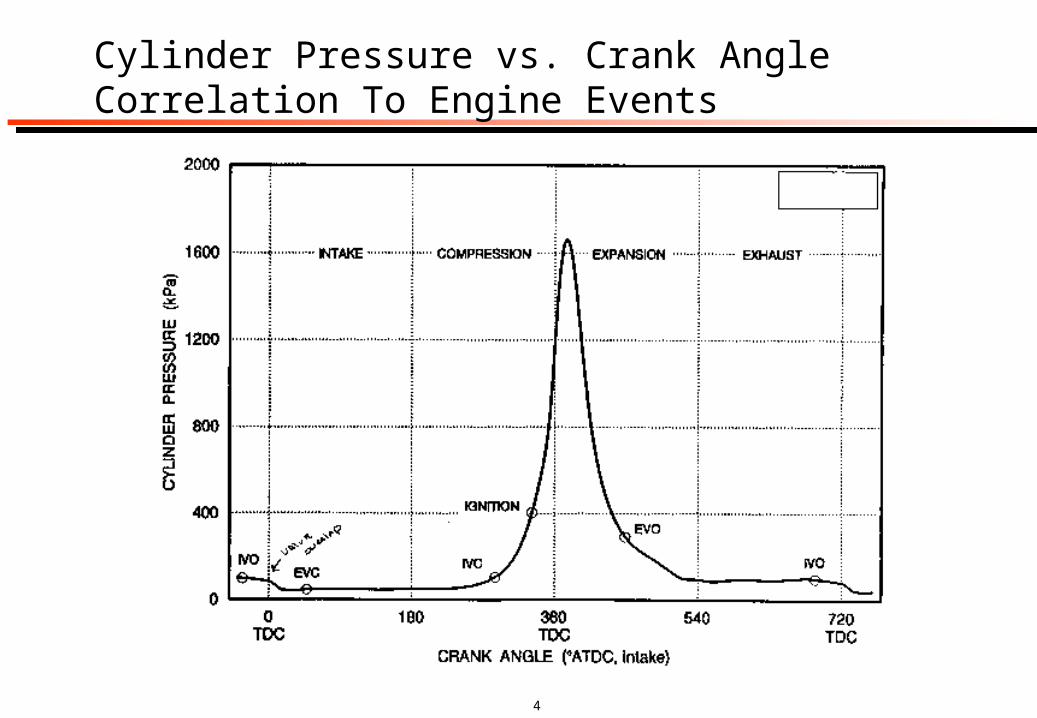
4
Cylinder Pressure vs. Crank AngleCorrelation To Engine Events
5
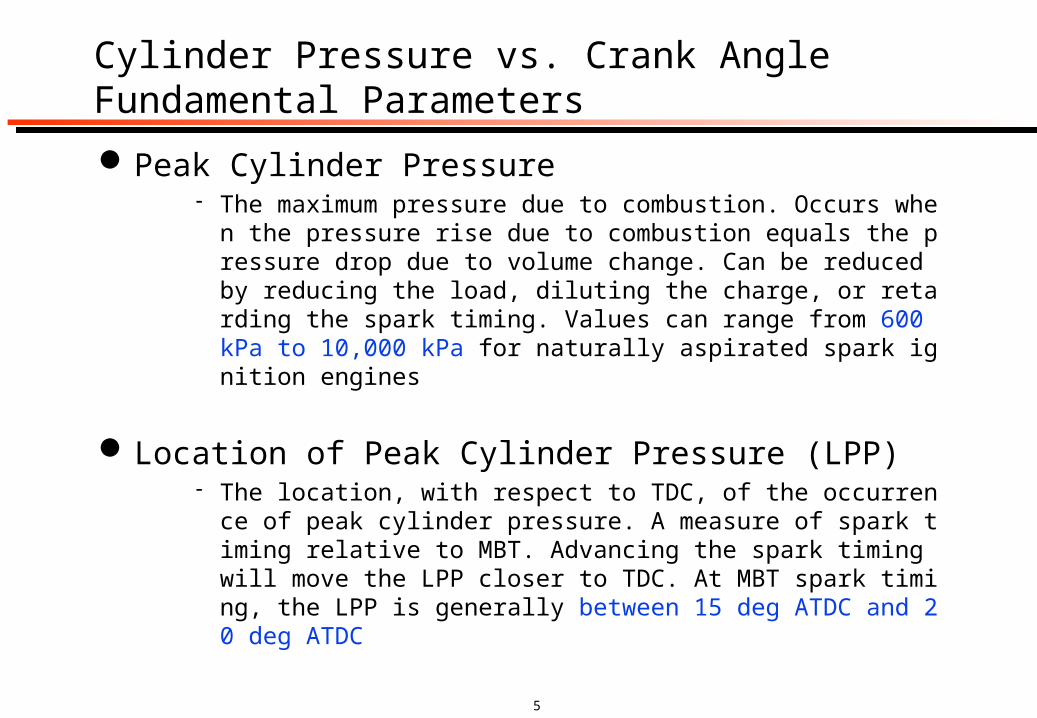
Cylinder Pressure vs. Crank AngleFundamental ParametersPeak Cylinder Pressure
The maximum pressure due to combustion. Occurs when the pressure rise due to combustion equals the pressure drop due to volume change. Can be reduced by reducing the load, diluting the charge, or retarding the spark timing. Values can range from 600 kPa to 10,000 kPa for naturally aspirated spark ignition engines
Location of Peak Cylinder Pressure (LPP) The location, with respect to TDC, of the occurrence of peak cylinder
pressure. A measure of spark timing relative to MBT. Advancing the spark timing will move the LPP closer to TDC. At MBT spark timing, the LPP is generally between 15 deg ATDC and 20 deg ATDC
6
Cylinder Pressure vs. Crank AnglePeak Cylinder Pressure and Location
7
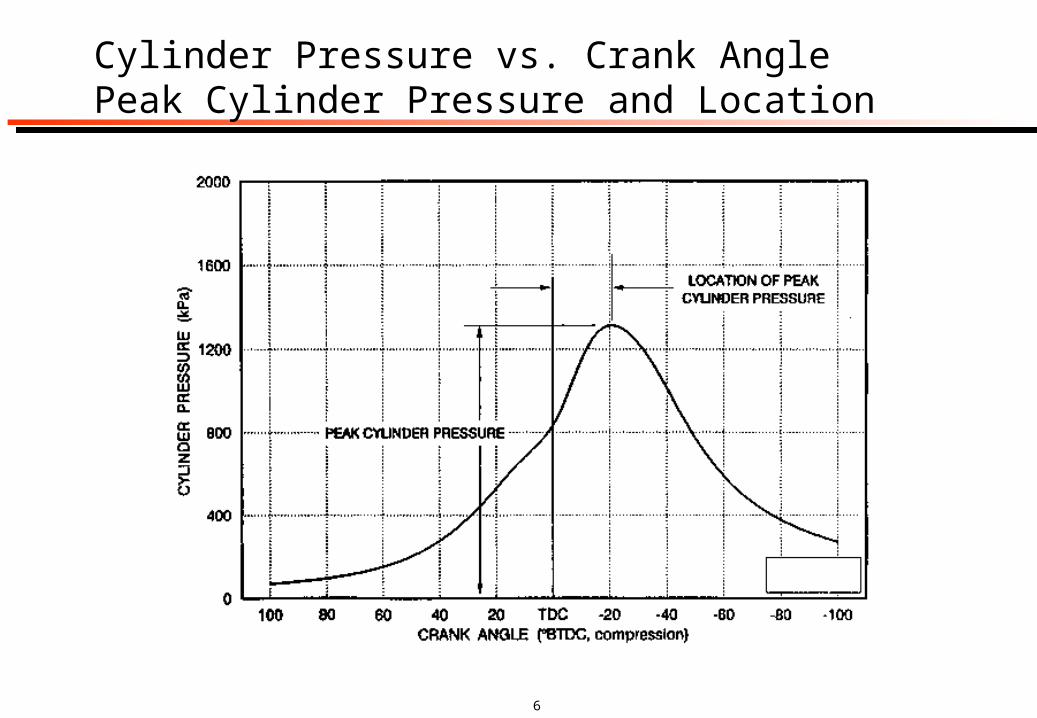
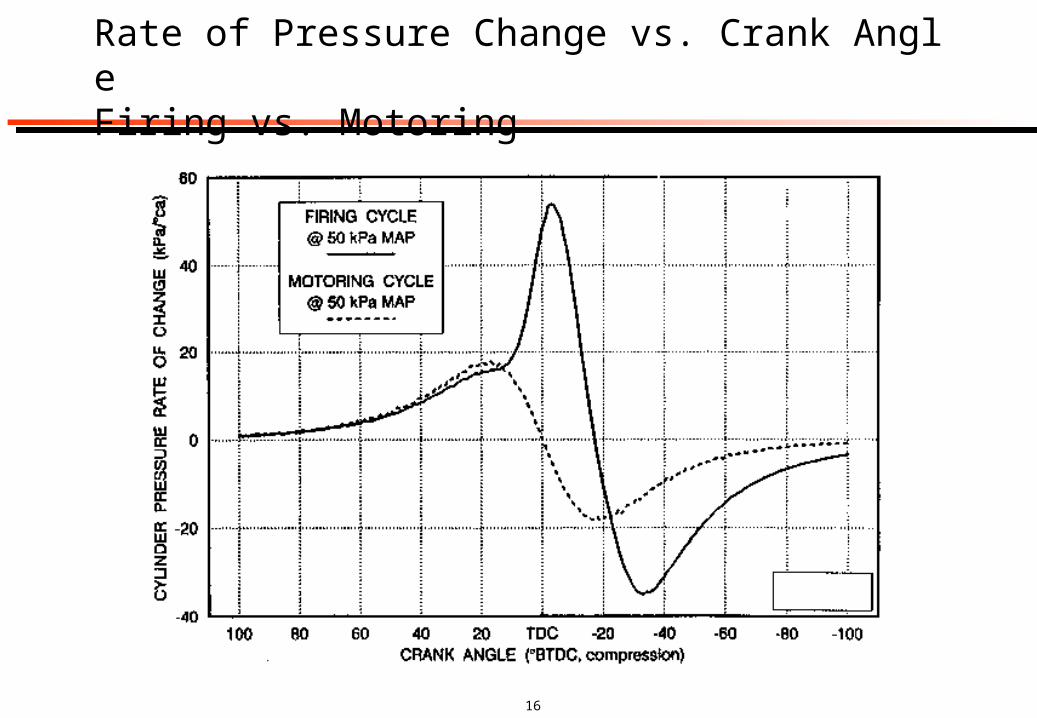
Cylinder Pressure vs. Crank AngleFiring vs. Motoring
8
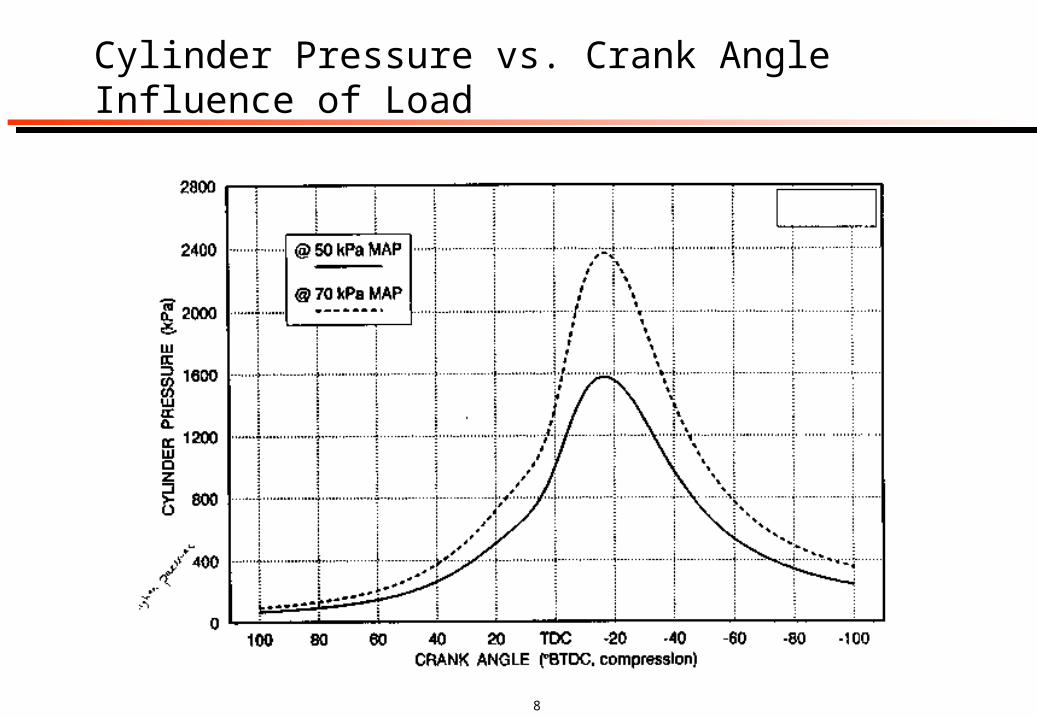
Cylinder Pressure vs. Crank AngleInfluence of Load
9
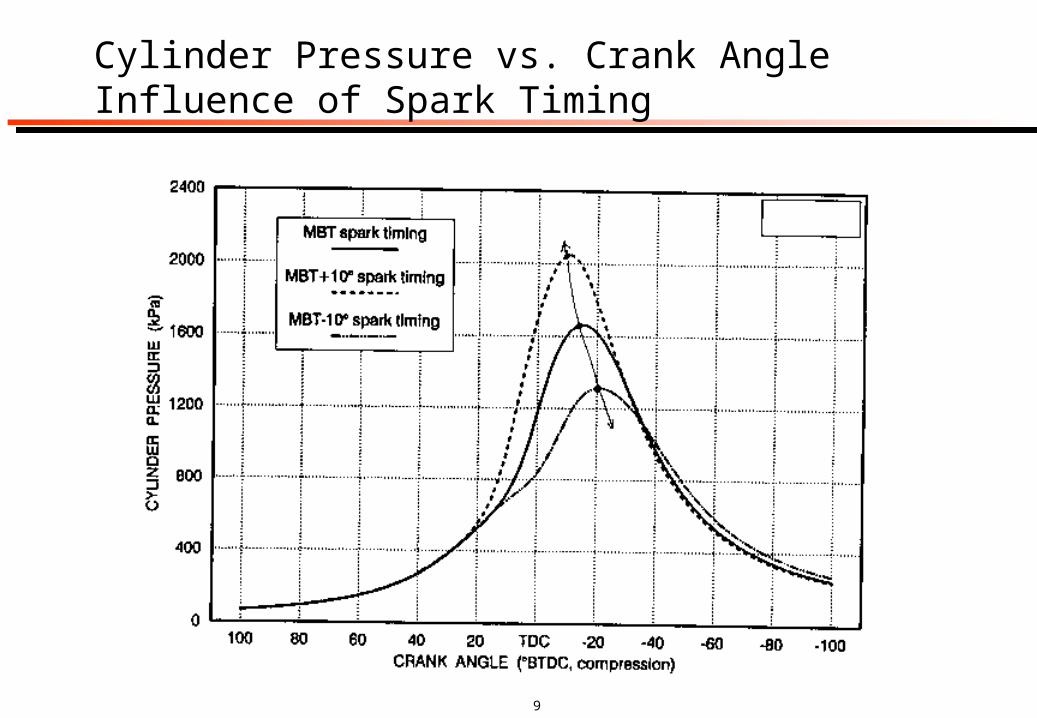
Cylinder Pressure vs. Crank AngleInfluence of Spark Timing
10
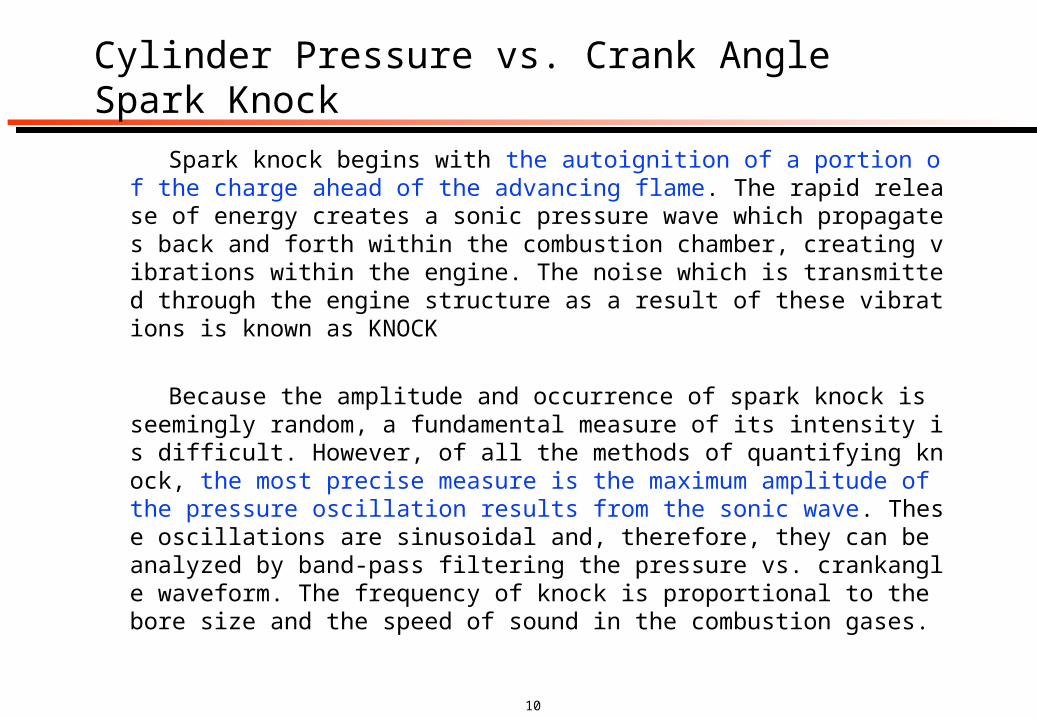
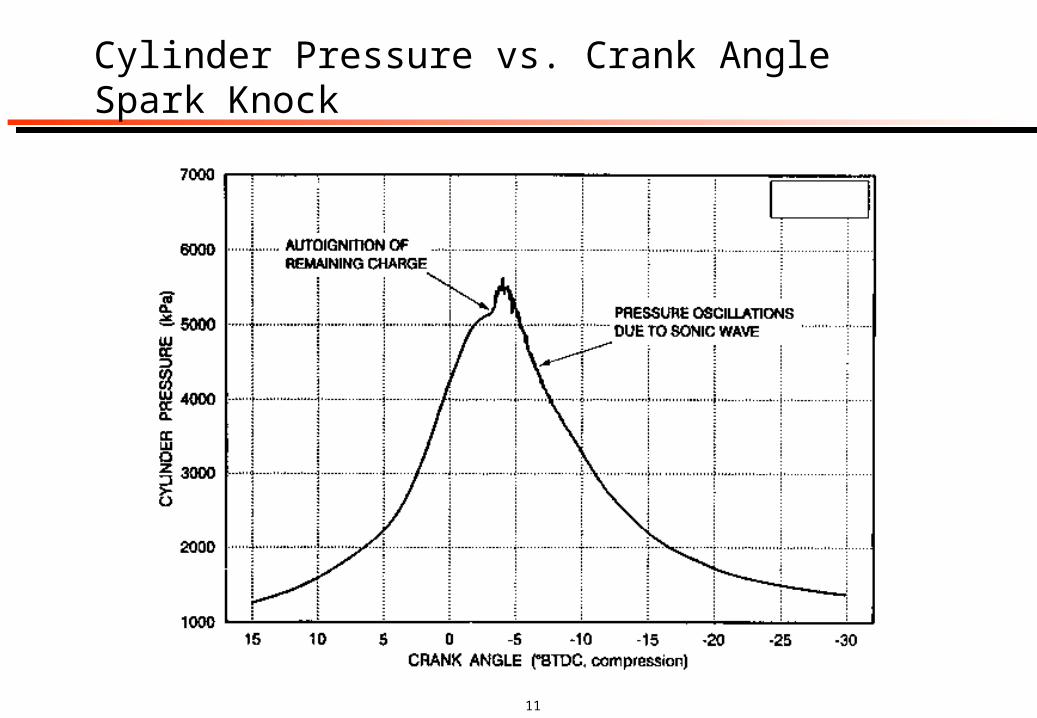
Cylinder Pressure vs. Crank AngleSpark Knock Spark knock begins with the autoignition of a portion of the charge a
head of the advancing flame. The rapid release of energy creates a sonic pressure wave which propagates back and forth within the combustion chamber, creating vibrations within the engine. The noise which is transmitted through the engine structure as a result of these vibrations is known as KNOCK
Because the amplitude and occurrence of spark knock is seemingly random, a fundamental measure of its intensity is difficult. However, of all the methods of quantifying knock, the most precise measure is the maximum amplitude of the pressure oscillation results from the sonic wave. These oscillations are sinusoidal and, therefore, they can be analyzed by band-pass filtering the pressure vs. crankangle waveform. The frequency of knock is proportional to the bore size and the speed of sound in the combustion gases.
11
Cylinder Pressure vs. Crank AngleSpark Knock
12
Rate of Pressure Change vs. Crank AngleGeneral Information The first derivative of the pressure-crank angle waveform
Also known as dP/d
Required to determine the maximum rate of pressure rise
A very useful tool for the diagnosis of electrical and mechanical noise in the pressure signal
13
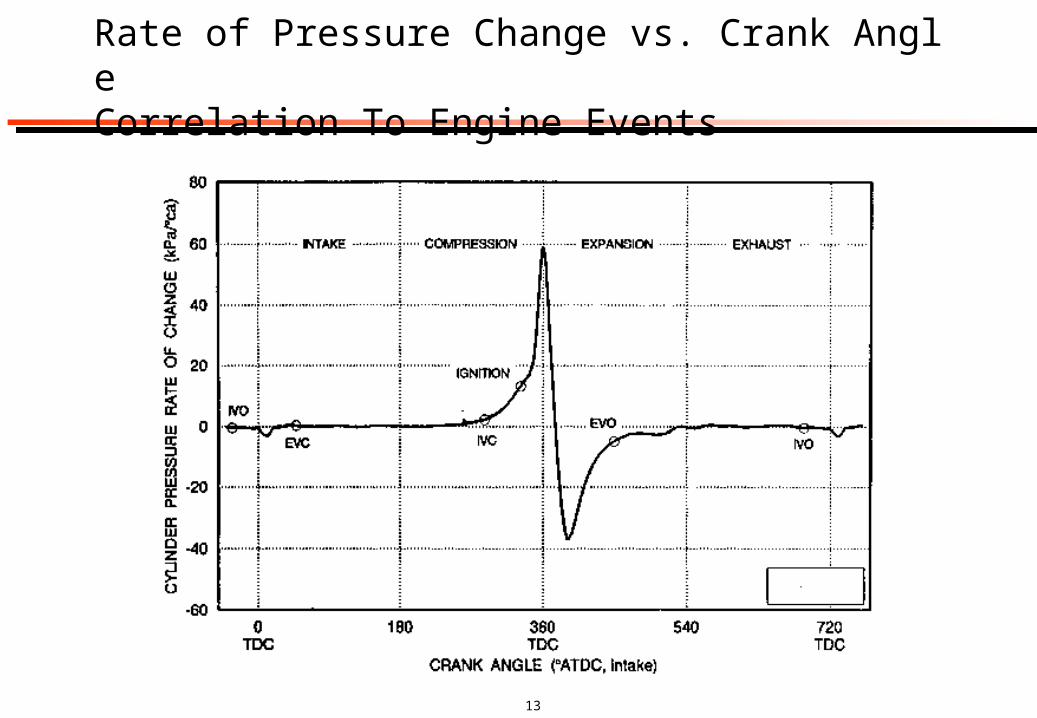
Rate of Pressure Change vs. Crank AngleCorrelation To Engine Events
14
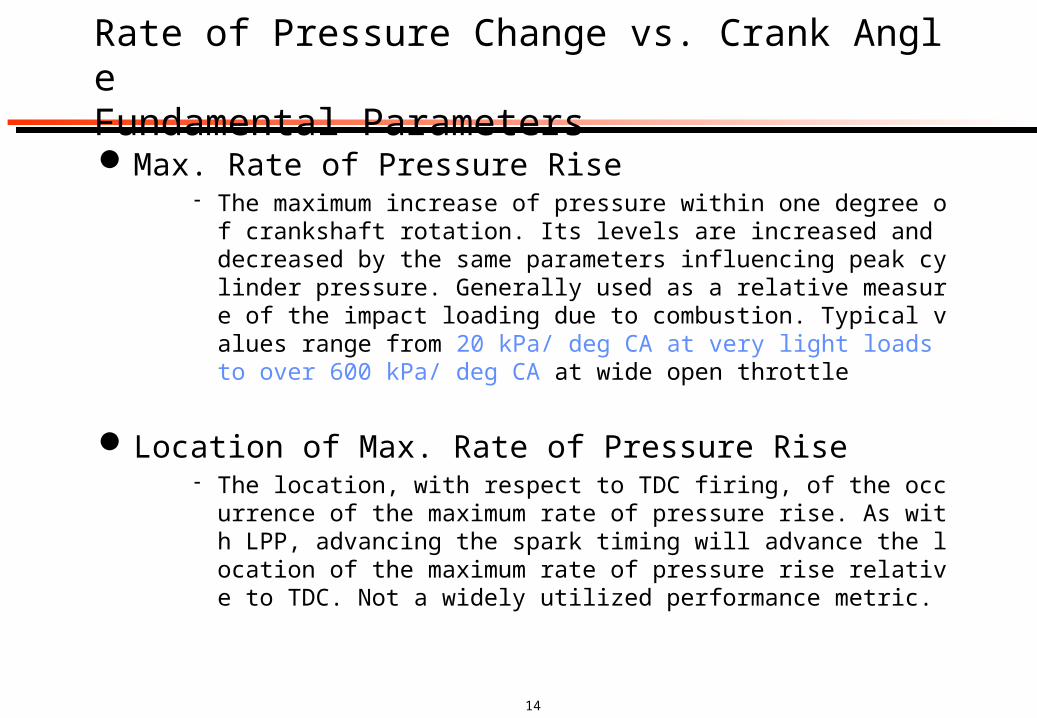
Rate of Pressure Change vs. Crank AngleFundamental ParametersMax. Rate of Pressure Rise
The maximum increase of pressure within one degree of crankshaft rotation. Its levels are increased and decreased by the same parameters influencing peak cylinder pressure. Generally used as a relative measure of the impact loading due to combustion. Typical values range from 20 kPa/ deg CA at very light loads to over 600 kPa/ deg CA at wide open throttle
Location of Max. Rate of Pressure Rise The location, with respect to TDC firing, of the occurrence of the max
imum rate of pressure rise. As with LPP, advancing the spark timing will advance the location of the maximum rate of pressure rise relative to TDC. Not a widely utilized performance metric.
15
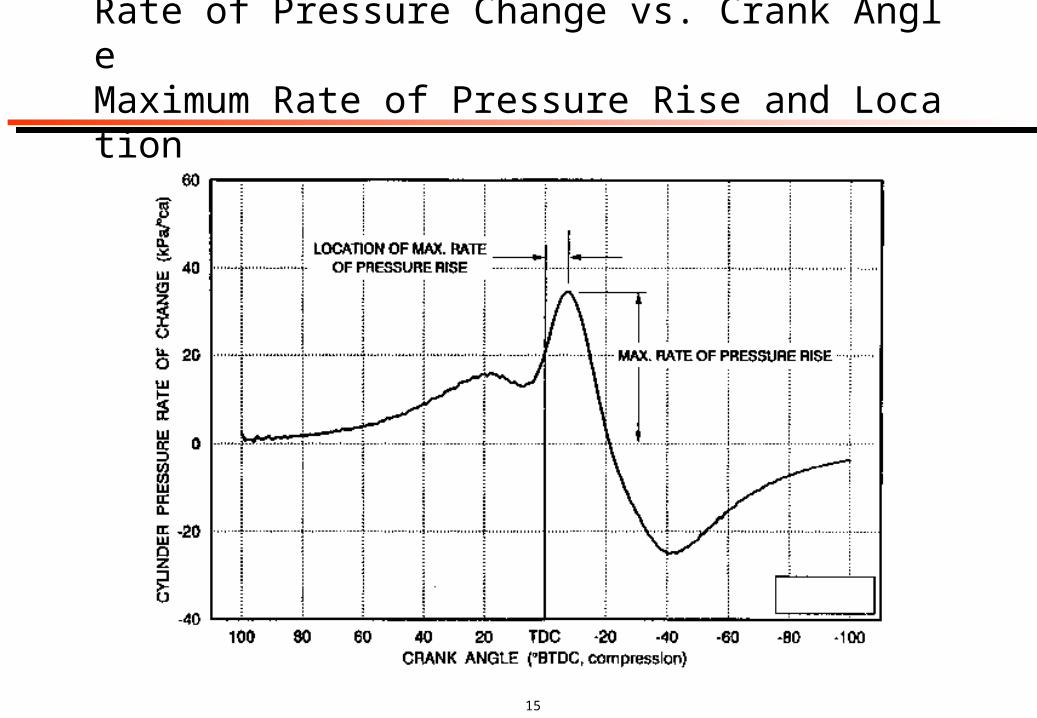
Rate of Pressure Change vs. Crank AngleMaximum Rate of Pressure Rise and Location
16
Rate of Pressure Change vs. Crank AngleFiring vs. Motoring
17
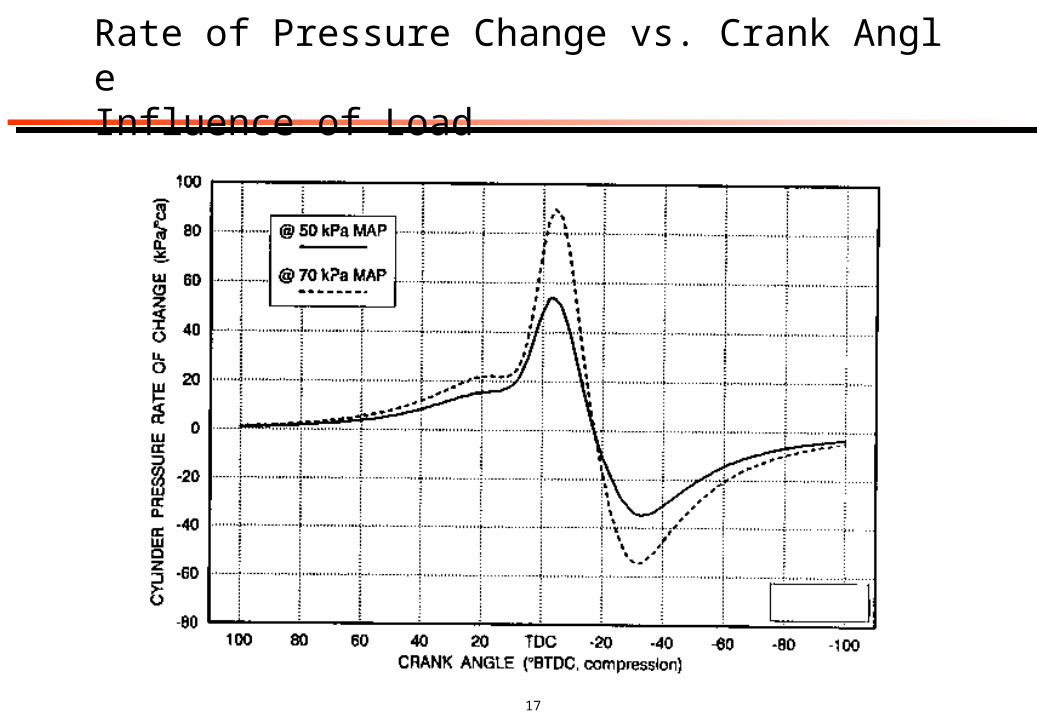
Rate of Pressure Change vs. Crank AngleInfluence of Load
18
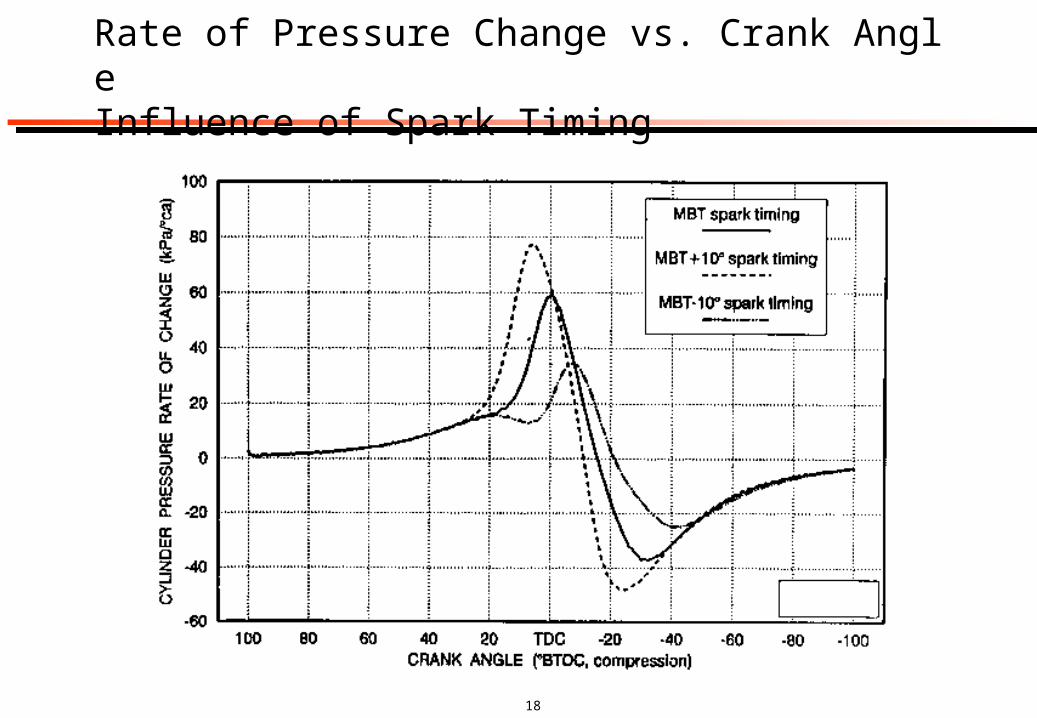
Rate of Pressure Change vs. Crank AngleInfluence of Spark Timing
19
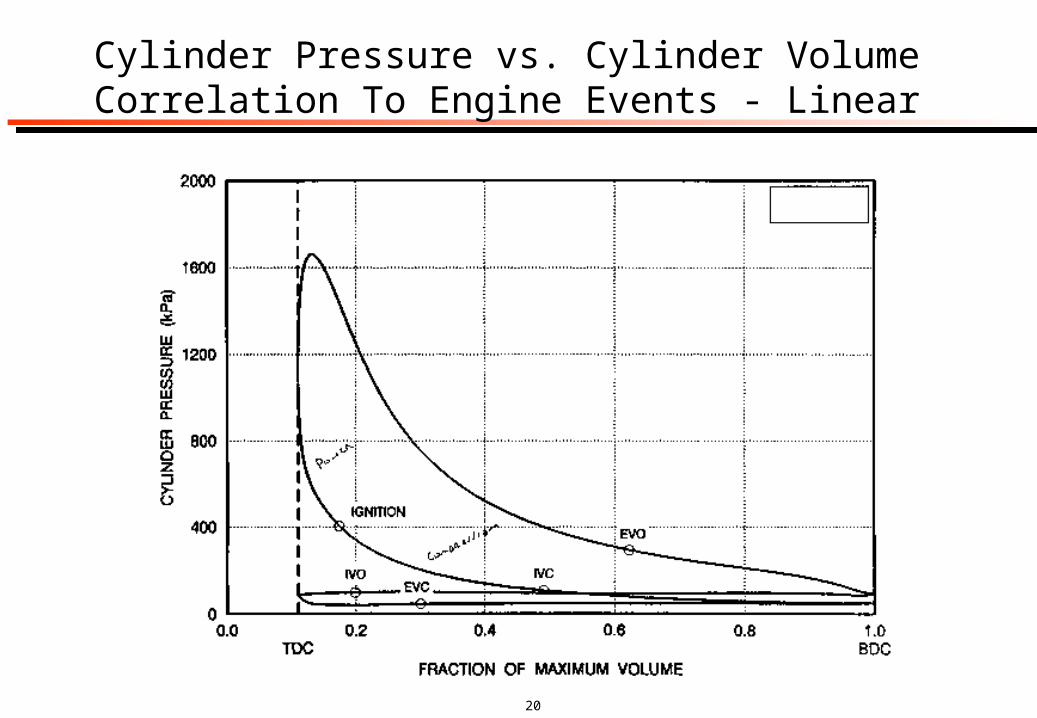
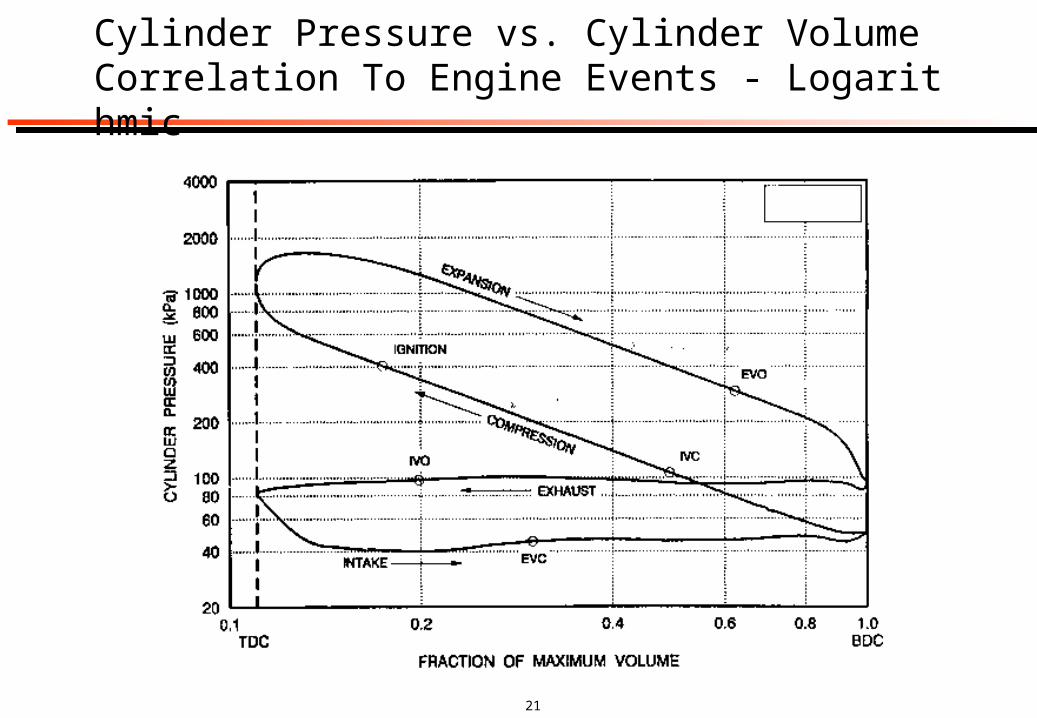
Cylinder Pressure vs. Cylinder VolumeGeneral Information
Calculated from the Pressure-crank angle waveform and engine geo
metry
Also known ass the P-V diagram
Since work is the product of pressure and volume change, analysis o
f the P-V diagram will yield displacement specific torque
Required to determine the polytropic compression and expansion co
efficients
Required to determine indicated mean effective pressure (IMEP), pu
mping mean effective pressure (PMEP), and net mean effective pres
sure (NMEP)
The logarithmic form of the P-V diagram is the most useful tool for q
uantifying the quality of the pressure-crank angle measurement
20
Cylinder Pressure vs. Cylinder VolumeCorrelation To Engine Events - Linear
21
Cylinder Pressure vs. Cylinder VolumeCorrelation To Engine Events - Logarithmic
22
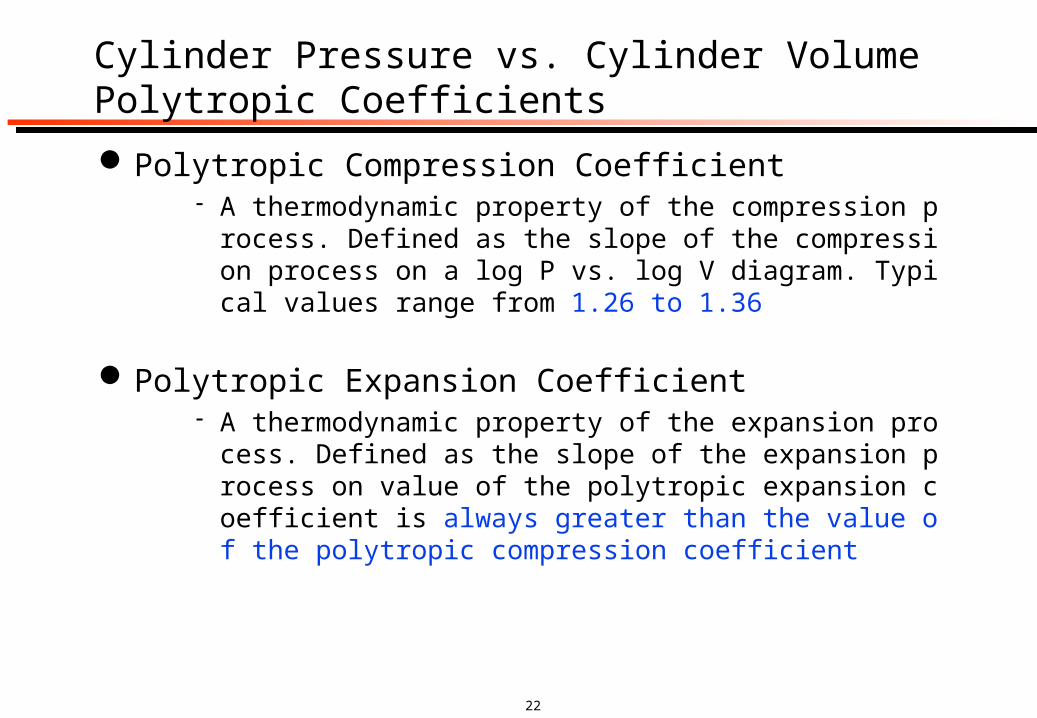
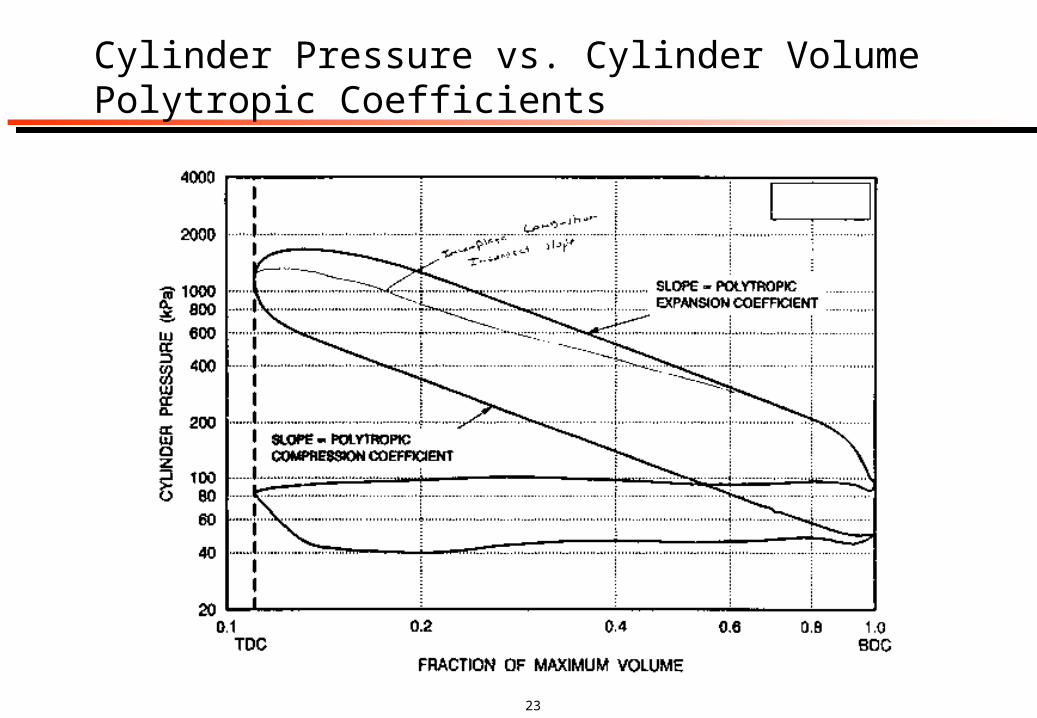
Cylinder Pressure vs. Cylinder VolumePolytropic CoefficientsPolytropic Compression Coefficient
A thermodynamic property of the compression process. Defined as the slope of the compression process on a log P vs. log V diagram. Typical values range from 1.26 to 1.36
Polytropic Expansion Coefficient A thermodynamic property of the expansion process. Defined
as the slope of the expansion process on value of the polytropic expansion coefficient is always greater than the value of the polytropic compression coefficient
23
Cylinder Pressure vs. Cylinder VolumePolytropic Coefficients
24
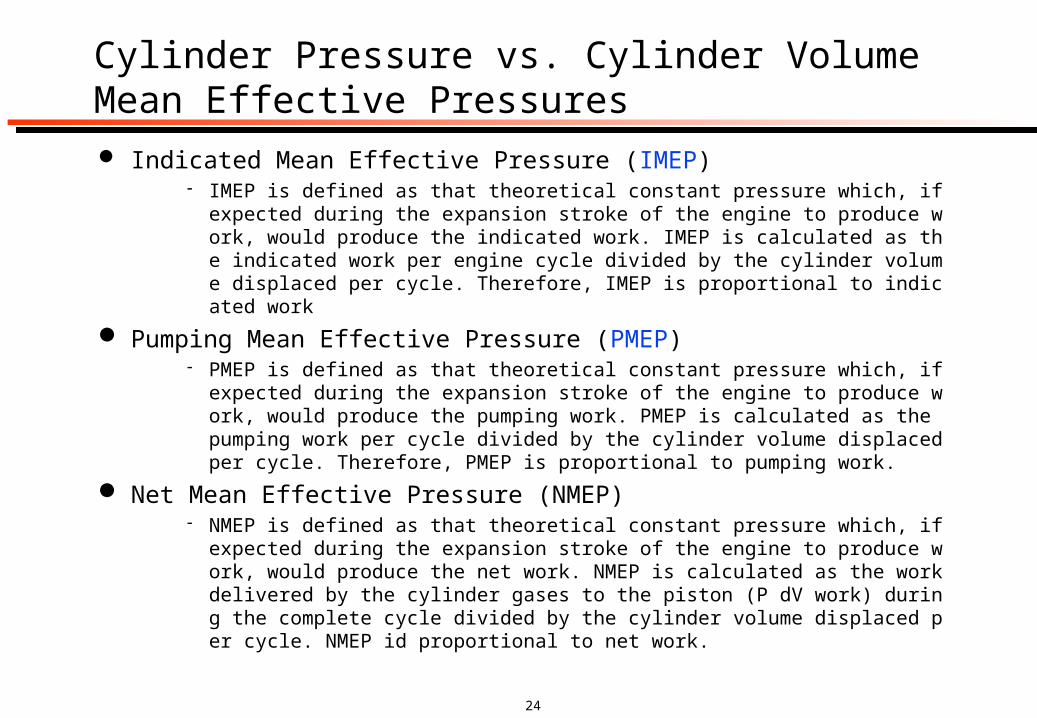
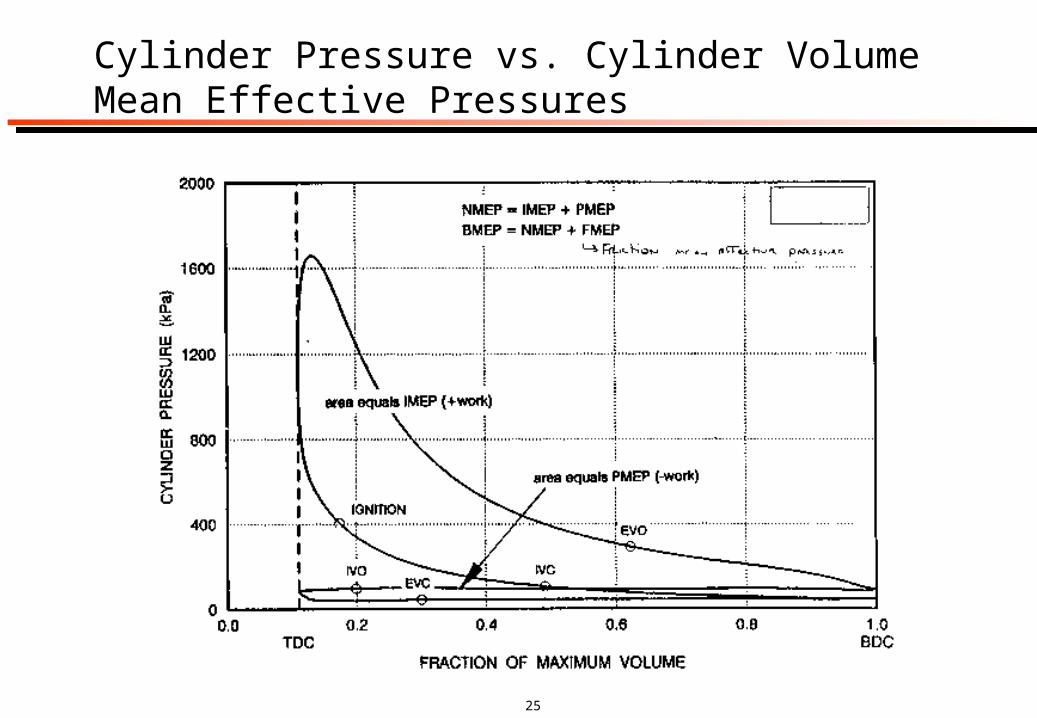
Cylinder Pressure vs. Cylinder VolumeMean Effective Pressures Indicated Mean Effective Pressure (IMEP)
IMEP is defined as that theoretical constant pressure which, if expected during the expansion stroke of the engine to produce work, would produce the indicated work. IMEP is calculated as the indicated work per engine cycle divided by the cylinder volume displaced per cycle. Therefore, IMEP is proportional to indicated work
Pumping Mean Effective Pressure (PMEP) PMEP is defined as that theoretical constant pressure which, if expected duri
ng the expansion stroke of the engine to produce work, would produce the pumping work. PMEP is calculated as the pumping work per cycle divided by the cylinder volume displaced per cycle. Therefore, PMEP is proportional to pumping work.
Net Mean Effective Pressure (NMEP) NMEP is defined as that theoretical constant pressure which, if expected duri
ng the expansion stroke of the engine to produce work, would produce the net work. NMEP is calculated as the work delivered by the cylinder gases to the piston (P dV work) during the complete cycle divided by the cylinder volume displaced per cycle. NMEP id proportional to net work.
25
Cylinder Pressure vs. Cylinder VolumeMean Effective Pressures
26
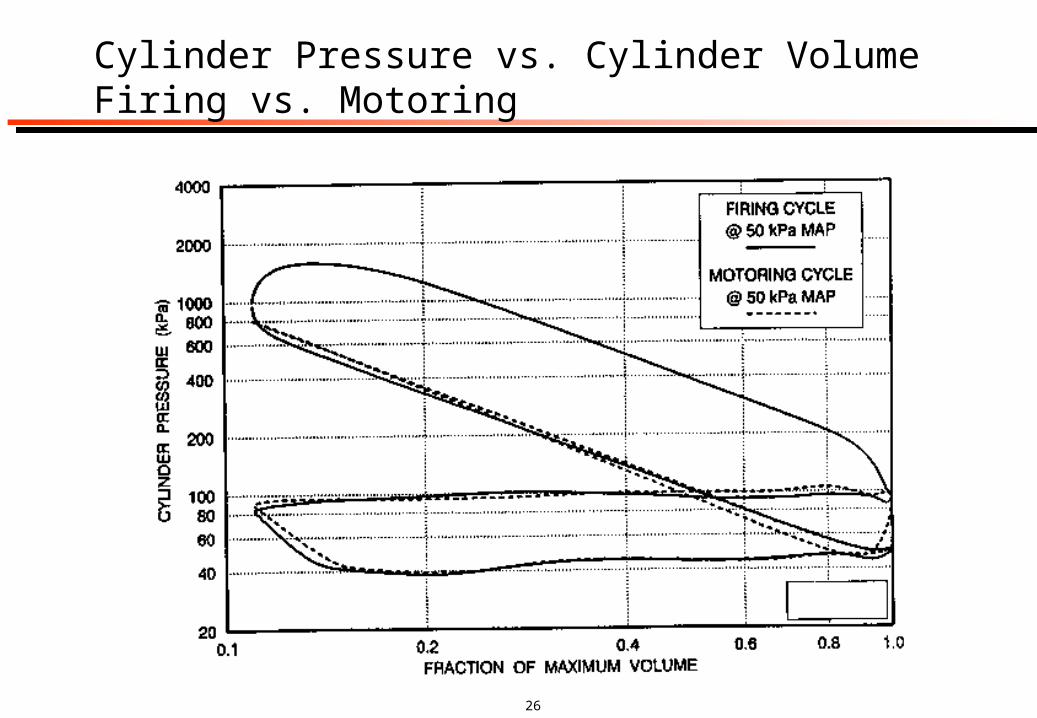
Cylinder Pressure vs. Cylinder VolumeFiring vs. Motoring
27
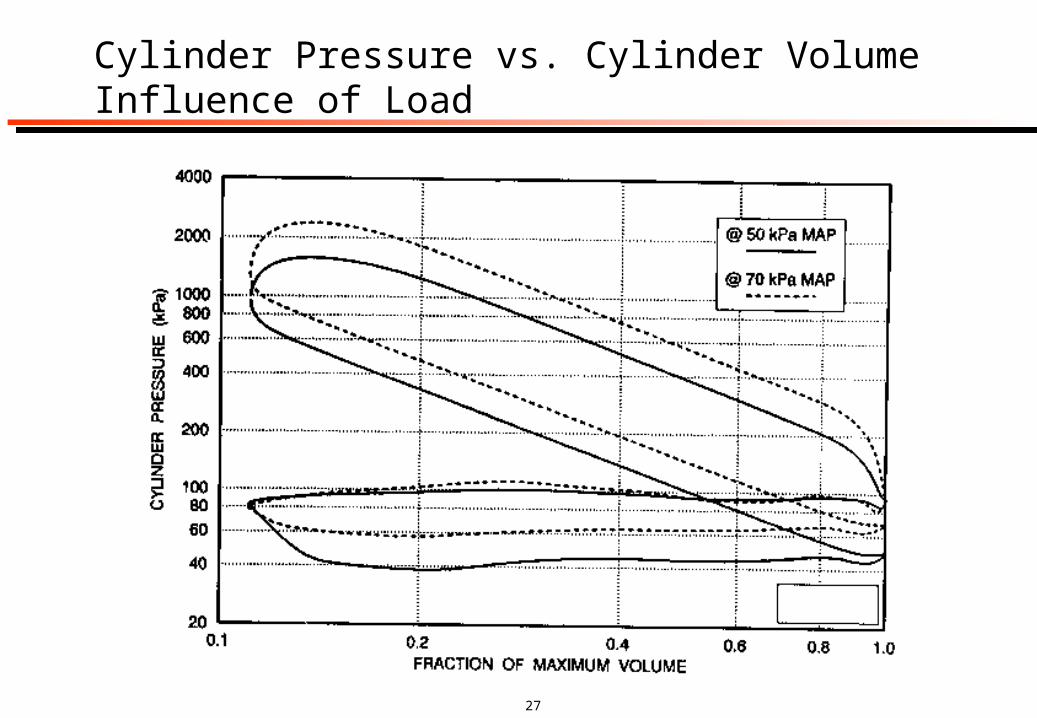
Cylinder Pressure vs. Cylinder VolumeInfluence of Load
28
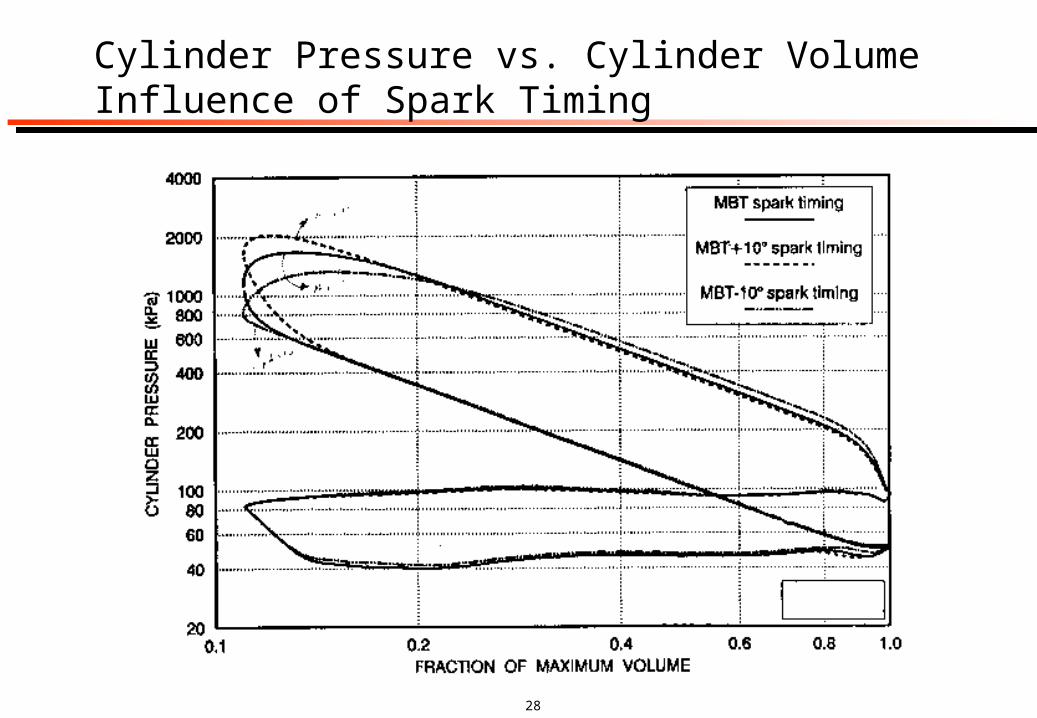
Cylinder Pressure vs. Cylinder VolumeInfluence of Spark Timing
29
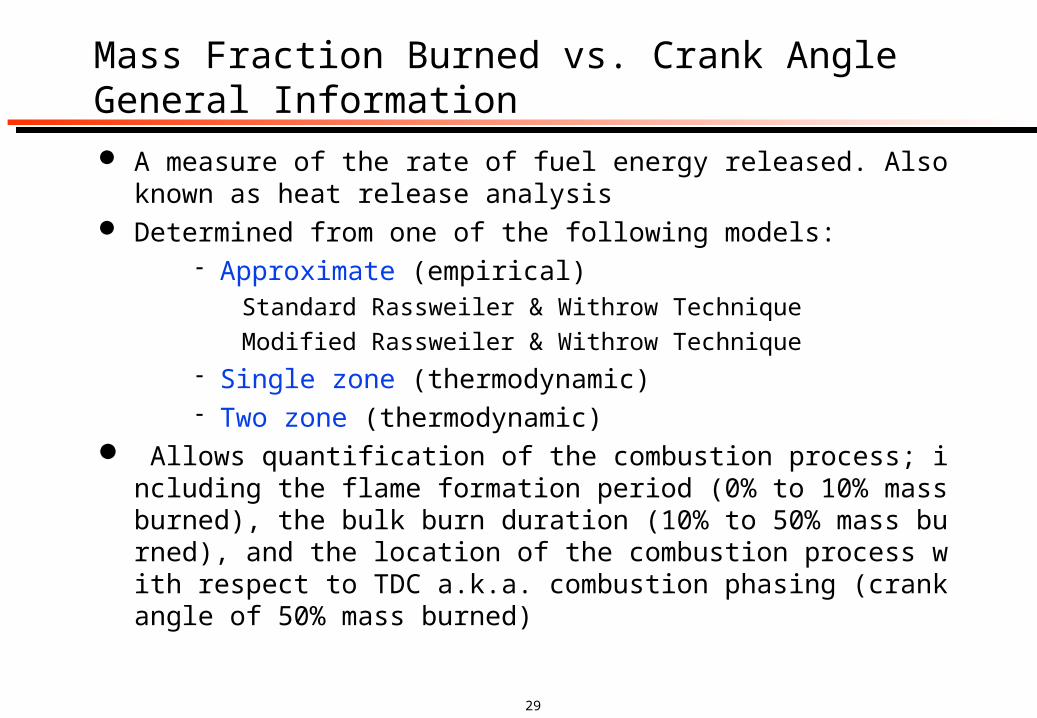
Mass Fraction Burned vs. Crank AngleGeneral Information A measure of the rate of fuel energy released. Also known as heat re
lease analysis Determined from one of the following models:
Approximate (empirical)Standard Rassweiler & Withrow Technique
Modified Rassweiler & Withrow Technique Single zone (thermodynamic) Two zone (thermodynamic)
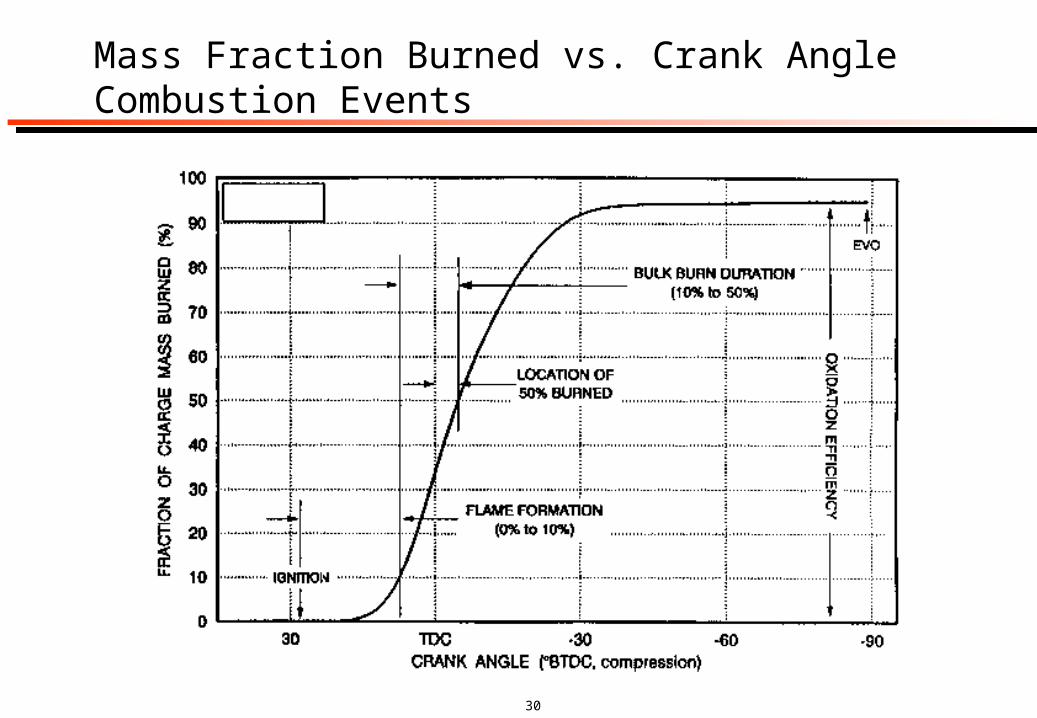
Allows quantification of the combustion process; including the flame formation period (0% to 10% mass burned), the bulk burn duration (10% to 50% mass burned), and the location of the combustion process with respect to TDC a.k.a. combustion phasing (crank angle of 50% mass burned)
30
Mass Fraction Burned vs. Crank Angle Combustion Events
31
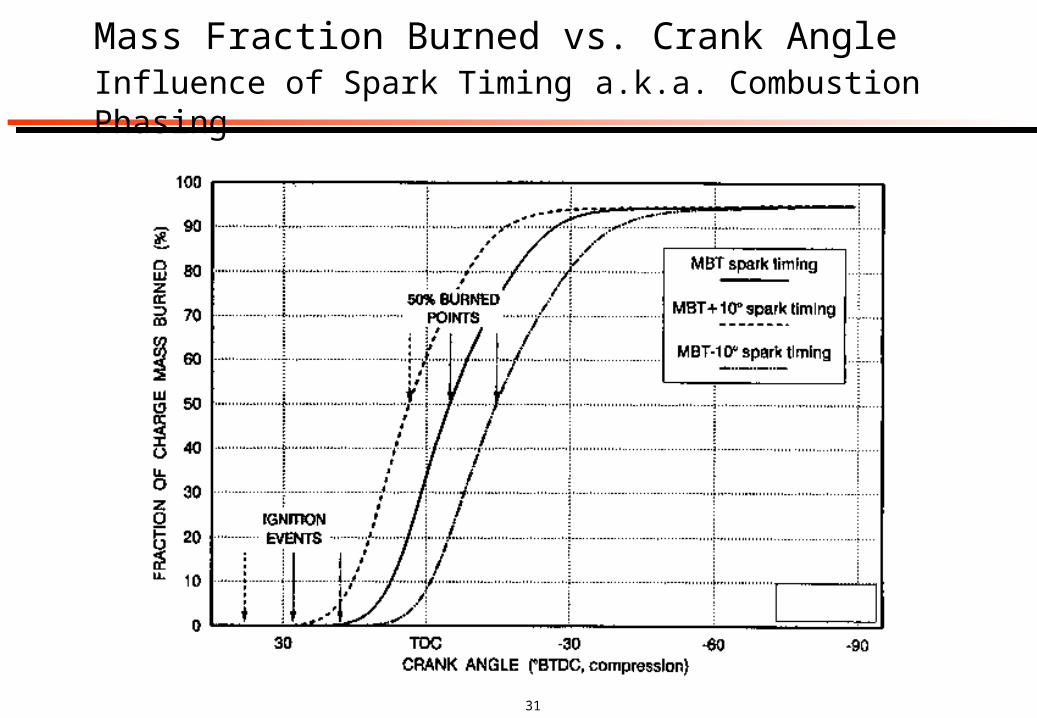
Mass Fraction Burned vs. Crank AngleInfluence of Spark Timing a.k.a. Combustion Phasing
32
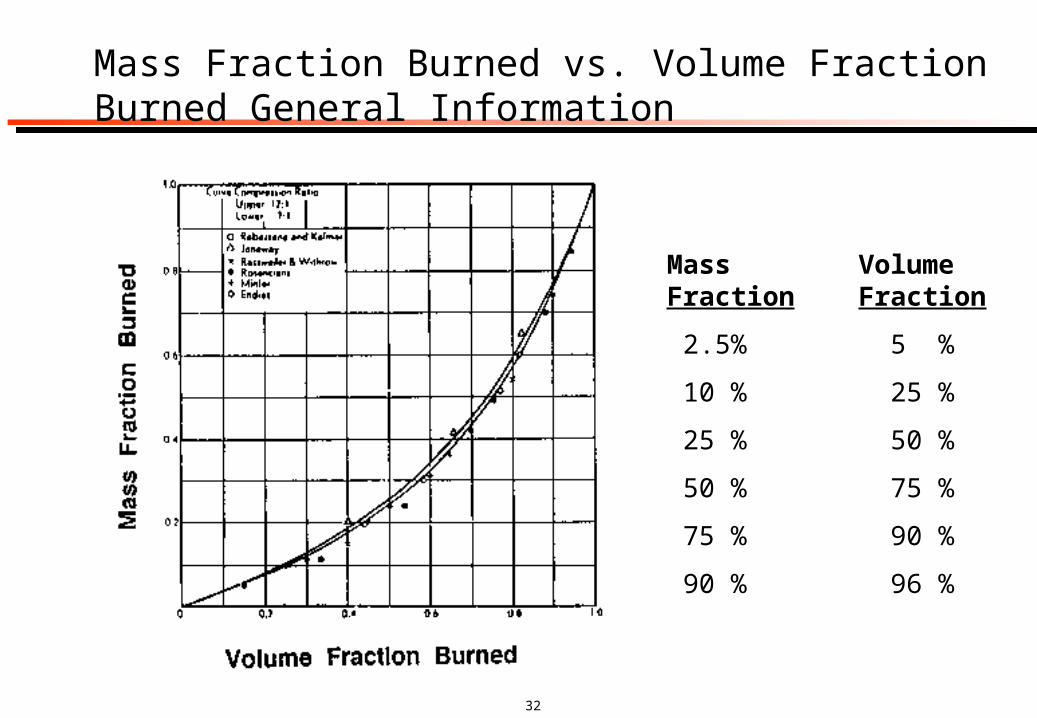
Mass Fraction Burned vs. Volume Fraction Burned General Information
Mass VolumeFraction Fraction
2.5% 5 %
10 % 25 %
25 % 50 %
50 % 75 %
75 % 90 %
90 % 96 %
33
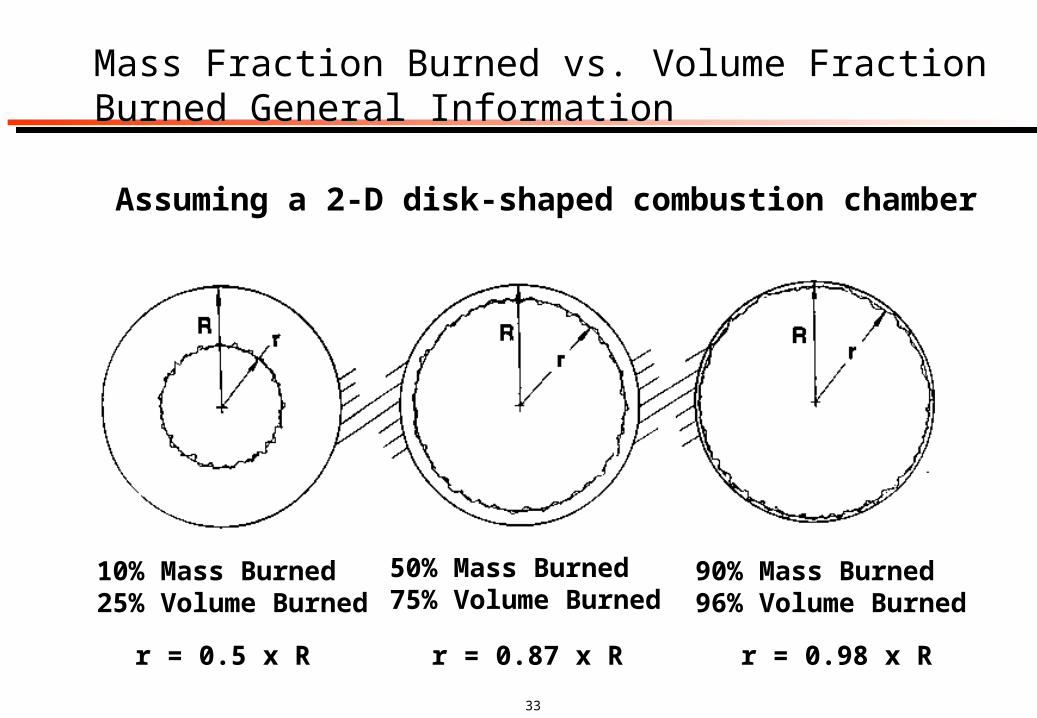
Mass Fraction Burned vs. Volume Fraction Burned General Information
Assuming a 2-D disk-shaped combustion chamber
10% Mass Burned25% Volume Burned
50% Mass Burned75% Volume Burned
90% Mass Burned96% Volume Burned
r = 0.5 x R r = 0.87 x R r = 0.98 x R
34
Cycle-to-Cycle VariabilityCylinder Pressure Based Performance Cylinder pressure based parameters commonly used to characterize
the cyclic variability of the combustion process:
Variation of peak cylinder pressure Variation of the location of peak cylinder pressure Variation of maximum rate of pressure rise Variation of the location of maximum rate of pressure rise Variation of cylinder pressure at a fixed crank angle Variation of IMEP Variation of the flame formation period Variation of the bulk burn duration
35
Cycle-to-Cycle VariabilityPerformance Statistics COV (Coefficient of Variation)
The Standard deviation of a sample set divided by the mean of the sample set and multiplied by 100. Therefore, COV is the standard deviation as a percent of the mean.
LNV (Lowest Normalized Value) The lowest value of a data set divided by the mean of the dat
a set
HNV (Highest Normalized Value) The highest value of a data set divided by the mean of the dat
a set
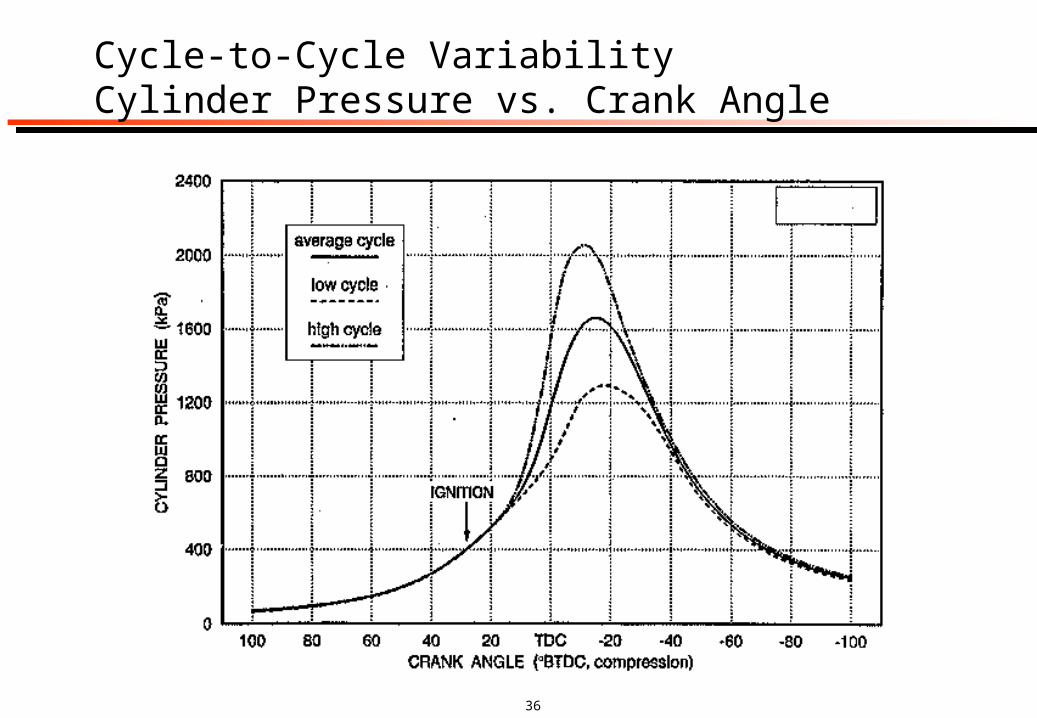
36
Cycle-to-Cycle VariabilityCylinder Pressure vs. Crank Angle
37
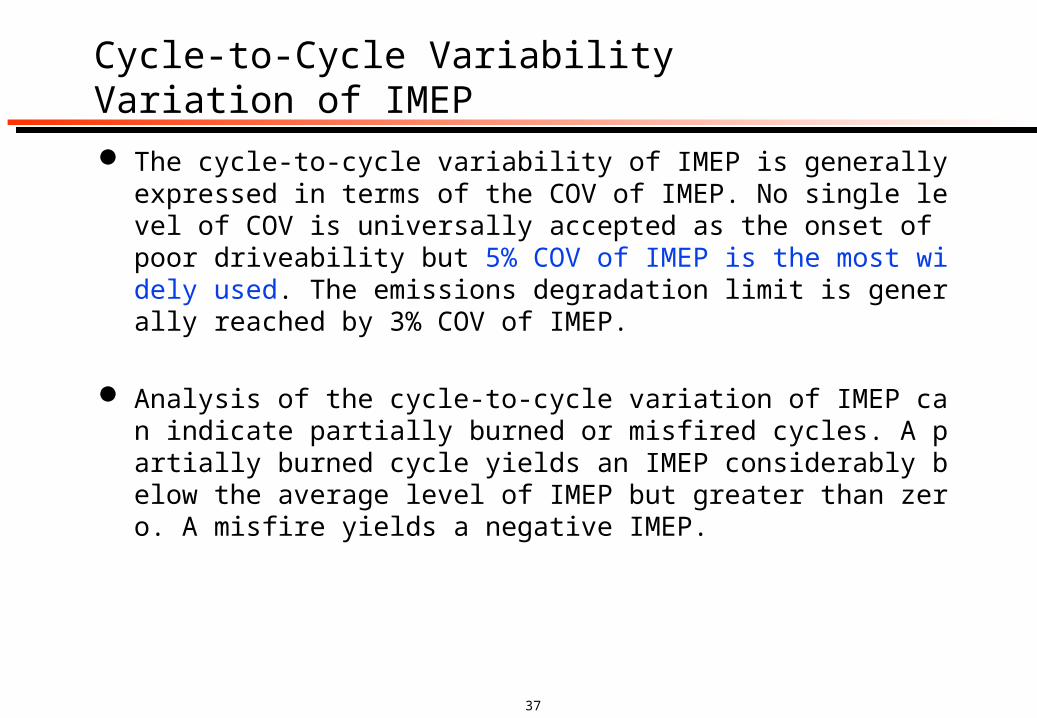
Cycle-to-Cycle VariabilityVariation of IMEP The cycle-to-cycle variability of IMEP is generally expressed in terms
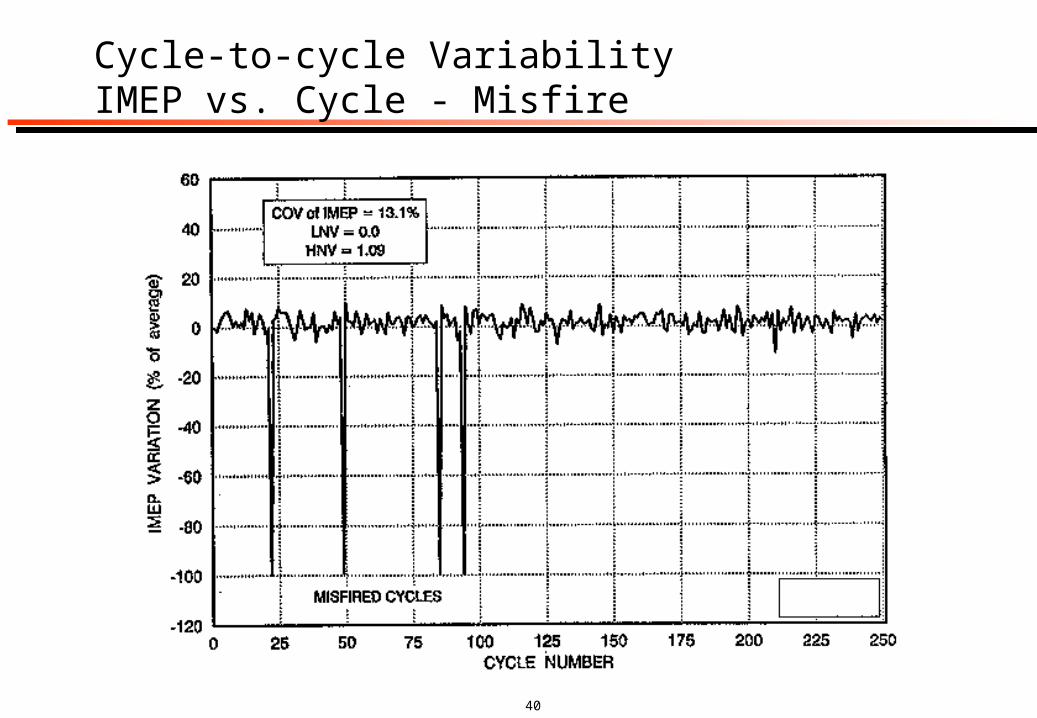
of the COV of IMEP. No single level of COV is universally accepted as the onset of poor driveability but 5% COV of IMEP is the most widely used. The emissions degradation limit is generally reached by 3% COV of IMEP.
Analysis of the cycle-to-cycle variation of IMEP can indicate partially burned or misfired cycles. A partially burned cycle yields an IMEP considerably below the average level of IMEP but greater than zero. A misfire yields a negative IMEP.
38
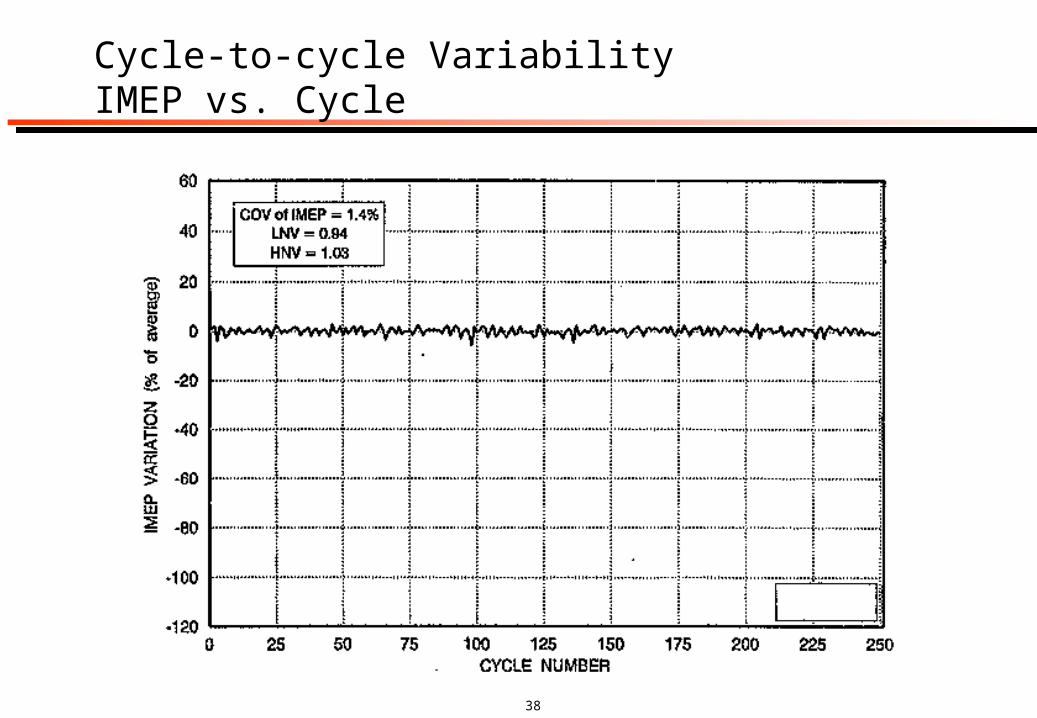
Cycle-to-cycle VariabilityIMEP vs. Cycle
39
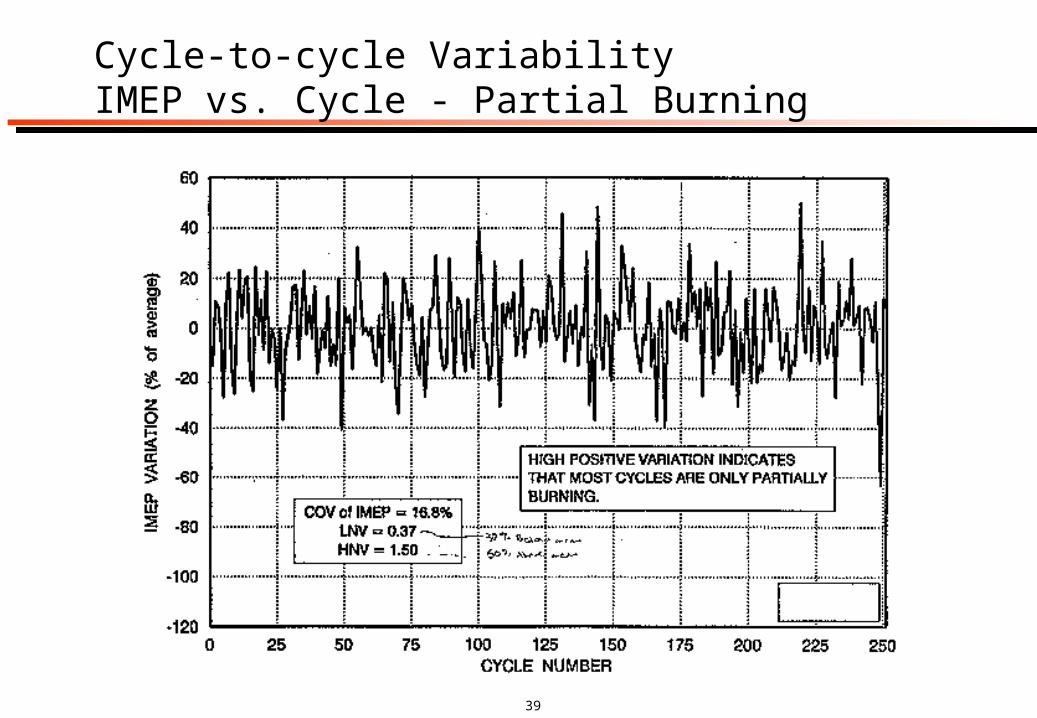
Cycle-to-cycle VariabilityIMEP vs. Cycle - Partial Burning
40
Cycle-to-cycle VariabilityIMEP vs. Cycle - Misfire
41
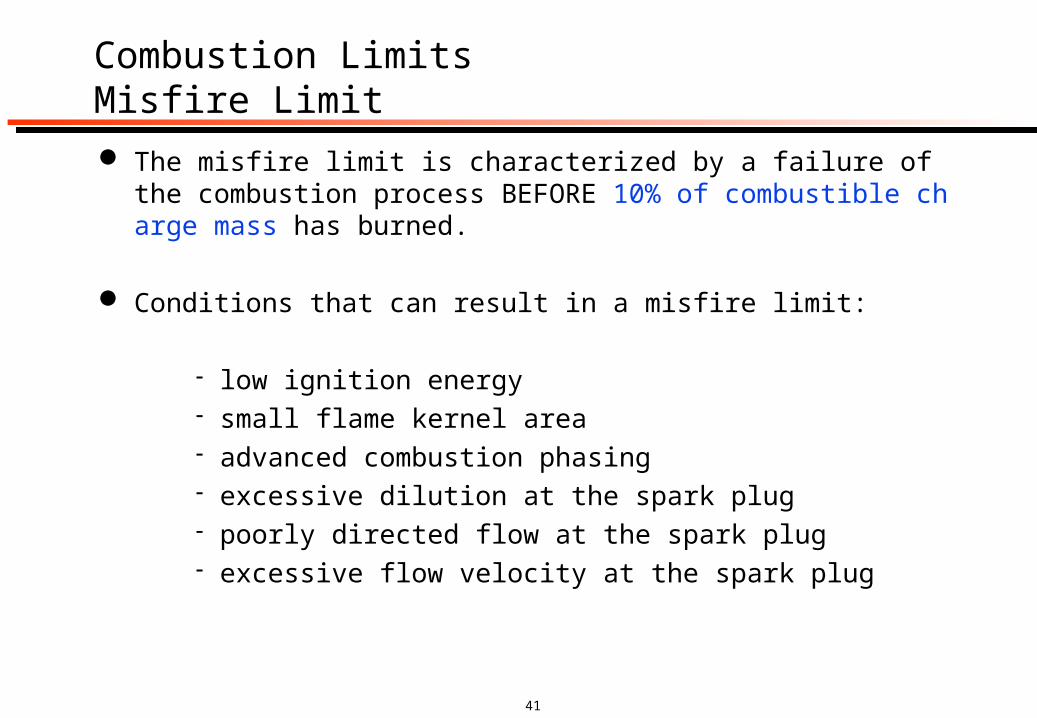
Combustion LimitsMisfire Limit The misfire limit is characterized by a failure of the combustion proce
ss BEFORE 10% of combustible charge mass has burned.
Conditions that can result in a misfire limit:
low ignition energy small flame kernel area advanced combustion phasing excessive dilution at the spark plug poorly directed flow at the spark plug excessive flow velocity at the spark plug
42
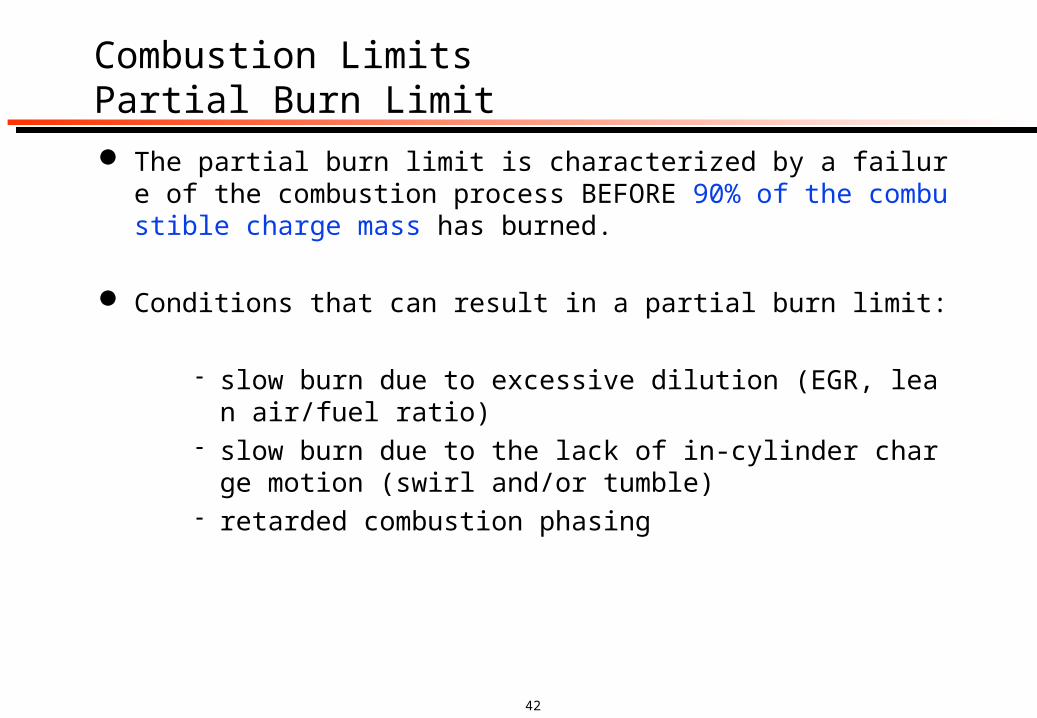
Combustion LimitsPartial Burn Limit The partial burn limit is characterized by a failure of the combustion p
rocess BEFORE 90% of the combustible charge mass has burned.
Conditions that can result in a partial burn limit:
slow burn due to excessive dilution (EGR, lean air/fuel ratio) slow burn due to the lack of in-cylinder charge motion (swirl a
nd/or tumble) retarded combustion phasing
43
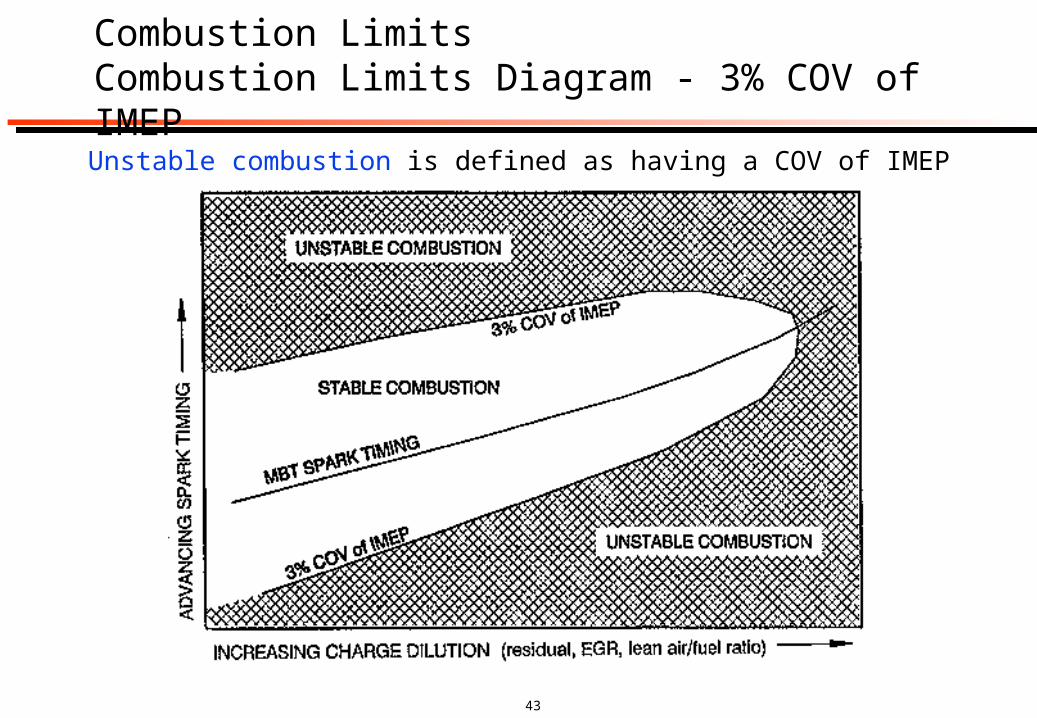
Combustion LimitsCombustion Limits Diagram - 3% COV of IMEP
Unstable combustion is defined as having a COV of IMEP > 3%
44
Cylinder Pressure Based Engine DiagnosticsFinal Thoughts
Poor cycle-to-cycle and cylinder-to-cylinder combustion performance
is a significant problem with many engines
Cycle-to-cycle and cylinder-to-cylinder combustion performance is b
est studied with cylinder pressure based engine diagnostics.
Until recently, Cycle-to-cycle combustion variation has been the prim
ary focus of combustion studies. Cylinder-to-cylinder combustion vari
ation, while observed, was not widely studied.
The use of cylinder pressure based engine diagnostics within GM is
currently at an all time high.
The GM combustion community is aggressively pursuing cycle-to-cy
cle and cylinder-to-cylinder combustion improvements to our current
and future powertrains.