Embed Size (px)
Citation preview
1
Commissioning to reduce health inequalities:Supporting analysis
Ester RomeriDilwyn SheersHealth Inequalities National Support TeamDepartment of Health
2
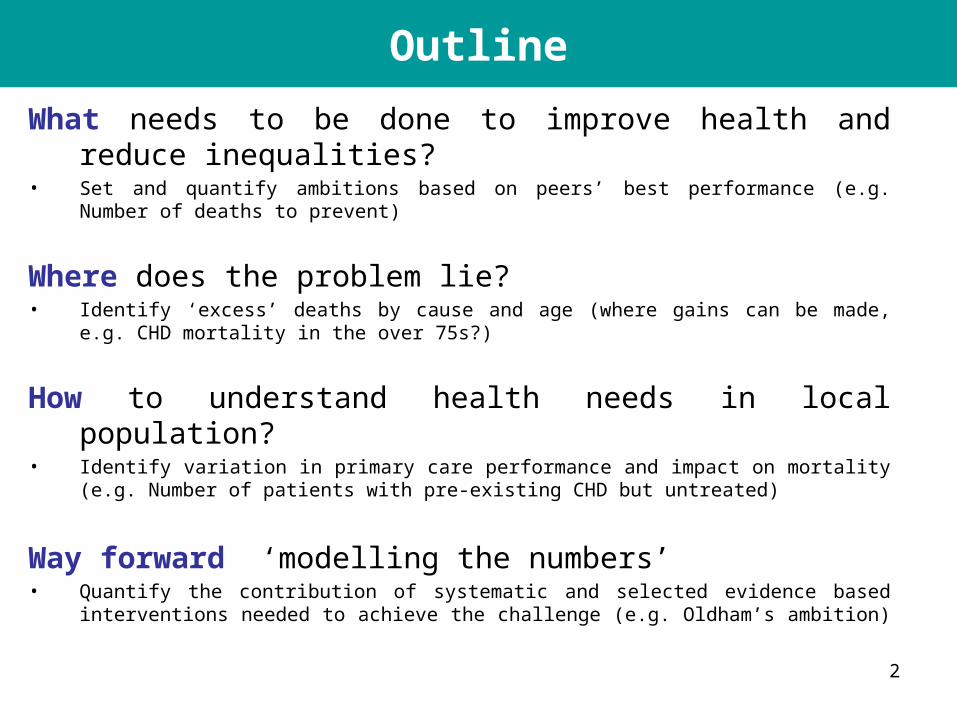
What needs to be done to improve health and reduce inequalities?
• Set and quantify ambitions based on peers’ best performance (e.g. Number of deaths to prevent)
Where does the problem lie? • Identify ‘excess’ deaths by cause and age (where gains can be made, e.g. CHD
mortality in the over 75s?)
How to understand health needs in local population?• Identify variation in primary care performance and impact on mortality (e.g. Number
of patients with pre-existing CHD but untreated)
Way forward ‘modelling the numbers’• Quantify the contribution of systematic and selected evidence based interventions
needed to achieve the challenge (e.g. Oldham’s ambition)
Outline
3
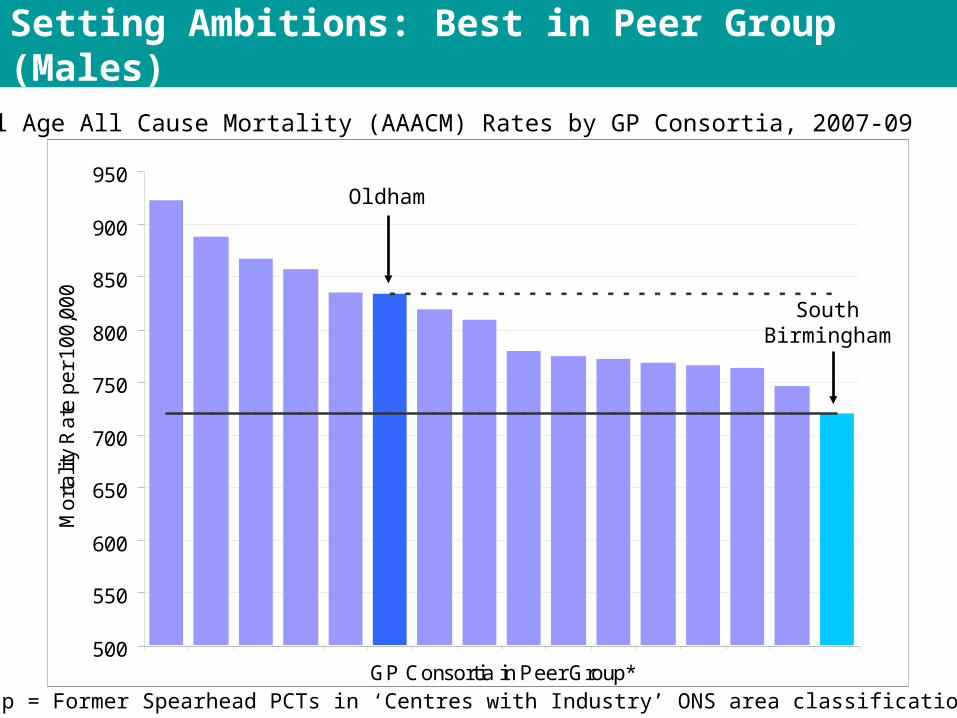
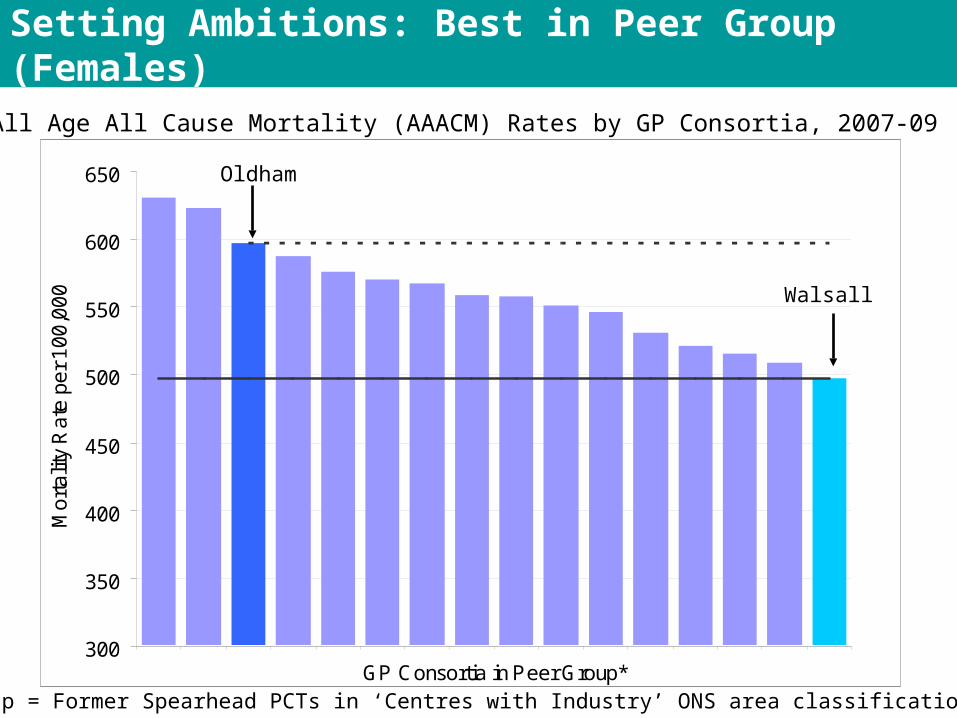
Setting Ambitions: Best in Peer Group (Males)
Male All Age All Cause Mortality (AAACM) Rates by GP Consortia, 2007-09
*Peer group = Former Spearhead PCTs in ‘Centres with Industry’ ONS area classification
500
550
600
650
700
750
800
850
900
950
GP Consortia in Peer Group*
Mo
rta
lity
Ra
te p
er
10
0,0
00
SouthBirmingham
Oldham
4
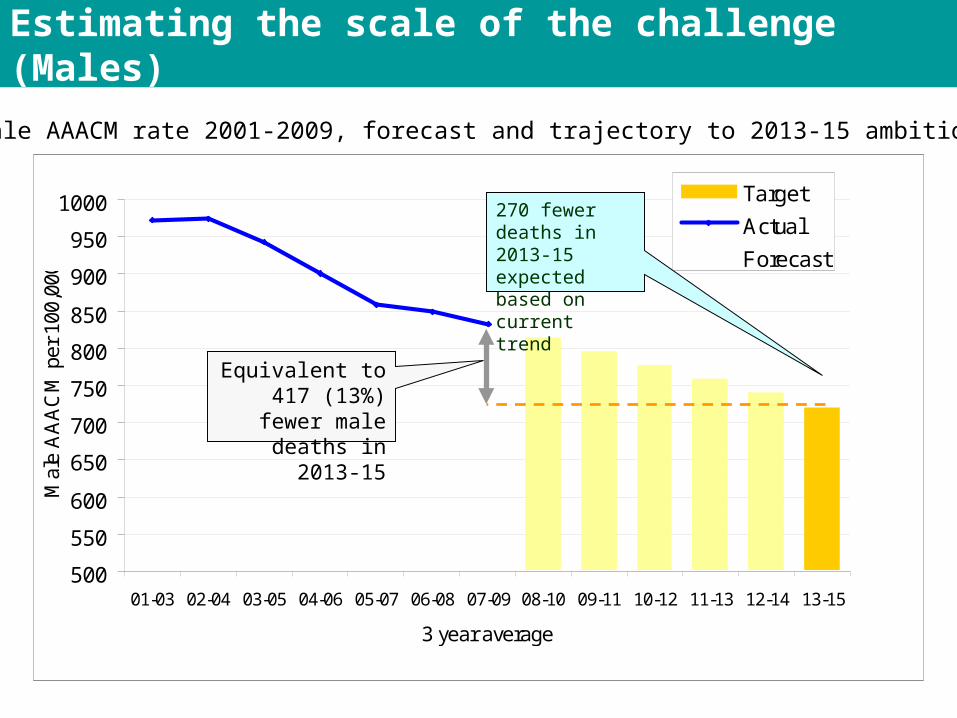
Estimating the scale of the challenge (Males)
Oldham Male AAACM rate 2001-2009, forecast and trajectory to 2013-15 ambition
500
550
600
650
700
750
800
850
900
950
1000
01-03 02-04 03-05 04-06 05-07 06-08 07-09 08-10 09-11 10-12 11-13 12-14 13-15
3 year average
Mal
e A
AA
CM
per
100
,000
Target
Actual
Forecast
Equivalent to 417 (13%) fewer male deaths in 2013-15
270 fewer deaths in 2013-15 expected based on current trend
5
Setting Ambitions: Best in Peer Group (Females)
Female All Age All Cause Mortality (AAACM) Rates by GP Consortia, 2007-09
*Peer group = Former Spearhead PCTs in ‘Centres with Industry’ ONS area classification
300
350
400
450
500
550
600
650
GP Consortia in Peer Group*
Mo
rta
lity
Ra
te p
er
10
0,0
00 Walsall
Oldham
6
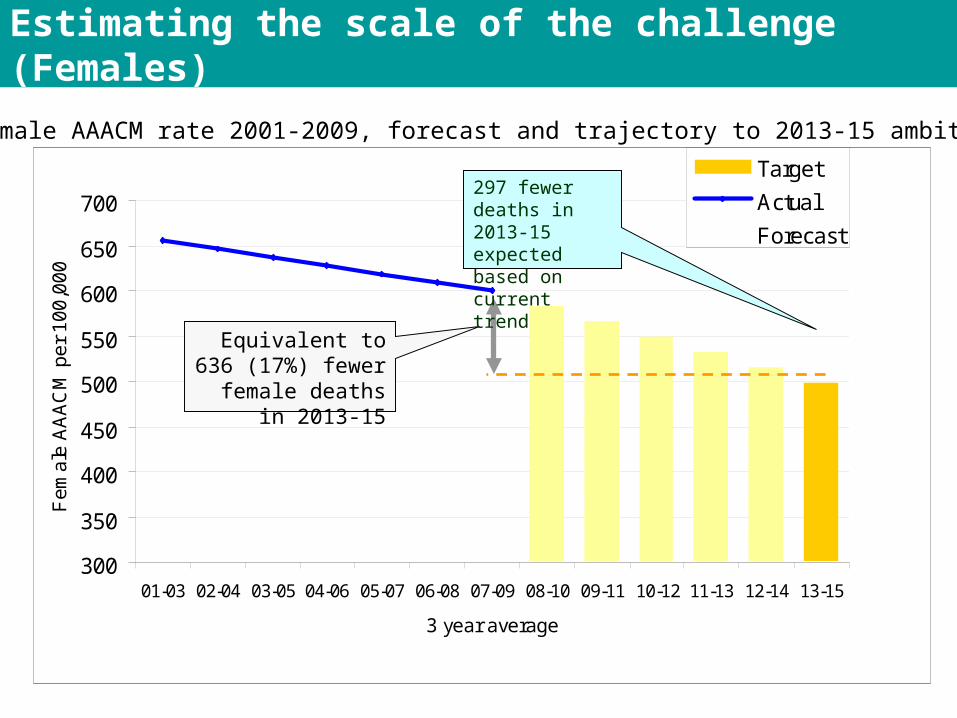
Estimating the scale of the challenge (Females)
Oldham Female AAACM rate 2001-2009, forecast and trajectory to 2013-15 ambition
300
350
400
450
500
550
600
650
700
01-03 02-04 03-05 04-06 05-07 06-08 07-09 08-10 09-11 10-12 11-13 12-14 13-15
3 year average
Fe
ma
le A
AA
CM
pe
r 1
00
,00
0
Target
Actual
Forecast
Equivalent to 636 (17%) fewer female
deaths in 2013-15
297 fewer deaths in 2013-15 expected based on current trend
7
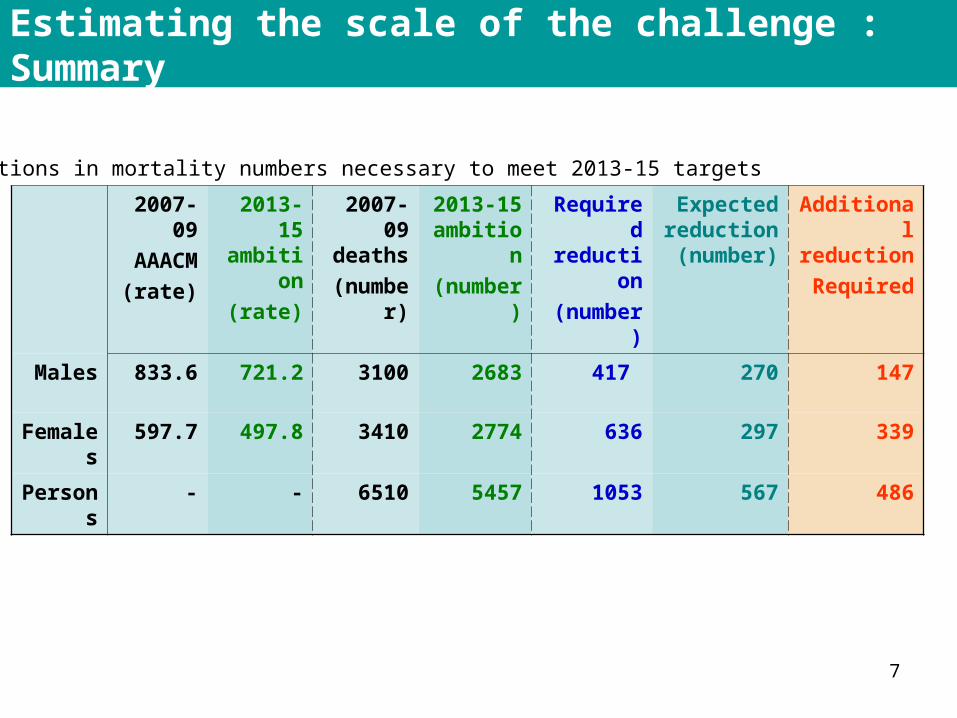
Estimating the scale of the challenge : Summary
2007-09AAACM
(rate)
2013-15 ambition
(rate)
2007-09 deaths
(number)
2013-15 ambition(number)
Required reduction(number)
Expected reduction (number)
Additional reductionRequired
Males 833.6 721.2 3100 2683 417 270 147
Females 597.7 497.8 3410 2774 636 297 339
Persons - - 6510 5457 1053 567 486
Reductions in mortality numbers necessary to meet 2013-15 targets
8
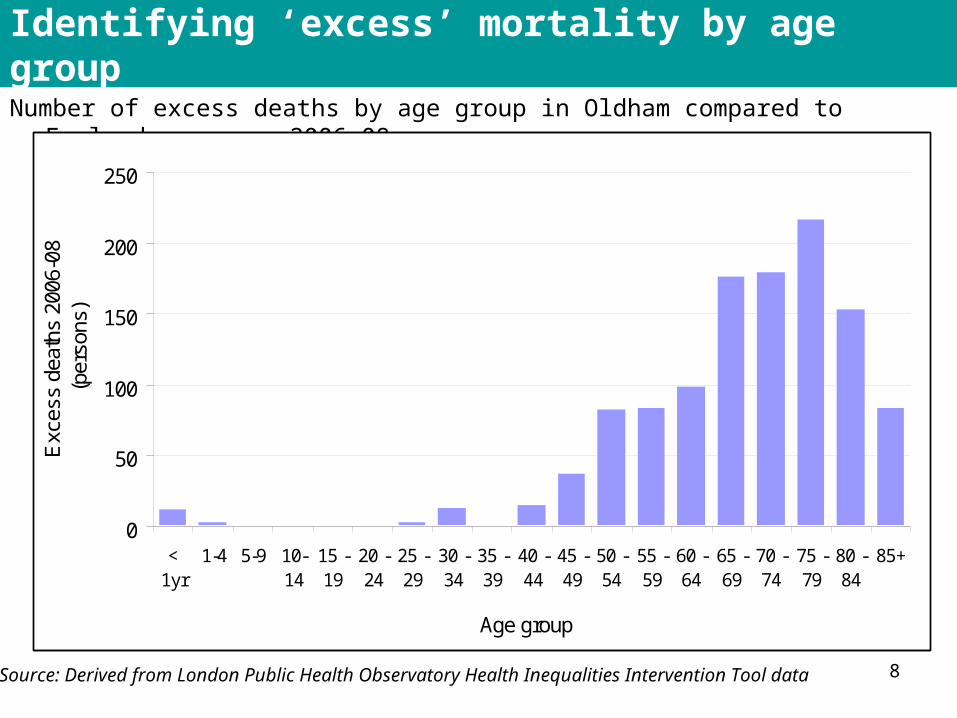
Identifying ‘excess’ mortality by age group
Number of excess deaths by age group in Oldham compared to England average, 2006-08
0
50
100
150
200
250
<1yr
1-4 5-9 10-14
15 -19
20 -24
25 -29
30 -34
35 -39
40 -44
45 -49
50 -54
55 -59
60 -64
65 -69
70 -74
75 -79
80 -84
85+
Age group
Exc
ess
deat
hs 2
006-
08(p
erso
ns)
Source: Derived from London Public Health Observatory Health Inequalities Intervention Tool data
9
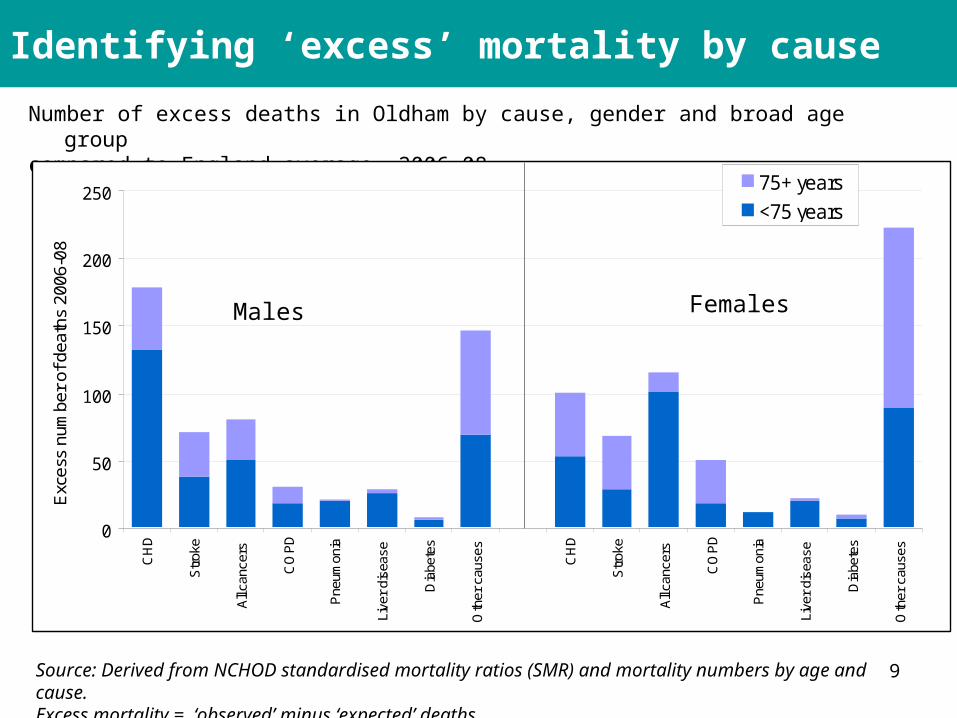
Identifying ‘excess’ mortality by cause
Number of excess deaths in Oldham by cause, gender and broad age groupcompared to England average, 2006-08
0
50
100
150
200
250
CH
D
Str
oke
All
canc
ers
CO
PD
Pne
umon
ia
Live
r di
seas
e
Dia
bete
s
Oth
er c
ause
s
CH
D
Str
oke
All
canc
ers
CO
PD
Pne
umon
ia
Live
r di
seas
e
Dia
bete
s
Oth
er c
ause
s
Exc
ess
num
ber
of d
eath
s 20
06-0
8
75+ years
<75 years
Source: Derived from NCHOD standardised mortality ratios (SMR) and mortality numbers by age and cause.Excess mortality = ‘observed’ minus ‘expected’ deaths
Males Females
10
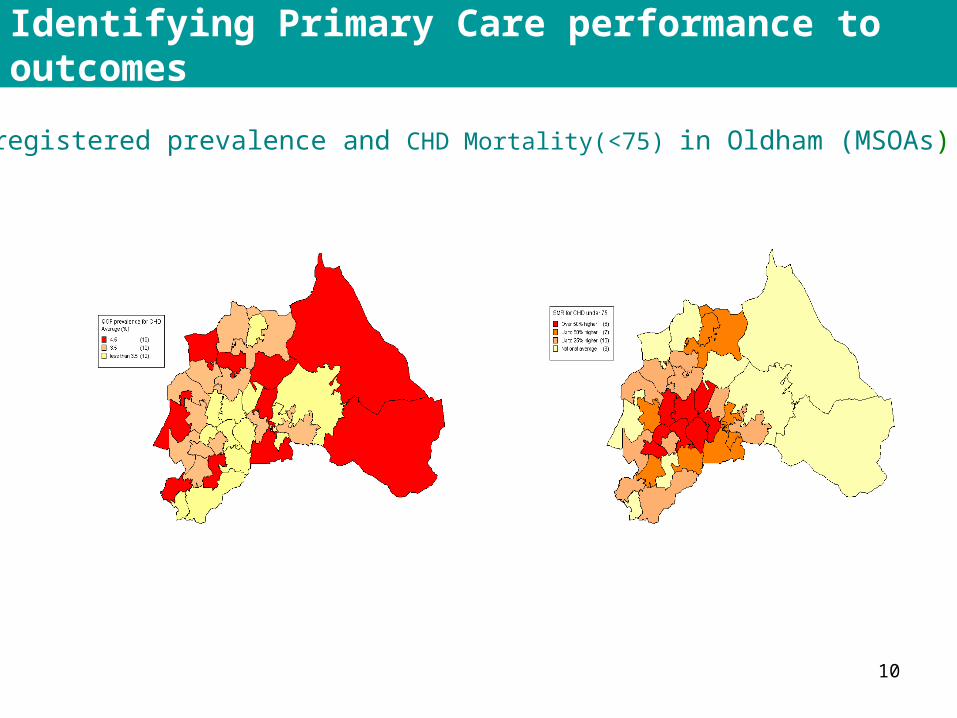
Identifying Primary Care performance to outcomes
QOF registered prevalence and CHD Mortality(<75) in Oldham (MSOAs)
11
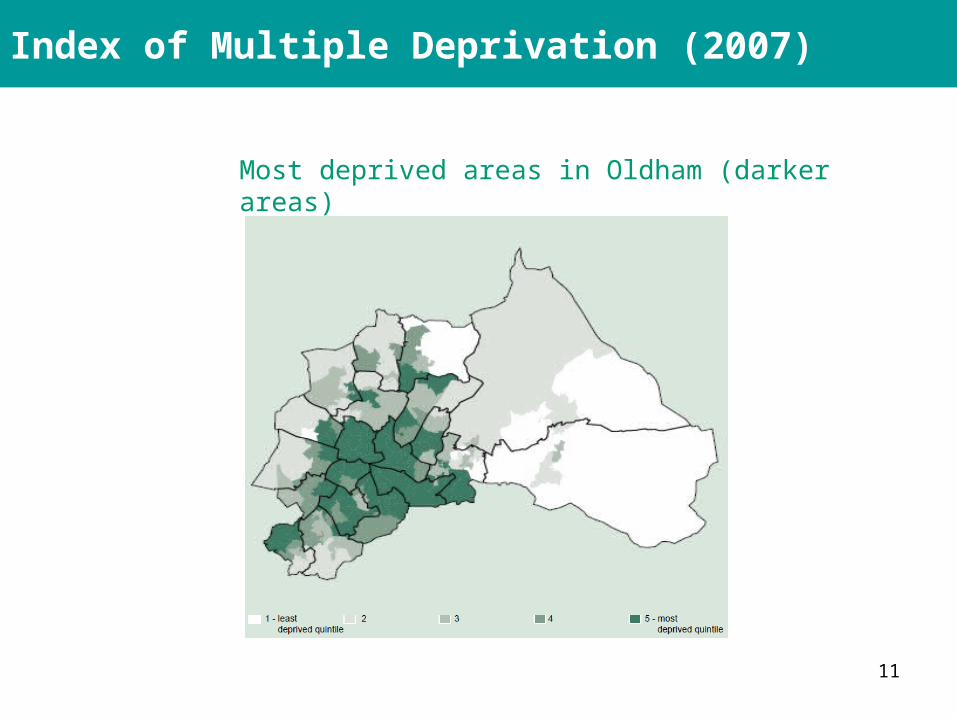
Index of Multiple Deprivation (2007)
Most deprived areas in Oldham (darker areas)
12
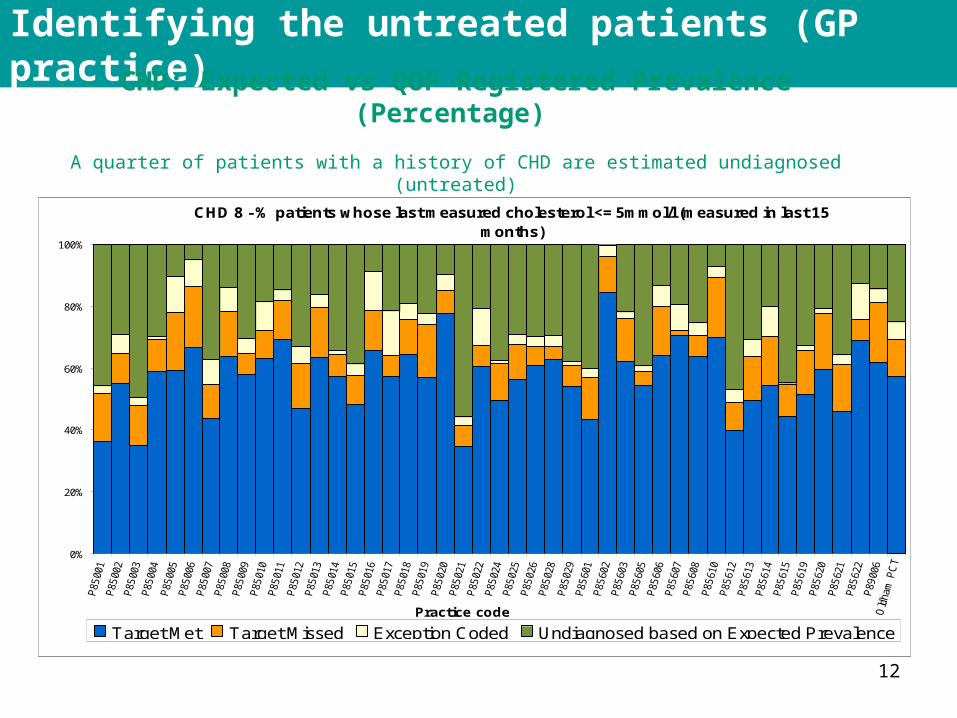
Identifying the untreated patients (GP practice)
CHD: Expected vs QOF Registered Prevalence (Percentage)
A quarter of patients with a history of CHD are estimated undiagnosed (untreated)
CHD 8 - % patients whose last measured cholesterol <= 5mmol/l (measured in last 15 months)
0%
20%
40%
60%
80%
100%
Practice code
Target Met Target Missed Exception Coded Undiagnosed based on Expected Prevalence
13
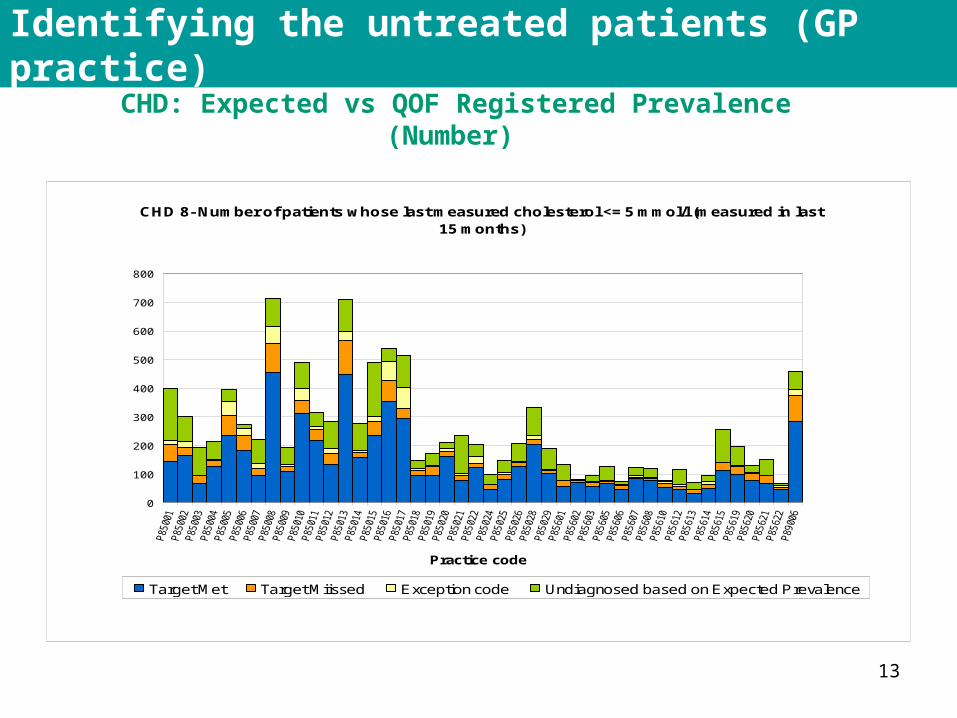
Identifying the untreated patients (GP practice)
CHD: Expected vs QOF Registered Prevalence (Number)
CHD 8- Number of patients whose last measured cholesterol <= 5 mmol/l (measured in last 15 months)
0
100
200
300
400
500
600
700
800
Practice code
Target Met Target Miissed Exception code Undiagnosed based on Expected Prevalence

14
Identifying the untreated patients (GP practice)
Hypertension: Expected vs QOF Registered Prevalence (Percentage)
More than half patients with Hypertension are estimated undiagnosed (untreated)
15
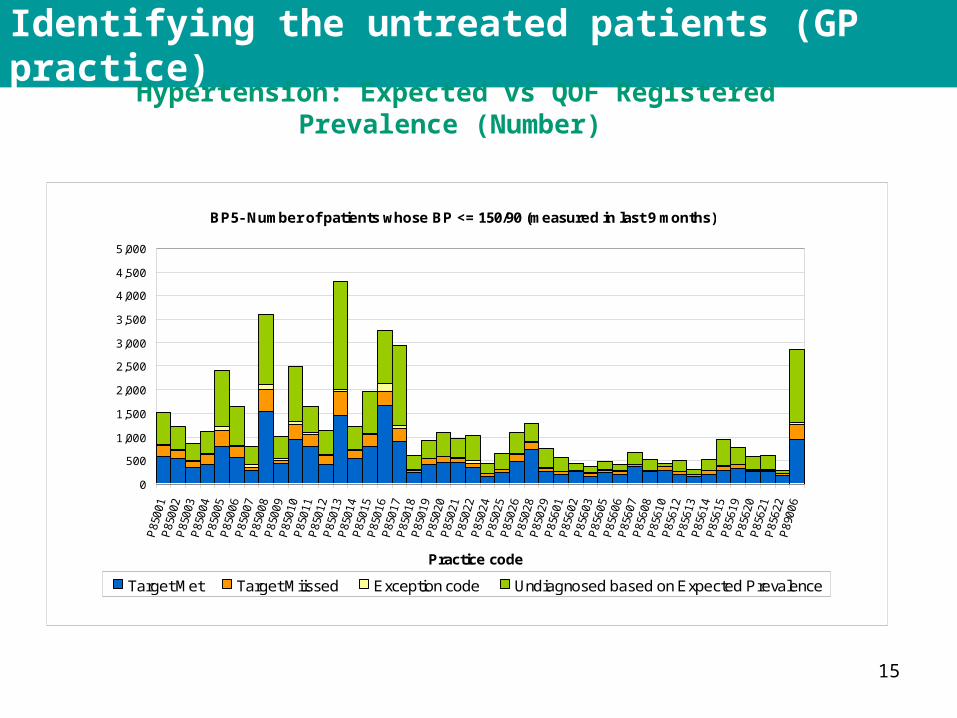
Identifying the untreated patients (GP practice)
Hypertension: Expected vs QOF Registered Prevalence (Number)
BP5- Number of patients whose BP <= 150/90 (measured in last 9 months)
0
500
1,000
1,500
2,000
2,500
3,000
3,500
4,000
4,500
5,000
Practice code
Target Met Target Miissed Exception code Undiagnosed based on Expected Prevalence
16
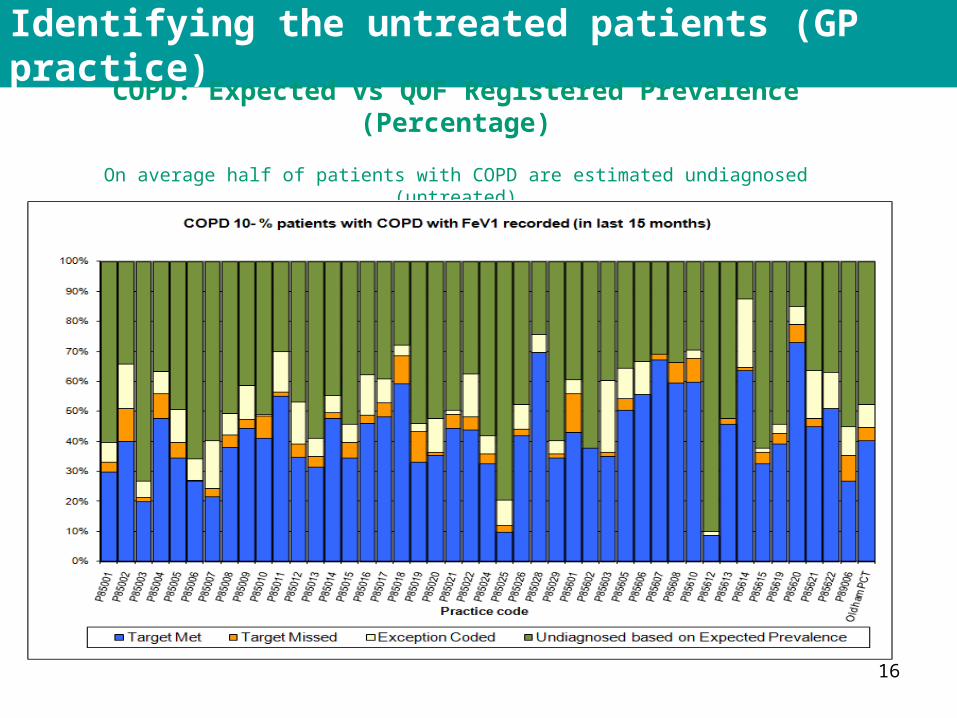
Identifying the untreated patients (GP practice)
COPD: Expected vs QOF Registered Prevalence (Percentage)
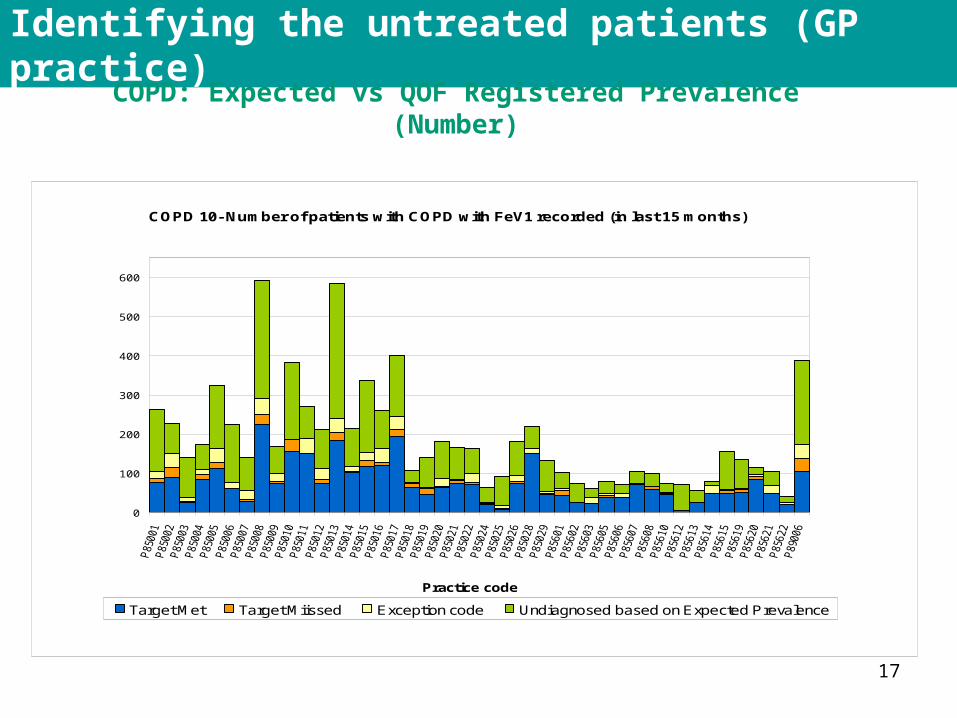
On average half of patients with COPD are estimated undiagnosed (untreated)
17
Identifying the untreated patients (GP practice)
COPD: Expected vs QOF Registered Prevalence (Number)
COPD 10- Number of patients with COPD with FeV1 recorded (in last 15 months)
0
100
200
300
400
500
600
Practice code
Target Met Target Miissed Exception code Undiagnosed based on Expected Prevalence
18
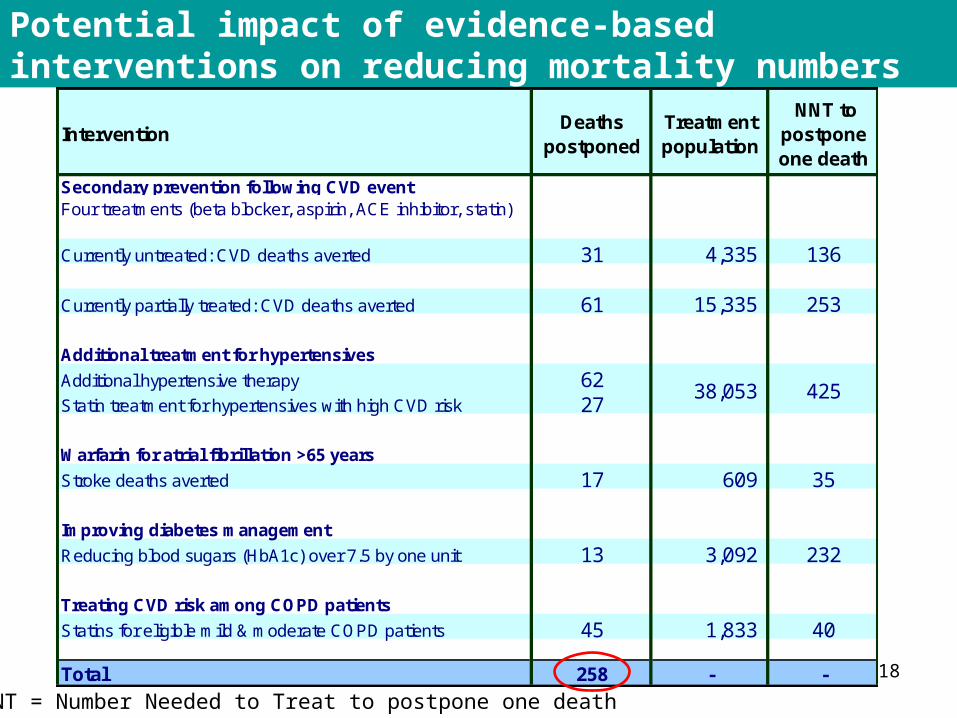
Potential impact of evidence-based interventions on reducing mortality numbers
InterventionDeaths
postponedTreatment population
NNT to postpone one death
Secondary prevention following CVD eventFour treatments (beta blocker, aspirin, ACE inhibitor, statin)
Currently untreated: CVD deaths averted 31 4,335 136
Currently partially treated: CVD deaths averted 61 15,335 253
Additional treatment for hypertensives
Additional hypertensive therapy 62Statin treatment for hypertensives with high CVD risk 27
Warfarin for atrial fibrillation >65 years
Stroke deaths averted 17 609 35
Improving diabetes management
Reducing blood sugars (HbA1c) over 7.5 by one unit 13 3,092 232
Treating CVD risk among COPD patients
Statins for eligible mild & moderate COPD patients 45 1,833 40
Total 258 - -
38,053 425
NNT = Number Needed to Treat to postpone one death
19
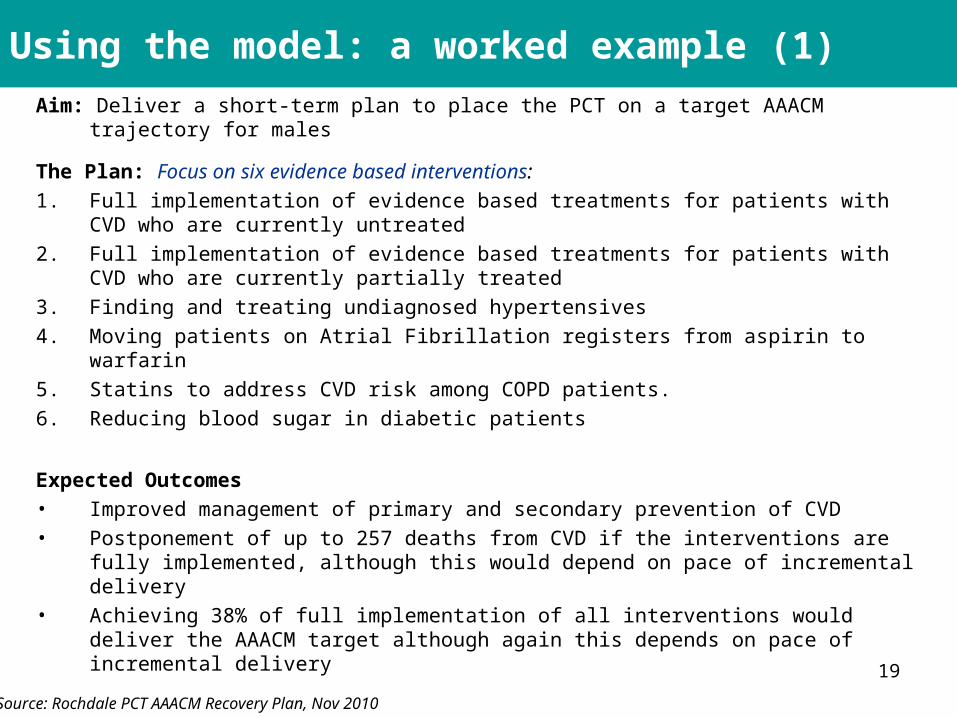
Aim: Deliver a short-term plan to place the PCT on a target AAACM trajectory for males
The Plan: Focus on six evidence based interventions:1. Full implementation of evidence based treatments for patients with CVD who are
currently untreated2. Full implementation of evidence based treatments for patients with CVD who are
currently partially treated3. Finding and treating undiagnosed hypertensives4. Moving patients on Atrial Fibrillation registers from aspirin to warfarin 5. Statins to address CVD risk among COPD patients. 6. Reducing blood sugar in diabetic patients
Expected Outcomes• Improved management of primary and secondary prevention of CVD• Postponement of up to 257 deaths from CVD if the interventions are fully
implemented, although this would depend on pace of incremental delivery • Achieving 38% of full implementation of all interventions would deliver the AAACM
target although again this depends on pace of incremental delivery
Using the model: a worked example (1)
Source: Rochdale PCT AAACM Recovery Plan, Nov 2010
20
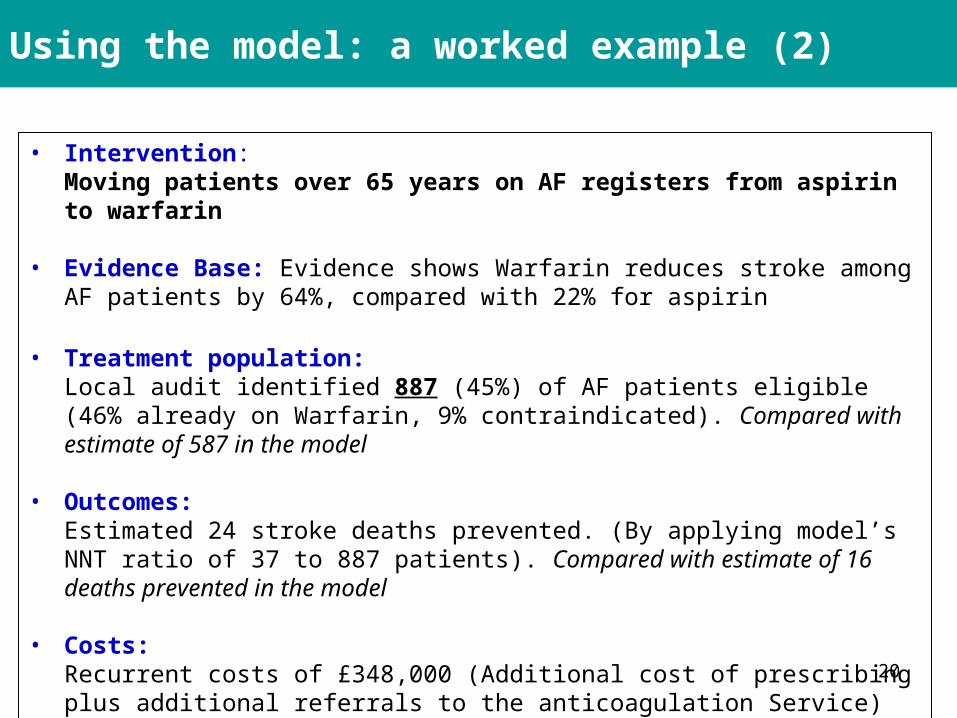
Using the model: a worked example (2)
• Intervention:Moving patients over 65 years on AF registers from aspirin to warfarin
• Evidence Base: Evidence shows Warfarin reduces stroke among AF patients by 64%, compared with 22% for aspirin
• Treatment population: Local audit identified 887 (45%) of AF patients eligible (46% already on Warfarin, 9% contraindicated). Compared with estimate of 587 in the model
• Outcomes: Estimated 24 stroke deaths prevented. (By applying model’s NNT ratio of 37 to 887 patients). Compared with estimate of 16 deaths prevented in the model
• Costs: Recurrent costs of £348,000 (Additional cost of prescribing plus additional referrals to the anticoagulation Service)
21
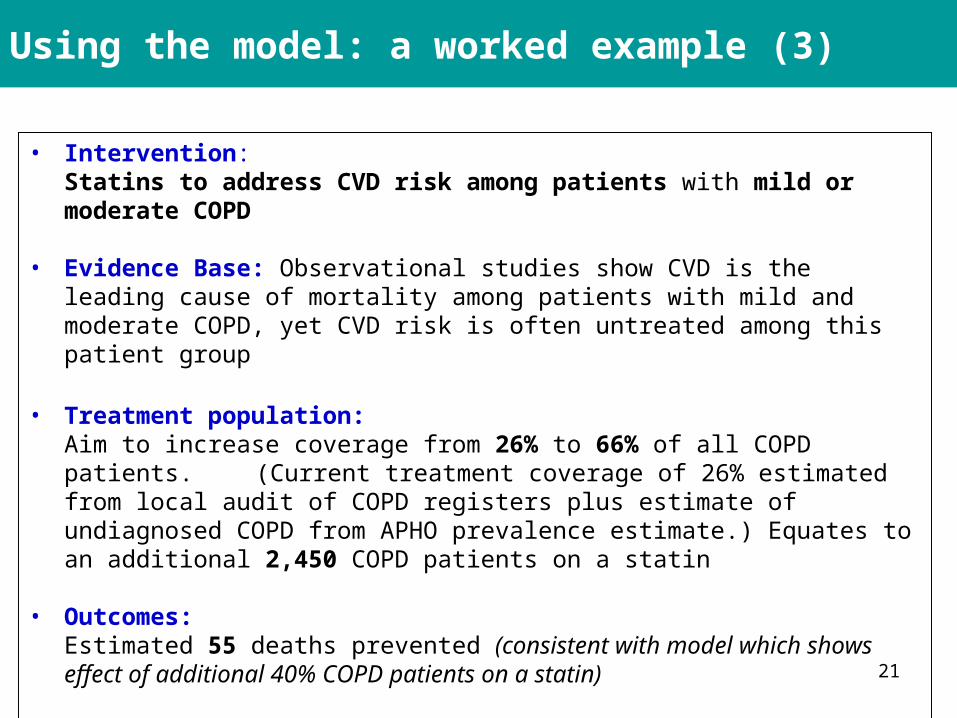
Using the model: a worked example (3)
• Intervention:Statins to address CVD risk among patients with mild or moderate COPD
• Evidence Base: Observational studies show CVD is the leading cause of mortality among patients with mild and moderate COPD, yet CVD risk is often untreated among this patient group
• Treatment population: Aim to increase coverage from 26% to 66% of all COPD patients. (Current treatment coverage of 26% estimated from local audit of COPD registers plus estimate of undiagnosed COPD from APHO prevalence estimate.) Equates to an additional 2,450 COPD patients on a statin
• Outcomes: Estimated 55 deaths prevented (consistent with model which shows effect of additional 40% COPD patients on a statin)
• Costs: Recurrent costs of £95,000 (includes finding additional patients)
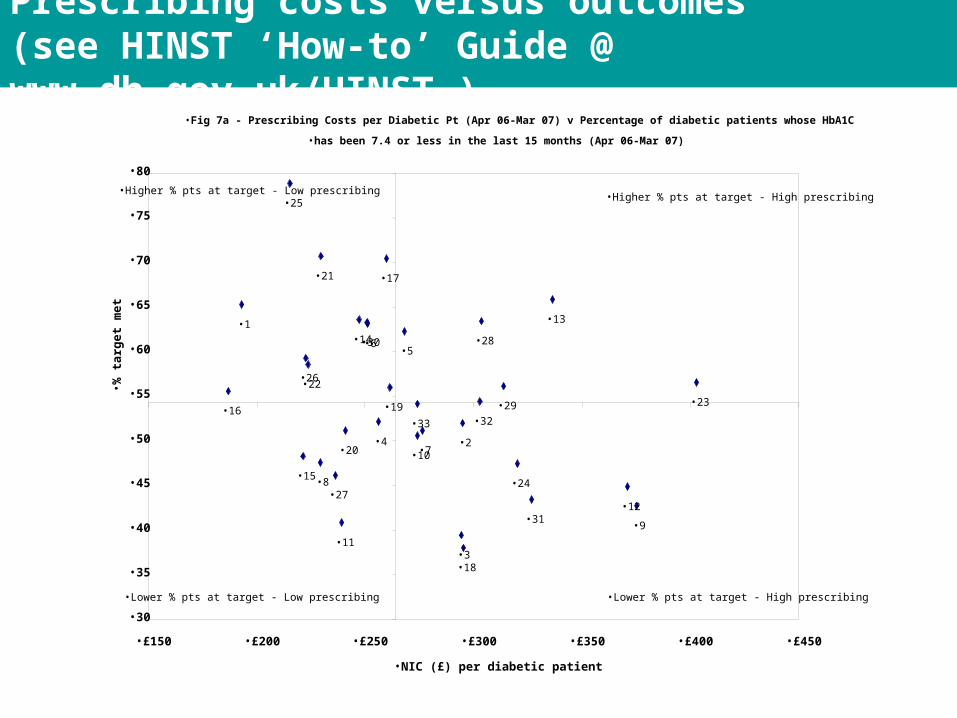
Prescribing costs versus outcomes
•Fig 7a - Prescribing Costs per Diabetic Pt (Apr 06-Mar 07) v Percentage of diabetic patients whose HbA1C
•has been 7.4 or less in the last 15 months (Apr 06-Mar 07)
•16
•1
•25
•15
•26•22
•8
•21
•27
•11
•20
•14•30•6
•4
•17
•19
•5
•10
•33
•7
•3
•2
•18
•32
•28
•29
•24
•31
•13
•12
•9
•23
•30
•35
•40
•45
•50
•55
•60
•65
•70
•75
•80
•£150 •£200 •£250 •£300 •£350 •£400 •£450
•NIC (£) per diabetic patient
• % t
arg
et m
et
•Higher % pts at target - Low prescribing
•Lower % pts at target - Low prescribing
•Higher % pts at target - High prescribing
•Lower % pts at target - High prescribing
Prescribing costs versus outcomes (see HINST ‘How-to’ Guide @ www.dh.gov.uk/HINST )