Embed Size (px)
Citation preview

1
Computational Tools and Guidance developed by the JRC
Klaus Daginnus
Institute for Health & Consumer Protection
Joint Research Centre, European Commission
CAESAR Final Workshop
Milan, 11 March 2009
http://ecb.jrc.ec.europa.eu/qsar/

2
1. Computational toxicology at the JRC
2. Role of computational methods in risk assessment
3. Filling data gaps: read-across and (Q)SARs
4. Documenting the results of read-across and (Q)SARs
5. Non-testing strategy – a stepwise approach
6. Conclusions
Overview

3
Directorates-General
European Commission
Directorates or Institutes
UnitsMolecular Biology
In Vitro Methods
Nanobiosciences
Chemical Assessment & Testing
Systems Toxicology
The European Commission’s Joint Research Centre
Genetically Modified Organisms
Alternative Methods & ECVAM
Nanotechnology
Health and Environment
Consumer Products & Nutrition
Policy
Areas
JRC

4
Overall aim: to promote the development, assessment, acceptance and implementation of computer-based methods potentially suitable for the regulatory assessment of chemicals
Applications: REACH, Water Framework Directive, Cosmetics Directive, Biocides Directive, Plant Protection Products Directive
Main approaches: SAR, QSAR, molecular modelling, ranking
Computational Toxicology at the JRC
http://ecb.jrc.ec.europa.eu/qsar/
Computational methods provide information for use in hazard and risk
assessment → “non-testing” or alternative methods
5
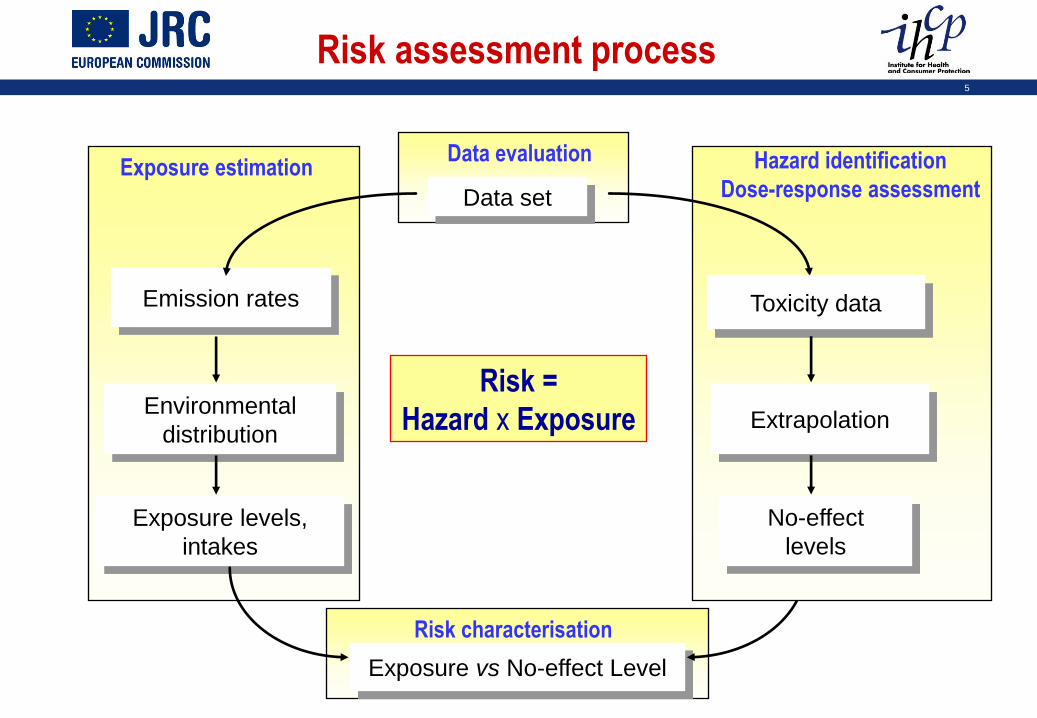
Data set
Data evaluation
Emission rates
Exposure estimation
Environmental
distribution
Exposure levels,
intakes
Exposure vs No-effect Level
Risk characterisation
Risk assessment process
Toxicity data
Hazard identification
Dose-response assessment
Extrapolation
No-effect
levels
Risk =
Hazard x Exposure

6
Data set
Data evaluation
Emission rates
Exposure estimation
Environmental
distribution
Exposure levels,
intakes
Exposure vs No-effect Level
Risk characterisation
Toxicity data
Hazard identification
Dose-response assessment
Extrapolation
No-effect
levels
Risk =
Hazard x Exposure
Role of computational methods
Mechanistic information
Threshold of No Concern
7
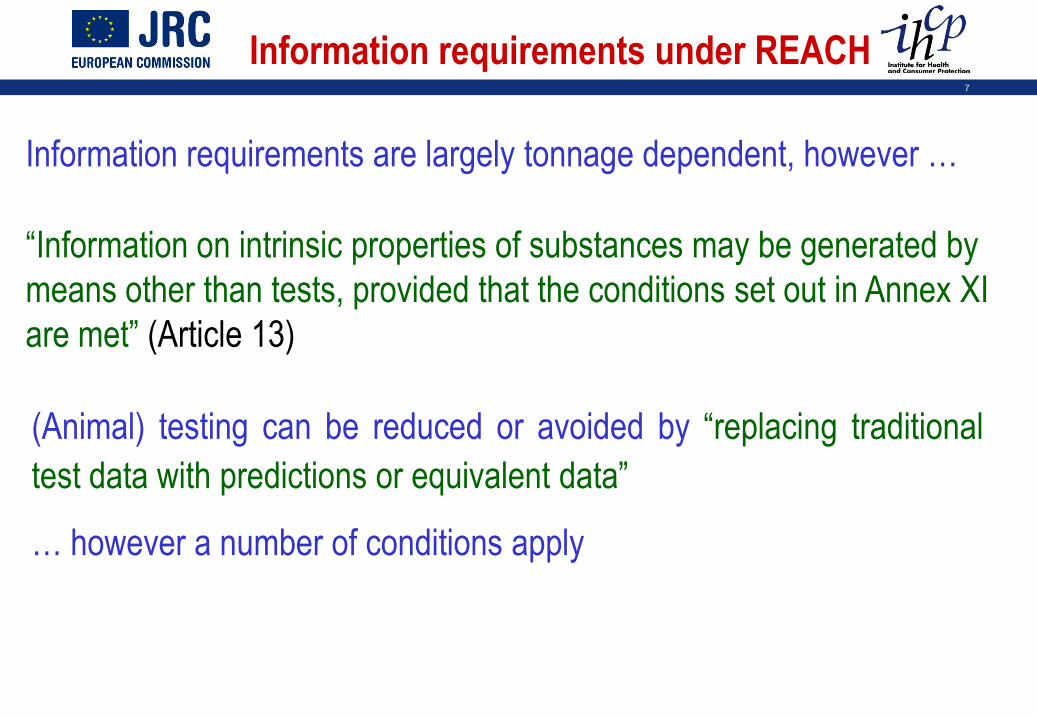
Information requirements are largely tonnage dependent, however …
“Information on intrinsic properties of substances may be generated by
means other than tests, provided that the conditions set out in Annex XI
are met” (Article 13)
Information requirements under REACH
(Animal) testing can be reduced or avoided by “replacing traditional
test data with predictions or equivalent data”
… however a number of conditions apply

8
Integrated Testing Strategies (ITS)
Endpoint-specific
strategy
(Q)SARs
in vitro
tests
Exposure
information
Other existing
information
C&L, risk assessment, PBT (vPvB) assessment
safe use of
chemicals ?
read-across &
chemical groups
Targeted testing Risk management
measures

9
Filling data gaps by read-across
Predicted to be harmful
1,2-Benzenedicarboxylic acid,
bis(2-ethoxyethyl) ester
Known to be harmful: 1 < log LC50 < 2
Acute fish toxicity?
diethyl phthalate
Source chemical Target chemical
Property
Known information on the property of a substance (source chemical) isused to make a prediction of the same property for another substance(target chemical) that is considered “similar”

10
The analogue approach refers to the grouping of chemicals and application of
read-across for a single endpoint based on a relatively small number of
analogues
Substance 1 Substance 2
Property
Substance 1 Substance 2 Substance 3
Property
many-to-one
reliable data point
missing data point
Read-across in the analogue approach
one-to-one

11
Read-across in the category approach
reliable data point
missing data point
read-across
Trend analysis
Chemical 1 Chemical 2 Chemical 3 Chemical 4
Property 1
Property 2
Property 3
Property 4
Activity 1
Activity 2
Activity 3
Activity 4
The category approach refers to a wider approach, based on more analogues,
multiple endpoints, and in which trends are also apparent

12
In order for a (Q)SAR result to be adequate
for a given regulatory purpose, the
following conditions must be fulfilled:
• the estimate should be generated by a
valid (reliable) model
• the model should be applicable to the
chemical of interest with the necessary
level of reliability
• the model endpoint should be relevant for
the regulatory purpose
(Q)SAR modelapplicable to query chemical
Scientificallyvalid QSARmodel
(Q)SAR model relevant to regulatory purpose
Adequate(Q)SAR result
Reliable(Q)SAR result
Adequacy of (Q)SAR prediction
QMRF
QPRF
QPRF
http://ecb.jrc.ec.europa.eu/qsar/qsar-tools/

13
The need for “adequate and reliable” documentation is met by using standardised reporting formats:
A (Q)SAR Model Reporting Format (QMRF) is a robust summary of a (Q)SAR model, which reports key information on the model according to the OECD validation principles
A (Q)SAR Prediction Reporting Format (QPRF) is a description and assessment of the prediction made by given model for a given chemical
methodology
Structure
Biological activity
QSAR
(QMRF)
Validation
Prediction
(QPRF)
Assessment
Models
Standardised (Q)SAR Reporting Formats

14
A (Q)SAR should be associated with the following information:
1. a defined endpoint
2. an unambiguous algorithm
3. a defined applicability domain
4. appropriate measures of goodness-of-fit, robustness and predictivity
5. a mechanistic interpretation, if possible
• Principles adopted by 37th Joint Meeting of Chemicals Committee and WorkingParty on Chemicals, Pesticides & Biotechnology; 17-19 Nov 2004
• ECB preliminary Guidance Document published in Nov 2005
• OECD Guidance Document published in Feb 2007
• OECD Guidance summarised in REACH guidance (IR and CSA)
QMRF captures information on fulfilment of OECD validation principles, but no judgement or “validity statement” is included
(Q)SAR Reporting Formats: QMRF

15
QPRF captures information on the substance and its prediction, and is intended to facilitate considerations of the adequacy of a prediction
1. Substance information2. General (administrative) information on QPRF3. Information on prediction (endpoint, algorithm, applicability domain,
uncertainty, mechanism)4. Adequacy (optional, legislation-specific, and includes judgement and
indicates whether additional information is needed for WoE assessment)
• Assessment of adequacy depends on reliability and relevance of prediction, but also on the availability of other information, and the consequence of being wrong
• Not just a scientific consideration, but also a policy decision
(Q)SAR Reporting Formats: QPRF

16
2. Preliminary assessment of reactivity & fate
3. Classification schemes & structural alerts
1. Existing information
Outline of a non-testing strategy
4. Preliminary assessment of reactivity, fate & toxicity
5. Chemical grouping & read-across
6. QSARs
A B C
Chemical
Metabolite 1
Metabolite 2
Working Matrix
Assess adequacy
Conclusion or targeted testing
17
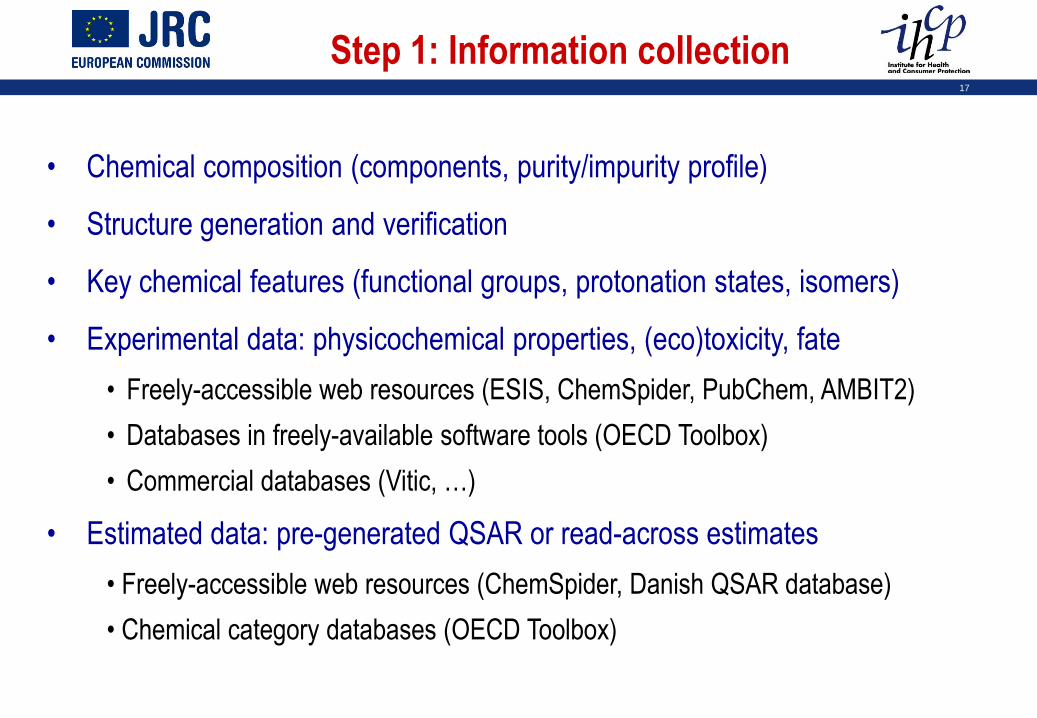
Step 1: Information collection
• Chemical composition (components, purity/impurity profile)
• Structure generation and verification
• Key chemical features (functional groups, protonation states, isomers)
• Experimental data: physicochemical properties, (eco)toxicity, fate
• Freely-accessible web resources (ESIS, ChemSpider, PubChem, AMBIT2)
• Databases in freely-available software tools (OECD Toolbox)
• Commercial databases (Vitic, …)
• Estimated data: pre-generated QSAR or read-across estimates
• Freely-accessible web resources (ChemSpider, Danish QSAR database)
• Chemical category databases (OECD Toolbox)

18
http://ecb.jrc.ec.europa.eu/esis/
European chemical Substances Information System
ESIS

19
PRS – Inventory Production
1• Structure Generation from Name – ACD Labs Name
2• Validation of structures by CAS-Registry random sample
3• Manually refinements, data mining e.g. DSSTOX
4
• Merge, filter, standardisation of structure representation for organic substances
5
• Descriptors: substance identification and estimated physical-chemical data (ACDLabs, Pipeline Pilot, ADMET Predictor)
http://ecb.jrc.ec.europa.eu/qsar/information-sources/ec_inventory/
20
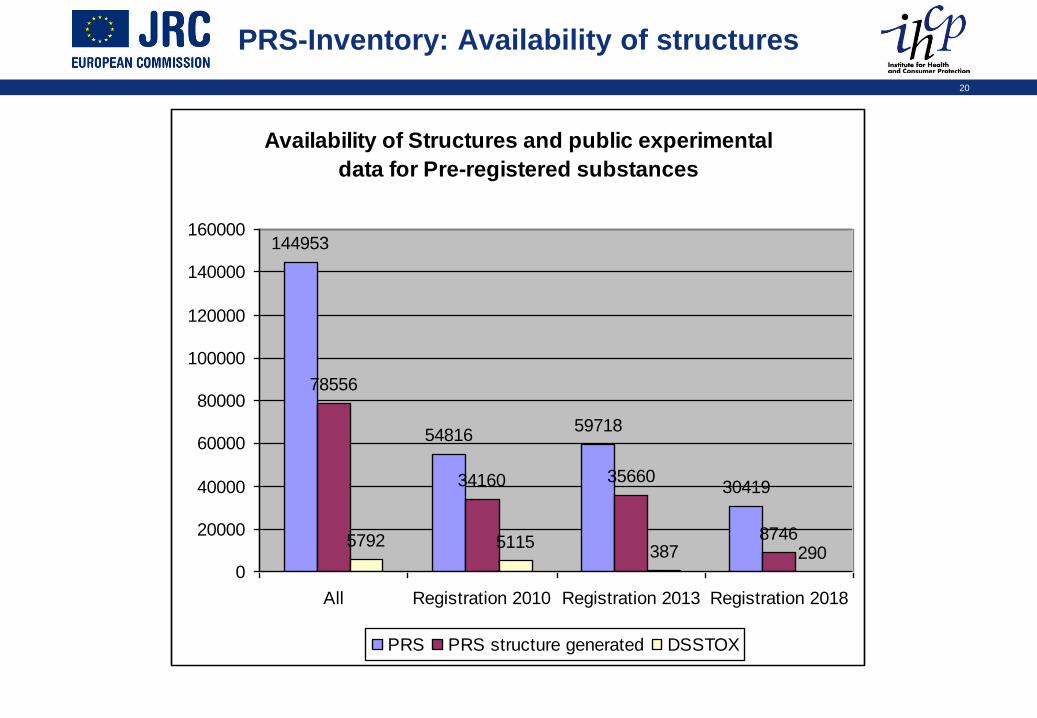
PRS-Inventory: Availability of structures
Availability of Structures and public experimental
data for Pre-registered substances
144953
5481659718
30419
78556
34160 35660
87465792 5115387 290
0
20000
40000
60000
80000
100000
120000
140000
160000
All Registration 2010 Registration 2013 Registration 2018
PRS PRS structure generated DSSTOX

21
Validation of generated structures
NTS validation
400
346
294
221
4924
220
46
12
0
50
100
150
200
250
300
350
400
450
Random
sample
CAS
structures
NTS structures NTS ok NTS
*Dictionary*
NTS Warning*
total Validation ok

22
PRS-Inventory: Phys-chem descriptors
PRS Protonation state
23041
9526
1127
1126
6504
2549
11222
9292
2364
5091
0 5000 10000 15000 20000 25000
neutral at pH 7.4
fraction Twitter > 0 < 0.1
fraction Twitter > 0.1 < 0.9
fraction Twitter > 0.9
fraction - charge > 0 < 0.1
fraction - charge > 0.1 < 0.9
fraction - charge > 0.9
fraction + charge > 0 < 0.1
fraction + charge > 0.1 < 0.9
fraction + charge > 0.9
logP, pKa, logD, Water Solubility by ADMET Predictor, see benchmarking:
Calculation of molecular lipophilicity: State-of-the-art and comparison of logP
methods on more than 96,000 compounds, Mannhold, R.; Poda, G.I.; Ostermann,
C.; Tetko, I.V. Journal of Pharmaceutical Sciences 2009, 98(3), 861-893.

23
ENDDA – Endocrine Active Chemicals Database
web-accessible database under development
24
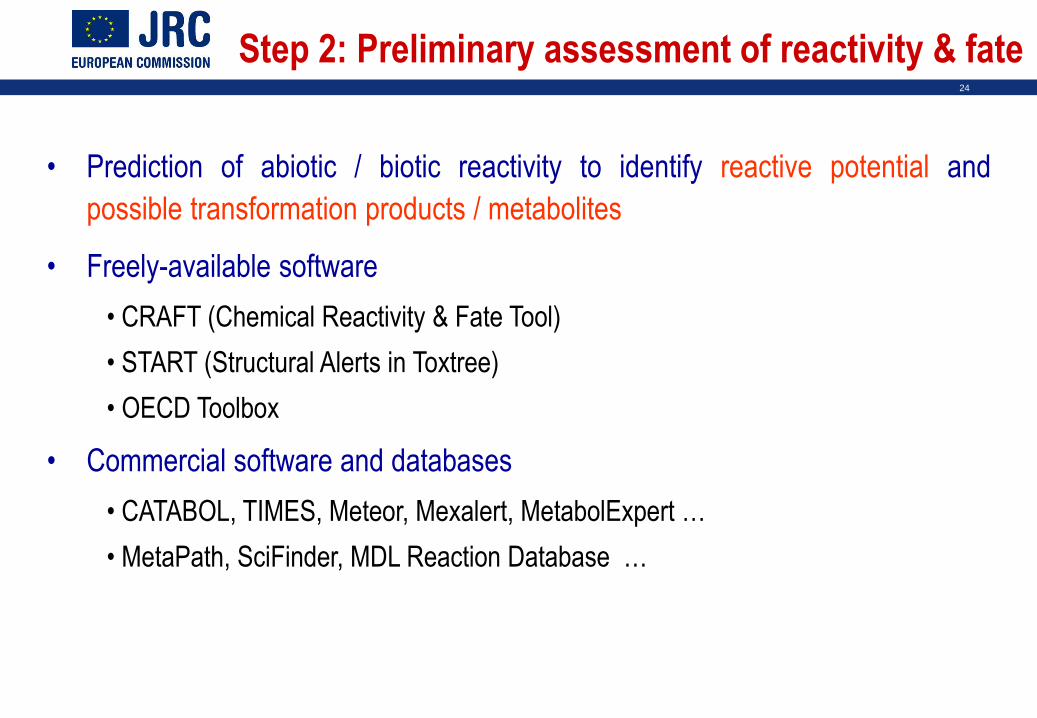
• Prediction of abiotic / biotic reactivity to identify reactive potential and
possible transformation products / metabolites
• Freely-available software
• CRAFT (Chemical Reactivity & Fate Tool)
• START (Structural Alerts in Toxtree)
• OECD Toolbox
• Commercial software and databases
• CATABOL, TIMES, Meteor, Mexalert, MetabolExpert …
• MetaPath, SciFinder, MDL Reaction Database …
Step 2: Preliminary assessment of reactivity & fate
25
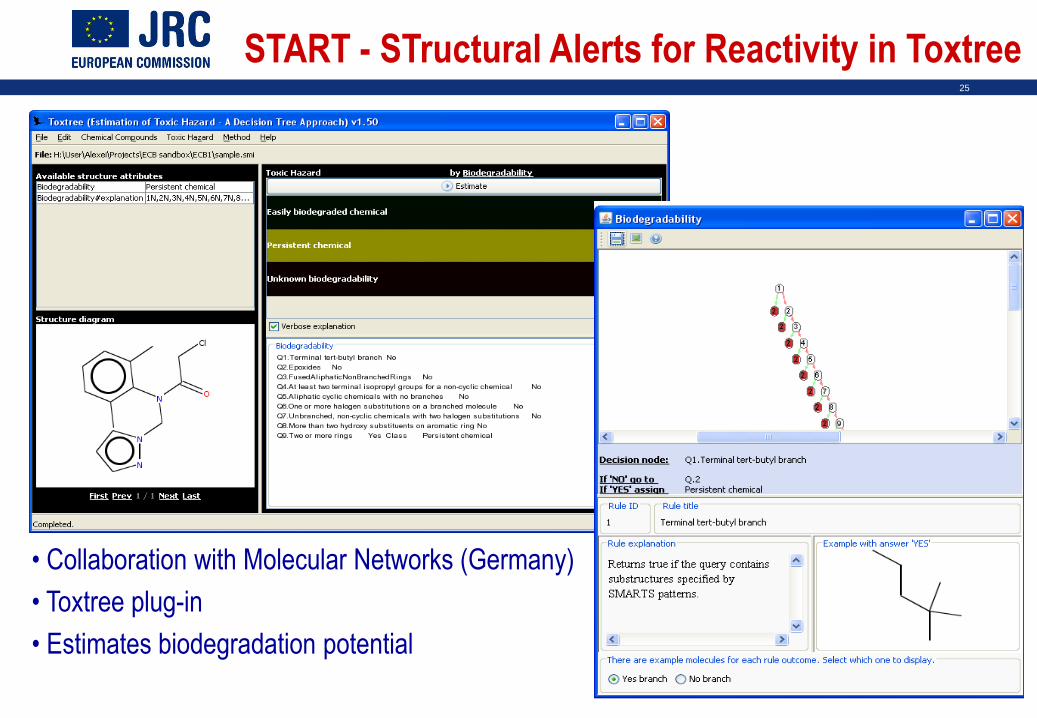
• Collaboration with Molecular Networks (Germany)
• Toxtree plug-in
• Estimates biodegradation potential
START - STructural Alerts for Reactivity in Toxtree
26
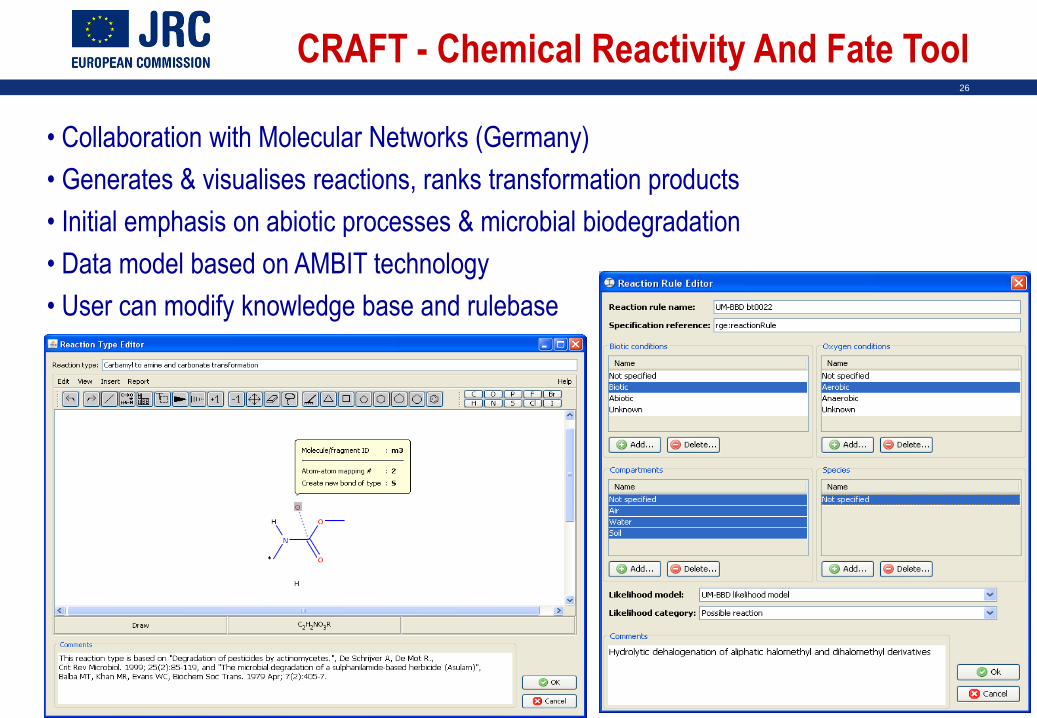
CRAFT - Chemical Reactivity And Fate Tool
• Collaboration with Molecular Networks (Germany)
• Generates & visualises reactions, ranks transformation products
• Initial emphasis on abiotic processes & microbial biodegradation
• Data model based on AMBIT technology
• User can modify knowledge base and rulebase

27
• Models and rulebases for mode-of-action classification, hazard identification,
hazard classification and potency prediction
• Freely-available software
• Episuite, Toxtree, AMBIT2, OECD Toolbox …
• OpenTox framework (http://www.opentox.org)
• Commercial software
• DEREK, MultiCASE, HazardExpert, ToxAlert, ToxBoxes …
• Insilicofirst consortium (Multicase Inc, Lhasa Ltd, Molecular Networks GmbH,Leadscope Inc)
• QSAR Model Databases (QMDBs)
• JRC QSAR Model Database
• OECD Toolbox
Steps 3 & 6: SARs, QSARs and expert systems
28
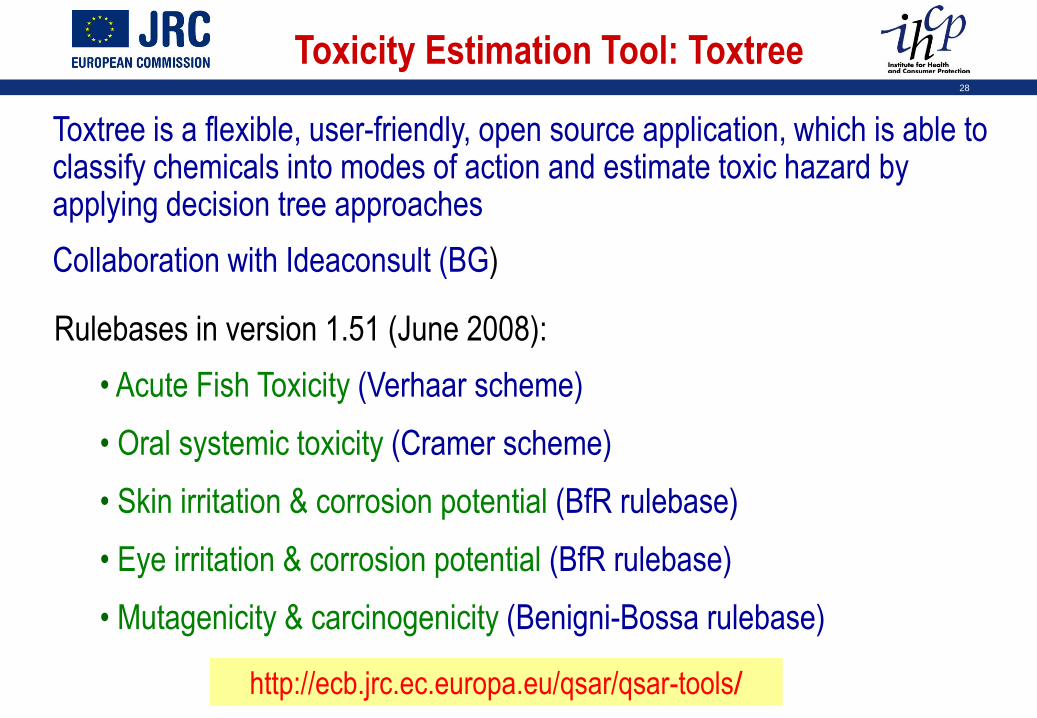
Toxtree is a flexible, user-friendly, open source application, which is able to classify chemicals into modes of action and estimate toxic hazard by applying decision tree approaches
Collaboration with Ideaconsult (BG)
Toxicity Estimation Tool: Toxtree
Rulebases in version 1.51 (June 2008):
• Acute Fish Toxicity (Verhaar scheme)
• Oral systemic toxicity (Cramer scheme)
• Skin irritation & corrosion potential (BfR rulebase)
• Eye irritation & corrosion potential (BfR rulebase)
• Mutagenicity & carcinogenicity (Benigni-Bossa rulebase)
http://ecb.jrc.ec.europa.eu/qsar/qsar-tools/

29
Main screen in Toxtree
Prediction
Compound structure
Compound properties
Reasoning

30
Toxtree Predictions for Carcinogenicity
Alerts / QSAR for carcinogenicity
19607
3067
2728
3507
13388
2399
2005
0 5000 10000 15000 20000 25000
non-genotoxic alerts
genotoxic alerts
Unlikely Carcinogenic QSAR
Potential carcinogenic QSAR
total Filter ADMET Risk = 0
ADMET Risk estimates from ADMET Predictor
31
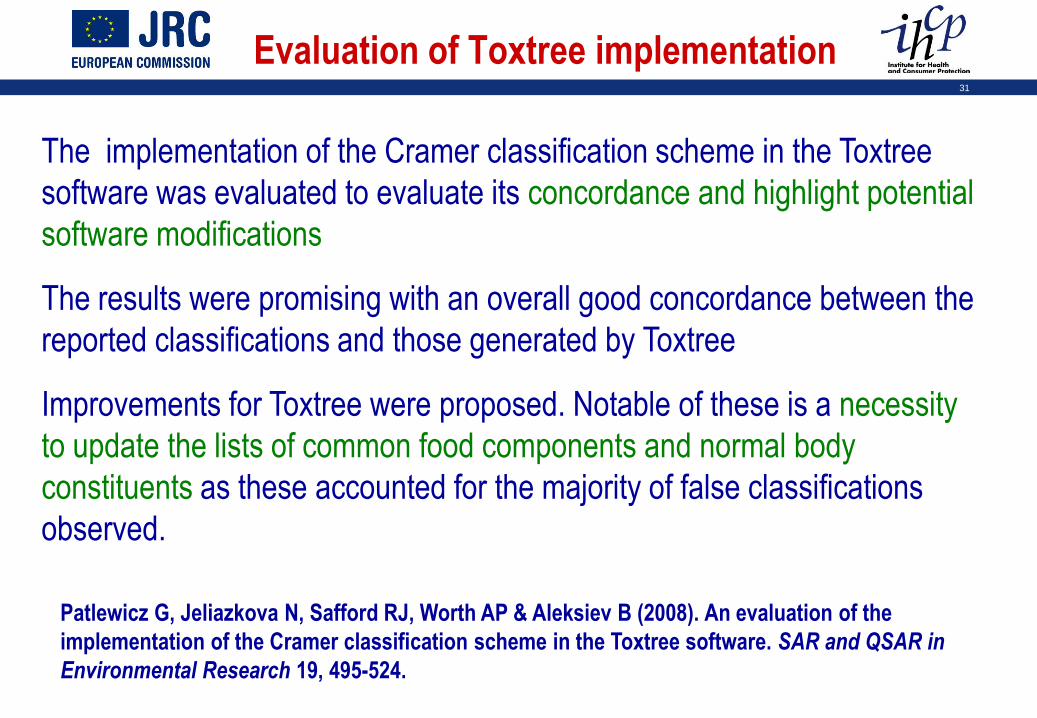
Evaluation of Toxtree implementation
The implementation of the Cramer classification scheme in the Toxtree
software was evaluated to evaluate its concordance and highlight potential
software modifications
The results were promising with an overall good concordance between the
reported classifications and those generated by Toxtree
Improvements for Toxtree were proposed. Notable of these is a necessity
to update the lists of common food components and normal body
constituents as these accounted for the majority of false classifications
observed.
Patlewicz G, Jeliazkova N, Safford RJ, Worth AP & Aleksiev B (2008). An evaluation of the
implementation of the Cramer classification scheme in the Toxtree software. SAR and QSAR in
Environmental Research 19, 495-524.
32
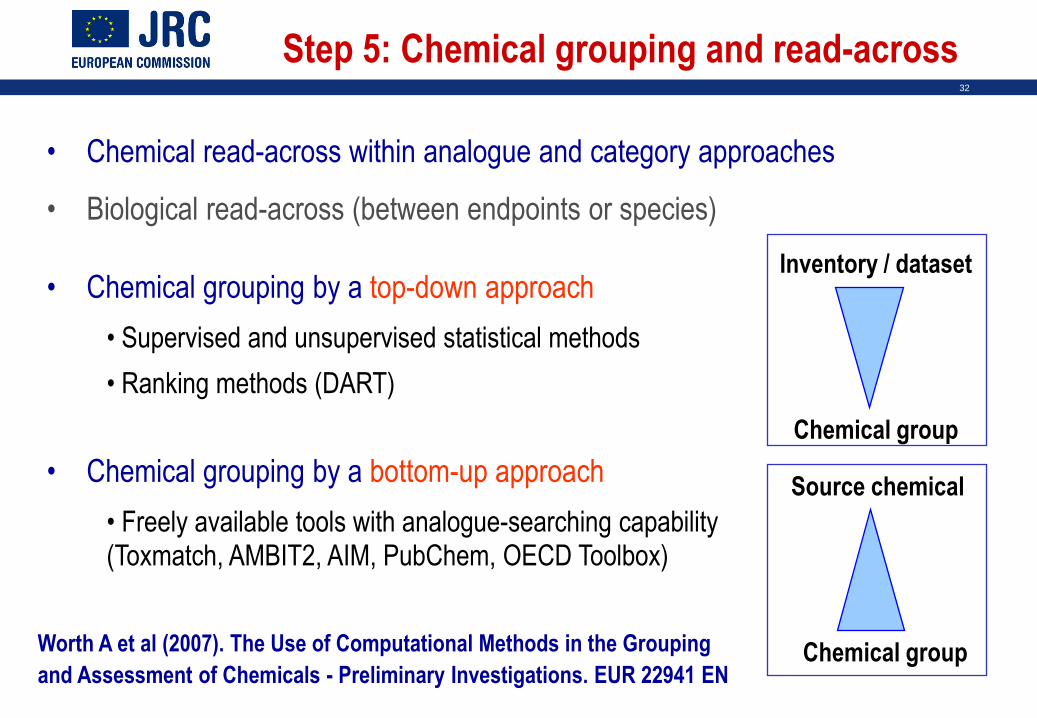
• Chemical read-across within analogue and category approaches
• Biological read-across (between endpoints or species)
• Chemical grouping by a top-down approach
• Supervised and unsupervised statistical methods
• Ranking methods (DART)
• Chemical grouping by a bottom-up approach
• Freely available tools with analogue-searching capability (Toxmatch, AMBIT2, AIM, PubChem, OECD Toolbox)
Worth A et al (2007). The Use of Computational Methods in the Grouping
and Assessment of Chemicals - Preliminary Investigations. EUR 22941 EN
Source chemical
Chemical group
Inventory / dataset
Chemical group
Step 5: Chemical grouping and read-across
33
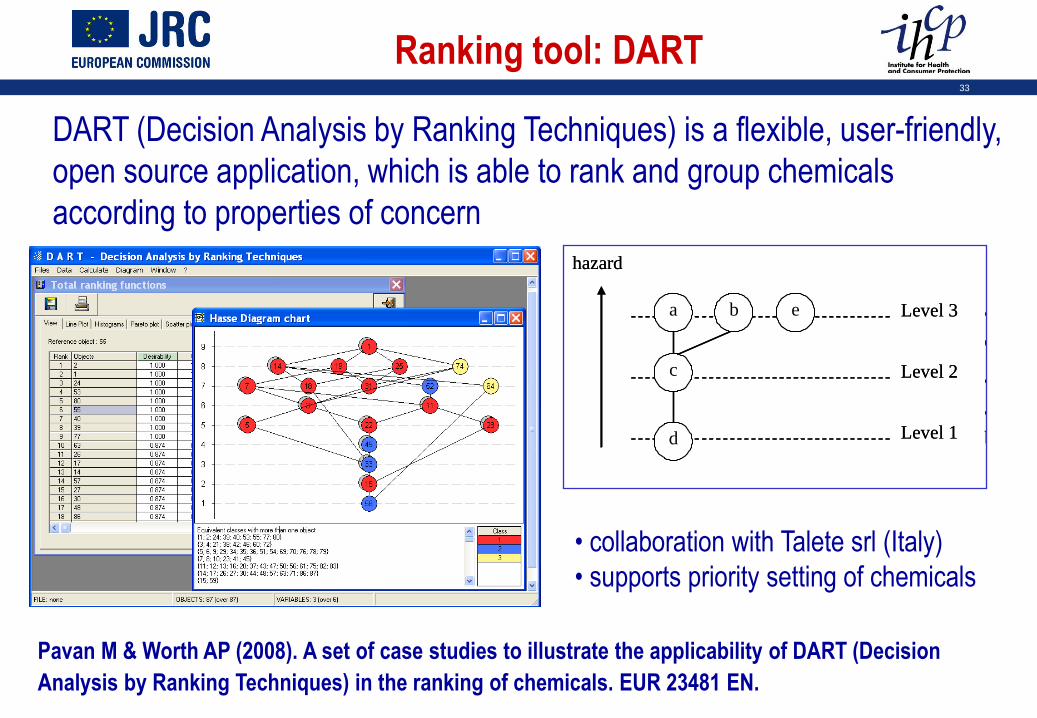
Ranking tool: DART
DART (Decision Analysis by Ranking Techniques) is a flexible, user-friendly,
open source application, which is able to rank and group chemicals
according to properties of concern
Level 3a b e
Level 2
Level 1
c
d
a, b, e: maximals
d: minimals
a, b, e: incomparable alternatives
a, c, d: chain and dc a
b, c, d: chain and dc b
hazard
Level 3a b e
Level 2
Level 1
c
d
a, b, e: maximals
d: minimals
a, b, e: incomparable alternatives
a, c, d: chain and dc a
b, c, d: chain and dc b
hazard
• collaboration with Talete srl (Italy)
• supports priority setting of chemicals
Pavan M & Worth AP (2008). A set of case studies to illustrate the applicability of DART (Decision
Analysis by Ranking Techniques) in the ranking of chemicals. EUR 23481 EN.
34
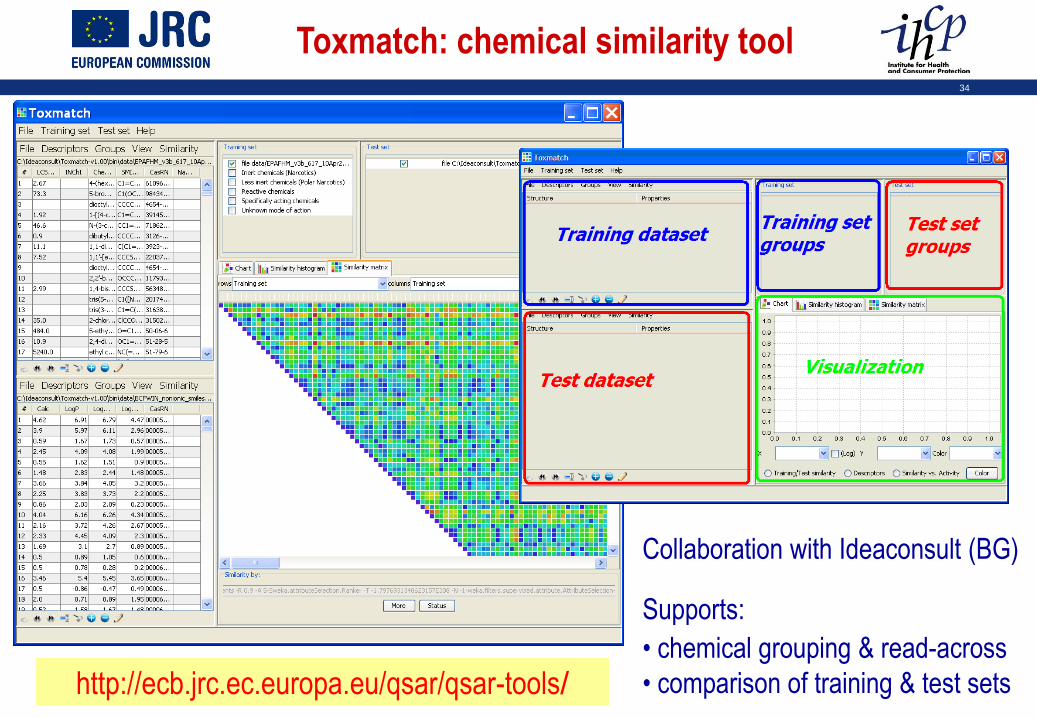
Supports:
• chemical grouping & read-across
• comparison of training & test sets
Toxmatch: chemical similarity tool
Collaboration with Ideaconsult (BG)
http://ecb.jrc.ec.europa.eu/qsar/qsar-tools/

35
Read-across in Toxmatch
Many-to-one read-across of a quantitative property (k Nearest Neighbours)
Patlewicz G, Jeliazkova N, Gallegos Saliner A & Worth AP (2008). Toxmatch – A new software tool to aid
in the development and evaluation of chemically similar groups. SAR and QSAR in Environmental
Research 19, 397-412.

36
Example of read-across in Toxmatch
• BCF of aniline predicted on basis of effective diameter, maximum diameter and LogP
• Predicted LogBCF = 1.05
• Experimental LogBCF = 0.78 (Hazardous Substances Databank)
Pairwise similarity
between aniline
and training set
compoundsAniline -
test chemical
NH2
Training set of
610 chemicals

37
Need to identify and use relevant, reliable and well documented (Q)SARs
The JRC QSAR Model Database is a searchable inventory of peer-reviewed information on (Q)SAR models
Developers and users of (Q)SAR models can submit information on (Q)SARs by using the (Q)SAR Model Reporting Format (QMRF)
Step 6: JRC QSAR Model Database
UPLOAD DOWNLOADhttp://qsardb.jrc.it
QMRF (xml)
QMRF (sdf)
Access through Internet
Upload of QMRF
Upload of training & test sets
Download of QMRF
Ability to search QSAR database
QMRF pdf report
QMRF excel file
QMRF xml file
QMRF sdf file

38
• QMRF No.
• Free text
• Endpoint
• Algorithm
• Software
• Authors
Searching the QSAR database
• CAS No.
• Formula
• Chemical name
• Alias
• SMILES
http://qsardb.jrc.it

39
• Need to assess the toxicological significance of pesticide active metabolites
and degradation products (not tested under Directive 91/414/EEC)
• Three projects funded by EFSA (2009-2010)
• Applicability of QSAR analysis in assessing metabolite toxicity
• Applicability of the TTC concept in assessing metabolite toxicity
• Impact of metabolism on toxicological properties
• Next steps by EFSA
• Opinion of the PPR panel (2010-2011)
• Guidance document on pesticide residue definition for dietary risk assessment(2011-2012)
JRC-EFSA project on pesticide modelling
40
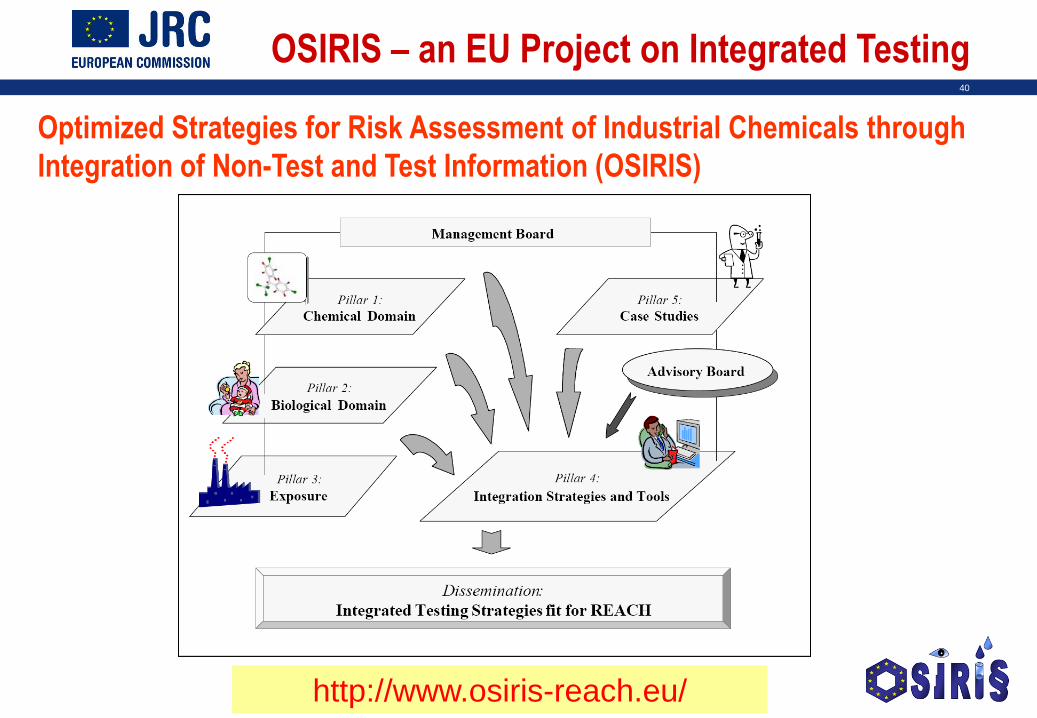
http://www.osiris-reach.eu/
Optimized Strategies for Risk Assessment of Industrial Chemicals through
Integration of Non-Test and Test Information (OSIRIS)
OSIRIS – an EU Project on Integrated Testing

41
• To optimise the use of non-testing data, a conceptual framework is
provided in the REACH guidance documentation
• There is a need to incorporate mechanistic knowledge in the models (e.g.
based on chemical reactivity and “omic” data)
• An increasing number of models are being implemented in a range of
software tools
• There is a need to facilitate the use of multiple tools by developing
automated workflows
• Further guidance is needed on how to assess the adequacy of non-testing
and alternative test data by weight-of-evidence approaches
Concluding remarks