Embed Size (px)
Citation preview

ACM Journal on Computing and Cultural Heritage, Vol. n, No. n, Article n, Publication date: Month YYYY
Conducting Visitor Studies using Smartphone-based Location Sensing THEANO MOUSSOURI, UCL Institute of Archaeology GEORGE ROUSSOS, Birkbeck College, University of London
Visitor studies explore human experiences within museums, cultural heritage sites and other informal learning settings to inform decisions. Smartphones offer novel opportunities for extending the depth and breadth of visitor studies while considerably reducing their cost and their demands on specialist human resources. By enabling the collection of significantly higher volumes of data they also make possible the application of advanced machine learning and visualization techniques potentially leading to the discovery of new patterns and behaviors that cannot be captured by simple descriptive statistics. In this paper we present a principled approach to the use of smartphones for visitor studies in particular proposing a structured methodology and associated methods that enable its effective use in this context. We discuss specific methodological considerations that have to be addressed for effective data collection, pre-processing and analysis, and identify the limitations in the applicability of these tools using family visits to the London Zoo as a case study. We conclude with a discussion of the wider opportunities afforded by the introduction of smartphones and related technologies and outline the steps towards establishing them as a standard tool for visitor studies.
Categories and Subject Descriptors: J.5 [Computer Applications]: Arts and Humanities
General Terms: Experimentation
Additional Key Words and Phrases: Smartphone, Timing and tracking, Visitor studies
ACM Reference Format:
Theano Moussouri and George Roussos. 2014. Conducting Visitor Studies using Smartphone-based Location Sensing. ACM Journal on Computing and Cultural Heritage, 6, 3, Article (May 2014), 17 pages. DOI:http://dx.doi.org/10.1145/0000000.0000000
1. INTRODUCTION
Visitor studies concern the systematic collection and analysis of information relating to human experiences within informal learning environments that are subsequently employed to inform decisions about interpretive exhibits and programs (Hood 1986). They adopt an interdisciplinary approach and follow research methods typical of the social sciences (Hein 1998). Similarly to social sciences, visitor studies have successfully incorporated a wide variety of computing tools over time ranging from databases and spreadsheets to manage and tabulate data; statistics packages for quantitative (Longest 2011) and text processing software for qualitative analysis (Fielding and Lee 1998); web-based surveys and questionnaires; and mobile logging systems for tracking and timing (Raento et al 2009) allowing more accurate and detailed record keeping.
In this paper we discuss the latest addition to the visitor studies computing toolkit namely the smartphone. Smartphones integrate multiple sensors, each with distinct capabilities that can be used to infer and record information about the visitor’s current situation. Notable among these capabilities
Author's address: Theano Moussouri, UCL Institute of Archaeology, 31-34 Gordon Square, London WC1H 0PY, UK, E-mail: [email protected]; George Roussos, Department of Computer Science and Information Systems, Birkbeck College, University of London, Malet Street, London WC1E 7HX, UK, E-mail: [email protected]. Permission to make digital or hardcopies of part or all of this work for personal or classroom use is granted without fee provided that copies are not made or distributed for profit or commercial advantage and that copies show this notice on the first page or initial screen of a display along with the full citation. Copyrights for components of this work owned by others than ACM must be honored. Abstracting with credits permitted. To copy otherwise, to republish, to post on servers, to redistribute to lists, or to use any component of this work in other works requires prior specific permission and/or a fee. Permissions may be requested from Publications Dept., ACM, Inc., 2 Penn Plaza, Suite 701, New York, NY 10121-0701 USA, fax +1 (212) 869-0481, or [email protected]. © 2010 ACM 1544-3558/2010/05-ART1 $15.00 DOI:http://dx.doi.org/10.1145/0000000.0000000
1
1:2 • T. Moussouri and G. Roussos
ACM Journal on Computing and Cultural Heritage, Vol. xx, No. xx, Article xx, Publication date: Month YYYY
is location sensing, which can automatically identify the position of the smartphone at comparatively high precision and accuracy. Location-sensing technology can be directly employed for tracking and timing, one of the best-established methods in visitor studies involving a relatively laborious data collection process in which researchers observe visitors and create detailed records of their movement for the duration of their visit (Yalowitz and Bronnenkant 2009). The application of this technology removes many of the barriers set by the specialist research skills needed and the associated costs that currently limit the number of tracks that can be recorded and the length of time that a visitor can be followed during a particular visit.
Yet, location sensing offers far more exciting opportunities to visitor studies beyond such straightforward use: our focus in this paper is to demonstrate how it can be incorporated within a comprehensive methodology for visitor studies. Indeed, our aim is to establish this novel tool as a standard feature of modern visitor studies methodology by showing how audience researchers can employ such data sets in a consistent and structured manner so as to reveal as yet unobserved patterns of visitor behavior. By obtaining quantitatively greater amounts of information it also becomes possible to apply advanced software-based analytics techniques within a principled approach that can offer new insights that are not readily exposed by standard methods. We discuss the costs and benefits of this tool by detailing a case study conducted at the London Zoo incorporating smartphones within a naturalistic approach (Moussouri and Roussos 2013) to establish the relationship between motivations for visiting and observed visitor strategies. We conclude with a discussion of these findings and by outlining a program of future work.
2. RELATED WORK
Location sensors employ a variety of techniques to identify their relative or absolute position in space for example by estimating the distance travelled by a wireless signal emitted by one or more beacons placed at well-known locations on which they apply standard geometric calculations (Hightower and Boriello 2001). Indeed, a smartphone today typically supports fine grain location sensing outdoors using GPS (more details below), coarse grain location using wifi and cellular mobile base station fingerprinting, and proximity beaconing using Bluetooth (de Lara and Lamarca 2008). Each sensor has different accuracy, precision and availability characteristics as a result of the specific method used to estimate location for example triangulation or proximity detection. This also implies differences in their availability in outdoors and in indoor settings and requirements for installed infrastructure.
Smartphone technology is being adopted by museums, cultural heritage sites and other informal learning organizations as a means to extend interaction with visitors often incorporating location sensing for content adaptation, for example to automatically identify proximity of the visitor to specific exhibits and present relevant information. A pioneer of this approach is Tate Modern in the UK, which employs coarse-grain location sensing through Wi-Fi technology since the early 2000s (Wilson 2004) to support apps such as the Magic Tate Ball. However, in the vast majority of these cases location sensing has not been used for visitor studies.
Other coarse grain location sensing techniques have been used to develop methods for visitor studies. A system that employs Bluetooth was installed at the Louvre in France during 2011 (Yoshimura et al 2012) allowing the capture of a relatively short sequence of visitor sightings at demarcated locations used to reconstruct visitor flows and identify distinct itineraries. At the lowest end of the accuracy and cost spectrum, Radio Frequency Identification (RFID) has been employed in a case study conducted at the Exploratorium in San Francisco (Hsi and Fait 2005) revealing interesting patterns in the pathways followed by individuals and groups. Notably, the study attempted to follow subsequent visits to related websites operated by the museum.

Visitor Studies using Smartphone-based Location Sensing • 1:3
ACM Transactions on xxxxxxxx, Vol. xx, No. xx, Article xx, Publication date: Month YYYY
The use of GPS specifically to track visitors has been considered for several years for example Hallo et al (2004) conducted a case study at National Parks in California and Maine. Comparing self-reported and GPS recorded travel routes they found considerable advantages in the latter. Other work has explored the use of GPS in a nature sanctuary to evaluate the efficiency of signage (Unknown 2010). However, none of these studies attempted to develop the GPS method beyond simply replicating manual timing and tracking measurements or indeed capitalize on the distinct opportunities offered by the technology within a comprehensive methodology.
At the high end of indoor location accuracy, Ultra Wide Band (UWB) technology was used in a case study conducted at the Art Museum of St. Gallen in Switzerland during the summer of 2009 (Tröndle et al 2012) to capture highly accurate tracks of visitors while also correctly identifying orientation within the galleries. Combined with additional sensor input, the data has been successfully used to quantify the level of engagement with works of art and explore its relationship to social interaction during the visit. However, the need for installation of UWB sensors covering the monitored area makes this technology currently too expensive for most visitor studies applications.
Due to the variety of technologies and approaches in the use of location sensing and smartphones in museums, heritage sites and other information learning settings it is not possible to list and compare all relevant literature in this paper but only to highlight the main alternatives available as per the discussion above. We point the interested reader to Moussouri and Roussos (2014) for a comprehensive review of this area.
3. RATIONALE
Using location data captured by smartphones it is possible to reconstruct a relatively detailed record of visitor movements during the visit including the path followed, their levels of activity, as well as potentially reveal certain aspects of the environmental and social situation at each of the places visited. These records are captured at comparatively high accuracy and precision compared against manual approaches and do not require the presence of a researcher. Since the recorded data are already in machine-readable format they can also be easily analyzed by software.
As noted in Section 2, this opportunity to automatically track visitors at museums, cultural heritage and other informal learning sites has attracted the interest of the research community and over the past few years several studies have been conducted both outdoors and indoors. However, the vast majority of this work typically adopts an ad-hoc approach that facilitates the specific needs of the particular research project for the pre-processing, reconstruction and analysis of raw observations obtained from smartphones and their conversion into useful information that can be employed in the exploration of specific research questions. Although this is not uncommon during the exploratory application of a new technology and allows rapid experimentation, it also suggests the lack of a standard methodology to employ with this tool. This lack of a standard methodology limits the ability of the field to compare findings by different studies and at the same time significantly increases their complexity and cost as it requires researchers to develop their own pre-processing, reconstruction and analysis protocols.
The focus of this paper is exactly the introduction of such a methodology and associated methods. This methodology is inspired by data science (Cleveland 2001), an evidence-driven methodology used for decision-making and the characterization of performance in socio-technical systems, which employs computation to identify and extract patterns. The core ingredients of our approach are:
a) the development of three alternative representations for the observable aspects of the visitor experience that can be automatically derived from raw location-sensing observations; and,
b) the identification of standard data analytics methods that facilitate explorative analysis upon these representations.

1:4 • T. Moussouri and G. Roussos
ACM Journal on Computing and Cultural Heritage, Vol. xx, No. xx, Article xx, Publication date: Month YYYY
Fig. 1. Replaying the captured location trail for each family allows the audience researcher to familiarize herself with the routes followed, which helps mitigate the implications of the distance placed between researcher and data introduced due to the automation of the data collection process. Map data: Google. Imagery: Bluesky, DigitalGlobe, GeoEye, Getmapping plc.
This methodology is general in the sense that it can be employed with all common outdoor and indoor location-sensing technologies and does not depend on the specific type of data obtained from a particular kind of sensor. Moreover, the proposed representations are suitable for conducting visitor studies because they facilitate the investigation of common questions in this domain, incorporating typical tracking and timing approaches and at the same time enabling the application of advanced data mining, visualization and statistical methods which are novel in this area. Last but not least, this methodology and associated methods can be integrated within current practice in visitor studies and used in combination with other non-smartphone based methods within an integrated evidenced based research approach.
In Sections 4 and 5, we introduce the main elements of this approach and in Section 6 we demonstrate how this methodology can be employed in practice to conduct visitor studies. Throughout, we use examples from a case study conducted at the London Zoo to explore the effect of family visitor motivation on their experience.
4. OBSERVED VISITOR STRATEGIES
The first stage of the proposed methodology relates to the extraction of observed strategies employed by visitors during their visit from tuple data that is, the raw data produced by the location sensing system. We propose three alternative ways to characterize observed strategies, each of which is derived automatically through processing of individual device data files. These representations capture the essential features of an observable strategy in a manner that is both concise and appropriately expressive. Automation through software is critical in this regard since the volume of the obtained data make manual processing too time-consuming and cumbersome. In our own work, we employ a web-based software system (implemented using Django and python) for the management, processing and analysis of recorded traces. Figure 1 shows the animation features of this system replaying the trace from one of the participating families.
The three alternative ways to represent the observable aspects of family strategies are: Trail-based Representation: Observed strategies are described as time-ordered sequences of places
where visitors have been present. Each item in this sequence is associated with meta-data including descriptive statistics such as dwell time at the specific location, timestamps and cumulative time, movement speed during this segment of the visit, all of which have also been calculated automatically by our analytics system.
Visitor Studies using Smartphone-based Location Sensing • 1:5
ACM Transactions on xxxxxxxx, Vol. xx, No. xx, Article xx, Publication date: Month YYYY
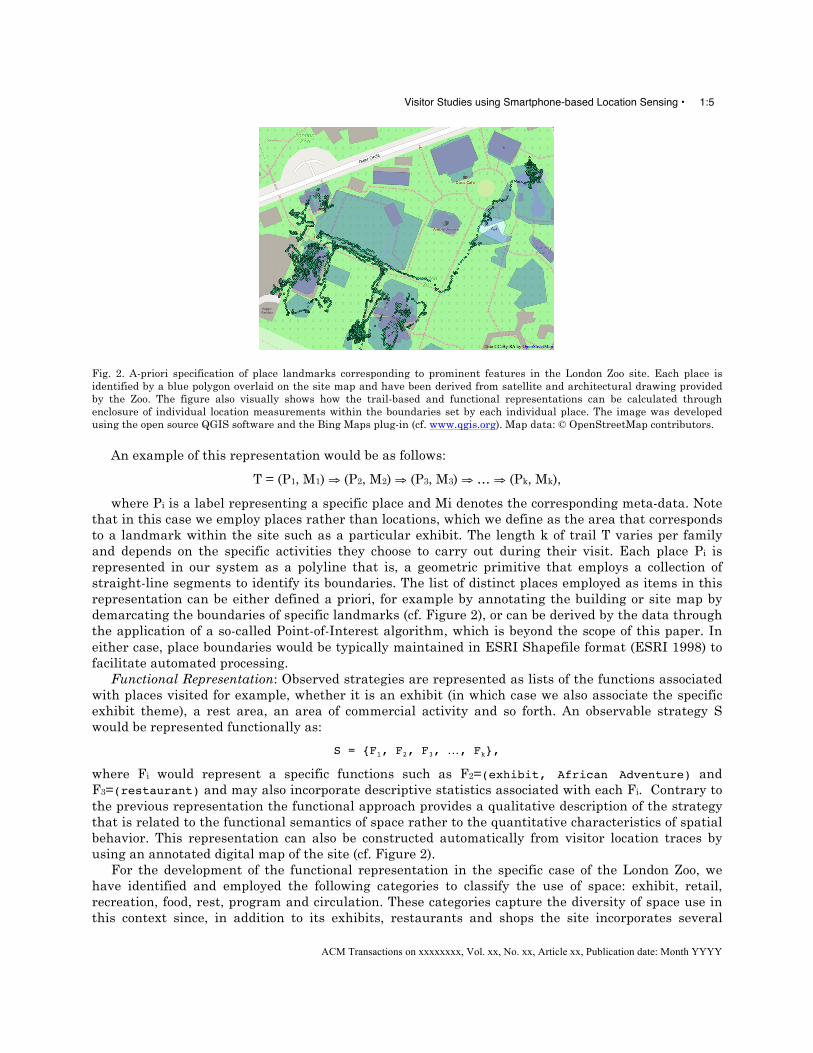
Fig. 2. A-priori specification of place landmarks corresponding to prominent features in the London Zoo site. Each place is identified by a blue polygon overlaid on the site map and have been derived from satellite and architectural drawing provided by the Zoo. The figure also visually shows how the trail-based and functional representations can be calculated through enclosure of individual location measurements within the boundaries set by each individual place. The image was developed using the open source QGIS software and the Bing Maps plug-in (cf. www.qgis.org). Map data: © OpenStreetMap contributors.
An example of this representation would be as follows:
T = (P1, M1) ⇒ (P2, M2) ⇒ (P3, M3) ⇒ … ⇒ (Pk, Mk),
where Pi is a label representing a specific place and Mi denotes the corresponding meta-data. Note that in this case we employ places rather than locations, which we define as the area that corresponds to a landmark within the site such as a particular exhibit. The length k of trail T varies per family and depends on the specific activities they choose to carry out during their visit. Each place Pi is represented in our system as a polyline that is, a geometric primitive that employs a collection of straight-line segments to identify its boundaries. The list of distinct places employed as items in this representation can be either defined a priori, for example by annotating the building or site map by demarcating the boundaries of specific landmarks (cf. Figure 2), or can be derived by the data through the application of a so-called Point-of-Interest algorithm, which is beyond the scope of this paper. In either case, place boundaries would be typically maintained in ESRI Shapefile format (ESRI 1998) to facilitate automated processing.
Functional Representation: Observed strategies are represented as lists of the functions associated with places visited for example, whether it is an exhibit (in which case we also associate the specific exhibit theme), a rest area, an area of commercial activity and so forth. An observable strategy S would be represented functionally as:
S = {F1, F2, F3, …, Fk},
where Fi would represent a specific functions such as F2=(exhibit, African Adventure) and F3=(restaurant) and may also incorporate descriptive statistics associated with each Fi. Contrary to the previous representation the functional approach provides a qualitative description of the strategy that is related to the functional semantics of space rather to the quantitative characteristics of spatial behavior. This representation can also be constructed automatically from visitor location traces by using an annotated digital map of the site (cf. Figure 2).
For the development of the functional representation in the specific case of the London Zoo, we have identified and employed the following categories to classify the use of space: exhibit, retail, recreation, food, rest, program and circulation. These categories capture the diversity of space use in this context since, in addition to its exhibits, restaurants and shops the site incorporates several
1:6 • T. Moussouri and G. Roussos
ACM Journal on Computing and Cultural Heritage, Vol. xx, No. xx, Article xx, Publication date: Month YYYY
recreational areas such as a playground and carousel as well as dedicated areas for programs, notably the theatre. Finally the site naturally provides walkways required to allow the circulation of the visitors from one area to the other, which we also identify separately. It is likely that small modifications to this categorization would be required for the application of this technique in other settings, though we believe that it already captures a wide range of functions representing the majority of typical uses of museum space.
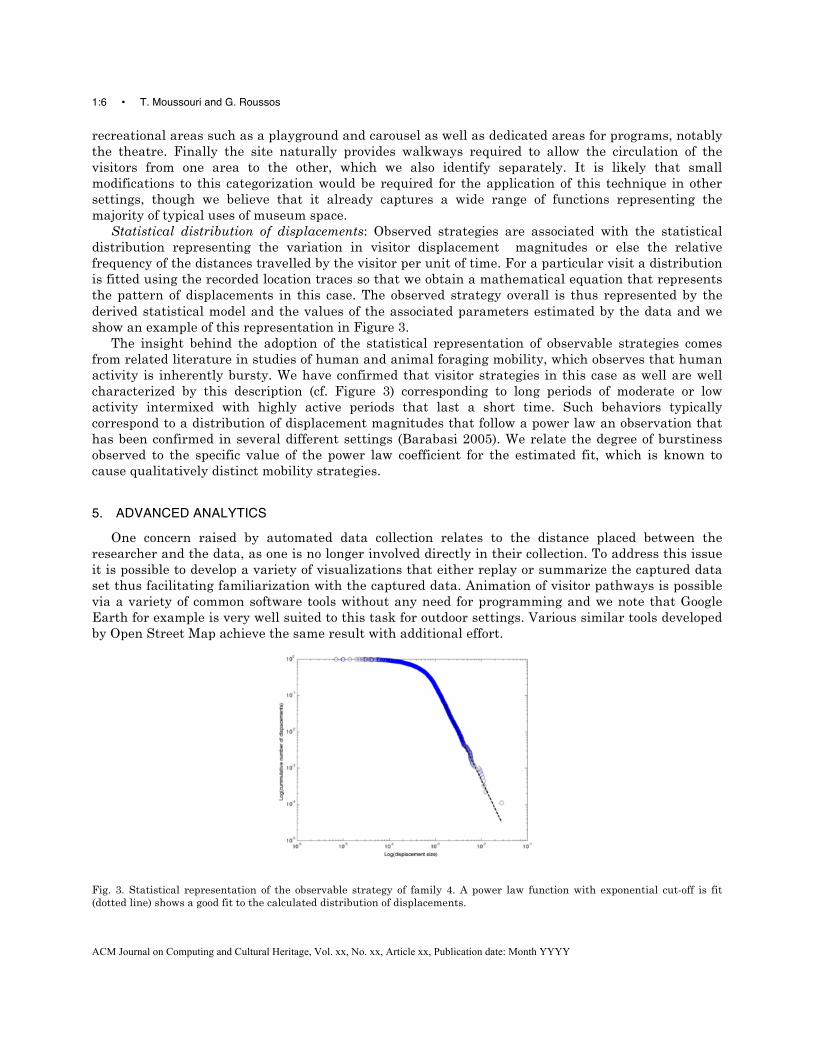
Statistical distribution of displacements: Observed strategies are associated with the statistical distribution representing the variation in visitor displacement magnitudes or else the relative frequency of the distances travelled by the visitor per unit of time. For a particular visit a distribution is fitted using the recorded location traces so that we obtain a mathematical equation that represents the pattern of displacements in this case. The observed strategy overall is thus represented by the derived statistical model and the values of the associated parameters estimated by the data and we show an example of this representation in Figure 3.
The insight behind the adoption of the statistical representation of observable strategies comes from related literature in studies of human and animal foraging mobility, which observes that human activity is inherently bursty. We have confirmed that visitor strategies in this case as well are well characterized by this description (cf. Figure 3) corresponding to long periods of moderate or low activity intermixed with highly active periods that last a short time. Such behaviors typically correspond to a distribution of displacement magnitudes that follow a power law an observation that has been confirmed in several different settings (Barabasi 2005). We relate the degree of burstiness observed to the specific value of the power law coefficient for the estimated fit, which is known to cause qualitatively distinct mobility strategies.
5. ADVANCED ANALYTICS
One concern raised by automated data collection relates to the distance placed between the researcher and the data, as one is no longer involved directly in their collection. To address this issue it is possible to develop a variety of visualizations that either replay or summarize the captured data set thus facilitating familiarization with the captured data. Animation of visitor pathways is possible via a variety of common software tools without any need for programming and we note that Google Earth for example is very well suited to this task for outdoor settings. Various similar tools developed by Open Street Map achieve the same result with additional effort.
Fig. 3. Statistical representation of the observable strategy of family 4. A power law function with exponential cut-off is fit (dotted line) shows a good fit to the calculated distribution of displacements.

Visitor Studies using Smartphone-based Location Sensing • 1:7
ACM Transactions on xxxxxxxx, Vol. xx, No. xx, Article xx, Publication date: Month YYYY
Fig. 4. Left: Visitor flow visualization at the British Museum. The images were constructed using the open source UCL Depthmap software available via https://github.com/SpaceGroupUCL/Depthmap. Right: The heatmap created by analysis the track of a single family visit at the London Zoo. The image was constructed using a modified version of the open source gheat software available via http://code.google.com/p/gheat/. Map data: Google. Imagery: Bluesky, DigitalGlobe, GeoEye, Getmapping plc.
Visual summaries of the traces are particularly effective tools in quickly assessing the specific details of a visit trace and we have used two techniques in particular successfully, namely flow visualization and heatmaps. Flow maps (Figure 4, left, from a previous feasibility study conducted at the British Museum) provide graphical representation of visitor flow through the site and a visual tool to conduct path analysis. They can be generated automatically for a well-defined set of locations such as orientation nodal points or exhibits by aggregating tracking data (Phan et al 2005).
An alternative way to visually represent space occupancy is through the heatmap, a technique that associates locations with a level of intensity represented as color corresponding to the level of visitor activity at the relevant location. Heatmaps are especially effective in visually communicating the relative frequency by which specific places are used and can help to quickly identify places of intense interest for visitors such as “hot” exhibits and how individuals group around them . This technique is also particularly well suited to determine temporal dependencies or structure when time-lagging sequences of heatmaps captured over time are superimposed and animated. Depending on the time frame over which these animations are created, they can reveal the evolution of visitor behavior over time for example showing the spread of particular groups within an exhibition, highlight the dynamics around specific exhibits, or identify behaviors that are characteristic of specific time periods.
With the exception of the statistical alternative, the construction of observed visitor strategies require the calculation of all typical descriptive statistics typically employed in tracking and timing studies. This process can be facilitated by one of the standard statistical analysis packages such as the open source environment R and its commercial equivalent SPSS. It is also possible to conduct the same calculations using the primitives provided by a spatial database such as the open source PostGIS and the commercial Oracle Spatial, or specialized geographic information systems such as the open source QGIS and the commercial ArcGIS. In all cases, such spatial processing tools allow the detailed description of space and spatial layouts in a structured manner and recorded following open

1:8 • T. Moussouri and G. Roussos
ACM Journal on Computing and Cultural Heritage, Vol. xx, No. xx, Article xx, Publication date: Month YYYY
specifications such as the ESRI Shapefile, which is portable among most such systems. Notably, it is possible to precisely specify the boundaries of exhibit areas using geographic primitives such as points, polylines and polygons and subsequently to conduct analyses using these representations. Figure 2 above shows how the demarcations representing areas of interest at the London Zoo encoded in the same shapefile are presented on QGIS. Figure 5, shows selected features from the same shapefile overlaid with statistics associated with visitors use of this area including the number of visitors and average dwell time. This is however a highly repetitive process if carried out manually so in practice a software implementation of this process greatly facilitates this processing.
With the exception of the statistical alternative, the construction of observed visitor strategies require the calculation of all typical descriptive statistics typically employed in tracking and timing studies. This process can be facilitated by one of the standard statistical analysis packages such as the open source environment R and its commercial equivalent SPSS. It is also possible to conduct the same calculations using the primitives provided by a spatial database such as the open source PostGIS and the commercial Oracle Spatial, or specialized geographic information systems such as the open source QGIS and the commercial ArcGIS.1 In all cases, such spatial processing tools allow the detailed description of space and spatial layouts in a structured manner and recorded following open specifications such as the ESRI Shapefile, which is portable among most such systems. Notably, it is possible to precisely specify the boundaries of exhibit areas using geographic primitives such as points, polylines and polygons and subsequently to conduct analyses using these representations. Figure 2 above shows how the demarcations representing areas of interest at the London Zoo encoded in the same shapefile are presented on QGIS. Figure 5, shows selected features from the same shapefile overlaid with statistics associated with visitors use of this area including the number of visitors and average dwell time. This is however a highly repetitive process if carried out manually so in practice a software implementation of this process greatly facilitates this processing.
Fig. 5. Dwell time and related descriptive statistics associated with a user-defined region corresponding to the café area at the London Zoo. The statistics have been automatically calculated and displayed by the Audience Focus Analytics system.
1 The details of using such systems is beyond the scope of this paper and we direct the interested reader to the resources and tutorials published by the Open Source Geospatial Foundation at www.osgeo.org.

Visitor Studies using Smartphone-based Location Sensing • 1:9
ACM Transactions on xxxxxxxx, Vol. xx, No. xx, Article xx, Publication date: Month YYYY
6. LONDON ZOO CASE STUDY
One of the co-authors of this paper (Moussouri) has been investigating how motivation influences the visit experience for families for over 20 years, and for this reason a case study was developed around current research issues in this domain. The London Zoo offers a suitable setting for the investigation of the relationship between family visitor motivation and the observable aspects of their visit strategies through smartphones two reasons: the availability of a relatively well-developed body of research on the family visit experience to zoos in general (Bruni et al 2008, Falk et al 2007, Ross and Gillespie 2009, Rosenfeld 1981, Yocco et al 2010) and the London Zoo specifically (Tunnicliffe et al 1997) and also the possibility to use GPS effectively for location tracking. According to the literature, a core ingredient of the visit experience is the family's own agenda about what the visit will hold, which incorporates prior knowledge and cultural itineraries. The visit experience itself is viewed as the result of the interaction between the family agenda on the one hand and the museum agenda on the other, constructed via a process of negotiation (Moussouri 2003, 2007). Discovering how this process unfolds during the visit and whether it is possible to identify relationships or indeed describe the underlying generating process in a principled manner is one of the main questions considered.
Research Approach 6.1We approached family groups as they entered the Zoo, explained the purpose of the study and what their participation would involve and forty-six families gave their consent. These families were asked to complete a Personal Meaning Mapping (Falk et al 1998) that was used to gather data about their prior knowledge, interests, imagined visit routes, and expectations of what family members would be able to do and see individually and as a group. Having completed the pre-visit Personal Meaning Mapping (PMM), families were then provided with a smartphone that recorded their location for the complete duration of their visit. We opted to provide the same model device to all families so that the recorded location data would be of comparable quality. Tracking software was already installed and operational and the device was placed in a soft pouch that could be safely attached to a belt or placed inside a pocket or handbag. The field researcher made arrangements to meet the family visitors at a specified location but no fixed time was given for this. Families were free to choose when to terminate their visit and the purpose for the meeting was for the return of the device.
After recruiting families for the day, the researcher would then proceed to the post-visit meeting point and wait for their return, at which point they were asked whether they were willing to continue the discussion. At that time, visitors were asked to re-visit their PMM and add or modify any aspect they wished. The post-visit PMM captured information related to changes in knowledge and interests, reconstructed visit routes and the extent to which expectations were met. An informal interview (Silverman 2013) followed, where family members were asked their reasons for visiting. Often this information was also included in their PMM, in which case we prompted them to give more information. Three out of the forty-six participating families were not able to complete the post-visit PMM, due to time constraints, and were excluded from the study.
Technological Setup 6.2At the conceptual level location sensing appears straightforward but in practice the information
actually recorded by a smartphone can take diverse forms. Specific location-sensing systems are distinguished by particular characteristics and performance both of which are critical in deciding their suitability for collecting data in particular settings. The most common location sensing system for outdoor use is the Global Positioning System. GPS has been in operation since the late 1970s and depends on a constellation of satellites, which regularly transmit signals incorporating identification and timing information. GPS receivers estimate their position in terms of latitude, longitude and elevation, through a process called triangulation using the satellites as reference points. Typically receivers carry out these calculations independently and do not communicate back with the satellites

1:10 • T. Moussouri and G. Roussos
ACM Journal on Computing and Cultural Heritage, Vol. xx, No. xx, Article xx, Publication date: Month YYYY
or employ mobile telephony infrastructure. GPS receivers today have become a standard feature of smartphones.
GPS accuracy2 and precision3 depend on a large number of environmental and technical factors such as visibility of satellites (the more satellites are visible the higher accuracy can be achieved), the quality of the receiver chip, atmospheric conditions, and sun activity. It is, thus, difficult to provide a figure for these properties that would hold true under all circumstances. Nevertheless, when a typical smartphone is used in North America or Europe one can expect better than two meters accuracy for 99 per cent of the time at open spaces. Access to supplemental satellite systems can further improve performance, for example receivers that augment GPS through the WAAS system (via the EGNOS constellation in Europe) can improve accuracy to about one meter.
For our London Zoo case study we employed the Openmoko Neo smartphone as our location-sensing device. We selected this device for several reasons: First, it integrates a precise Assisted-GPS unit that provides location estimates with superior accuracy further improved by the application of a so-called Kalman filter (Welch and Bishop 2001) which removes outliers and applies corrections. Second, this device allows flexible direct hardware access, scripting language support and, uniquely among commodity smartphone platforms, allows full control and customization of its capabilities. Notably, it provides full USB host functionality, which we used to extend its data capture capabilities with external sensing modalities including ultrasound sensors (cf. Section 9). We implemented software to recorded location at a high rate of one sample per second so as to observe visitor movements at high detail.
GPS is an ideal solution for tracking in outdoor settings, because it can be used with no requirements for the installation of infrastructure. However, its dependency on satellites in orbit limits its use: Building walls and roofs attenuate heavily the signal so that indoors distance and timing measurements become unreliable and in most cases completely unusable. Moreover, the presence of large reflective surfaces in relatively close proximity to the receiver also influences the accuracy of the calculation. In the case of the London Zoo, the relatively few areas that are covered have particularly thin roofs constructed with dielectric materials that have a small effect on the signal and it was thus still possible to get usable location estimates. The only exception to this is the Bug exhibit where we are still able to detect the point of entry and exit but not visitor movements while indoors.
An alternative to the approach we adopted would be to employ smartphones carried by visitors instead, which would have significant cost benefits, and visitors may be less likely to perceive tracking negatively. Yet, recruiting would be restricted to those who already carried a suitable device. There are several reasons for our choice: Firstly, at the time (Spring 2009) smartphone use was less common than today where adoption has reached significant rates (Mobiles in Museums Study 2012). More importantly, since this was our first large scale study using smartphones we placed priority on obtaining consistent data and ensuring that the software and devices employed were better tested, more tightly controlled and, thus, more resilient to errors. This approach may also raise fewer visitor concerns about privacy, as no personal data are stored on the smartphone. Nevertheless, carrying an extra device with the sole purpose of recording their tracks may increase awareness of the observation process and influence their behavior. In the long term and with increasing confidence in commodity smartphone platforms to consistently provide high quality data traces we anticipate that such studies
2 Accuracy refers to the distance between the reported position and the actual location of the smartphone carrying out the calculation or else the error present in the estimate, for example within 5 meters from the actual position. 3 Precision refers to the percentage of time that we can expect to get this accuracy or else how often we can expect to achieve it, for example 98 per cent of time.

Visitor Studies using Smartphone-based Location Sensing • 1:11
ACM Transactions on xxxxxxxx, Vol. xx, No. xx, Article xx, Publication date: Month YYYY
would generally be carried out by using visitors own devices with tracking software made available via the corresponding app store.4
Data Collection, recostruction and Analysis 6.3Location traces were stored both locally on the smartphones and the records replicated by
transmitting them over the mobile network to a database. Local storage is generally easier to implement and less prone to disruption due to network connectivity problems but requires manual retrieval of the data. Online logging may result in significant data loss especially when high-frequency recording is carried out, as was the case in the London Zoo case. Indeed, our survey of the London Zoo site identified several areas were signal reception was poor and severely limited data communication, which implied that online logging was not a viable option. We nevertheless opted for the combined approach as at the time we were somewhat concerned that participants may fail to return the smartphones thus making the data unavailable to us, a concern which was mitigated in this way.
The final ingredient in analyzing data was provided by open web mapping systems notably high quality site imagery from Google and Bing Maps and finer-grain annotated mapping information collected by the Open Street Map project. For our automated analysis we also employed detailed architectural drawing provided by the Zoo used as input for QGIS, which we employed for the demarcation of significant areas on the site.
Raw data logs retrieved from smartphones were processed in a form suitable for further analysis and investigation. Raw observations were recorded following the NMEA 0183 specification that provides low-level information that is generally not directly applicable to the investigation of the research questions in hand. Each entry in the NMEA log lists timing and location measurements (longitude, latitude and elevation) as well as information relating to the quality of the measurement obtained and error correction codes that ensure that the data has not been corrupted. The first step in converting raw data to higher-level information that can be used in our investigations requires the application of filters to remove low-confidence measurements and measurements where no location estimates could be obtained, and process the remaining high quality observations into time-ordered sequences which we represented as tuples of the form
(family ID, date, time, latitude, longitude),
where family ID is a unique code assigned to identify each family and time is recorded to the accuracy of seconds which is necessary due to our high-frequency recording. The complete time-ordered trace for each family visit is encoded in a single data file that provides the input necessary for subsequent processing steps. From these tuples we reconstruct the observed visitor strategies of Section 4 and apply the analysis techniques Section 5 to explore and the captured spatial patterns of behavior, which help us understand the different visit strategies.
The key question we consider in the Zoo study is whether we can identify a relationship between naturalistic data collected through the PMM and interviews and the observed strategy representations derived by the location traces --- to this question we also extend the data analytics approach incorporating both location and PMM/interview data. Our approach in this task was based on the extraction of association rules and clustering, both being standard data science techniques. A detailed description of these techniques is beyond the scope of this paper and we direct the user to the open source Weka system and related bibliography (Witten et al. 2011). We have also used techniques for clustering and classification in the special case of trail-based data described in Papadogkonas et al. (2008), which incorporate analyses on single features such as dwell time, within a unified framework.
4 It is worth noting that at the time the London Zoo was offering a mobile multimedia guides to visitors, which had the capability to track via GPS their movement that could provide a rich source of data. However, we were unable to gain access to this information due to contractual restrictions placed by the developer.
1:12 • T. Moussouri and G. Roussos
ACM Journal on Computing and Cultural Heritage, Vol. xx, No. xx, Article xx, Publication date: Month YYYY
The application of clustering and association rules revealed that particular types of motivation determine the type of places and activities families choose to engage with, and this choice is based on the function those places or activities play (Moussouri and Roussos 2013). Two distinct observed visit strategies were identified that directly relate to social groupings with distinct motivations:
- Families with social event or entertainment motivation always visited at least one place of the non-exhibit function, spending an average of 25-30 percent of the total visit in places such as café, shop, and playgrounds.
- Families with education/participation motivation visited only places with exhibit functions. Investigations between other attributed and representations did not establish further relationships between the attributes recorded in our data. In conducting such explorative work interactive environments such as Weka are critical. This is both because they provide a straightforward way to employ powerful analytics techniques through a relatively simple user interface and at the same time because they are able to deal with complex and voluminous data sets with relative ease.
Methodology evaluation 6.4In addition to the specific research question relating to family visitor motivation, we were also
interested to assess the performance of location sensing with smartphones as a tool for visitor studies as well as the specific methodology adopted. To this end the London Zoo study identified three distinct benefits of this approach:
1. Increased efficiency in terms of human effort, time and cost. In this study, a single individual was able to collect over 45 complete tracks, PMMs, and conduct interviews over a period of only six days. This represents an approximately five-fold improvement over what would be possible for an experienced researcher over the same period of time taking into account that visits were fully tracked between two and four and a half hours.
2. Finer tracking detail and precise localization. Using smartphones visitor positions are recorded at high frequency and precision, and with undivided attention on each observation for the duration of the visit. Records are created for all observed behaviors, not only those deemed of relevance at the time of observation, thus enabling researchers to explore questions that may not have been initially identified as relevant to the study. Indeed, this approach addresses a common criticism of tracking studies namely that logs are influenced by quick assessments made while the researcher works under pressure due to the concurrent requirements of observation and record keeping, and the fatigue caused by several hours of intense fieldwork.
3. Advanced analytics. The ability to collect significantly higher volumes of information over considerably longer periods of time enables the application of more sophisticated techniques for analysis. Such techniques include summarization, visualization and inference, often require higher data volumes to produce accurate results, and may be too costly and cumbersome to consider their application on manually transcribed data.
7. DISCUSSION
We consider location tracking as the first step in a comprehensive program of research in the use of sensor-rich smartphones for visitor studies. To this end, a question that merits further consideration is the direct comparison of data collected by a researcher and data collected automatically through technology. An attempt to explore this question has been the work of Baldwin and Kuriakose (2009) that provides encouraging evidence in favor of the technology but, clearly, more comprehensive studies are required that would fully account for the realities of museum visitor tracking. One observation that appears relevant is that data collectors invariably make analytical decisions while they collect data in the sense that they interpret the range of behaviors that record as interactions with an exhibit but do not always record the decision process itself. Moreover, recording on the
Visitor Studies using Smartphone-based Location Sensing • 1:13
ACM Transactions on xxxxxxxx, Vol. xx, No. xx, Article xx, Publication date: Month YYYY
tracking sheet or tablet can be challenging, especially at busy times, despite the extensive experience and training of the observer and moreover multiple data collectors working in parallel may differ in their practice in unnoticeable but important ways.
The lack of individuality of electronic devices can be a distinct advantage in this case and also effective in restricting focus exclusively on observation with interpretation occurring at a later time based on the raw data and supporting alternatives. Nevertheless, it is necessary to consider whether awareness that such detailed monitoring takes place impacts visitor behavior. Studies must consider this question within the context set by their specific research questions (as in some cases changing visitor behavior is not a concern, for example, where the “change” in behavior is part of the data), what alternative methods are available, and how a possible change in behavior could be minimized or be accounted for in the analysis of the data.
While location sensing is the most commonly available mobile sensing technology several other modalities offer interesting opportunities. Indeed, smartphones typically carry a dozen or so sensors that can capture a variety of personal and environmental information. For example, high quality three- and six-dimensional accelerometers have been used to infer user activities, and microphones can be used to capture fragments of audio when visitor speak which can indicate the emotional state of the speakers. These techniques are rapidly reaching maturity and are expected to become adequately dependable for audience research. At the London Zoo we experimented with infrared proximity sensors to measure spatial density, which can provide an estimate of crowding levels. Unfortunately the technology has considerable usability problems and for this reason we did not employ it with family participants. In other projects we have employed with a variety of environmental sensors and biosensors such as those measuring air quality and pollution, noise, ambient radiation, temperature, humidity, heart rate and skin conductance, all of which are widely available at very low price. Finally, there is evidence that location and proximity sensing enables the inference of social interactions. This approach is being investigated in the study of social networks in a physical setting (Crandell et al 2009, Kostakos et al 2011, Vu et al 2011) and with growing maturity could also be applied for visitor studies.
Mobile sensing technology could become especially complementary to participatory studies, such as ethnographic or action research, with several alternative directions to investigate. An alternative to the approach explored in this paper would employ tracking data as the focal point for post-visit interviews, or to trigger participant memories in longitudinal studies. Regarding the former, animations and visualization techniques described in Section 6 could be presented to visitors to act as a reminder and prompt of their experience. Regarding the latter, location-sensing could be used to activate the presentation of place-specific questionnaires provisioned on the smartphone relating to specific aspects of the exhibition or the visitor experience in a highly targeted manner. In addition to increased efficiency in conducting interviews, situating the questions in their actual context will remove the need and distortion related to the provision of visual cues or contextual information as an aide de memoir. An additional benefit in this case is that related meta-data such as answering times are automatically recorded. Note however that in this case input from the visitors will be necessary. Indeed, even when a visitor carries a smartphone that does not necessarily mean that she is familiar with all of its functionality (Raento et al 2009).
Museums are increasingly present online providing web-based experiences beyond simple information provision increasingly incorporating social media, collaborative authoring and content sharing. The combination of this digital footprint created through participation in online activities and movement tracking captured during visits to the museum can be combined to create powerful insights into behavior across the two settings. This approach is rapidly adopted in social science with remarkable results (Lazer et al 2009) and we believe that it has similarly wide-ranging potential for museums.
Finally, we consider that a crucial step towards establishing the methodology outlined in this paper as a standard tool for the visitor studies community is the availability of an integrated software

1:14 • T. Moussouri and G. Roussos
ACM Journal on Computing and Cultural Heritage, Vol. xx, No. xx, Article xx, Publication date: Month YYYY
platform that supports the data process and closely traces its steps. it seems necessary to highlight the role of software in facilitating this type of work. Indeed, throughout this paper we have employed a variety of open source tools but we recognize that even the use of such tools sets a considerable barrier in terms of skills and expertise. As noted previously, we are currently developing an analytics platform which we aim to use popularize this approach. This is an area where interdisciplinary collaborations can produce significant outcomes for visitor studies, as we believe is evidenced by this paper.
8. CONCLUSIONS
The design of any type of visitor studies is a balancing act whereby alternative methodologies must be weighed against the aims and research questions of the study as well as the time and resources available to complete it. In this context, we believe that a distinct benefit of smartphones as a visitor studies tool is their ability to collect very high volumes of accurate and precise tracking and timing data with minimal cost and effort. This in turn, enables opportunities for more advanced analysis that can provide unique insights into the dynamics of museum visiting that may have been intractable by research thus far. Compared against standard data collection practice where manual data collection makes this prohibitively uneconomical, the high volume of data afforded by these techniques makes visitor modeling possible at a new level of sophistication. In particular, it makes large-scale and longitudinal studies significantly easier to conduct and thus through the application of this technique it may finally become feasible to overcome the financial barriers in conducting such studies.
In this regard, smartphones can play a central role in responding to numerous calls from the field which have criticized project-based studies as limited to capturing snapshots of short-term learning benefits, while making cross-institution comparisons very difficult. Furthermore, the accelerated cycle of data collection and analysis makes this approach particularly suitable for evaluation studies where findings need to be fed back to the project team at very short time frames. More generally, the ability to process and analyze data collected almost instantaneously makes it easier to respond to visitor perceptions and rapidly evolve both the content and the interpretation mode of the exhibition under development. Indeed, smartphones provide distinct benefits for formative evaluation studies where the whole or sections of an exhibition are prototyped, or in cases where participatory approaches such as audience panels and other types of advisory groups are employed in exhibition development.
In the medium term we anticipate the most effective use of smartphones to be in a methodological approach that combines traditional and location sensing methods such as that developed for our London Zoo study. We found that technology-based data collection can successfully be incorporated into a methodology that derives from research questions pertinent to the study of visitors in museums and other cultural institutions. In the longer term, we anticipate that the application of this technology will enhance our ability to investigate museum-specific theory on the nature of museum visiting and its relevance to and meaning for people’s lives, as well as help explore the affordances of different modes of interpretation: for example, findings from our London Zoo study indicate a direct link between some categories of motivation and visitors’ routes.
Although the main aim of this paper is to advocate the use of smartphones for visitor studies, we are also mindful that technology is only the enabler and that in many cases they would be one of several alternatives available to researchers who must make choices primarily guided by appropriateness for investigation of their specific research question. Moreover, in making this choice considerations of cost and resource availability are certainly important, but it is also critical that due consideration is given to other practical matters such as the material context established by the physical setting, the accuracy and precision of tracking required, and the level of familiarity of the targeted visitor with technology. We surmise that the methods, methodology and guidelines provided

Visitor Studies using Smartphone-based Location Sensing • 1:15
ACM Transactions on xxxxxxxx, Vol. xx, No. xx, Article xx, Publication date: Month YYYY
in this paper will provide useful guidance that will allow visitor studies practitioners to match individual research settings with appropriate technology and analytics.
REFERENCES
Stephen Bitgood. 2006. An analysis of visitor circulation: Movement patterns and the general value principle. Curator 49, 4 (2006), 463–475
Coral M. Bruni, John Fraser and P. Wesley Schultz. 2008. The value of zoo experiences for connecting people with nature. Visitor Studies 11, 2 (2008), 139–150
William S. Cleveland. 2001. Data Science: An Action Plan for Expanding the Technical Areas of the Field of Statistics. International Statistical Review 69, 1 (2001), 21–26
David J. Crandall, Lars Backstrom, Daniel Huttenlocher and Jon Kleinberg. 2009. Mapping the world’s photos. In Proceedings of the 18th international conference on World wide web (WWW’09), 761-770
Eyal de Lara and Anthony LaMarca. 2008. Location Systems: An Introduction to the Technology Behind Location Awareness. Morgan & Claypool Publishers
Matt Duckham. 2010. Moving forward: location privacy and location awareness. In Proceedings of the 3rd ACM SIGSPATIAL International Workshop on Security and Privacy in GIS and LBS, New York, NY, USA, 1–3
Environmental Systems Research Institute, Inc. 1998. is based on the function those places or activities play. Retrieved on 27 July 2014 from http://www.esri.com/library/whitepapers/pdfs/shapefile.pdf
John H. Falk, Theano Moussouri and Douglas Coulson. 1998. The effect of visitors’ agenda on museum learning. Curator 41, 2 (June 1998), 106–120
John H. Falk, Eric M. Reinhard, Cynthia L. Vernon, Kerry Bronnenkant, Joe Heimlich and Nora L. Deans. 2007. Why zoos & aquariums matter: Assessing the impact of a visit to a zoo or aquarium. Association of Zoos and Aquariums, Silver Spring, MD, USA
Nigel G. Fielding and Raymond M. Lee. 1998. Computer Analysis and Qualitative Research. Sage Publications. Jeffrey C. Hallo, Robert E. Manning, William Valliere and Megha Budruck. 2004. A case study comparison of visitor self-
reported and GPS recorded travel routes. In Proceedings of the 2004 Northeastern Recreation Research Symposium, Bolton Landing, New York, 172–177
George E. Hein. 1998. Learning in the Museum. Routledge Jeffrey Hightower and Gaetano Borriello. 2001. Location Systems for Ubiquitous Computing. Computer 34, 8 (2001), 57–66 Bill Hillier and Kali Tzortzi. 2006. Space Syntax: the language of museum space. In S. MacDonald (Ed.) A Companion to
Museum Studies, Blackwell Publishing, London, 282–301 Sheri Hsi and Holly Fait. 2005, RFID enhances visitors' museum experience at the Exploratorium, Communications of the ACM
48, 9 (2005), 60–65 Marilyn G. Hood. 1986. Getting started in audience research. Museum News 64, 3 (April 1986), 24–31 ICOM 2007. International Council Of Museums Statues, Article 3, Section 1. Vienna, Austria, August 24 Rasoul Karimi, Alexandros Nanopoulos and Lars Schmidt-Thieme. 2012. RFID-Enhanced museum for interactive experience.
Communications in Computer and Information Science 247 (2012), 192–205 Vassilis Kostakos, Eamonn O'Neill, Alan Penn, George Roussos and Dikaios Papadogkonas. 2010. Making sense of urban
mobility and encounter data. ACM Transactions on Computer-Human Interaction (TOCHI) 17, 1 (March 2010), 1–38 David Lazer, Alex Pentland, Lada Adamic, Sinan Aral, Albert-László Barabási, Devon Brewer, Nicholas Christakis, Noshir
Contractor, James Fowler, Myron Gutmann, Tony Jebara, Gary King, Michael Macy, Deb Roy and Marshall Van Alstyne. 2009. Computational Social Science. Science 323, 5915 (February 2009), 721–723
Nigel Linge, David Parsons, Duncan Bates, Robin Holgate, Pauline Webb, David Hay and David Ward. 2007. mi-Guide: A wireless context driven information system for museum visitors. In Proceedings of the 1st International Joint Workshop on Wireless Ubiquitous Computing (WUC ’07). Funchal, Portugal, 43–53
Kyle C. Longest. 2011. Using Stata for Quantitative Analysis. Sage Publications. American Alliance of Museums (US), Museums Association (UK) Members and Fusion Research and Analytics. 2012. Mobiles in
Museums Study – 2012. Retrieved 27 July 2014 from https://aam-us.org/docs/research/mobilemuseums2012-%28aam%29.pdf
Theano Moussouri. 2003. Negotiated agendas: Families in science and technology museums. International Journal for Technology Management. 25, 5 (2003), 477–489
Theano Moussouri. 2007. Mediating the past: Museums and the family social life. In Nena Galanidou and Lin Helga Dommasnes (Eds.) Telling children about the past: An interdisciplinary perspective. International Monographs in Prehistory. Ann Arbor, MI, USA, 261–278.
Theano Moussouri and George Roussos. 2013. Examining the effect of visitor motivation on observed visit strategies using mobile computer technologies. Visitor Studies 6, 1 (2013), 21–38
Theano Moussouri and George Roussos. 2014. Mobile sensing, BYOD and Big Data Analytics: New technologies for audience research in museums. Participations: Journal of Audience and Reception Studies 11, 1 (June 2014)
Dikaios Papadogkonas, George Roussos and Mark Levene. 2008. Analysis, ranking and prediction in pervasive computing trails. In Proceedings of the IET International Conference in Intelligent Environments, 21-22 July, Barcelona, Spain, 1–8

1:16 • T. Moussouri and G. Roussos
ACM Journal on Computing and Cultural Heritage, Vol. xx, No. xx, Article xx, Publication date: Month YYYY
Doantam Phan, Ling Xiao, Ron Yeh, Pat Hanrahan and Terry Winograd. 2005. Flow map layout. In Proceedings of the 2005 IEEE Information Visualization Conference (INFOVIS’05), 219–22.
Sophia Psarra. 2005. Spatial Culture, Way-finding and the Educational Message: the impact of layout on the spatial, social and educational experienced of visitors to museums and galleries. In S. Macleod (Ed.) Reshaping Museum Space: architecutre, design, exhibitions. Routledge, New York, NY, 78–95
Mika Raento, Antti Oulasvorta and Nathan Eagle. 2009. Smartphones: An emerging tool for social scientists. Sociological Methods and Research 37, 3 (2009), 426–454
Sherman Rosenfel. 1981, Informal Learning in Zoos: Naturalistic Studies of Family Groups. Unpublished PhD Thesis. University of California, Berkeley
Steve Ross and Katie L. Gillespie. 2009. Influences on visitor behavior at a modern immersive zoo exhibit. Zoo Biology 28, 5 (2009), 462–472
David Silverman. 2013. Doing Qualitative Research: A Practical Handbook. Sage Publications Martin Tröndle, Stéphanie Wintzerith, Roland Wäspe and Wolfgang Tschacher. 2012, The Influence of ‘Sociality’ on Art
Reception in Museum Space. Museum Management and Curatorship 27, 5 (2012), 461–485 Sue Dale Tunnicliffe, A. M. Lucas and Jonathan Osborne. 1997. School visits to zoos and museums: a missed educational
opportunity? International Journal of Science Education 19, 9 (1997), 1039–1056 Unknown. 2010. Using Off-the-Shelf GPS Technology for Visitor Tracking Studies. Visitor Studies Association Conference Greg Welch and Garry Bishop. 2001, An Introduction to the Kalman Filter. ACM SIGGRAPH 2001 Tutorial. Retrieved on 27
July 2014 from http://www.cs.unc.edu/~welch/media/pdf/kalman_intro.pdf Gillian Wilson. 2004. Multimedia Tour Programme at Tate Modern. In Proceedings of Museums and the Web 2004. Retrieved on
27 July 2014 from http://www.archimuse.com/mw2004/papers/wilson/wilson.html Ian H. Witten, Eibe Frank and Mark A. Hall. 2011. Data mining: Practical machine learning tools and techniques (3rd ed.).
Morgan Kaufmann. San Francisco, CA, USA Long Vu, Quang Do and Klara Nahrstedt. 2011. Jyotish: Constructive approach for context predictions of people movement
from joint Wifi/Bluetooth trace. Pervasive and Mobile Computing 7, 6 (2011), 690–704 Victor S. Yocco, Joe E. Heimlich, Chris Myers and S. David Jenike. 2010. Let’s go to the zoo! Visitors’ social expectations of a
trip to the zoo. International Zoo Education Journal 46 (2010), 36–40. Steven S. Yalowitz and Kerry Bronnenkant. 2009. Timing and tracking: unlocking visitor behavior. Visitor Studies 12,
1(January 2009), 47–64. Yuji Yoshimura, Fabien Girardin, Juan Pablo Carrascal, Carlo Ratti and Josep Blat. 2012. New tools for studying visitor
behaviors in museums: a case study at the Louvre. In Proceedings of the 19th International Conference on Information Technology and Tourism, Helsingborg, Sweden, January 25-27 (2012), 391–402
Received May 2014; revised July 2014; accepted October 2014