Embed Size (px)
Citation preview

1
Current Population Issues
in Taiwan (I) Lan-hung Nora Chiang
Professor of Geography
National Taiwan University
20110802_ET_Lecture

2
Outline of Lecture
1. Location of Taiwan 2. Composition of Taiwan’s Population 3. Distribution of Population in Taiwan 4. Decline of Fertility Level – Taiwan’s
‘Success Story’ 5. Current Demographic Problems

3
I. Location of Taiwan
Relation to China: The island of Taiwan is situated across the
Taiwan Strait from China. Japanese rule (1895 to l945).

4
The Chinese nationalist government of President Chiang Kai-shek fled to Taiwan ahead of the advance of Communists under Mao Zedong in 1949. Up to the present, and close to 60 years after the Chinese revolution and the communist seizure of power in Beijing, relations between the Mainland and the island of Taiwan remain tense.

5

6

7
II. Composition of Taiwan’s Population Four major social groups inhabit the island: Han Chinese
Early migrants to Taiwan since 1720 Hoklos: about 60% of the population Hakka: about 15% of the population Mainlanders: Late migrants from 1946 and 1950
from different provinces of China Non-Han Chinese
Indigenous population: about 2%

8
The population of Taiwan is represented by four main groups who differ in terms of time of arrival, size and language of use. The Taiwan indigenous population, the “aborigines” constitutes about 2 per cent of the population. The Hoklos and Hakka, who are often referred to as “native Taiwanese” are ethnic Han Chinese who were in Taiwan before 1945 and their descendants, and form about 70 per cent and 12 per cent, respectively. The fourth group consists of the “mainlanders” and their descendants, who came to Taiwan from 1946 to 1950 when the mainland fell to the communists. In order to avoid the sometimes controversial political connotations of the names associated with each of the four groups of people in Taiwan, and for the sake of simplicity, the term “Taiwanese” is used in a purely geographical sense… (jw)
9
Don’t forget the recent immigrants to Taiwan… The most recent immigrant group (Hsinyimin 新移
民 ) consists mainly of women from Mainland China and South-East Asia who have married Taiwanese men and come to live in Taiwan. Foreign spouse amounts to over 400,000 in 2007, a vast majority are women. The children of these marriages with foreign brides constitute 12 per cent of new births in Taiwan each year, which causes some concern for policy makers.
In 2009, 18.7% (21,914) of married couples includes foreigners. (Ministry of Interior)

10
A Remark by someone from the Education Department on “New Children of Taiwan” “The new children of Taiwan ( 新台灣之子 )” h
as exceeded 80,000, and increase at 20% per year. It is estimated that in 2009, this number will exceed 150,000. It is estimated that in 2011 ( 民國一百年 ), one out of four school students would be a 新台灣之子”

11
Discusson:
Do you know how many tribes there are among the indigenous population, and who are they?
Can you recognize the 3 Chinese dialects on the Taipei metro?
Do you know the names of all the 23 counties and cities in Taiwan?
What are major causes of death in Taiwan?

12

13
III. Distribution of Population in Taiwan
Types of data: Census was held every ten years, since 1905
Household registration Occasional surveys (Because of changes in the social environment, problems
such as increases in survey cost, non-response rate…occur. Following the examples of Singapore, the Netherlands, and the Nordic countries, the method for conducting the 2010 Taiwan Census will be different, changing from the traditional census to a registry-based census with sampling survey. (Yen and Yue 2010)
14
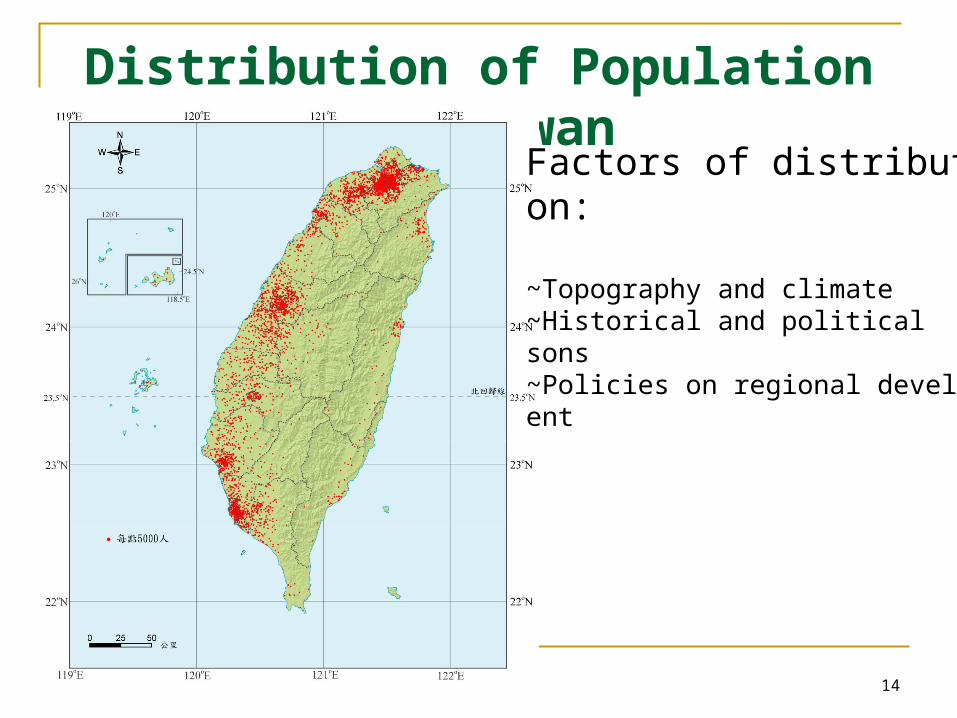
Distribution of Population in Taiwan
Factors of distribution:
~Topography and climate~Historical and political reasons~Policies on regional development

15
Topography of Taiwan

16
Unbalanced Growth of Four Regions
N: About 6.8 million
S: About 9 million
C: About 2.5 million

17
Regional Disparity Has Widened in The Last Thirty Years, Due to Globalization Movement of industries overseas, and rural-u
rban migration in rural countries result in an ageing population in rural areas. Counties with a large agricultural population has declined in income – e.g. Kaohsiung, Ilan.
Counties with high-tech industry become richer, e.g. Hsinchu, Taoyuan, Taichung, Changhua, Yunlin, and Tainan.

18
Intermission

19
IV. Decline of Fertility Level —Taiwan’s ‘Success Story ’ Family planning program and socio-economic
changes in 1960 to 1980 lead to rapid decline of population growth. Taiwan was rated top among 95 countries by World Population Watch Foundation (U.S.) in her success in family planning programs.
Net reproduction rate (NRR) below replacement level since 1984. (The NRR represents the number of female children that a female child just born can expect to bear, taking into account her risk of dying before the end of her reproductive years)

20
Decline in Natural Increase Rate In 1950, just after the Nationalist government
restored Taiwan to Chinese sovereignty, population was 7,500,000. This has increased 3-fold in 50 years. Latest Census (2000) records 23 million population.
The demographic transition was completed at the turn of the century as a society with high death and birth rates changed to one with low birth and death rates.
While it has taken 200 years for the western countries to complete their demographic transition, it has taken Taiwan only 70 years to do so.

21
Changes in Taiwan’s Birth and Death Rates

22
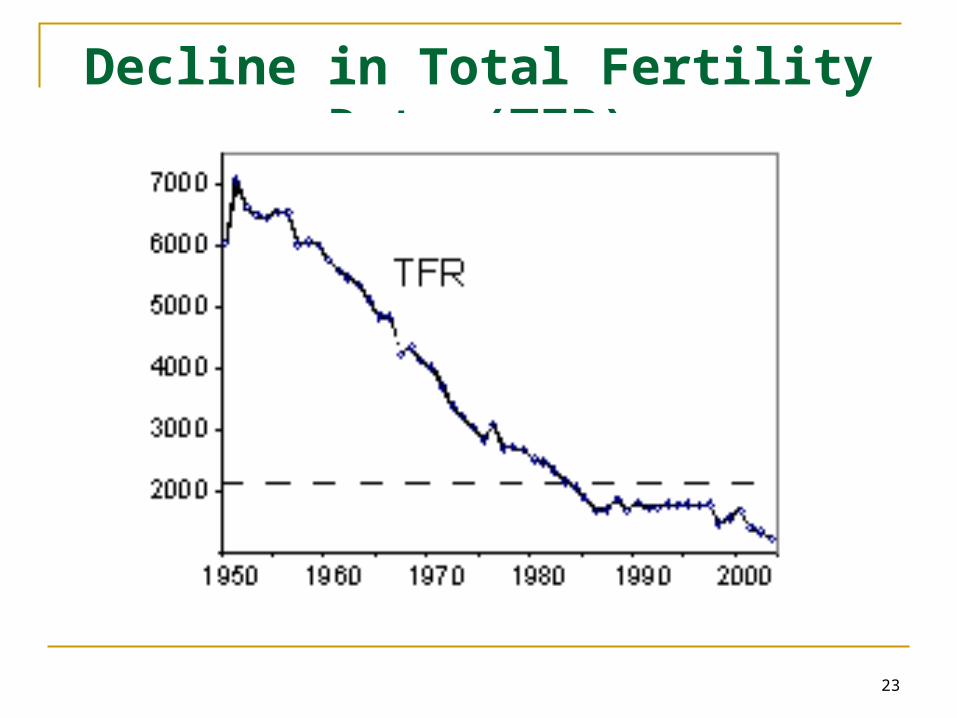
Changes in Total Fertility Rate (TFR) 7.04 in 1951 (highest in Taiwan’s history) 4.00 in 1970 2.52 in 1980 1.81 in 1990 1.68 in 2000 1.23 in 2003 1.11 in 2005 (lower than advanced western
countries) 1.1 in 2008 ??? in 2010
23
Decline in Total Fertility Rate (TFR)

24
Total Fertility Rates of Different Countries, 2010
USA – 2.0 France – 2.0 Australia – 1.9 Canada – 1.7 Germany – 1.3 South Korea – 1.2 Taiwan – 1.0 (1 since 2009, the lowest in the world) Source: Population Reference Bureau, 2010 World Population Data
Sheet

25
V. Current Problems
The low TFR of women of marriageable age is regarded as a problem which would have repercussions on future population growth, family, and national development. Taiwan faces an ageing population.
Population policies now focus on low fertility level, ageing and foreign brides (Hsinyimin 新移民 ).

26
Number of Births Is Reducing Each Year for Taiwan There were 353,310 births in the year 2000,
when the birth rate was 13.76 per thousand. Up to August of 2007, there are 131,654
births, and birth rate is only 5.75 per thousand.
Number of day care centers have declined from last year. “Number of births this year is less than half of the number seven years ago” (China Times, Oct. 13, 2007).

27
Decline in number of birth per year

28
Source: Today Magazine
1963 – 427,200 births due to baby boom 1968 – Family planning programs were
successfully implemented. 1976 – Number of births reached its peak,
and declined since then. 1984 – Decline in birth rate. 1993 – Population aged >65 reached 7%. 2009 – TFR dropped to 1 (lowest in the
world)

29
Four major reasons 1. Young people are not marrying 2. People are marrying late 3. Age of birth is postponed 4. Number of births have declined
Repercussions: Primary school children rapidly decline in numbers; 11 new schools
which were planned were cancelled in Taipei.In 2016, students (born in 1998) entering university will decline
drastically. Already in some private universities, teachers are not getting their salary because of financial burden due to reduction of students. Teachers fear unemployment.
Closing down of kindergartens.In the last five years, 600 maternal clinics have closed.Shrinking of internal market for toys.

30
Sex Ratio
Sex ratio of population at birth was 105, reaches 110 (100 females) in 1991, and 109 in 2010.
Sex ratio increases with birth order. More than 120 for the third child.
Examples from other countries: Korea (107), China (110), Hong Kong (108).
What about your country?
31
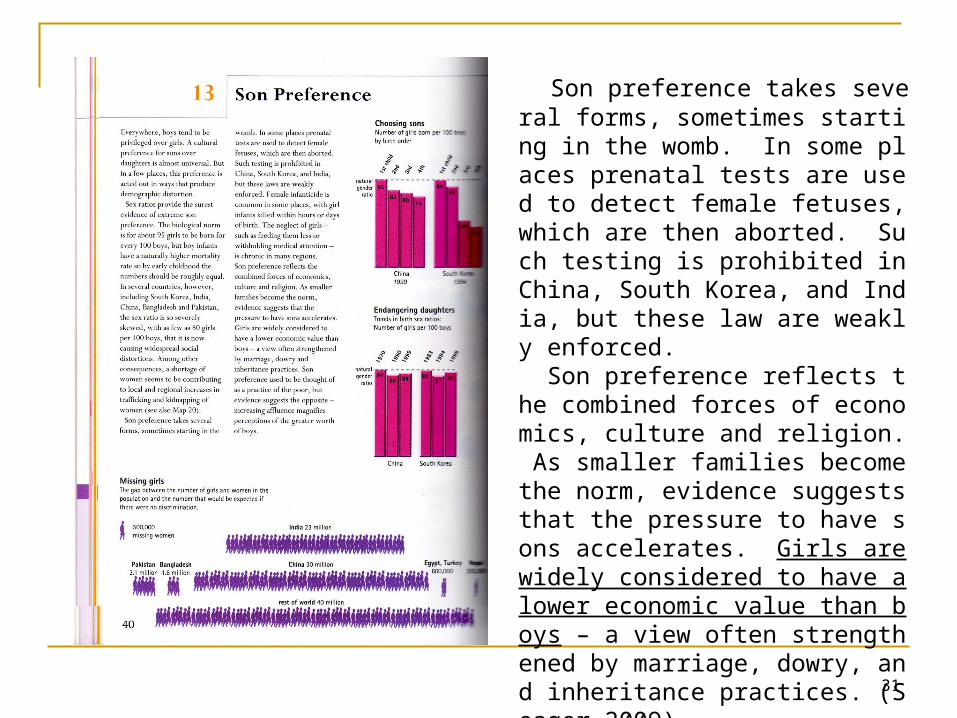
Son preference takes several forms, sometimes starting in the womb. In some places prenatal tests are used to detect female fetuses, which are then aborted. Such testing is prohibited in China, South Korea, and India, but these law are weakly enforced. Son preference reflects the combined forces of economics, culture and religion. As smaller families become the norm, evidence suggests that the pressure to have sons accelerates. Girls are widely considered to have a lower economic value than boys – a view often strengthened by marriage, dowry, and inheritance practices. (Seager 2009)

32

33
China
On average, 116 boys were born for every 100 girls, though regional differences vary widely. The areas with the highest boy to girl ratios are in the southeast, where the Han people live. This skewed birth ratio is likely the result of pre-birth gender screening.
Huangmei County in Hubei Province has the highest sex ratio: 193
(Source: Population Census of China, 2000)
[World Population: 6.8 billion; China population: 1.335 billion)

34
Estimated Proportions of Population in Each Age Group (1981~20
51)台灣未來三階段人口年齡結構圖(中推計)
2051
2026
2014
2004
1991
1981 31.6% 64.0% 4.4%
26.3% 67.2% 6.5%
19.3%
14.7%
12.0%
8.9%
71.3%
73.7%
67.6%
55.6%
9.4%
11.6%
20.4%
35.5%
0~14 歲 15~64 歲 65 歲以上
Source: CEPD

35
Percentage of Population Above 65 Years of Age (2010) Japan – 23% Germany – 20% France – 17% U.S. – 13% Hong Kong – 13% Taiwan – 11%
(In 2006, population aged above 65 reached 10%) China – 8% Singapore – 9%
Source: Population Reference Bureau, 2010 World Population Data Sheet

36
Population Pyramid, 2006
2000 年次龍兒
1988 年次龍兒
1976 年次龍兒
1964 年次龍兒
台灣地區 2006年人口金字塔圖

37
Projected Population

38
Questions: In what years were the baby-boomer born? What were the years of the dragon?
(2012, 2000, 1988, 1976, 1964)
Why do Taiwanese parents want to have their child born in the year of the dragon?

39
1. Look up data from Population Reference Bureau (http://www.prb.org/)and make a table showing a comparison of ten countries, with regard to various degrees of socio-econ
omic development. Explain why you choose such indicators.
2. Ecologists/geographers think that the earth is already over-populated. Do you think that Taiwan should be more concerned about impact of humans on the environment, rath
er than worrying about her declining birth rate?
Assignment #3 (answer one of the following)

40
Thank you for your attention
Will continue with Pressure on the Environment (12/15/2010)