Embed Size (px)
Citation preview
1
Current Status of Japanese
Manufacturing Industry
Reinosuke Hara
2
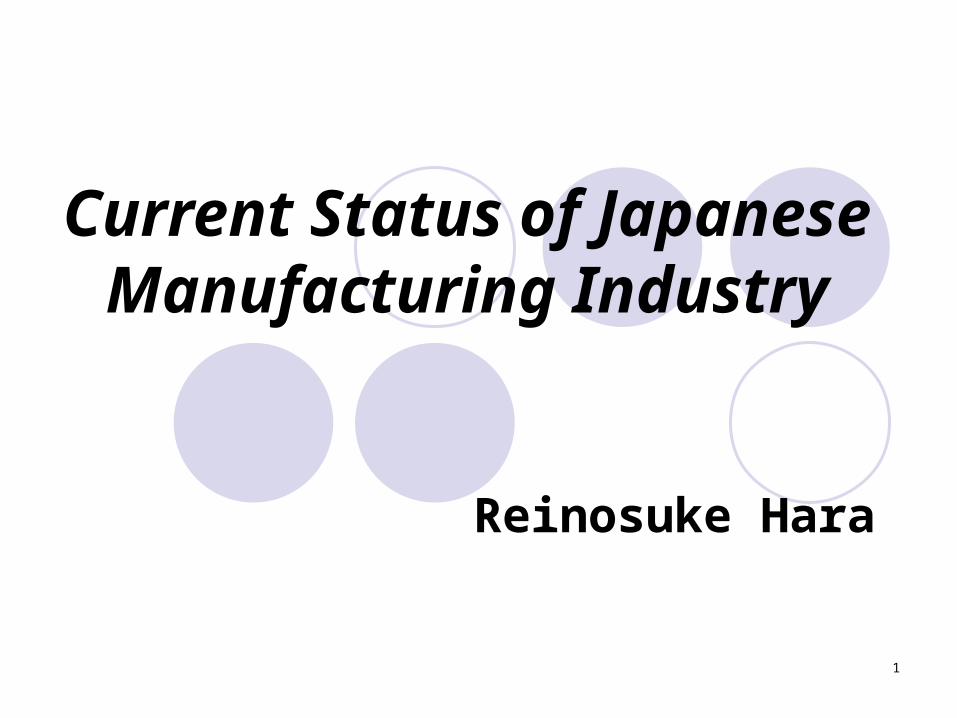
GDP Growth
Brazil
China
India
Japan
USA Germany
France
2005
8822,24
4781
4,561
12,434
2,7962,13
8
2020
1,870
11,716
2,970
4,978
18,269
3,2392,64
6
2050
4,979
38,010
9,407
6,105
37,748
4,4744,21
6
2008 White Paper Science and Technology
($billion)
3
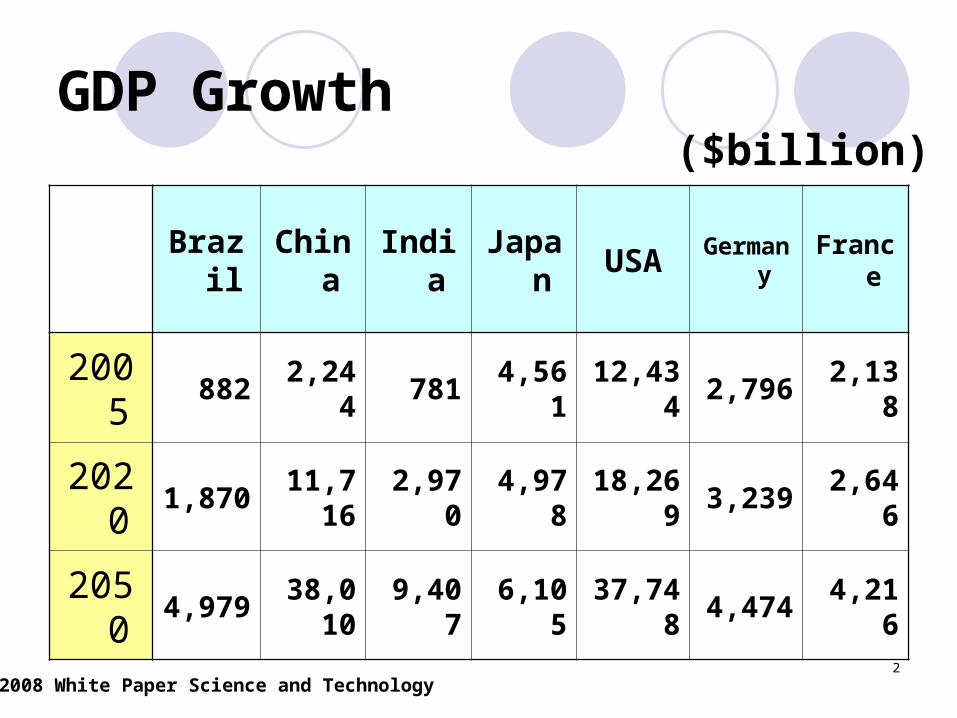
GDP Growth
$ trillion
2008 White Paper Science and Technology
China
USA
India
Japan
4
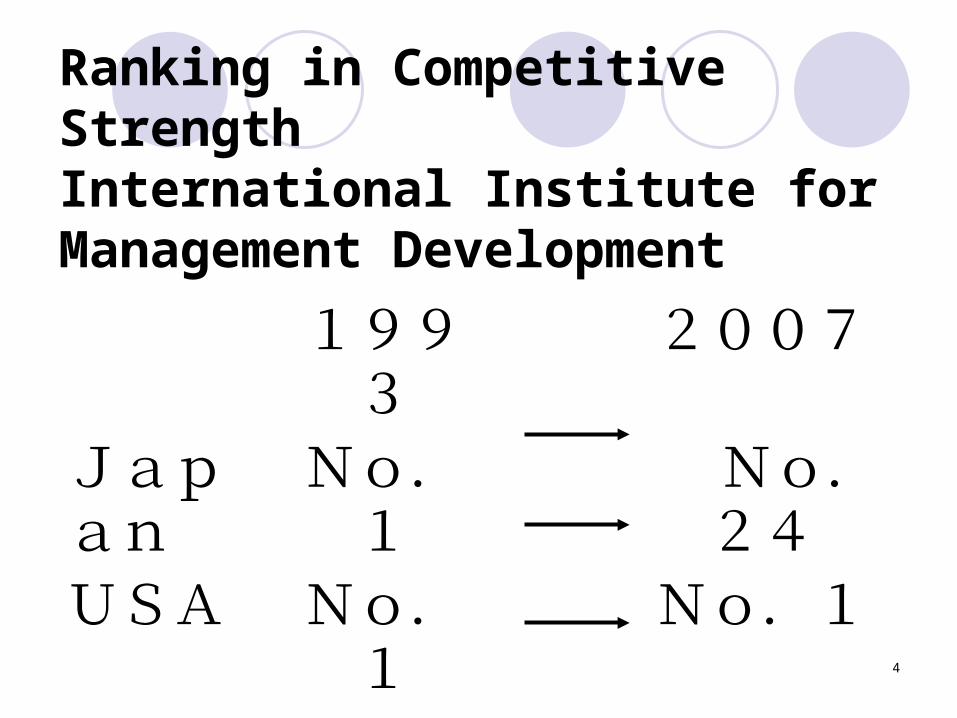
Ranking in Competitive StrengthInternational Institute for Management Development
1993
2007
Japan
No.1
No.24
USA No.1
No.1
China
No.27
No.18
5
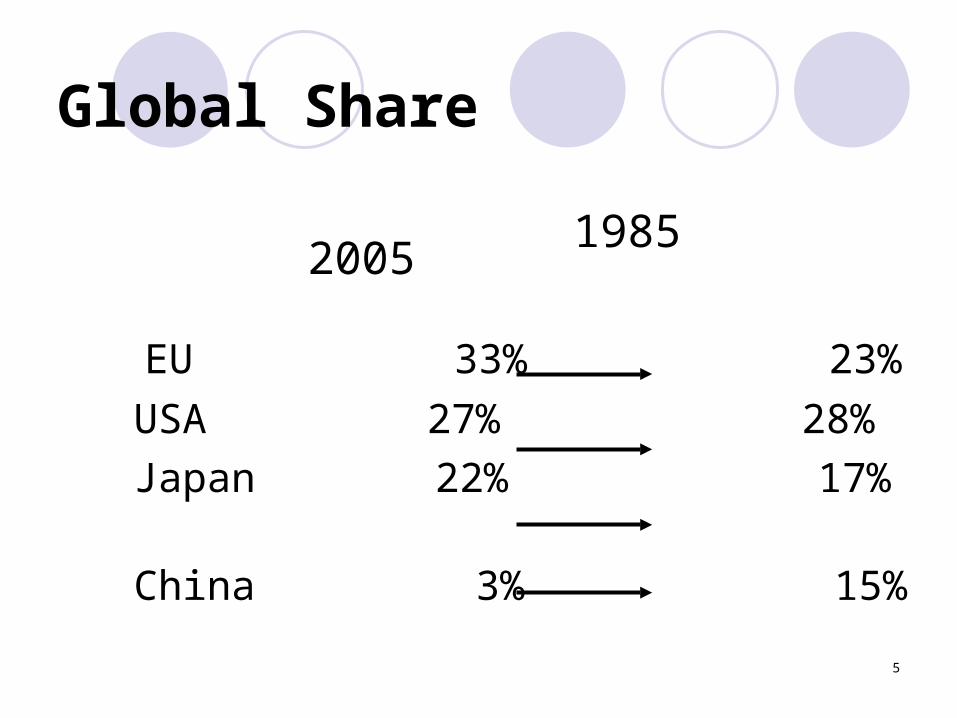
Global Share
1985 2005
EU 33% 23%
USA 27% 28%
Japan 22% 17%
China 3% 15%
6
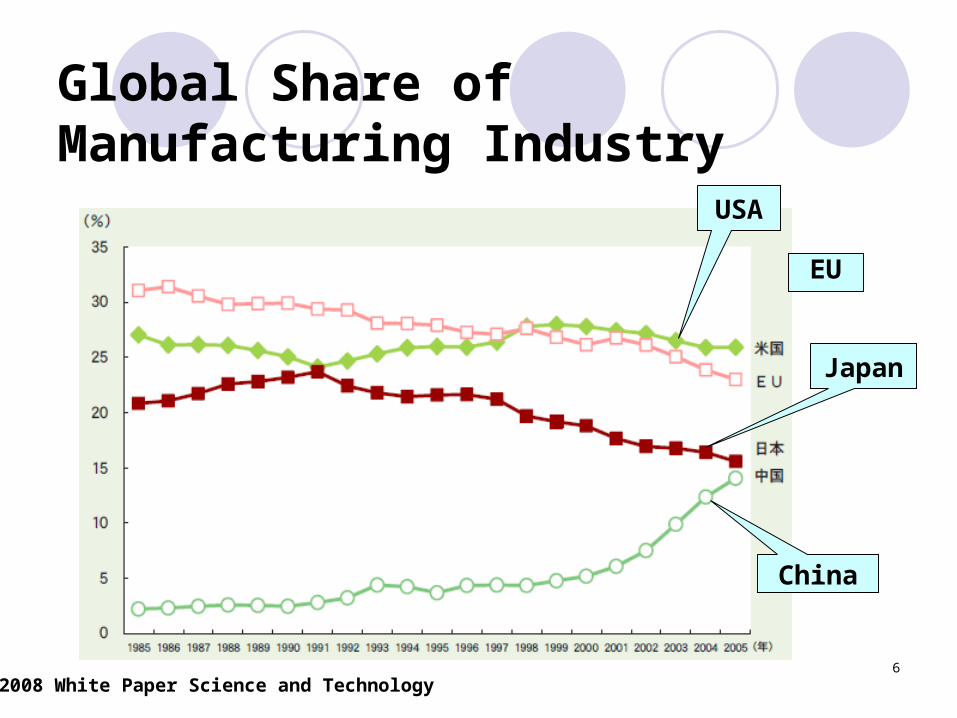
Global Share of Manufacturing Industry
EU
Japan
China
USA
2008 White Paper Science and Technology
7
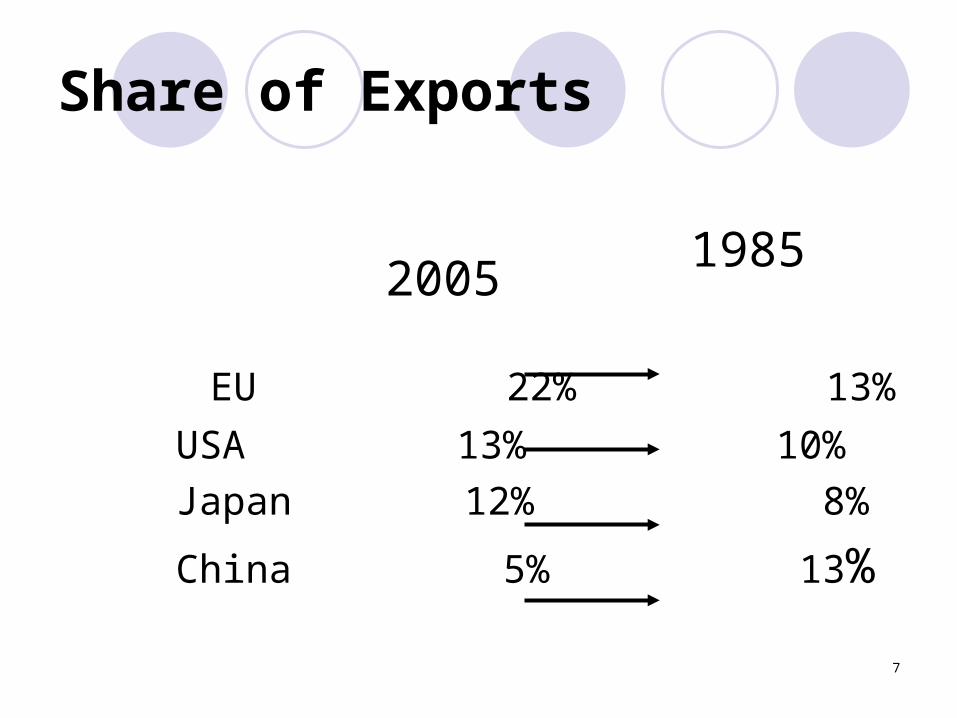
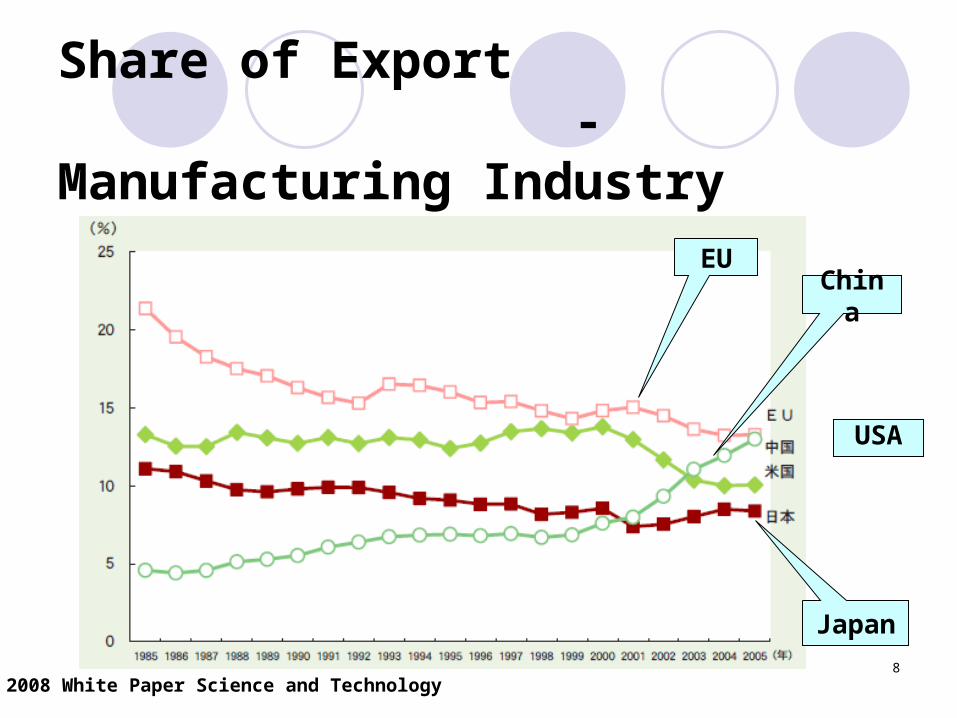
Share of Exports
1985 2005
EU 22% 13%
USA 13% 10%
Japan 12% 8%
China 5% 13%
8
Share of Export - Manufacturing Industry
EU
Japan
China
USA
2008 White Paper Science and Technology
9
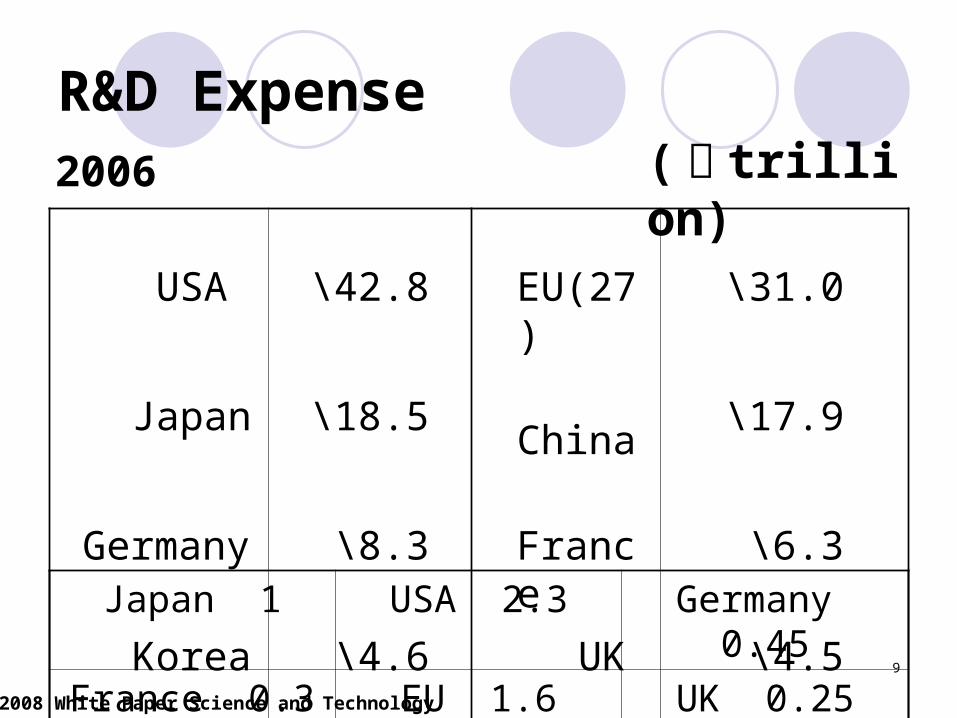
R&D Expense
USA \42.8
EU(27)
\31.0
Japan \18.5
China\17.9
Germany \8.3
France
\6.3
Korea \4.6 UK \4.5 Russia \2.3 India \1.9
Japan 1 USA 2.3 Germany 0.45
France 0.3 EU 1.6 UK 0.25
2006 ( ¥ trillion)
2008 White Paper Science and Technology
10
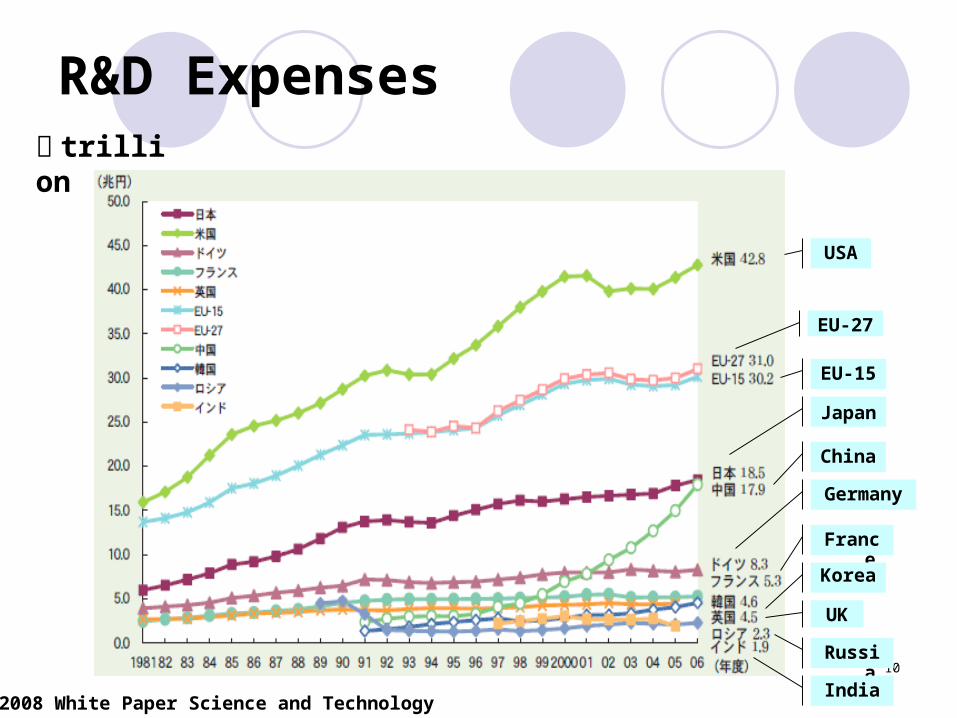
R&D Expenses
USA
EU-27
EU-15
Japan
China
Germany
France
Korea
UK
Russia
India
¥ trillion
2008 White Paper Science and Technology
11
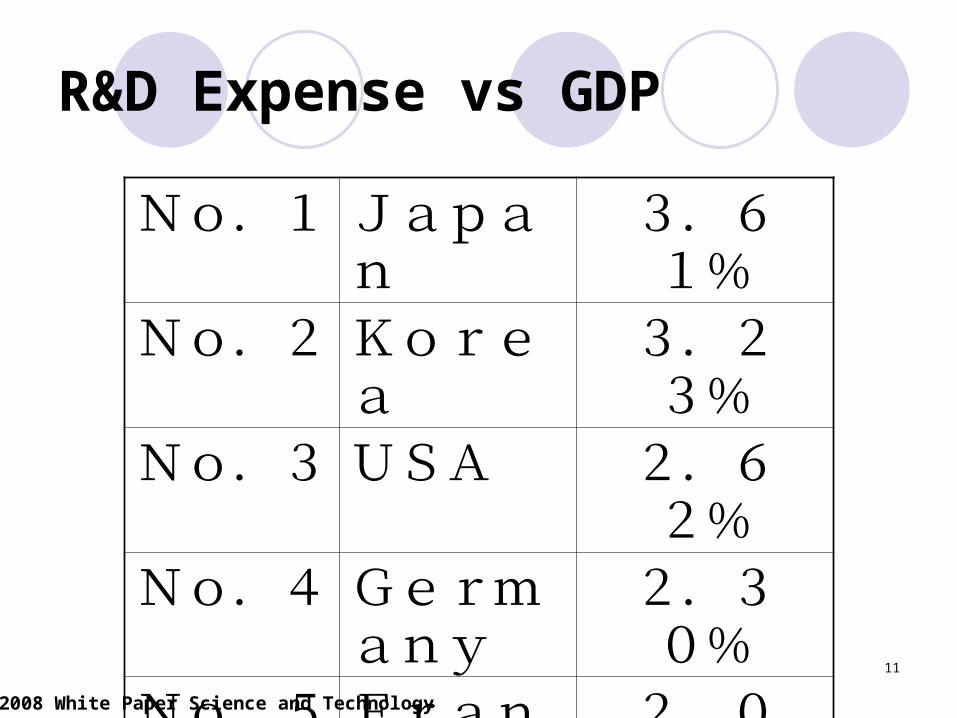
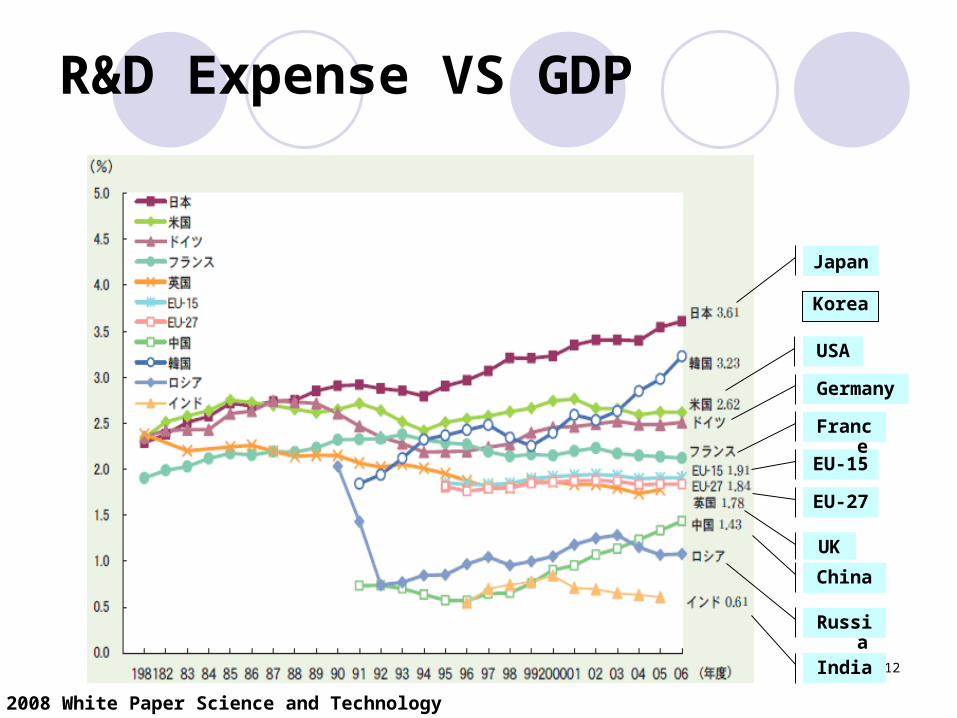
R&D Expense vs GDP
No.1 Japan
3.61%
No.2 Korea
3.23%
No.3 USA 2.62%
No.4 Germany
2.30%
No.5 France
2.00%
No.6 EU(15)
1.91%
No.7 China
1.43%
2008 White Paper Science and Technology
12
R&D Expense VS GDP
Japan
Korea
EU-15
EU-27
UK
China
Russia
India
USA
Germany
France
2008 White Paper Science and Technology
13
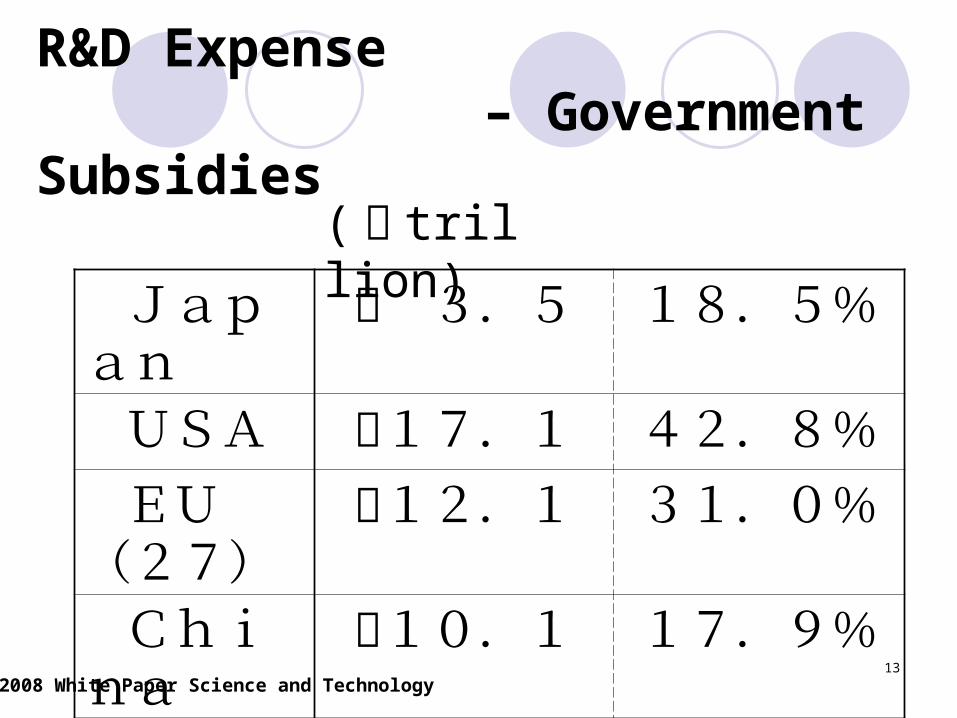
R&D Expense – Government Subsidies
Japan
¥ 3.5 18.5%
USA ¥17.1 42.8% EU(27)
¥12.1 31.0%
China
¥10.1 17.9%
( ¥ trillion)
2008 White Paper Science and Technology
14
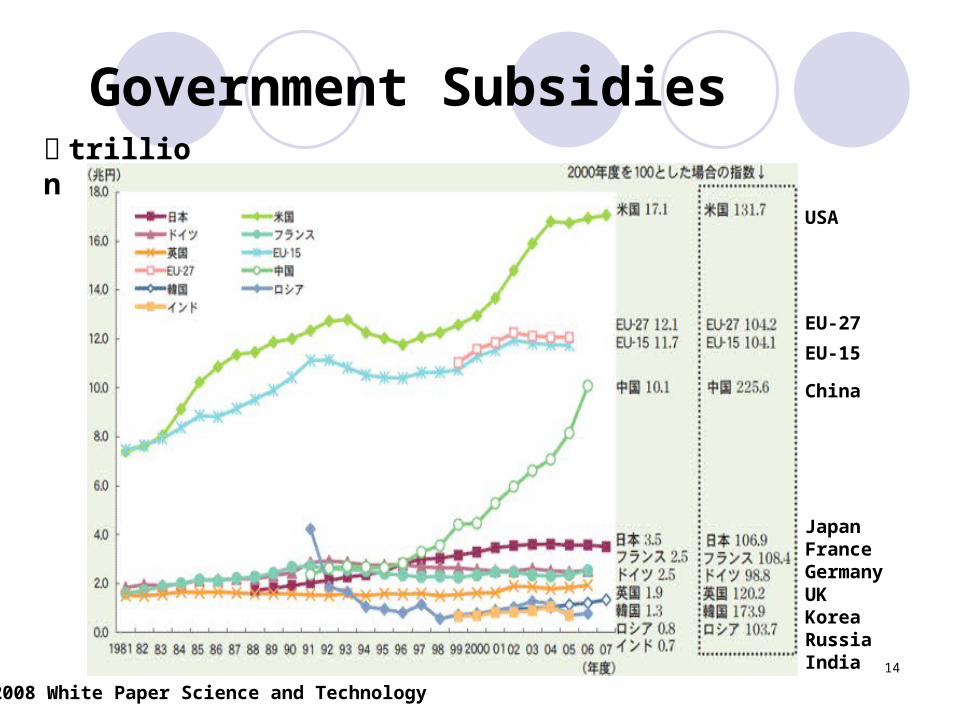
Government Subsidies¥ trillion
USA
EU-27
China
EU-15
FranceJapan
GermanyUKKoreaRussiaIndia
2008 White Paper Science and Technology
15
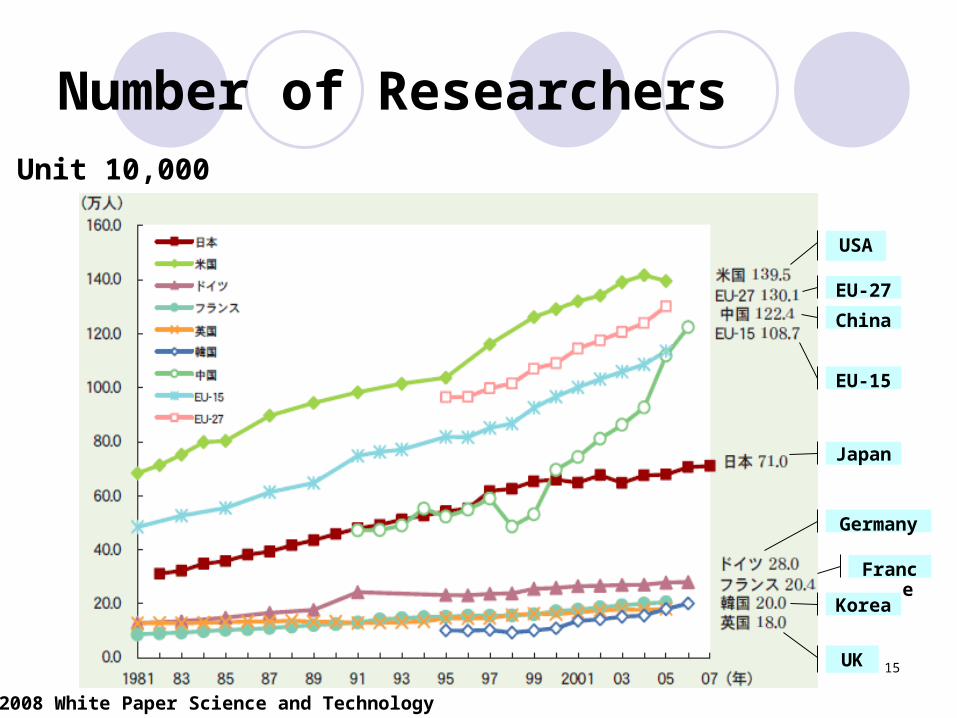
Number of ResearchersUnit 10,000
USA
EU-27
China
EU-15
Japan
Germany
France
Korea
UK
2008 White Paper Science and Technology
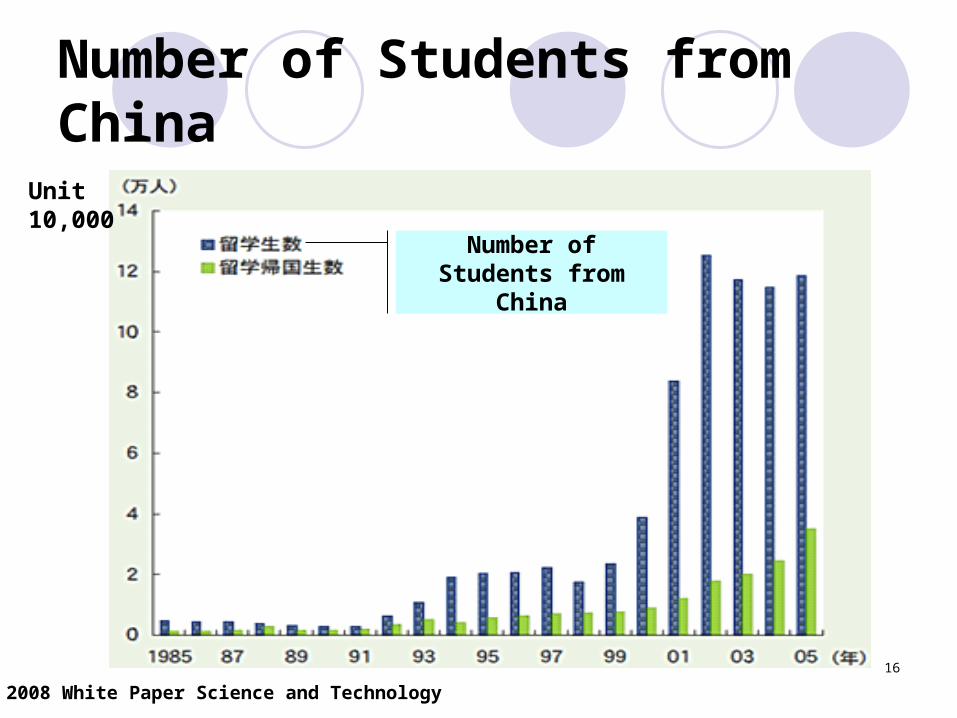
16
Number of Students from China
Unit10,000
Number of Students from China
2008 White Paper Science and Technology
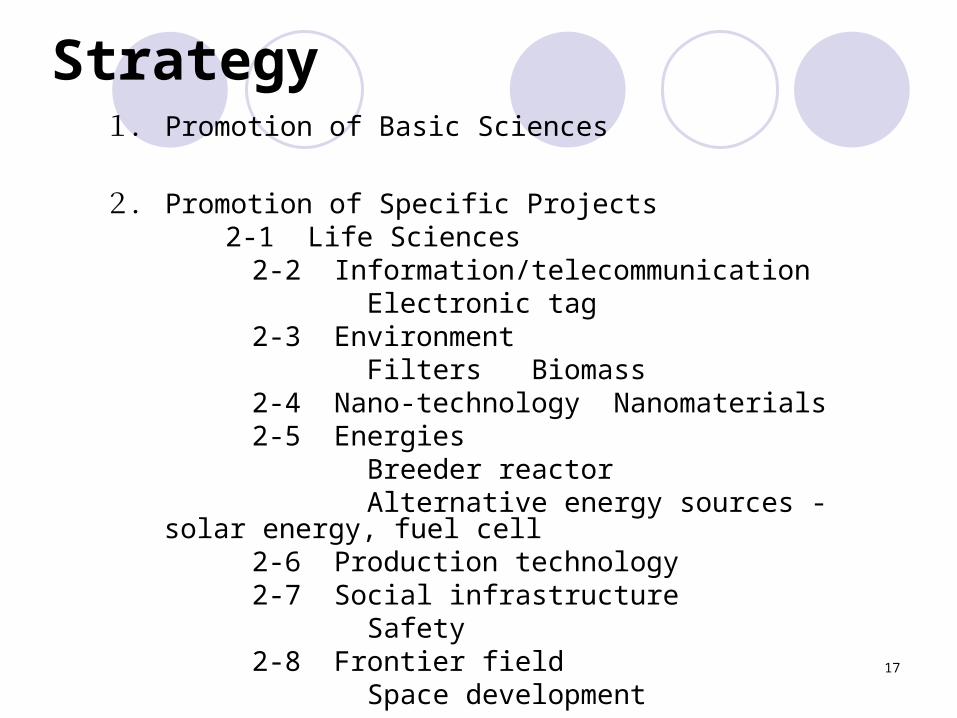
17
Strategy1. Promotion of Basic Sciences
2. Promotion of Specific Projects 2-1 Life Sciences 2-2 Information/telecommunication Electronic tag 2-3 Environment Filters Biomass 2-4 Nano-technology Nanomaterials 2-5 Energies Breeder reactor Alternative energy sources - solar energy, fuel cell 2-6 Production technology 2-7 Social infrastructure Safety 2-8 Frontier field Space development
18
Creation of Innovative Researchers
Cooperative research
Projects among universities,
government research institutions and
industryTechnology Licensing
Organization (TLO) 46 TLOsHigh-tech clusters
19
Features1. Wide coverage From materials industry to assembling industry2. Close cooperation Supplier/customer tie-up3. High-level ability Ability for problem solving4. Multiple skill Skill to cover R&D, design and production5. Royalty Strong royalty feeling to organization
20
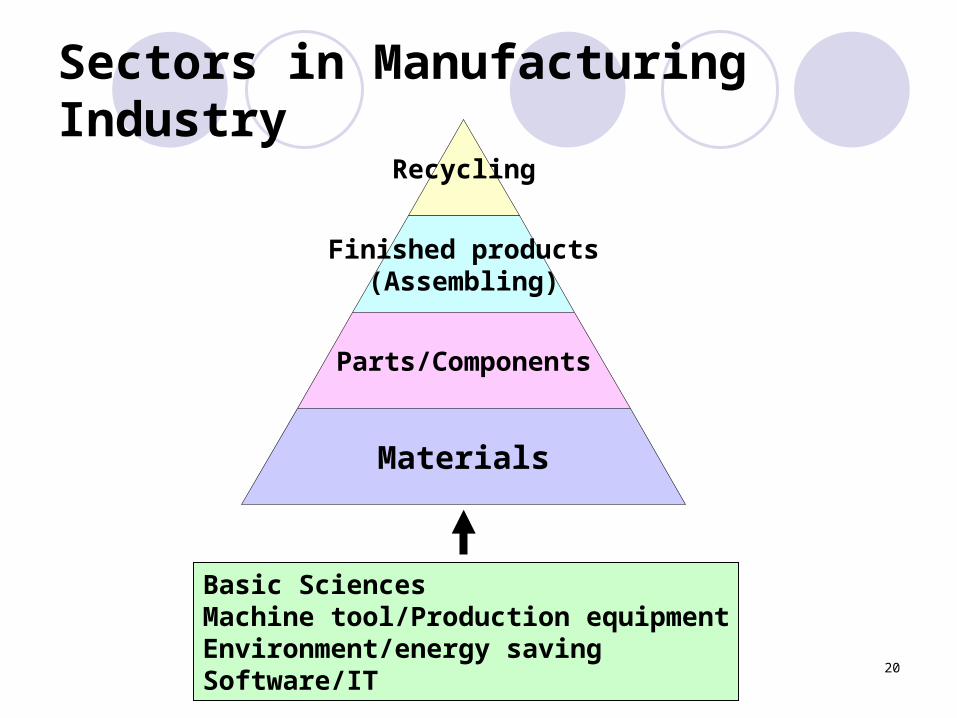
Sectors in Manufacturing Industry
Recycling
Finished products(Assembling)
Parts/Components
Materials
Basic SciencesMachine tool/Production equipmentEnvironment/energy savingSoftware/IT
21
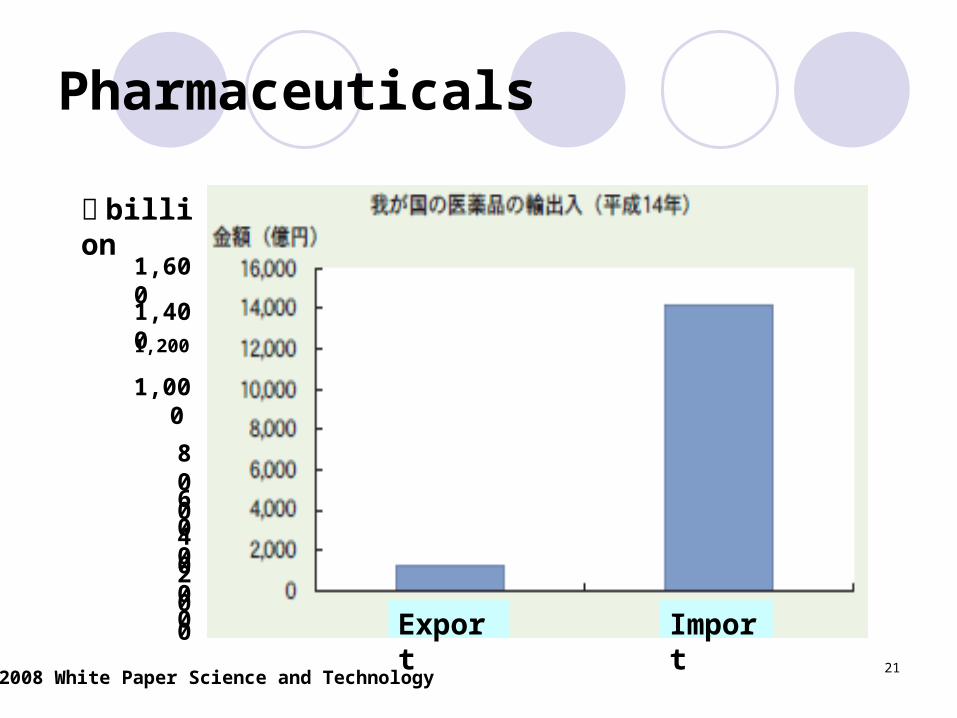
Pharmaceuticals
¥ billion
1,600
1,400
1,200
1,000
800
600
400
200
0
Export Import
2008 White Paper Science and Technology
22
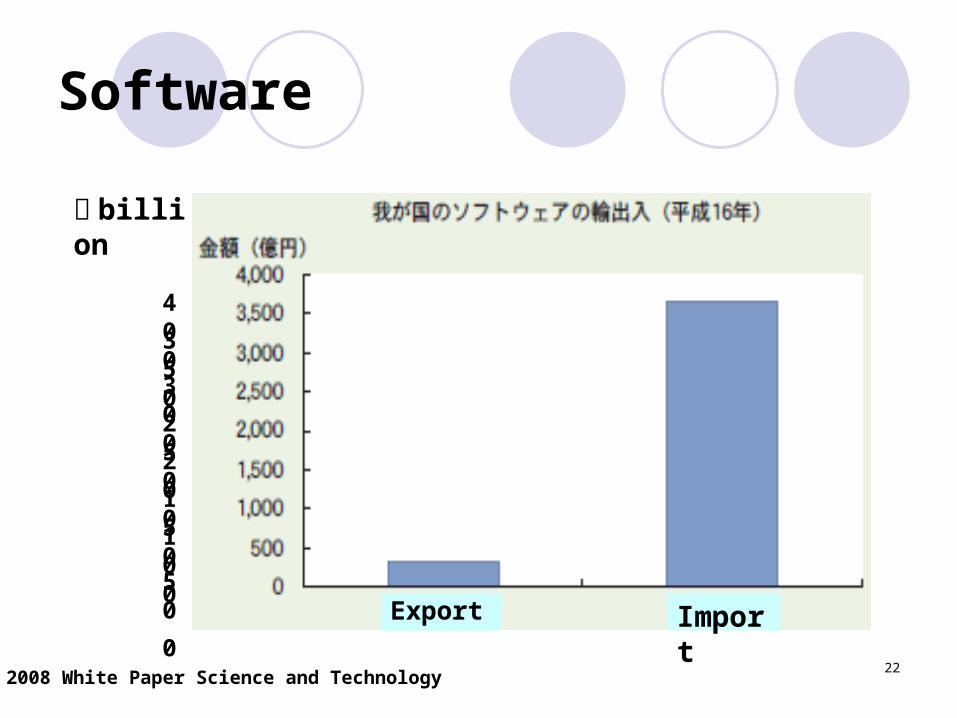
Software
¥ billion
400
350
300
250
200
150
100
50
0Export Import
2008 White Paper Science and Technology
23
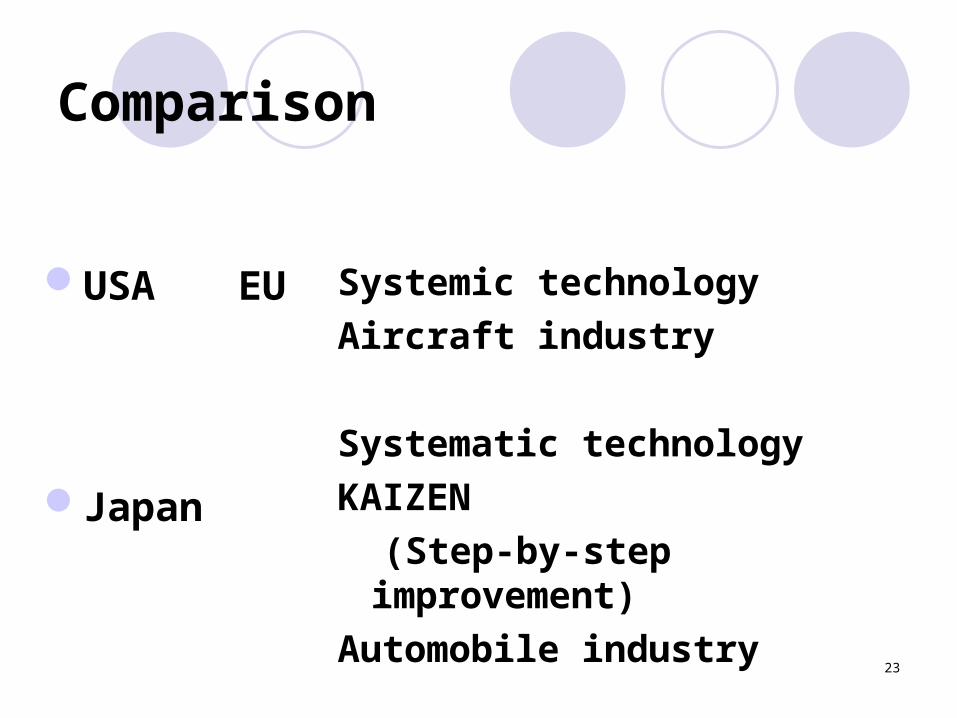
Comparison
USA EU
Japan
Systemic technology
Aircraft industry
Systematic technology
KAIZEN (Step-by-step
improvement)
Automobile industry
24
Japanese Products in Global Market
Materials/Components
Carbon fiberToray Mitsubishi RayonSuper-conductiving cableSumitomo ElectricCarbon nano-tube?
25
Machine Tools/Production Equipment
Solar energy
Semiconductor
Instant noodle
Thin filmULVAC
Ion beamSII NanoTech
AutomationFuji Mfg
26
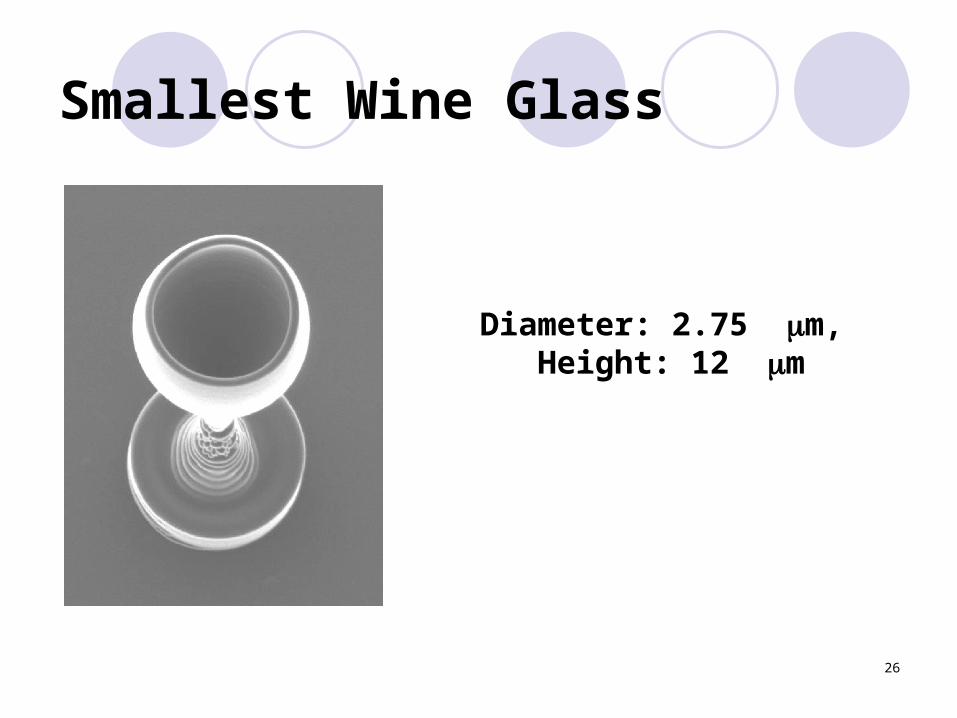
Smallest Wine Glass
Diameter: 2.75 m, Height: 12 m
27
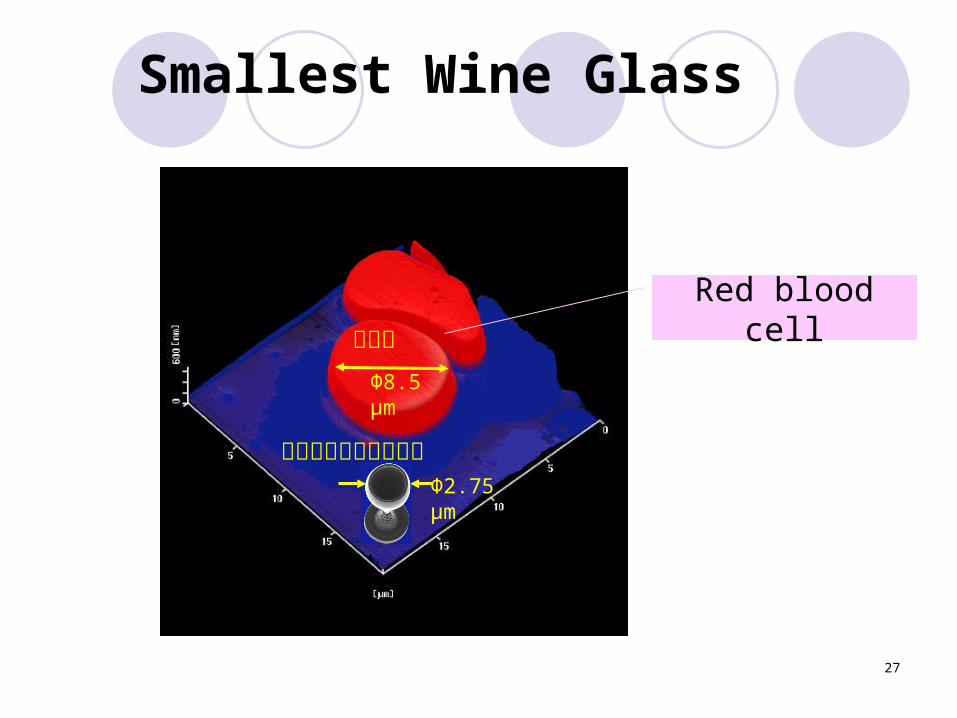
Smallest Wine Glass
赤血球
Φ8.5μm
Φ2.75μm
世界最小ワイングラス
Red blood cell
28
Customer/Manufacturers Cooperation
Damaged automobile main shaftManufacturer of shaftSteel manufacturerX-ray analysis – broken shaftSII NanoTechnology
29
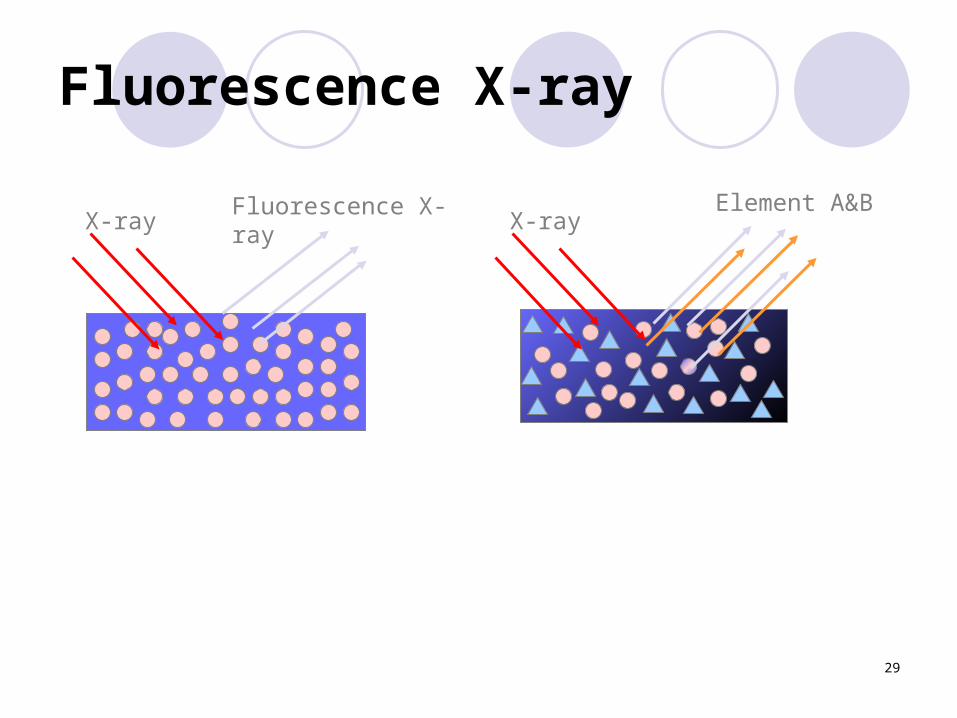
Fluorescence X-ray
X-ray X-rayFluorescence X-ray Element A&B
30
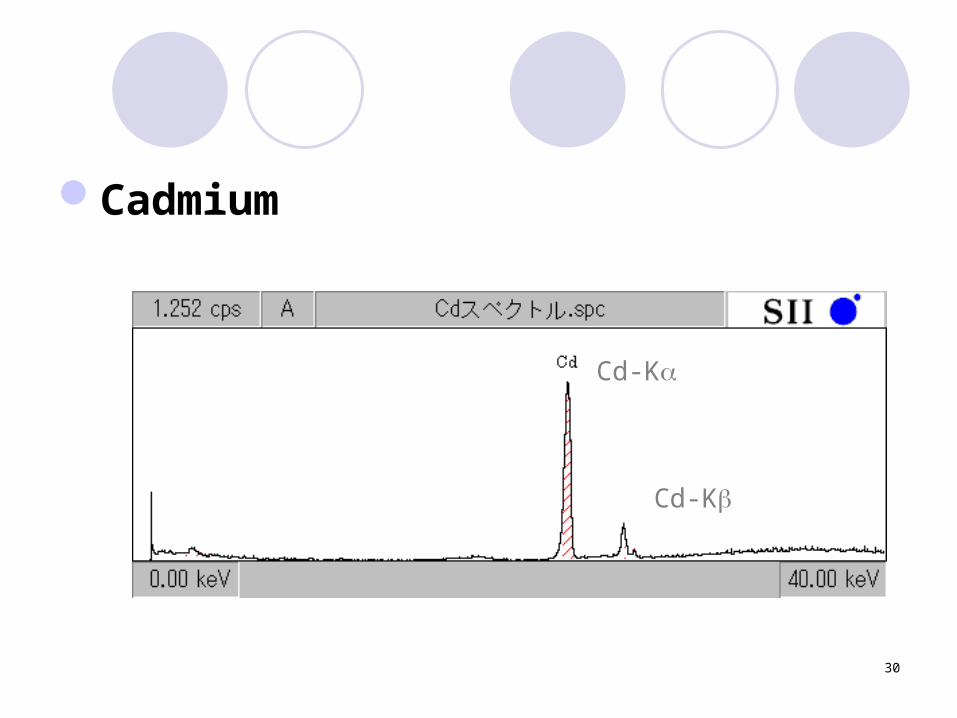
Cadmium
Cd-K
Cd-K
31
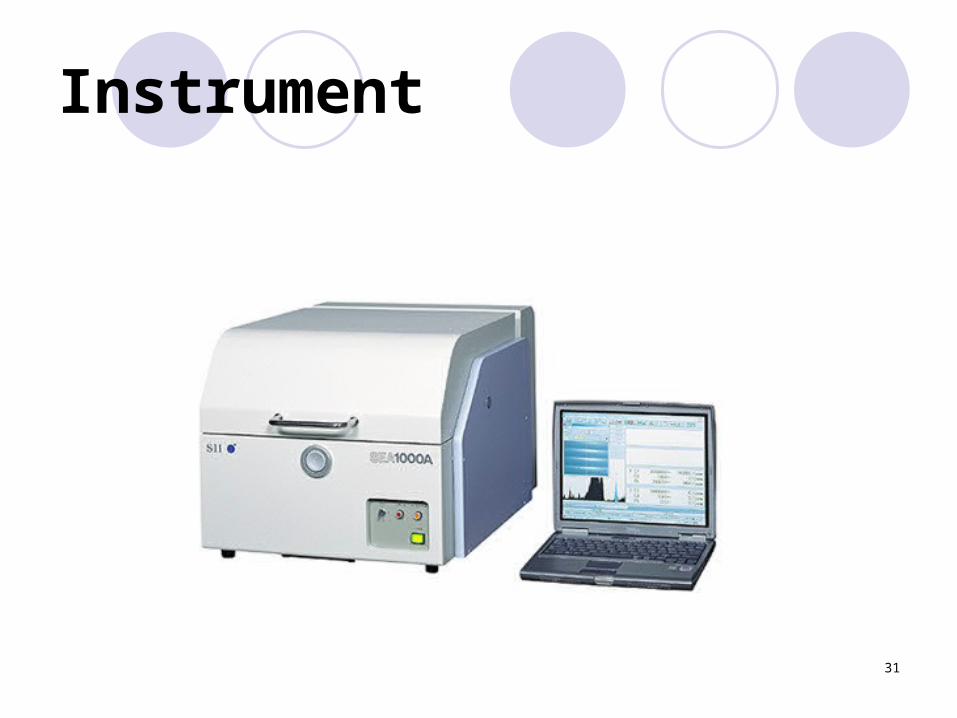
Instrument
32
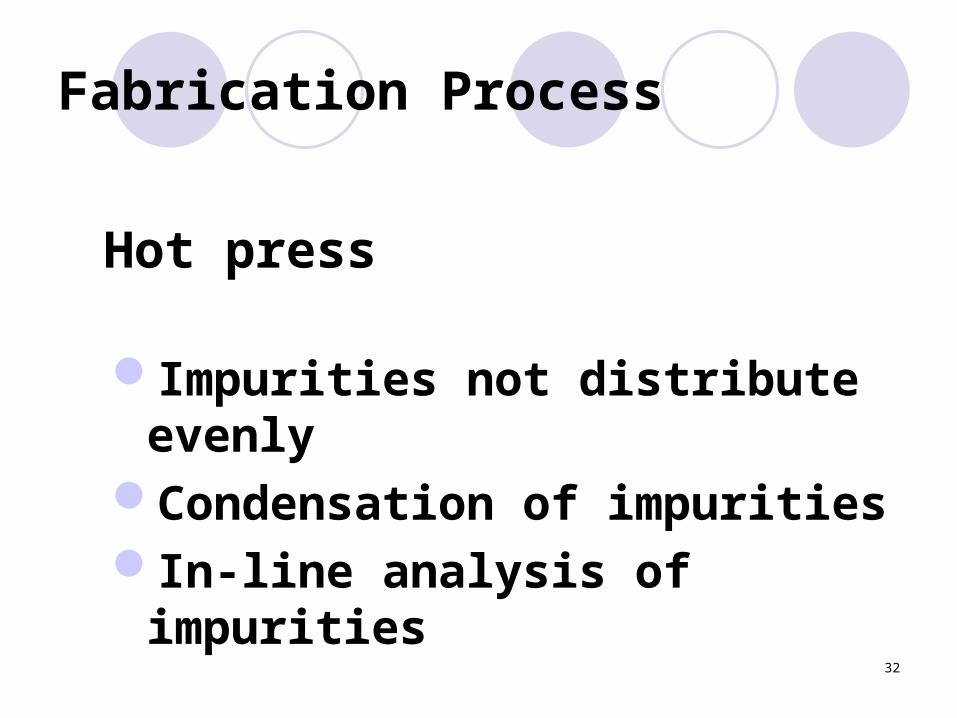
Fabrication Process
Hot press
Impurities not distribute evenlyCondensation of impuritiesIn-line analysis of impurities
33
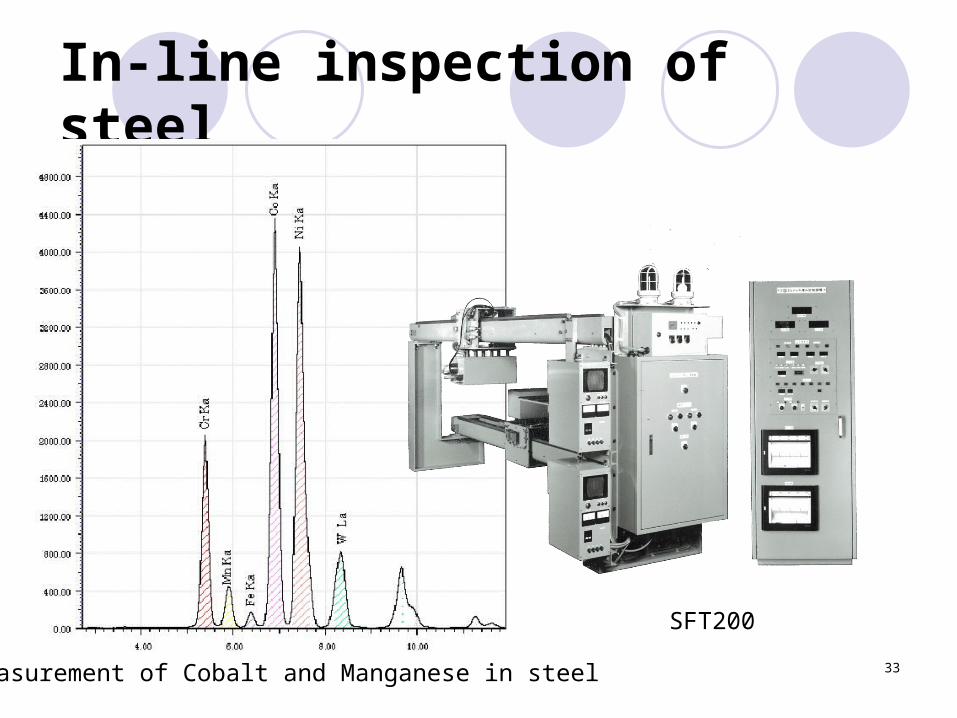
In-line inspection of steel
SFT200
Measurement of Cobalt and Manganese in steel
34
Trumpet
Vienna PhilharmonicMild/soft soundBrass-Copper/Zinc alloyIron, manganese, etc
35
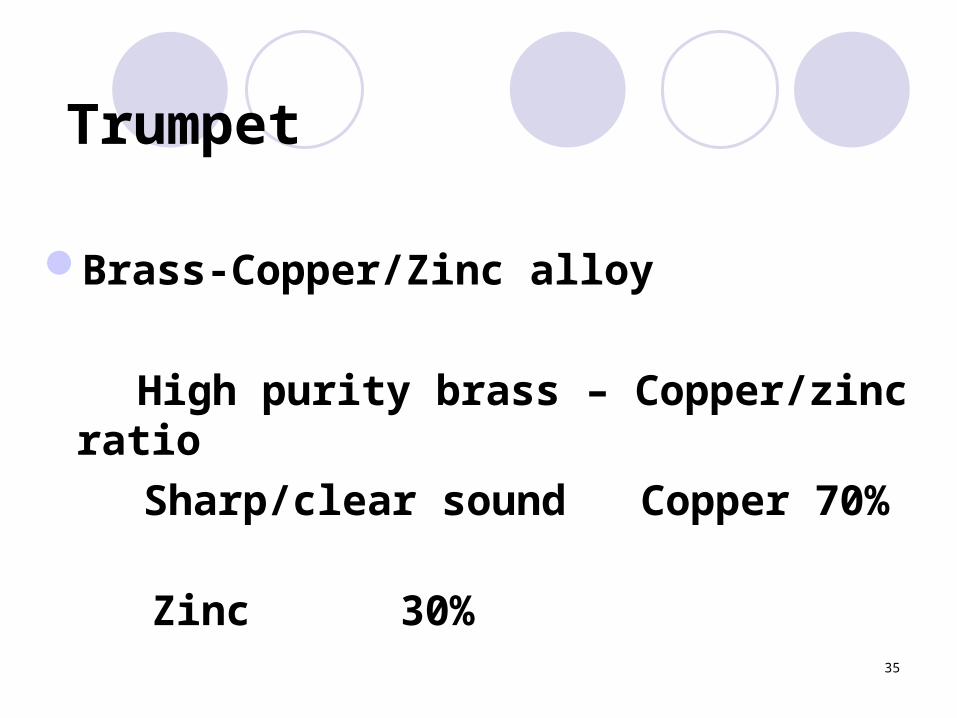
Trumpet
Brass-Copper/Zinc alloy
High purity brass – Copper/zinc ratio
Sharp/clear sound Copper 70%
Zinc 30%

36
Verdi Aida
Karajan – Vienna Philharmonic R. Tebaldi 1959 Traditional trumpet
M. Freni 1979 High-purity brass Yamaha trumpet
37
Art Products
Paintings
Antique
Chemical composition
of pigment
Element analysis
Age determination
38
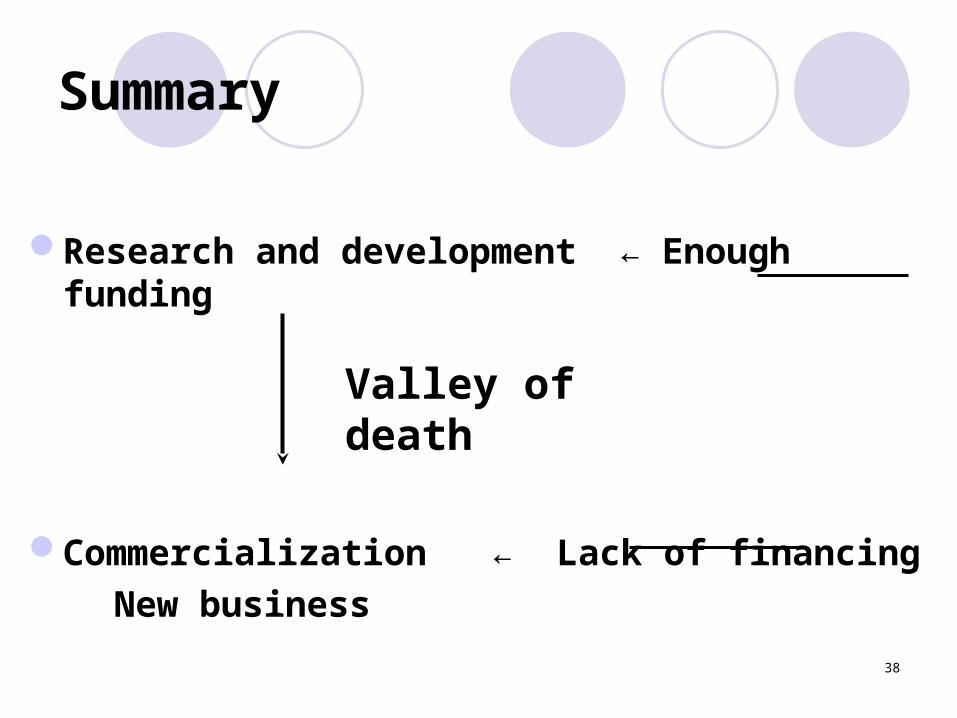
Summary
Research and development ← Enough funding
Commercialization ← Lack of financing
New business
Valley of death