Embed Size (px)
Citation preview
ContentsEndowment Summary ... 1
Purpose and Use of the Endowment ... 2
A $100 Million Investment in Dartmouth’s Future ... 3
Fiscal Year 2014 and Long-Term Performance ... 4
Asset Allocation and Asset Class Performance ... 5
About the Dartmouth College Investment Office ... 6
Dartmouth Endowment Report 20141
1 Commencing in Fiscal Year 2014, Dartmouth extended its accounting close deadline in response to industry-wide improvements in the timeliness of receipt of valuations from private investment managers. This change allows Dartmouth to improve the accuracy of reporting estimated values at fiscal year-end. During this year of transition, a one-time previously unreported gain of $60 million from June 30, 2013, is included in the $778 million of net investment gain. The 19.2% investment return excludes the $60 million in order to best reflect performance attributable to the July 1, 2013–June 30, 2014, time period. Including the $60 million gain, Dartmouth’s actual investment return for Fiscal Year 2014 was 21.0%, reflecting the growth of the Endowment value since last reported on June 30, 2013; 21.0% is the official FY14 return included in long-term Endowment return averages.
Endowment Summary
We are pleased to report that the Endowment portfolio earned an investment return of 19.2% for the fiscal year ending June 30, 20141
0%
1%
2%
3%
4%
5%
6%
7%
8%
9%
10%
0% 2% 4% 6% 8% 10% 12% 14% 16% 18%
Standard Deviation
Ann
ualiz
ed R
etur
n
DartmouthEndowment
Barclays AggregateBond Index
MSCI ACWIEquity Index60% MSCI ACWI
40% Barclays Agg.
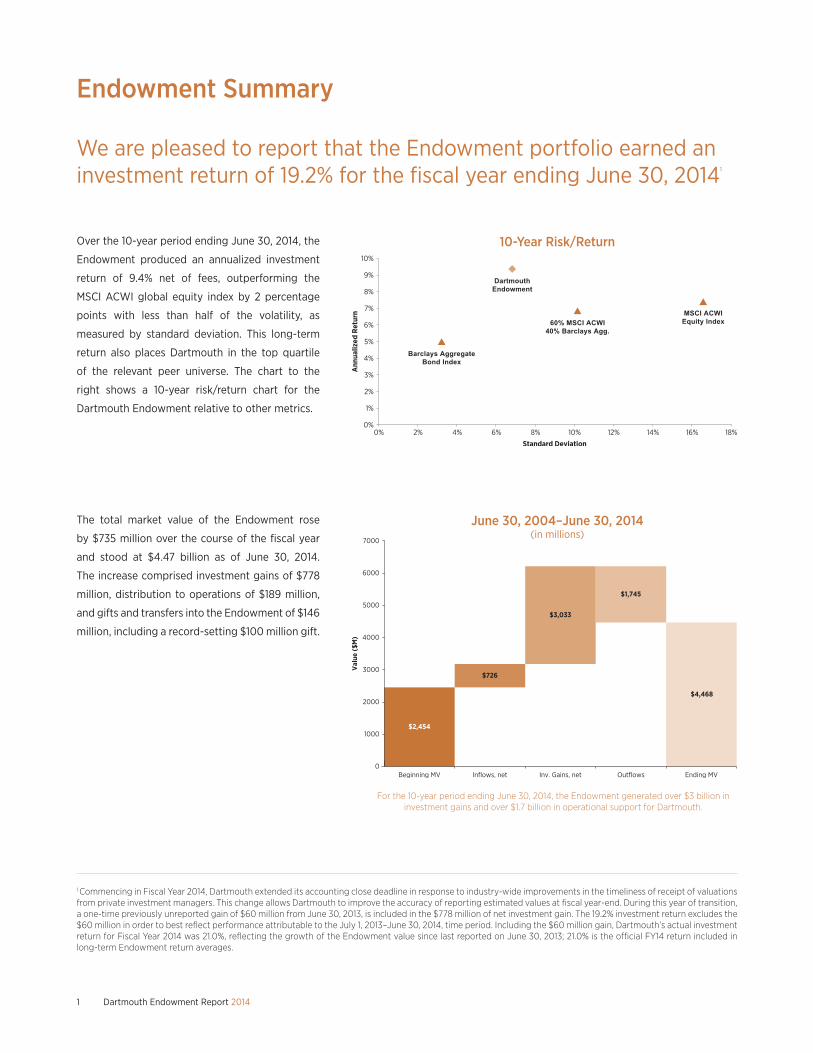
Over the 10-year period ending June 30, 2014, the
Endowment produced an annualized investment
return of 9.4% net of fees, outperforming the
MSCI ACWI global equity index by 2 percentage
points with less than half of the volatility, as
measured by standard deviation. This long-term
return also places Dartmouth in the top quartile
of the relevant peer universe. The chart to the
right shows a 10-year risk/return chart for the
Dartmouth Endowment relative to other metrics.
10-Year Risk/Return
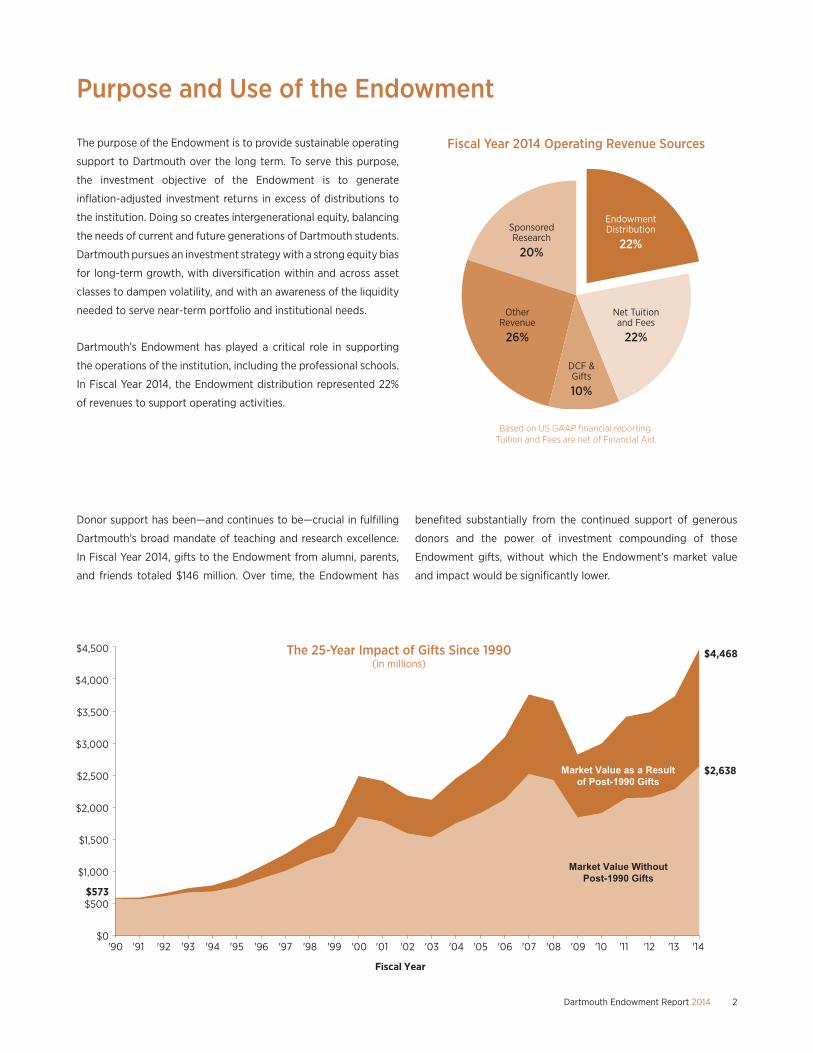
The total market value of the Endowment rose
by $735 million over the course of the fiscal year
and stood at $4.47 billion as of June 30, 2014.
The increase comprised investment gains of $778
million, distribution to operations of $189 million,
and gifts and transfers into the Endowment of $146
million, including a record-setting $100 million gift.
For the 10-year period ending June 30, 2014, the Endowment generated over $3 billion in investment gains and over $1.7 billion in operational support for Dartmouth.
June 30, 2004–June 30, 2014 (in millions)
Val
ue ($
M)
$1,745
Outflows
$3,033
Inv. Gains, net
$726
Inflows, net
$2,454
Beginning MV
$4,468
Ending MV0
1000
2000
3000
4000
5000
6000
7000
2Dartmouth Endowment Report 2014
Purpose and Use of the Endowment
The purpose of the Endowment is to provide sustainable operating
support to Dartmouth over the long term. To serve this purpose,
the investment objective of the Endowment is to generate
inflation-adjusted investment returns in excess of distributions to
the institution. Doing so creates intergenerational equity, balancing
the needs of current and future generations of Dartmouth students.
Dartmouth pursues an investment strategy with a strong equity bias
for long-term growth, with diversification within and across asset
classes to dampen volatility, and with an awareness of the liquidity
needed to serve near-term portfolio and institutional needs.
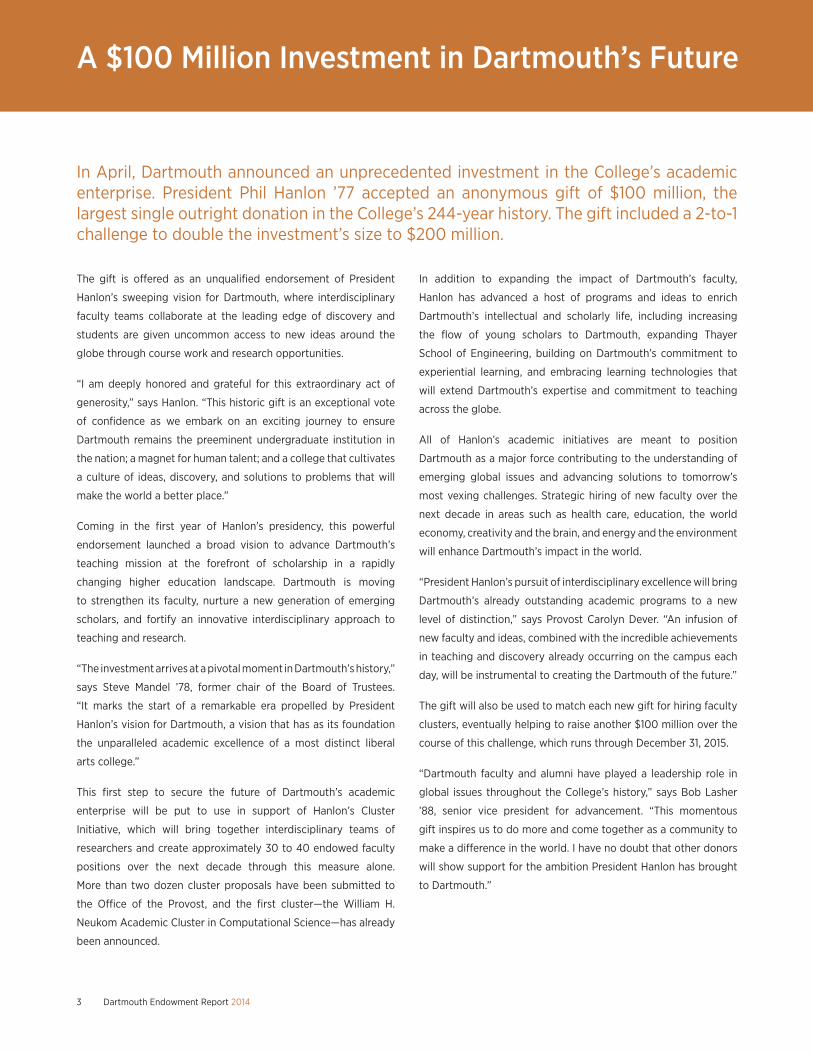
Dartmouth’s Endowment has played a critical role in supporting
the operations of the institution, including the professional schools.
In Fiscal Year 2014, the Endowment distribution represented 22%
of revenues to support operating activities.
Fiscal Year 2014 Operating Revenue Sources
Donor support has been—and continues to be—crucial in fulfilling
Dartmouth’s broad mandate of teaching and research excellence.
In Fiscal Year 2014, gifts to the Endowment from alumni, parents,
and friends totaled $146 million. Over time, the Endowment has
benefited substantially from the continued support of generous
donors and the power of investment compounding of those
Endowment gifts, without which the Endowment’s market value
and impact would be significantly lower.
Based on US GAAP financial reporting.Tuition and Fees are net of Financial Aid.
EndowmentDistribution
22%
OtherRevenue
26%
Net Tuitionand Fees
22%
SponsoredResearch
20%
DCF &Gifts
10%
$0
$500
$1,000
$1,500
$2,000
$2,500
$3,000
$3,500
$4,000
$4,500
'90 '91 '92 '93 '94 '95 '96 '97 '98 '99 '00 '01 '02 '03 '04 '05 '06 '07 '08 '09 '10 '11 '12 '13 '14
$573
Fiscal Year
$4,468
$2,638Market Value as a Resultof Post-1990 Gifts
Market Value WithoutPost-1990 Gifts
The 25-Year Impact of Gifts Since 1990 (in millions)
Dartmouth Endowment Report 20143
In April, Dartmouth announced an unprecedented investment in the College’s academic enterprise. President Phil Hanlon ’77 accepted an anonymous gift of $100 million, the largest single outright donation in the College’s 244-year history. The gift included a 2-to-1 challenge to double the investment’s size to $200 million.
The gift is offered as an unqualified endorsement of President
Hanlon’s sweeping vision for Dartmouth, where interdisciplinary
faculty teams collaborate at the leading edge of discovery and
students are given uncommon access to new ideas around the
globe through course work and research opportunities.
“I am deeply honored and grateful for this extraordinary act of
generosity,” says Hanlon. “This historic gift is an exceptional vote
of confidence as we embark on an exciting journey to ensure
Dartmouth remains the preeminent undergraduate institution in
the nation; a magnet for human talent; and a college that cultivates
a culture of ideas, discovery, and solutions to problems that will
make the world a better place.”
Coming in the first year of Hanlon’s presidency, this powerful
endorsement launched a broad vision to advance Dartmouth’s
teaching mission at the forefront of scholarship in a rapidly
changing higher education landscape. Dartmouth is moving
to strengthen its faculty, nurture a new generation of emerging
scholars, and fortify an innovative interdisciplinary approach to
teaching and research.
“The investment arrives at a pivotal moment in Dartmouth’s history,”
says Steve Mandel ’78, former chair of the Board of Trustees.
“It marks the start of a remarkable era propelled by President
Hanlon’s vision for Dartmouth, a vision that has as its foundation
the unparalleled academic excellence of a most distinct liberal
arts college.”
This first step to secure the future of Dartmouth’s academic
enterprise will be put to use in support of Hanlon’s Cluster
Initiative, which will bring together interdisciplinary teams of
researchers and create approximately 30 to 40 endowed faculty
positions over the next decade through this measure alone.
More than two dozen cluster proposals have been submitted to
the Office of the Provost, and the first cluster—the William H.
Neukom Academic Cluster in Computational Science—has already
been announced.
In addition to expanding the impact of Dartmouth’s faculty,
Hanlon has advanced a host of programs and ideas to enrich
Dartmouth’s intellectual and scholarly life, including increasing
the flow of young scholars to Dartmouth, expanding Thayer
School of Engineering, building on Dartmouth’s commitment to
experiential learning, and embracing learning technologies that
will extend Dartmouth’s expertise and commitment to teaching
across the globe.
All of Hanlon’s academic initiatives are meant to position
Dartmouth as a major force contributing to the understanding of
emerging global issues and advancing solutions to tomorrow’s
most vexing challenges. Strategic hiring of new faculty over the
next decade in areas such as health care, education, the world
economy, creativity and the brain, and energy and the environment
will enhance Dartmouth’s impact in the world.
“President Hanlon’s pursuit of interdisciplinary excellence will bring
Dartmouth’s already outstanding academic programs to a new
level of distinction,” says Provost Carolyn Dever. “An infusion of
new faculty and ideas, combined with the incredible achievements
in teaching and discovery already occurring on the campus each
day, will be instrumental to creating the Dartmouth of the future.”
The gift will also be used to match each new gift for hiring faculty
clusters, eventually helping to raise another $100 million over the
course of this challenge, which runs through December 31, 2015.
“Dartmouth faculty and alumni have played a leadership role in
global issues throughout the College’s history,” says Bob Lasher
’88, senior vice president for advancement. “This momentous
gift inspires us to do more and come together as a community to
make a difference in the world. I have no doubt that other donors
will show support for the ambition President Hanlon has brought
to Dartmouth.”
A $100 Million Investment in Dartmouth’s Future
Dartmouth Endowment Report 20144
Fiscal Year 2014 and Long-Term Performance
Global developed equity markets continued to climb in Fiscal Year
2014, with equities in many developed-market countries reaching
new highs and volatility dropping to pre-crisis levels. The S&P
500 returned 24.6% for the fiscal year, while emerging markets
lagged with the MSCI Emerging Markets Index-Net returning
14.3% for the same time period. Bonds trailed equity markets, with
U.S. Investment Grade Bonds generating 4.4% for the 12 months
ending June 30, 2014.
In Fiscal Year 2014, the Endowment returned 19.2%1, outperforming
a simple equity/fixed income benchmark and the median
institution in both the TUCS Foundations and Endowments
Universe and the Cambridge Associates (CA) College & University
universe. Given the perpetual time horizon of the Endowment, the
Investment Office is focused on sustained outperformance over
long periods of time. For the 10- and 15-year periods ending June
30, 2014, the annual compound rates of return were 9.4% and
9.8%, respectively, comparing favorably to the benchmarks below.
Over the long term, the Endowment has succeeded in its primary
objective of generating inflation-adjusted investment returns in
excess of the distribution rate.
Fiscal Year Annualized Return (as of 6/30/2014)
1 Yr. 3 Yr. 5 Yr. 10 Yr. 15 Yr.
Dartmouth College 19.2% 12.7% 13.3% 9.4% 9.8%
60% MSCI ACWI/40% Barclays Aggregate 15.3% 7.9% 10.7% 6.8% 5.3%
CA Colleges & Universities Median 16.1% 8.9% 11.8% 7.5% 6.6%
TUCS Foundations & Endowments Median 15.8% 9.1% 11.7% 7.2% 6.4%
As indicated in the chart below, the market value of the Endowment
has recovered from losses sustained in 2008–2009 and as of June
30, 2014, stood at an all-time high of $4.47 billion.
Endowment Overview 2014 2013 2012 2011 2010 2009 2008
Market Value ($M) $4,468.2 $3,733.6 $3,486.4 $3,413.4 $2,998.3 $2,824.9 $3,660.2
Investment Return 19.2% 12.1% 5.8% 18.4% 10.0% -19.6% 0.6%
Endowment Distribution ($M) $188.5 $185.5 $182.9 $174.9 $204.5 $229.6 $163.1
Endowment Distribution (% of Beg MV) 5.0% 5.3% 5.4% 5.8% 7.2% 6.3% 4.3%
1 See footnote on page 1.
5Dartmouth Endowment Report 2014
Capital Allocation
Ranges
6/30/14 Allocation
6/30/13 Allocation
FY14 Return
Asset Class Objective
Global Equity 25%-45% 31.3% 28.0% 22.1% Seek to outperform broad global market indices.
Marketable Alternative Equity
20-35% 24.0% 22.5% 11.2% Generate equity-like returns with reduced volatility.
Venture Capital & Private Equity
10-20% 22.4% 23.1% 26.1% Enhanced return relative to public markets through investments in private companies.
Natural Resources 5-15% 5.8% 6.2% 37.5% Generate returns that exceed equity markets. Provide level of protection during periods of unanticipated inflation.
Real Estate 0-10% 8.3% 10.2% 24.5% Generate returns that exceed equity markets. Provide level of protection during periods of unanticipated inflation.
Fixed Income & Cash/Hedging Assets
3-12.5% 8.2% 10.0% 1.6% Provide liquid, reliable, and transparent source of capital for investment needs, distribution to operations, and rebalancing during times of equity market stress in general and economic contraction in particular.
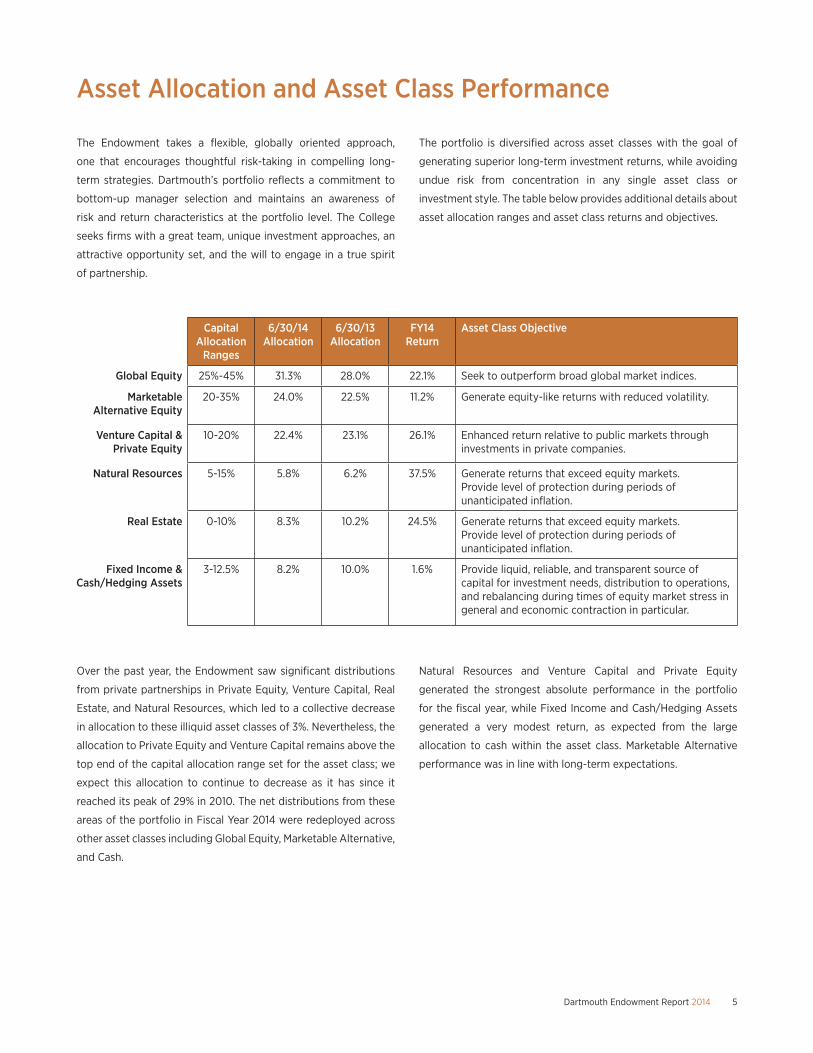
Asset Allocation and Asset Class Performance
The Endowment takes a flexible, globally oriented approach,
one that encourages thoughtful risk-taking in compelling long-
term strategies. Dartmouth’s portfolio reflects a commitment to
bottom-up manager selection and maintains an awareness of
risk and return characteristics at the portfolio level. The College
seeks firms with a great team, unique investment approaches, an
attractive opportunity set, and the will to engage in a true spirit
of partnership.
The portfolio is diversified across asset classes with the goal of
generating superior long-term investment returns, while avoiding
undue risk from concentration in any single asset class or
investment style. The table below provides additional details about
asset allocation ranges and asset class returns and objectives.
Over the past year, the Endowment saw significant distributions
from private partnerships in Private Equity, Venture Capital, Real
Estate, and Natural Resources, which led to a collective decrease
in allocation to these illiquid asset classes of 3%. Nevertheless, the
allocation to Private Equity and Venture Capital remains above the
top end of the capital allocation range set for the asset class; we
expect this allocation to continue to decrease as it has since it
reached its peak of 29% in 2010. The net distributions from these
areas of the portfolio in Fiscal Year 2014 were redeployed across
other asset classes including Global Equity, Marketable Alternative,
and Cash.
Natural Resources and Venture Capital and Private Equity
generated the strongest absolute performance in the portfolio
for the fiscal year, while Fixed Income and Cash/Hedging Assets
generated a very modest return, as expected from the large
allocation to cash within the asset class. Marketable Alternative
performance was in line with long-term expectations.
6Dartmouth Endowment Report 2014
About the Dartmouth College Investment Office
The Dartmouth College Investment Office, under the direction
of the Board of Trustees’ Investment Committee, manages
the Endowment as well as other non-Endowment investment
portfolios of Dartmouth. The Endowment provides financial
support to all of Dartmouth, including Arts and Sciences, the
Geisel School of Medicine, Thayer School of Engineering, and the
Tuck School of Business.
The Investment Office makes recommendations to the Investment
Committee on investment policies, strategies, and investments,
and monitors the portfolio and its external managers day to day.
The Investment Committee is chaired by Richard Kimball ’78,
and is composed of Trustees and non-Trustees with significant
experience in the investment industry. The Committee consists of
11 individuals and meets quarterly, at a minimum, to discuss and
review asset allocation policies, investment performance, and
current strategies proposed by the Investment Office staff.
Investment CommitteeRichard H. Kimball ’78, Chair
Steven R. Berger TU ’87
Collette K. Chilton TU ’86
Alan S. Forman ’87
Philip J. Hanlon ’77, ex officio
William W. Helman IV ’80
David C. Hodgson ’78
Stephen F. Mandel, Jr. ’78, ex officio
Susan B. Meaney TU ’86
Steven Roth ’62, TU ’63
Alice Ruth ’83
Investment Office StaffPamela L. Peedin ’89, TU ’98 Chief Investment Officer
Kelsey M. Morgan ’02, TU ’08 Managing Director–Hedged & Marketable Strategies
Heather W. Huff Director of Investment Operations
George M. Raad Investment Analyst
Shara Singh Investment Analyst
Maria Rublev Office Manager/Executive Assistant
Megan R. Hammond ’90 Managing Director–Real Assets
Michael P. Sullivan ’91, TU ’97 Managing Director–Private Equity/Venture Capital
E. Amory Loring ’04, TU ’11 Investment Associate
Joseph R. Celli ’11 Investment Analyst
Barbara L. Ibey Senior Investment Operations Manager
Kerri A. Gandin Operations Associate

Main Office:222 Berkeley St., 10th FloorBoston, Mass. 02116P: 617-778-2720F: 617-236-0652
Investment Operations Office:12 South Street, Suite 1Hanover, N.H. 03755P: 603-646-2445F: 603-646-3275