Embed Size (px)
Citation preview
nutrients
Article
Global Trends (1961–2017) in Human DietaryPotassium Supplies
Diriba B. Kumssa 1,* , Edward J. M. Joy 2 and Martin R. Broadley 1
�����������������
Citation: Kumssa, D.B.; Joy, E.J.M.;
Broadley, M.R. Global Trends
(1961–2017) in Human Dietary
Potassium Supplies. Nutrients 2021,
13, 1369. https://doi.org/10.3390/
nu13041369
Academic Editor: Rachael McLean
Received: 12 March 2021
Accepted: 16 April 2021
Published: 19 April 2021
Publisher’s Note: MDPI stays neutral
with regard to jurisdictional claims in
published maps and institutional affil-
iations.
Copyright: © 2021 by the authors.
Licensee MDPI, Basel, Switzerland.
This article is an open access article
distributed under the terms and
conditions of the Creative Commons
Attribution (CC BY) license (https://
creativecommons.org/licenses/by/
4.0/).
1 Sutton Bonington Campus, School of Biosciences, University of Nottingham, Nottinghamshire LE12 5RD, UK;[email protected]
2 Faculty of Epidemiology and Population Health, London School of Hygiene & Tropical Medicine,Keppel Street, London WC1E 7HT, UK; [email protected]
* Correspondence: [email protected]; Tel.: +44-7973-660-238
Abstract: Background: Potassium (K) is an essential mineral and major intracellular electrolyteinvolved in the regulation of blood pressure, muscle contraction and nerve transmission in humans.Major dietary sources of K include fruits and vegetables, starchy roots and tubers, and whole grains.The aim of this study was to assess and report: (i) the sufficiency of K in national food systems globally,(ii) to quantify the contribution from food groups, and (iii) to explore spatial and temporal trends inthe period of 1961–2017. Methods: Food supply and demography (1961–2017), K composition and Krequirement data were combined to estimate per capita human dietary supplies of potassium (DSK),adequate intake of K (AIK) and K sufficiency ratio (KSR) at national, regional, continental and globallevels. Results and Discussion: Globally, the mean ± SD. DSK (mg capita−1 d−1) increased from2984 ± 915 in 1961 to 3796 ± 1161 in 2017. There was a wide range in DSK between geographicalregions and across years, with particularly large increases in east Asia, where DSK increased from<3000 to >5000 mg capita−1 day−1. Roots and tubers contributed the largest dietary source of K,providing up to 80% of DSK in most regions. At the global level, throughout the 57-year period, thepopulation-weighted KSR was <1 based on the 2006 Institute of Medicine AIK recommendation,while it was >1 based on the 2019 National Academies of Science and the 2016 European Union AIKrecommendation. While KSR ≥ 1 shows sufficiency of DSK, KSR < 1 does not indicate K deficiencyrisk. Conclusion: Due to the absence of a Recommended Daily Allowance (RDA) for K, this studyused the ratio of DSK:AIK (i.e., KSR) to assess dietary K sufficiency. Estimates of dietary K sufficiencyare, therefore, highly sensitive to the AIK reference value used and this varied greatly based ondifferent institutions and years. To quantify the risk of dietary K deficiency, bridging the data gap toestablish an RDA for K should be a global research priority.
Keywords: adequate intake; potassium sufficiency ratio; potassium to sodium ratio; recommendeddaily allowance
1. Introduction
Potassium (K) is an essential mineral for human health [1,2]. It plays vital roles in thenormal functioning of cells and organs [3,4] through its involvement in nerve transmission,muscle contractions, regulation of blood pressure and maintenance of the integrity of theskeleton [1,5–8]. The major dietary sources of K are fruits, legumes, starchy roots and tubers,whole grains, and vegetables [2,9–11]. Homeostatic control of serum K concentration occursmainly through the regulation of urinary K excretion. However, reduced dietary intake ofMg [12] and K [2], and increased consumption of Na [13,14] due to food processing andhigh intake of salt [15] affect the utilisation of K. Loss of K during food processing reducesdietary K intake [16–18].
Several studies have assessed dietary K intakes and risks of deficiency through cross-sectional dietary surveys. For example, according to the Dietary Guideline for Americans,in 2015, K was one of the dietary nutrients typically under-consumed and of public health
Nutrients 2021, 13, 1369. https://doi.org/10.3390/nu13041369 https://www.mdpi.com/journal/nutrients
Nutrients 2021, 13, 1369 2 of 13
concern in the United States [19]. A cross-sectional study in the UK in 2018 found a negativeassociation between dietary K concentration and the proportion of processed foods in thediet, and 90% of the population did not meet the recommended K intake [14].
Dietary requirement reference values for K to assess K deficiency risks in populationshave not been established due to insufficient evidence [9]. However, Adequate Intakes (AI)have been proposed by the Institute of Medicine (IOM) in 2006 [9] and revised in 2019 bythe National Academies of Sciences, Engineering, and Medicine [20], in which values weredefined as the median K intake observed in apparently healthy individuals in the US andCanada. An AI is “the recommended daily intake of a nutrient estimated by the Institute ofMedicine to meet or exceed the amount needed to maintain adequate nutrition for most peo-ple in a particular life stage and gender group”. An AI may be set for nutrients where thereis insufficient evidence to determine a Recommended Dietary Allowance (RDA), whichis the average daily intake level sufficient to meet the requirements of nearly all (97.5%)healthy individuals in an age- and sex-specific population group [9]. Turck et al. [2] haveproposed AI values for K for Europe, while the World Health Organization (WHO) [10] hasseparate global recommendations (see Table 1). Adequate Intake values for K are derivedfrom dietary intake levels that maintain normotensive blood pressure (BP) and reduce theimpact of salt on BP [2,10,20].
Table 1. Recommended adequate intake of potassium (AIK) by the Institute of Medicine (IOM) in 2006(AIK_06) [9], and National Academies of Sciences (NAS) in 2019 (AIK_19) [20]; the European Union(AIK_EU) [2], and a conditional recommendation by the World Health Organization (WHO) [10].
Life-Stage Group Age AIK (mg capita−1 day−1)AIK_06 AIK_19 AIK_EU WHO
Infants0–6 months 400 4007–12 months 700 860 750
Children1–3 years 3000 2000 11004–8 years 3800 2300 1800
Males
9–13 years 4500 2500 270014–18 years 4700 3000 3500 351019–30 years 4700 3400 3500 351031–50 years 4700 3400 3500 351051–70 years 4700 3400 3500 3510>70 years 4700 3400 3500 3510
Females
9–13 years 4500 2300 270014–18 years 4700 2300 3500 351019–30 years 4700 2600 3500 351031–50 years 4700 2600 3500 351051–70 years 4700 2600 3500 3510>70 years 4700 2600 3500 3510
Pregnancy14–18 years 4700 2600 350019–30 years 4700 2900 350031–50 years 4700 2900 3500
Lactation14–18 years 5100 2500 400019–30 years 5100 2800 400031–50 years 5100 2800 4000
The prevalence of K deficiency in populations with median K supply greater or equalto the AI is likely to be low; however, the inverse cannot be assumed where the medianK intake is less than the AI [21], and this limits the ability to assess the adequacy ofpopulation K intakes. This contrasts with other mineral micronutrients which have RDAsand Estimated Average Requirement (EAR) values defined, from which the prevalence ofinadequate dietary intakes and risk of deficiency can be estimated [9,12,21–23].
The aim of this study was to assess and report the sufficiency of K in national foodsystems globally, to quantify the contribution from food groups, and to explore spatial andtemporal trends over recent decades. The study compares per capita dietary K supplies in
Nutrients 2021, 13, 1369 3 of 13
national food systems to population-weighted AIs and discusses likely implications forrisks of deficiency.
2. Materials and Methods
Per capita human dietary supplies of potassium (DSK), adequate intake of K (AIK)and the ratio between DSK and AIK, i.e., K sufficiency ratio (KSR), were estimated atnational, regional, and global levels. Dietary K contributions from various food groups(i.e., animal products, cereals, fruits and vegetables, pulses and beans, roots and tubers andothers) to DSK were estimated at the regional level between 1961 and 2017. Demographicdata were used to estimate population-weighted DSK, AIK, and KSR at national, regional,continental and global levels.
2.1. Demographic Data
Demographic data by age and sex (1961–2017) were downloaded from the UnitedNations World Population Prospects website [24]. Data on births by age of mother wereused to estimate the number of pregnant and lactating women during a given year. Thenumber of pregnant and lactating women each year was estimated using Equations (1) and(2). Pregnancy was assumed to last for nine months and mothers were assumed to breast-feed for 1.5 years. Demographic data were used to estimate the population-weighted DSK,AIK and KSR at various geographical scales (see Supplementary Tables S1–S4). Prior toweighting DSK, AIK and KSR by population, the number of pregnant and lactating womenof the five-year age groups in the reproductive ages (i.e., 15–49 years) was subtracted fromthe total number of women in the corresponding age groups.
Number o f pregnant women = number o f births × 0.75 (1)
where number of births was assumed to be equivalent to the number of women in afive-year reproductive age group, and pregnancy lasted for nine months.
Number o f lactating women = number o f births × 1.5 (2)
where breastfeeding (lactation) was assumed to last for one and half years on average.
2.2. Dietary Supplies of Potassium (DSK)
Daily per capita plant and animal source food supply data for 57 years (1961–2017)were downloaded from the Food and Agriculture Organization (FAO) of the United Nationsstatistical data (FAOSTAT) [25] website. The daily per capita food supply statistic wasconsidered as a proxy for daily food intake. Potassium concentration data for each fooditem were obtained from the United States Department of Agriculture (USDA) NutrientData Laboratory (NDL) (Standard Reference 26) [26]. Per capita dietary supplies of K (DSK)were estimated by multiplying the daily food supply by the concentration of K in eachfood item. Demographic data were used to derive a population-weighted dietary suppliesof K (WtdDSK) at regional, continental and global levels [22]. Dietary K contributions fromvarious food groups were also estimated at regional levels between 1961 and 2017.
2.3. Potassium Requirement
Various institutions have set Adequate Intake (AI) values, and these are updatedas new evidence emerges (see Table 1). In this study, AI values of K (AIK) for age- andsex-specific groups were derived from the Institute of Medicine (IOM) 2006 K requirementrecommendation (AIK_06) [9], National Academies of Sciences (NAS) 2019 K requirementrecommendation (AIK_19) [20], and the K requirement recommendation for the EuropeanUnion (AIK_EU) [2]. A population-weighted AI of K was calculated (WtdAIK) at national,regional, continental, and global levels using annual demographic information. The impactof source of AIK recommendation on the risk of dietary K deficiency was compared.
Nutrients 2021, 13, 1369 4 of 13
2.4. Potassium (K) Sufficiency Ratio
The Potassium (K) Sufficiency Ratio (KSR) between dietary supplies of K (DSK) andthe population-weighted adequate intake of K (WtdAIK) was calculated as indicated inEquation (3). A KSR ≥ 1 indicates that there is likely to be low risk of K deficiency dueto inadequate dietary supplies in populations at aggregated scales, i.e., national, regional,continental, and global levels. Demographic data were used to derive a population-weighted dietary supplies of potassium (WtdDSK) and potassium adequacy ratio (WtdKSR)at regional, continental and global levels.
KSR =DSKAIK
(3)
where KSR is potassium sufficiency ratio, DSK is dietary supplies of K, and AIK is recom-mended adequate intake of K.
2.5. Data Analyses and Visualisation
Data compilation and management were carried out using Microsoft Office 365 Access2016. Regional-, continental-, and global-level aggregations, weighting by population andderivation of descriptive statistics were conducted using IBM© SPSS Statistics version27 [27]. Thematic maps were produced using QGIS 3.16 Hannover [28]. Line graphs wereproduced using the ggplot2 package [29] in R version 4.0.2 [30].
3. Results
3.1. Dietary Potassium (K) Supplies and Requirements
At the national level, in 1961, dietary supplies of K (DSK) ranged from 1062 mgcapita−1 day−1 in Myanmar to 7016 mg capita−1 day−1 in Côte d’Ivoire. In 1997, DSKranged from 1285 mg capita−1 day−1 in Cambodia to 6428 mg capita−1 day−1 in Ghana.In 2017, DSK ranged from 1705 mg capita−1 day−1 in The Gambia to 7372 mg capita−1
day−1 in Ghana (Table S1 and Figure 1). In 1961, population-weighted adequate intake(AI) of K (WtdAIK) ranged from 4204 mg capita−1 day−1, 2553 mg capita−1 day−1 and2661 mg capita−1 day−1 in Grenada to 4509 mg capita−1 day−1, 2802 mg capita−1 day−1
and 3157 mg capita−1 day−1 in Sweden based on AIK_06, AIK_19 and AIK_EU values,respectively. In 1997, the WtdAIK ranged from 4213 mg capita−1 day−1, 2574 mg capita−1
day−1 and 2665 mg capita−1 day−1 in Yemen to 4572 mg capita−1 day−1, 2855 mg capita−1
day−1 and 3271 mg capita−1 day−1 in Italy based on AIK_06, AIK_19 and AIK_EU values,respectively. In 2017, the WtdAIK ranged from 4209 mg capita−1 day−1, 2571 mg capita−1
day−1, and 2663 mg capita−1 day−1 in Niger to 4587 mg capita−1 day−1, 2876 mg capita−1
day−1 and 3299 mg capita−1 day−1 in Japan based on AIK_06, AIK_19 and AIK_EU values,respectively (Table S1).
Nutrients 2021, 13, 1369 5 of 13
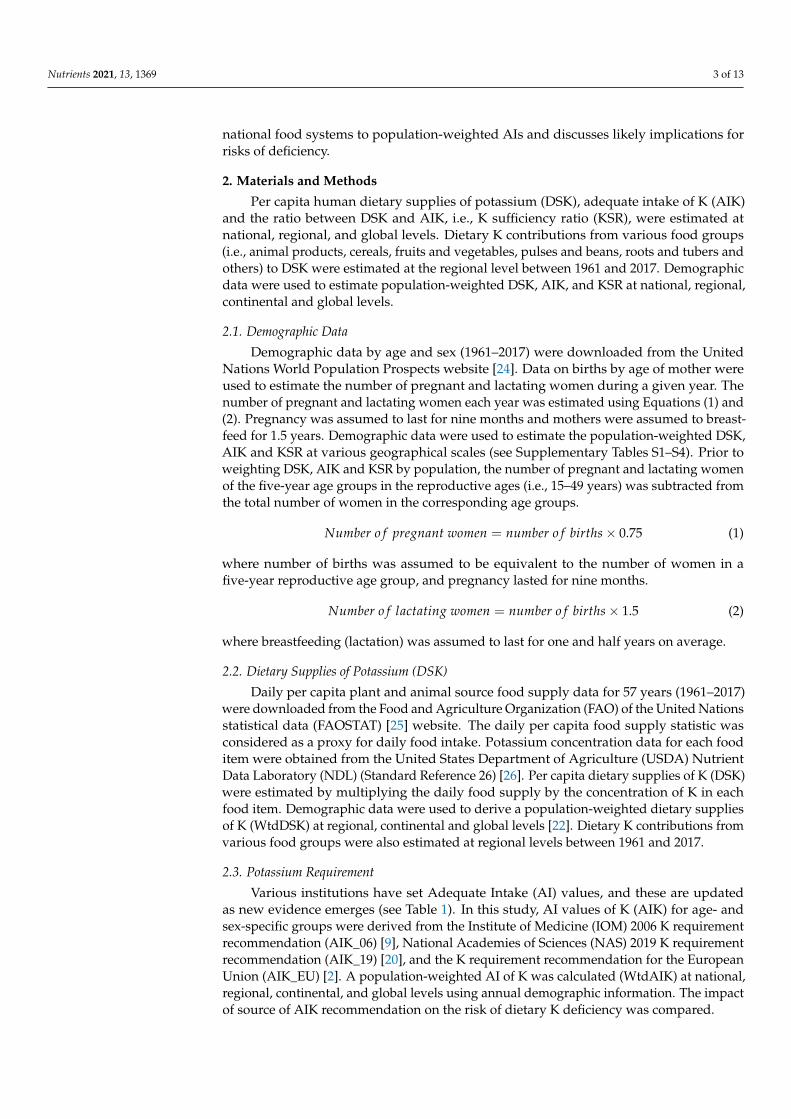
Figure 1. National-level dietary supplies of K (DSK), and K sufficiency ratio (KSR) in (a–d) 1997 and (e–h) 2017. KSR wascalculated using the K AI recommendations by: (b,f) the Institute of Medicine in 2006 (AIK_06), (c,g) National Academies ofSciences in 2019 (AIK_19), and (d,h) the European Union (AIK_EU).
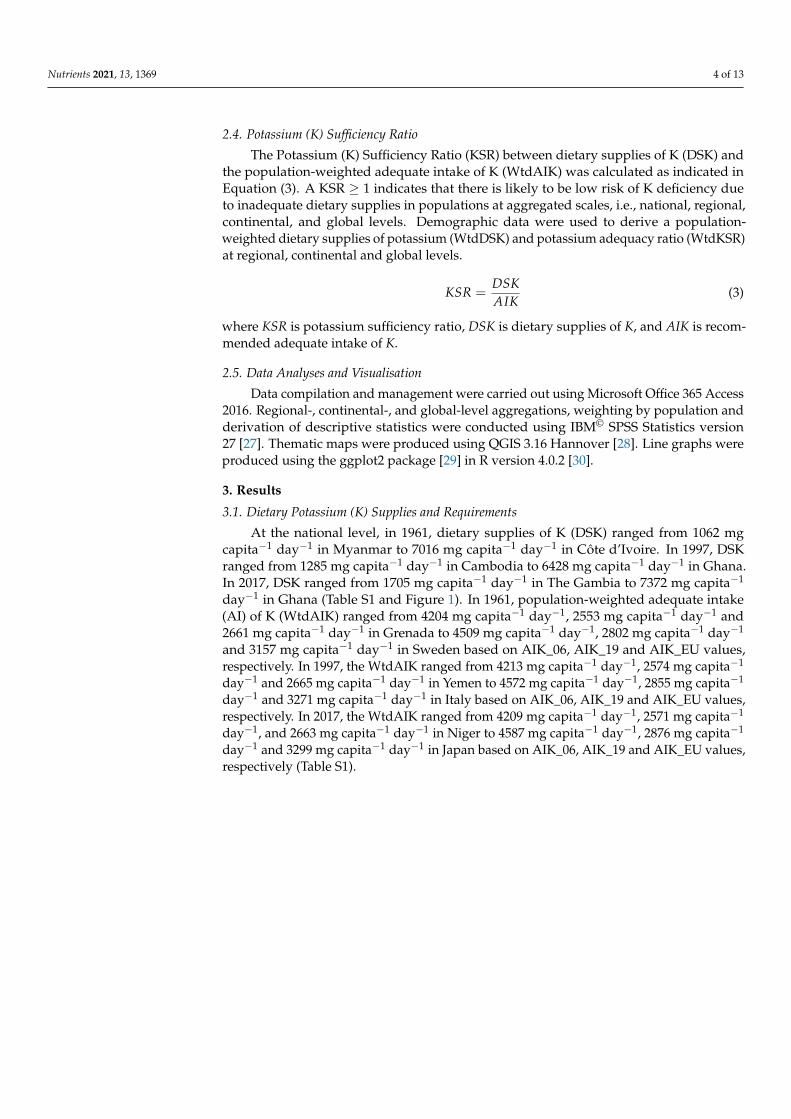
At the regional level, in 1961, the population-weighted mean dietary supplies ofK (WtdDSK) ± standard deviation (SD) ranged from 1798 ± 336 mg capita−1 day−1 insouth-eastern Asia to 4837 ± 936 mg capita−1 day−1 in eastern Europe. In 1997, the meanWtdDSK ± SD ranged from 2067 ± 284 mg capita−1 day−1 in south-eastern Asia to 4744 ±350 mg capita−1 day−1 in southern Europe. In 2017, the mean WtdDSK ± SD ranged from2744 ± 434 mg capita−1 day−1 in south-eastern Asia to 5262 ± 799 mg capita−1 day−1 ineastern Asia (Figure 2 and Table S2). At the regional level, in 1961, the population-weightedmean adequate intake of K (WtdAIK) ± SD ranged from 4216 mg capita−1 day−1, 2577 mgcapita−1 day−1 and 2617 mg capita−1 day−1 in Polynesia to 4486 ± 19 mg capita−1 day−1,2779 ± 17 mg capita−1 day−1 and 3121 ± 35 mg capita−1 day−1 in northern Europe basedon AIK_06, AIK_19 and AIK_EU values, respectively. In 1997, the mean WtdAIK ± SDranged from 4254 ± 23 mg capita−1 day−1, 2601 ± 14 mg capita−1 day−1 and 2733 ±36 mg capita−1 day−1 in central Africa to 4561 ± 26 mg capita−1 day−1, 2843 ± 23 mgcapita−1 day−1 and 3250 ± 46 mg capita−1 day−1 in southern Europe based on AIK_06,AIK_19 and AIK_EU values, respectively. In 2017, the mean WtdAIK ± SD ranged from4270 ± 26 mg capita−1 day−1, 2612 ± 22 mg capita−1 day−1 and 2758 ± 43 mg capita−1
day−1 in central Africa to 4577 ± 9 mg capita−1 day−1, 2864 ± 7 mg capita−1 day−1 and3278 ± 15 mg capita−1 day−1 based on AIK_06, AIK_19 and AIK_EU values, respectively(Figure 2 and Table S2).
Nutrients 2021, 13, 1369 6 of 13
Figure 2. Regional-level population-weighted adequate intake of K (WtdAIK) and dietary supplies of K (WtdDSK),1961–2017. Population-weighted adequate intake of K (WtdAIK) calculated using (a–e) the AI values of the Institute ofMedicine in 2006 (AIK_06), (f–j) National Academies of Sciences in 2019 (AIK_19), and (k–o) the European Union (AIK_EU).(p–t) Population-weighted dietary potassium supplies of K (WtdDSK).
At the continental level, in 1961, the population-weighted mean (WtdDSK) ± SDdietary supplies of K ranged from 2498 ± 536 mg capita−1 day−1 in Asia to 4458 ±569 mg capita−1 day−1 in Europe. In 1997, the mean WtdDSK ± SD ranged from 3121± 852 mg capita−1 day−1 in Asia to 4368 ± 432 mg capita−1 day−1 in Europe. In 2017,the mean WtdDSK ± SD ranged from 3417 ± 330 mg capita−1 day−1 in Oceania to 4064± 1160 mg capita−1 day−1 in Africa (Table S3). At the continental level, in 1961, thepopulation weighted mean adequate intake of K (WtdAIK) ± SD ranged from 4279 ±26 mg capita−1 day−1, 2628 ± 20 mg capita−1 day−1 and 2782 ± 41 mg capita−1 day−1 inAfrica to 4466 ± 34 mg capita−1 day−1, 2762 ± 25 mg capita−1 day−1 and 3089 ± 58 mgcapita−1 day−1 in Europe based on AIK_06, AIK_19 and AIK_EU values, respectively. In1997, the mean WtdAIK ± SD ranged from 4295 ± 52 mg capita−1 day−1, 2627 ± 36 mgcapita−1 day−1 and 2797 ± 80 mg capita−1 day−1 in Africa to 4545 ± 19 mg capita−1
day−1, 2821 ± 22 mg capita−1 day−1 and 3217 ± 34 mg capita−1 day−1 in Europe basedon AIK_06, AIK_19 and AIK_EU values, respectively. In 2017, the mean WtdAIK ± SDranged from 4316 ± 58 mg capita−1 day−1, 2649 ± 50 mg capita−1 day−1 and 2836 ± 98 mgcapita−1 day−1 in Africa to 4556 ± 19 mg capita−1 day−1, 2845 ± 20 mg capita−1 day−1
Nutrients 2021, 13, 1369 7 of 13
and 3246 ± 32 mg capita−1 day−1 in Europe based on AIK_06, AIK_19 and AIK_EU values,respectively (Table S3).
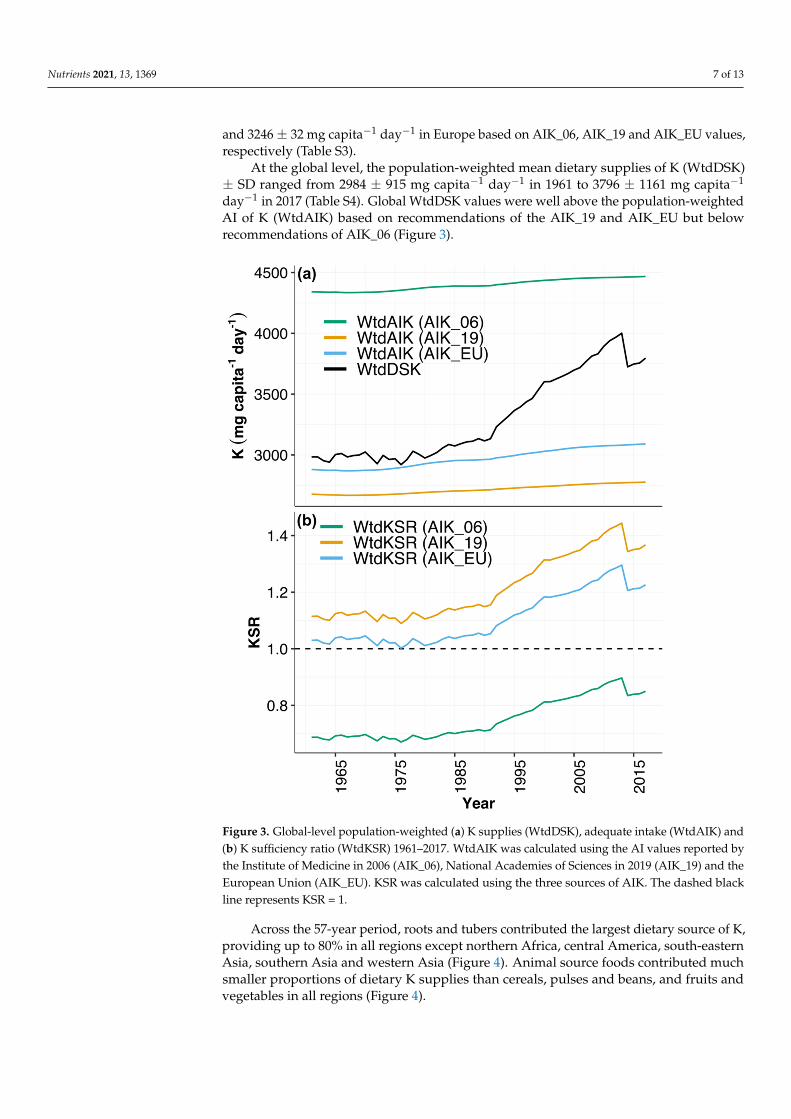
At the global level, the population-weighted mean dietary supplies of K (WtdDSK)± SD ranged from 2984 ± 915 mg capita−1 day−1 in 1961 to 3796 ± 1161 mg capita−1
day−1 in 2017 (Table S4). Global WtdDSK values were well above the population-weightedAI of K (WtdAIK) based on recommendations of the AIK_19 and AIK_EU but belowrecommendations of AIK_06 (Figure 3).
Figure 3. Global-level population-weighted (a) K supplies (WtdDSK), adequate intake (WtdAIK) and(b) K sufficiency ratio (WtdKSR) 1961–2017. WtdAIK was calculated using the AI values reported bythe Institute of Medicine in 2006 (AIK_06), National Academies of Sciences in 2019 (AIK_19) and theEuropean Union (AIK_EU). KSR was calculated using the three sources of AIK. The dashed blackline represents KSR = 1.
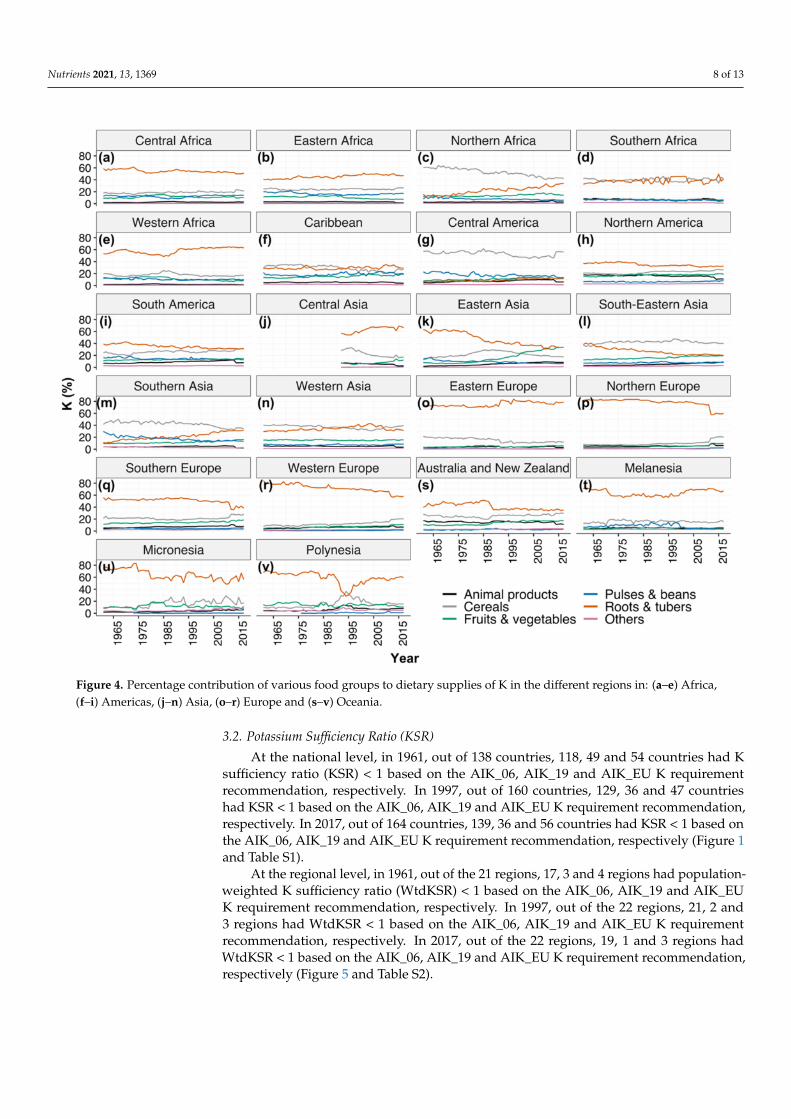
Across the 57-year period, roots and tubers contributed the largest dietary source of K,providing up to 80% in all regions except northern Africa, central America, south-easternAsia, southern Asia and western Asia (Figure 4). Animal source foods contributed muchsmaller proportions of dietary K supplies than cereals, pulses and beans, and fruits andvegetables in all regions (Figure 4).
Nutrients 2021, 13, 1369 8 of 13
Figure 4. Percentage contribution of various food groups to dietary supplies of K in the different regions in: (a–e) Africa,(f–i) Americas, (j–n) Asia, (o–r) Europe and (s–v) Oceania.
3.2. Potassium Sufficiency Ratio (KSR)
At the national level, in 1961, out of 138 countries, 118, 49 and 54 countries had Ksufficiency ratio (KSR) < 1 based on the AIK_06, AIK_19 and AIK_EU K requirementrecommendation, respectively. In 1997, out of 160 countries, 129, 36 and 47 countrieshad KSR < 1 based on the AIK_06, AIK_19 and AIK_EU K requirement recommendation,respectively. In 2017, out of 164 countries, 139, 36 and 56 countries had KSR < 1 based onthe AIK_06, AIK_19 and AIK_EU K requirement recommendation, respectively (Figure 1and Table S1).
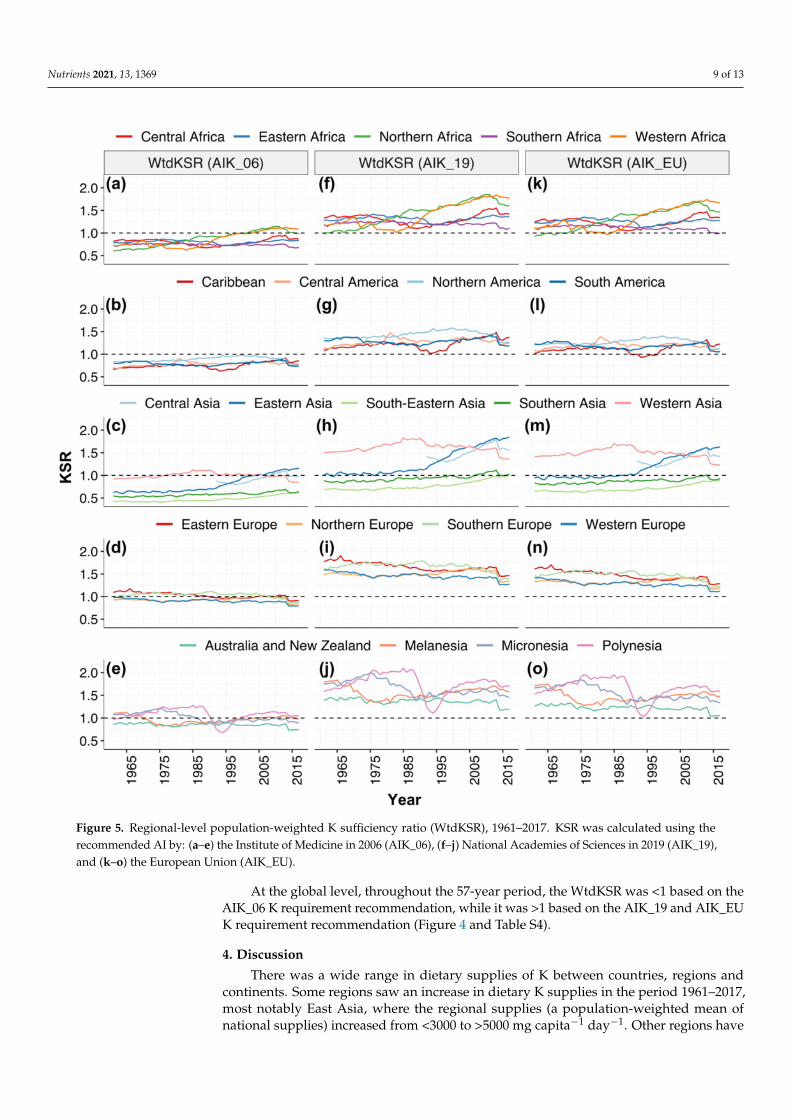
At the regional level, in 1961, out of the 21 regions, 17, 3 and 4 regions had population-weighted K sufficiency ratio (WtdKSR) < 1 based on the AIK_06, AIK_19 and AIK_EUK requirement recommendation, respectively. In 1997, out of the 22 regions, 21, 2 and3 regions had WtdKSR < 1 based on the AIK_06, AIK_19 and AIK_EU K requirementrecommendation, respectively. In 2017, out of the 22 regions, 19, 1 and 3 regions hadWtdKSR < 1 based on the AIK_06, AIK_19 and AIK_EU K requirement recommendation,respectively (Figure 5 and Table S2).
Nutrients 2021, 13, 1369 9 of 13
Figure 5. Regional-level population-weighted K sufficiency ratio (WtdKSR), 1961–2017. KSR was calculated using therecommended AI by: (a–e) the Institute of Medicine in 2006 (AIK_06), (f–j) National Academies of Sciences in 2019 (AIK_19),and (k–o) the European Union (AIK_EU).
At the global level, throughout the 57-year period, the WtdKSR was <1 based on theAIK_06 K requirement recommendation, while it was >1 based on the AIK_19 and AIK_EUK requirement recommendation (Figure 4 and Table S4).
4. Discussion
There was a wide range in dietary supplies of K between countries, regions andcontinents. Some regions saw an increase in dietary K supplies in the period 1961–2017,most notably East Asia, where the regional supplies (a population-weighted mean ofnational supplies) increased from <3000 to >5000 mg capita−1 day−1. Other regions have
Nutrients 2021, 13, 1369 10 of 13
seen less dramatic changes, and dietary K supplies have fallen over the period of 1961–2017in European Regions by approximately 7–21%.
Dietary K supplies appear to be sufficient at a national level for most countries, whencompared against population-weighted AIs. This is indicative of adequate K supplies innational food systems to meet population requirements. However, this comparison is verysensitive to the source of dietary reference values. This is illustrated by comparing dietaryK supplies against AI values set by the IOM in 2006 [9], which were ~30–40% greaterfor most demographic groups than the values proposed more recently by the NationalAcademies of Science (NAS) [20] and the European Union (EU) [2]. With the availability ofmore evidence, the AI values may be updated again. In the future, it may be possible topropose the Estimated Average Requirement (EAR) and Recommended Daily Allowance(RDA) reference values, which will enable the estimation of the prevalence of inadequatedietary K supplies at national levels using an adapted EAR cut-point methodology, asdescribed previously for other micronutrients [22,23,31,32].
Dietary reference values are defined for healthy populations, and there may be groupsof individuals at risk of K deficiency despite adequate K supplies in national food systems.Use of diuretics, for example, in the treatment of high blood pressure and heart disease canlead to K deficiency, and K supplementation may be required [33,34]. Taking K supplementsmay also reduce blood pressure for individuals with hypertension [35], although theevidence is not conclusive [36], and excessive supplementation with K may increase bloodpressure in some individuals [37]. In addition, nutrient imbalances, especially high intakeof sodium (Na), negatively affect the utilisation of K by the body. The WHO recommendsa dietary K:Na ratio of 1:1 [38]; however, prevailing K:Na ratios in diets are substantiallylower (i.e., K intake less than Na intake) [3,39,40]. In agreement with previous studies, forexample, in the current study, at an estimated global average Na intake [41] of 4 g capita−1
day−1, the global K:Na ratio in 1961 and 2017 was 373:500 and 949:1000, respectively.Similarly, based on the National Health and Nutrition Examination Survey (NHANES)2017–2018 nutrient intake in the USA [42], the K:Na intake ratio for adult female and malepopulation aged 20–29 years was 2643:4219 and 2309:3326, respectively.
This study estimated dietary K supplies using food supply data from the FAOSTATwhich has inherent limitations. Food Balance Sheets (FBS) may over-estimate the availabil-ity of foods and nutrients since they do not account for food loss or waste at the householdlevel, or they may underestimate certain food items by failing to capture subsistence pro-duction [43]. In addition, the aggregation of some food items (e.g., cereals, vegetables,fruits, etc.) in the FAOSTAT makes it difficult to match K concentration in some food itemsin the United States Department of Agriculture Nutrient Data Laboratory Dietary food list.Similarly, K concentration in food varies across years, locations and cultivars of a givenspecies which cannot be accounted for due to unavailability of food composition data withbetter temporal and spatial resolution. These can be sources of uncertainty in our analysesand conclusions, and our results should be interpreted with due caution. As an alternativeto FBS, dietary K supplies may be estimated with dietary surveys using recall or food diarymethods which are available for nationally representative populations or large cohorts insome countries. For example, estimated K intakes among adult males and females aged20–29 years in the 2017–2018 NHANES survey were 2643 and 2309 mg capita−1 day−1,respectively [42]. This compares to a national dietary supply estimate from FBS of 3534 mgcapita−1 day−1 for the United States in 2017. It is common to find greater dietary supplyestimates when using FBS compared to individually administered dietary surveys, andthis is likely due to limitations in the FBS data as well as limitations in dietary surveys inwhich respondents often under-report food consumption [44,45].
In the present study, food composition data were derived from the USDA whichprovides a high-quality source of data. However, the composition of crops including staplecereals shows spatial variability for some mineral micronutrients [46,47]. Whether this isthe case for K, and the extent to which this affects estimates of dietary supply and adequacywill be important to establish but is considered outside the scope of the current study.
Nutrients 2021, 13, 1369 11 of 13
Furthermore, a concerted research effort to close the data gap to establish the RDA for K isvery crucial to enable accurate assessment of the risk of dietary K deficiency.
5. Conclusions
Due to the absence of Recommended Daily Allowance (RDA) for K, this study used theratio of DSK:AIK, i.e., KSR to assess dietary K sufficiency. While KSR > 1 shows sufficiencyof DSK, KSR < 1 does not indicate K deficiency risk. Furthermore, the sufficiency of DSK iscontingent upon the AIK reference value used which varied greatly across institutions andyears. To quantify the risk of dietary K deficiency, bridging the data gap to establish anRDA for K should be a global research priority.
Supplementary Materials: The following are available online at https://www.mdpi.com/article/10.3390/nu13041369/s1, Table S1. National level dietary supplies of K (DSK), population weightedadequate intake of K (WtdAIK) and K sufficiency ratio (KSR) 1961–2017. AIK and KSR were calculatedat various AIK recommendations: Institute of Medicine in 2006 (AIK_06), National Academies ofSciences in 2019 (AIK_19), and the European Union (AIK_EU). Table S2. Population weightedmean and standard deviation (SD) regional level dietary supplies of K (WtdDSK), adequate intakeof K (WtdAIK) and K sufficiency ratio (WtdKSR) 1961–2017. AIK and KSR were calculated atvarious AIK recommendations: Institute of Medicine in 2006 (AIK_06), National Academies ofSciences in 2019 (AIK_19), and the European Union (AIK_EU). Table S3. Population weightedmean and standard deviation (SD) continental level dietary supplies of K (WtdDSK), adequateintake of K (WtdAIK) and K sufficiency ratio (WtdKSR) 1961–2017. AIK and KSR were calculatedat various AIK recommendations: Institute of Medicine in 2006 (AIK_06), National Academies ofSciences in 2019 (AIK_19), and the European Union (AIK_EU). Table S4. Population weighted meanand standard deviation (SD) global level dietary supplies of K (WtdDSK), adequate intake of K(WtdAIK) and K sufficiency ratio (WtdKSR) 1961–2017. AIK and KSR were calculated at various AIKrecommendations: Institute of Medicine in 2006 (AIK_06), National Academies of Sciences in 2019(AIK_19), and the European Union (AIK_EU).
Author Contributions: Conceptualization, D.B.K., E.J.M.J. and M.R.B.; Data curation, D.B.K.; Formalanalysis, D.B.K.; Funding acquisition, E.J.M.J. and M.R.B.; Investigation, D.B.K.; Methodology, D.B.K.,E.J.M.J. and M.R.B.; Software, D.B.K.; Validation, D.B.K.; Visualization, D.B.K.; Writing—originaldraft, D.B.K. and E.J.M.J.; Writing—review and editing, D.B.K., E.J.M.J. and M.R.B. All authors haveread and agreed to the published version of the manuscript.
Funding: This work was supported by the GeoNutrition project funded by the Bill and MelindaGates Foundation (BMGF) [INV-009129]. The funder was not involved in the study design, thecollection, management, analysis, and interpretation of data, the writing of the report or the decisionto submit the report for publication.
Institutional Review Board Statement: Not applicable.
Informed Consent Statement: Not applicable.
Data Availability Statement: Data are provided as Supplementary Materials.
Conflicts of Interest: The authors declare no conflict of interest.
References1. Palmer, B.F. Regulation of potassium homeostasis. Clin. J. Am. Soc. Nephrol. 2015, 10, 1050–1060. [CrossRef] [PubMed]2. Turck, D.; Bresson, J.L.; Burlingame, B.; Dean, T.; Fairweather-Tait, S.; Heinonen, M.; Hirsch-Ernst, K.I.; Mangelsdorf, I.; McArdle,
H.; Neuhäuser-Berthold, M. Dietary reference values for potassium. EFSA J. 2016, 14. [CrossRef]3. Weaver, C.M. Potassium and health. Adv. Nutr. 2013, 4, 368S–377S. [CrossRef] [PubMed]4. Viera, A.J.; Wouk, N. Potassium Disorders: Hypokalemia and Hyperkalemia. Am. Fam. Physician 2015, 92, 487–495.5. Haddy, F.J.; Vanhoutte, P.M.; Feletou, M. Role of potassium in regulating blood flow and blood pressure. Am. J. Physiol. Regul.
Integr. Comp. Physiol. 2006, 290, R546–R552. [CrossRef] [PubMed]6. Salomonsson, M.; Brasen, J.C.; Sorensen, C.M. Role of renal vascular potassium channels in physiology and pathophysiology.
Acta Physiol. 2017, 221, 14–31. [CrossRef]
Nutrients 2021, 13, 1369 12 of 13
7. Kong, S.H.; Kim, J.H.; Hong, A.R.; Lee, J.H.; Kim, S.W.; Shin, C.S. Dietary potassium intake is beneficial to bone health in a lowcalcium intake population: The Korean National Health and Nutrition Examination Survey (KNHANES) (2008–2011). Osteoporos.Int. 2017, 28, 1577–1585. [CrossRef]
8. Newberry, S.J.; Chung, M.; Anderson, C.A.M.; Chen, C.; Fu, Z.; Tang, A.; Zhao, N.; Booth, M.; Marks, J.; Hollands, S.; et al.AHRQ comparative effectiveness reviews. In Sodium and Potassium Intake: Effects on Chronic Disease Outcomes and Risks; AHRQComparative Effectiveness Reviews; Agency for Healthcare Research and Quality (US): Rockville, MD, USA, 2018.
9. IOM. Dietary Reference Intakes: The Essential Guide to Nutrient Requirements; Otten, J.J., Hellwig, J.P., Meyers, L.D., Eds.; NationalAcademies Press: Washington, DC, USA, 2006.
10. World Health Organization. Guideline: Potassium Intake for Adults and Children; World Health Organization: Geneva, Switzerland,2012.
11. Broadley, M.R.; White, P.J. Eats roots and leaves. Can edible horticultural crops address dietary calcium, magnesium andpotassium deficiencies? Proc. Nutr. Soc. 2010, 69, 601–612. [CrossRef]
12. Rosanoff, A.; Kumssa, D.B. Impact of rising body weight and cereal grain food processing on human magnesium nutrition. PlantSoil 2020, 5–23. [CrossRef]
13. Du, S.; Wang, H.; Zhang, B.; Popkin, B.M. Dietary potassium intake remains low and sodium Iitake remains high, and mostsodium is derived from home food preparation for Chinese adults, 1991–2015 trends. J. Nutr. 2020, 150, 1230–1239. [CrossRef]
14. Rauber, F.; Da Costa Louzada, M.L.; Steele, E.M.; Millett, C.; Monteiro, C.A.; Levy, R.B. Ultra-processed food consumption andchronic non-communicable diseases-related dietary nutrient profile in the UK (2008–2014). Nutrients 2018, 10, 587. [CrossRef]
15. Brown, I.J.; Tzoulaki, I.; Candeias, V.; Elliott, P. Salt intakes around the world: Implications for public health. Int. J. Epidemiol.2009, 38, 791–813. [CrossRef]
16. Sun, H.; Weaver, C.M. Rise in potassium deficiency in the US population links to agriculture practices and dietary potassiumdeficits. J. Agric. Food Chem. 2020, 68, 11121–11127. [CrossRef]
17. He, F.J.; MacGregor, G.A. Beneficial effects of potassium on human health. Physiol. Plant 2008, 133, 725–735. [CrossRef]18. Sebastian, A.; Frassetto, L.A.; Sellmeyer, D.E.; Morris, R.C. The evolution-informed optimal dietary potassium intake of human
beings greatly exceeds current and recommended intakes. Semin. Nephrol. 2006, 26, 447–453. [CrossRef] [PubMed]19. Millen, B.E.; Abrams, S.; Adams-Campbell, L.; Anderson, C.A.; Brenna, J.T.; Campbell, W.W.; Clinton, S.; Hu, F.; Nelson, M.;
Neuhouser, M.L.; et al. The 2015 dietary guidelines advisory committee scientific report: Development and major conclusions.Adv. Nutr. 2016, 7, 438–444. [CrossRef] [PubMed]
20. National Academies of Sciences, Engineering, and Medicine. Dietary Reference Intakes for Sodium and Potassium; NationalAcademies Press: Washington, DC, USA, 2019.
21. IOM. Dietary Reference Intakes: Applications in Dietary Assessment; The National Academies Press: Washington, DC, USA, 2000.22. Kumssa, D.B.; Joy, E.J.; Ander, E.L.; Watts, M.J.; Young, S.D.; Walker, S.; Broadley, M.R. Dietary calcium and zinc deficiency risks
are decreasing but remain prevalent. Sci. Rep. 2015, 5, 10974. [CrossRef] [PubMed]23. Kumssa, D.B.; Joy, E.J.M.; Ander, E.L.; Watts, M.J.; Young, S.D.; Rosanoff, A.; White, P.J.; Walker, S.; Broadley, M.R. Global
magnesium supply in the food chain. Crop. Pasture Sci. 2015, 66, 1278–1289. [CrossRef]24. UN. World Population Prospects 2019. Available online: https://population.un.org/wpp/Download/Standard/Population/
(accessed on 6 October 2020).25. FAO. FAOSTAT Data: Food Balance. Available online: http://www.fao.org/faostat/en/#data (accessed on 6 October 2020).26. USDA. USDA National Nutrient Database for Standard Reference, Release 26. Available online: http://www.ars.usda.gov/ba/
bhnrc/ndl (accessed on 20 November 2020).27. IBM Corp. IBM SPSS Statistics for Macintosh; Version 27.0.; IBM Corp: Armonk, NY, USA, 2020.28. QGIS Development Team. QGIS, Version 3.16-Hannover; Open-Source Geospatial Foundation Project. Available online:
https://qgis.org/en/site/ (accessed on 20 November 2020).29. Wickham, H. Ggplot2: Elegant Graphics for Data Analysis, 2nd ed.; Springer International Publishing: Houston, TX, USA, 2016.30. R Core Team. A Language and Environment of Statistical Computing; R Core Team: Vienna, Austria, 2020.31. Wessells, K.R.; Brown, K.H. Estimating the global prevalence of zinc deficiency: Results based on zinc availability in national
food supplies and the prevalence of stunting. PLoS ONE 2012, 7, e50568. [CrossRef]32. Joy, E.J.M.; Young, S.D.; Black, C.R.; Ander, E.L.; Watts, M.J.; Broadley, M.R. Risk of dietary magnesium deficiency is low in most
African countries based on food supply data. Plant Soil 2012, 368, 129–137. [CrossRef]33. Paice, B.J.; Paterson, K.R.; Onyanga-Omara, F.; Donnelly, T.; Gray, J.M.; Lawson, D.H. Record linkage study of hypokalaemia in
hospitalized patients. Postgrad. Med. J. 1986, 62, 187–191. [CrossRef] [PubMed]34. Lippi, G.; Favaloro, E.J.; Montagnana, M.; Guidi, G.C. Prevalence of hypokalaemia: The experience of a large academic hospital.
Intern. Med. J. 2010, 40, 315–316. [CrossRef] [PubMed]35. Filippini, T.; Violi, F.; D’Amico, R.; Vinceti, M. The effect of potassium supplementation on blood pressure in hypertensive
subjects: A systematic review and meta-analysis. Int. J. Cardiol. 2017, 230, 127–135. [CrossRef] [PubMed]36. Dickinson, H.O.; Nicolson, D.J.; Campbell, F.; Beyer, F.R.; Mason, J. Potassium supplementation for the management of primary
hypertension in adults. Cochrane Database Syst. Rev. 2006, CD004641. [CrossRef]
Nutrients 2021, 13, 1369 13 of 13
37. Filippini, T.; Naska, A.; Kasdagli, M.I.; Torres, D.; Lopes, C.; Carvalho, C.; Moreira, P.; Malavolti, M.; Orsini, N.; Whelton, P.K.;et al. Potassium intake and blood pressure: A dose-response meta-analysis of randomized controlled trials. J. Am. Heart Assoc.2020, 9, e015719. [CrossRef] [PubMed]
38. World Health Organization. Guideline: Sodium Intake for Adults and Children; World Health Organization: Geneva, Swizerland,2012.
39. Jung, S.; Kim, M.K.; Shin, J.; Choi, B.Y.; Lee, Y.H.; Shin, D.H.; Shin, M.H. High sodium intake and sodium to potassium ratio maybe linked to subsequent increase in vascular damage in adults aged 40 years and older: The Korean multi-rural communitiescohort (MRCohort). Eur. J. Nutr. 2019, 58, 1659–1671. [CrossRef]
40. Binia, A.; Jaeger, J.; Hu, Y.; Singh, A.; Zimmermann, D. Daily potassium intake and sodium-to-potassium ratio in the reduction ofblood pressure: A meta-analysis of randomized controlled trials. J. Hypertens. 2015, 33, 1509–1520. [CrossRef]
41. Thout, S.R.; Santos, J.A.; McKenzie, B.; Trieu, K.; Johnson, C.; McLean, R.; Arcand, J.; Campbell, N.R.C.; Webster, J. The Science ofSalt: Updating the evidence on global estimates of salt intake. J. Clin. Hypertens. 2019, 21, 710–721. [CrossRef]
42. NHANES. Nutrient Intakes from Food and Beverages: Mean Amounts Consumed per Indvidual by Gender and Age, in the UnitedStates, 2017–2018. Available online: https://www.ars.usda.gov/ARSUserFiles/80400530/pdf/1718/tables_1-56_2017-2018.pdf(accessed on 3 March 2021).
43. Sekula, W.; Becker, W.; Trichopoulou, A.; Zajkas, G. Comparison of dietary data from different sources: Some examples. WHOReg. Publ. Eur. Ser. 1991, 34, 91–117.
44. Archer, E.; Hand, G.A.; Blair, S.N. Validity of U.S. nutritional surveillance: National Health and Nutrition Examination Surveycaloric energy intake data, 1971–2010. PLoS ONE 2013, 8, e76632. [CrossRef]
45. Aleksandrowicz, L.; Tak, M.; Green, R.; Kinra, S.; Haines, A. Comparison of food consumption in Indian adults between nationaland sub-national dietary data sources. Br. J. Nutr. 2017, 117, 1013–1019. [CrossRef]
46. Gashu, D.; Lark, R.M.; Milne, A.E.; Amede, T.; Bailey, E.H.; Chagumaira, C.; Dunham, S.J.; Gameda, S.; Kumssa, D.B.; Mossa,A.W.; et al. Spatial prediction of the concentration of selenium (Se) in grain across part of Amhara Region, Ethiopia. Sci. TotalEnviron. 2020, 733, 139231. [CrossRef]
47. Ligowe, I.S.; Phiri, F.P.; Ander, E.L.; Bailey, E.H.; Chilimba, A.D.C.; Gashu, D.; Joy, E.J.M.; Lark, R.M.; Kabambe, V.; Kalimbira,A.A.; et al. Selenium deficiency risks in sub-Saharan African food systems and their geospatial linkages. Proc. Nutr. Soc. 2020,1–11. [CrossRef]