Embed Size (px)
Citation preview
1
Effect of Context Aware Scheduler on TLB
Satoshi Yamada and Shigeru Kusakabe
Kyushu University
2
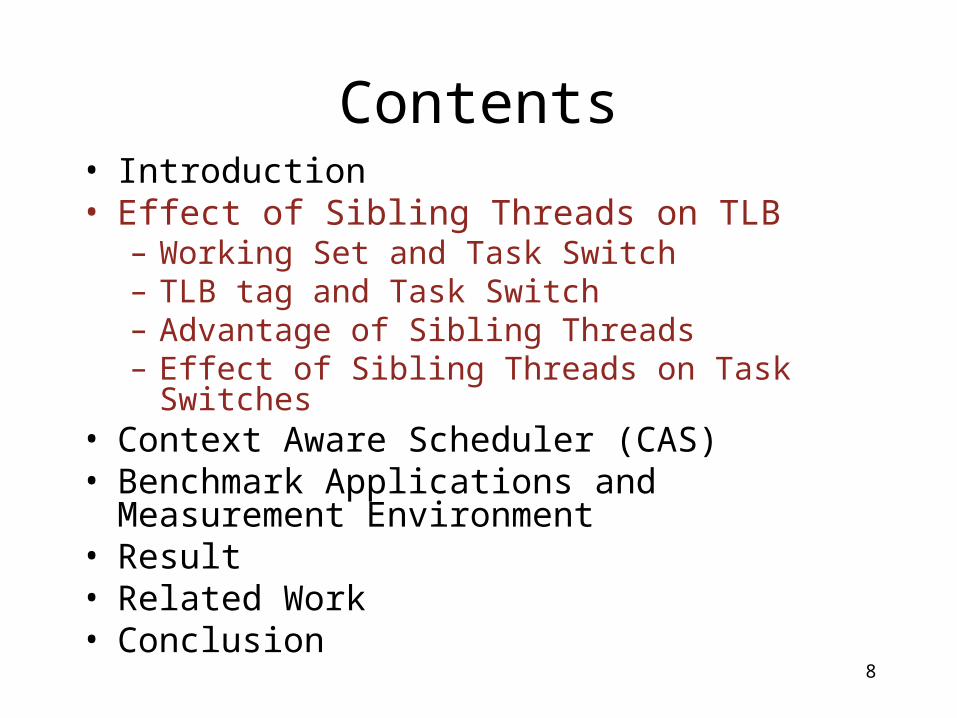
Contents
• Introduction• Effect of Sibling Threads on TLB• Context Aware Scheduler (CAS)• Benchmark Applications and Measurement
Environment• Result• Related Work• Conclusion
3
Contents• Introduction
– What is Context?– Motivation– Task Switch and Cache– Approach of our Scheduler
• Effect of Sibling Threads on TLB• Context Aware Scheduler (CAS)• Benchmark Applications and Measurement
Environment• Result• Related Work• Conclusion
4
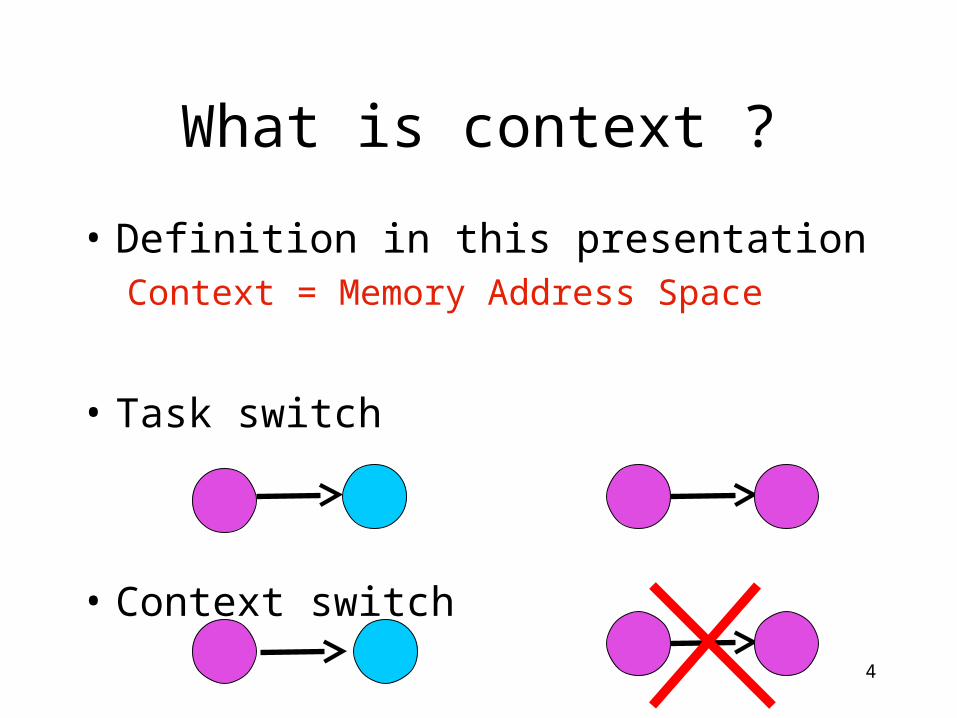
What is context ?
• Definition in this presentationContext = Memory Address Space
• Task switch
• Context switch
5
Motivation
• More chances of using native threads in OS today– Java, Perl, Python, Erlang, and Ruby– OpenMP, MPI
• The more threads increase, the heavier the overhead due to a task switch tends to get– Agarwal, et al. “Cache performance of operating system and multiprogramming workloads” (1
988)
6
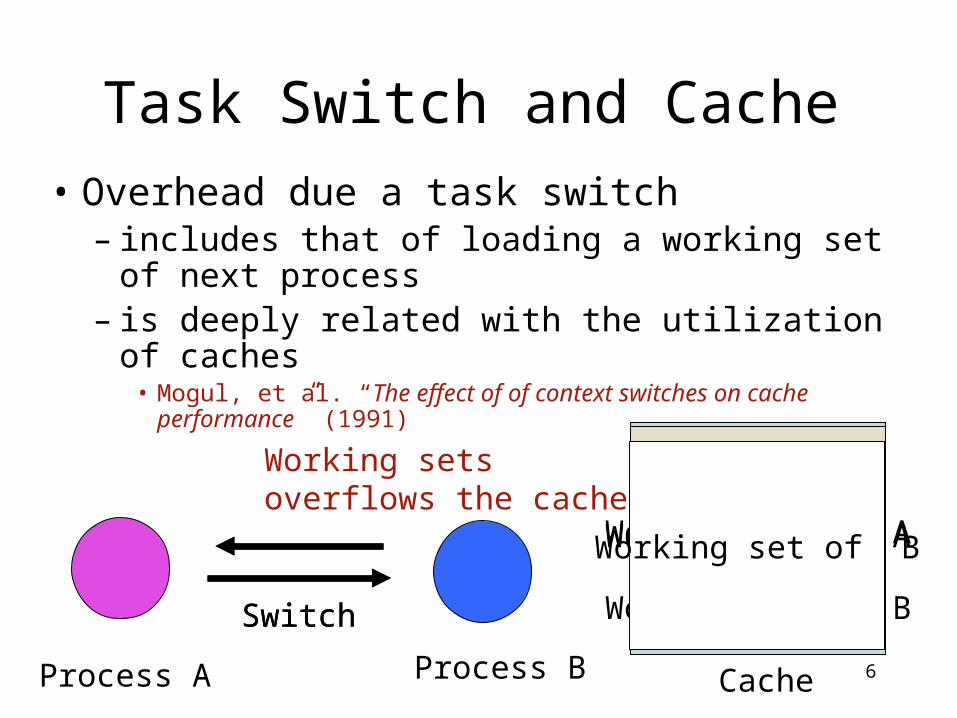
• Overhead due a task switch– includes that of loading a working set of next
process– is deeply related with the utilization of caches
• Mogul, et al. “The effect of of context switches on cache performance” (1991)
Task Switch and Cache
Process A Process B
Working set of A
Cache
Switch
Working set of A
Working set of BSwitch
Working setsoverflows the cache
Working set of B
7
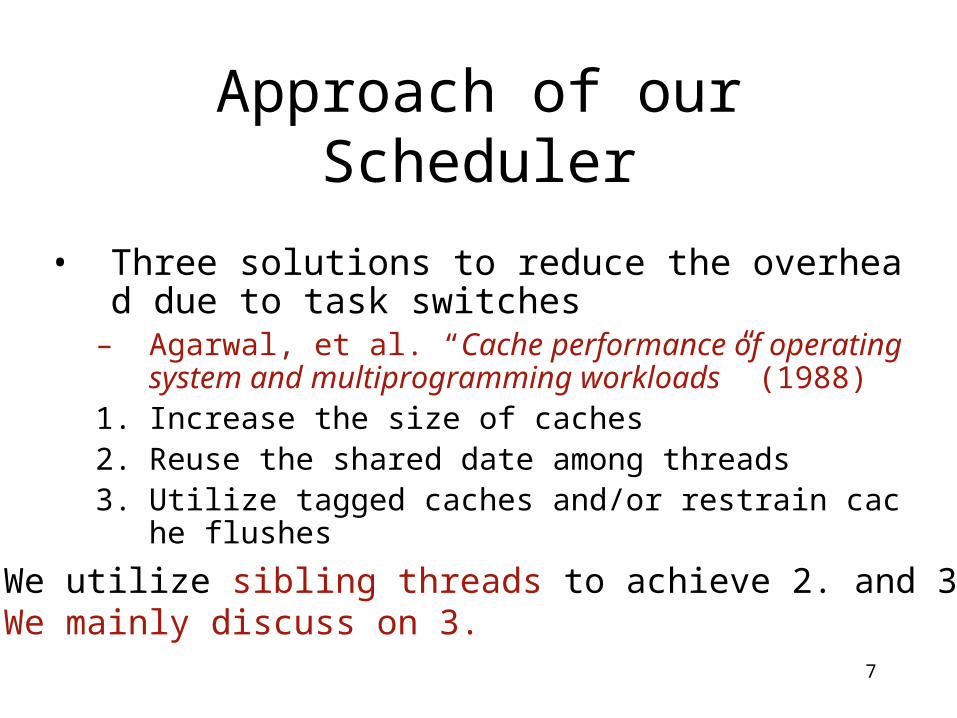
Approach of our Scheduler
• Three solutions to reduce the overhead due to task switches
– Agarwal, et al. “Cache performance of operating system and multiprogramming workloads” (1988)
1. Increase the size of caches2. Reuse the shared date among threads3. Utilize tagged caches and/or restrain cache flushes
* We utilize sibling threads to achieve 2. and 3. * We mainly discuss on 3.
8
Contents• Introduction• Effect of Sibling Threads on TLB
– Working Set and Task Switch– TLB tag and Task Switch– Advantage of Sibling Threads– Effect of Sibling Threads on Task Switches
• Context Aware Scheduler (CAS)• Benchmark Applications and Measurement
Environment• Result• Related Work• Conclusion
9
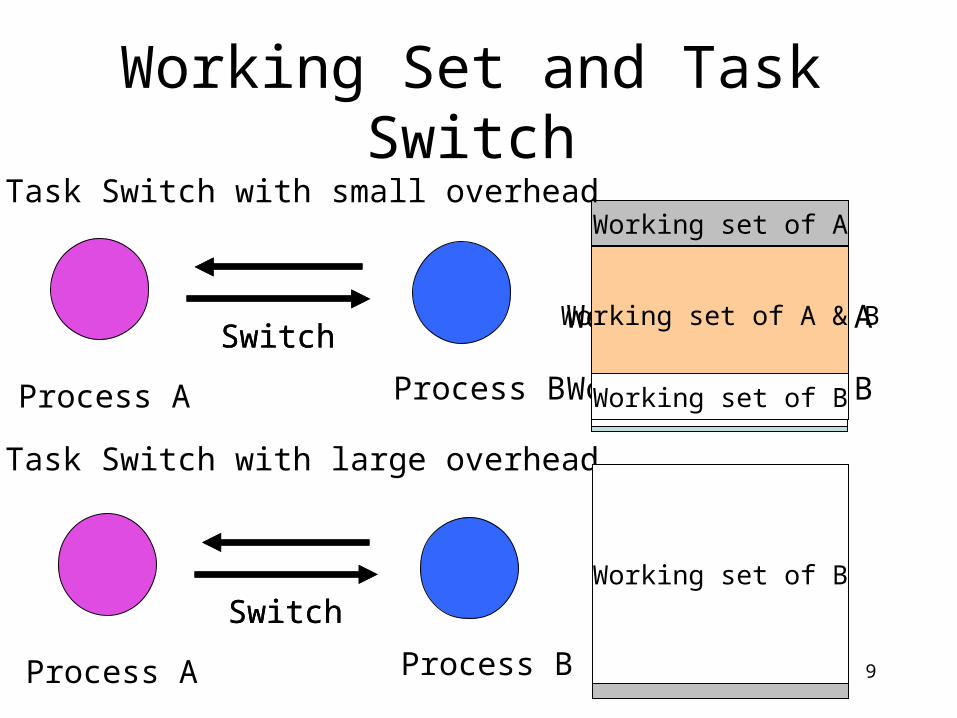
Cache
Working Set and Task Switch
Working set of A
Working set of B
Working set of A
Working set of A & B
Working set of B
Task Switch with small overhead
Task Switch with large overhead
Cache
Working set of AWorking set of B
Process A Process B
SwitchSwitch
Process A Process B
SwitchSwitch
10
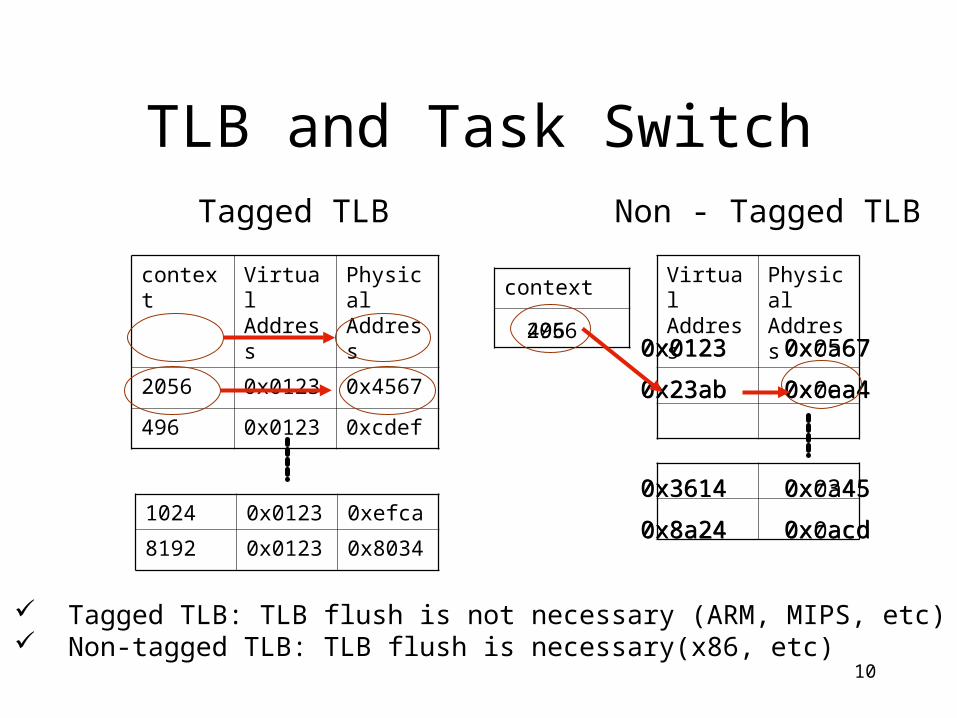
TLB and Task Switch
context Virtual Address
Physical Address
2056 0x0123 0x4567
496 0x0123 0xcdef
1024 0x0123 0xefca
8192 0x0123 0x8034
Virtual Address
Physical Address
Tagged TLB Non - Tagged TLB
Tagged TLB: TLB flush is not necessary (ARM, MIPS, etc) Non-tagged TLB: TLB flush is necessary(x86, etc)
0x0123 0xc567
0x23ab 0xcea4
0x3614 0xc345
0x8a24 0xcacd
0x0123 0x0a67
0x23ab 0x0aa4
0x3614 0x0a45
0x8a24 0x0acd
context
2056496
11
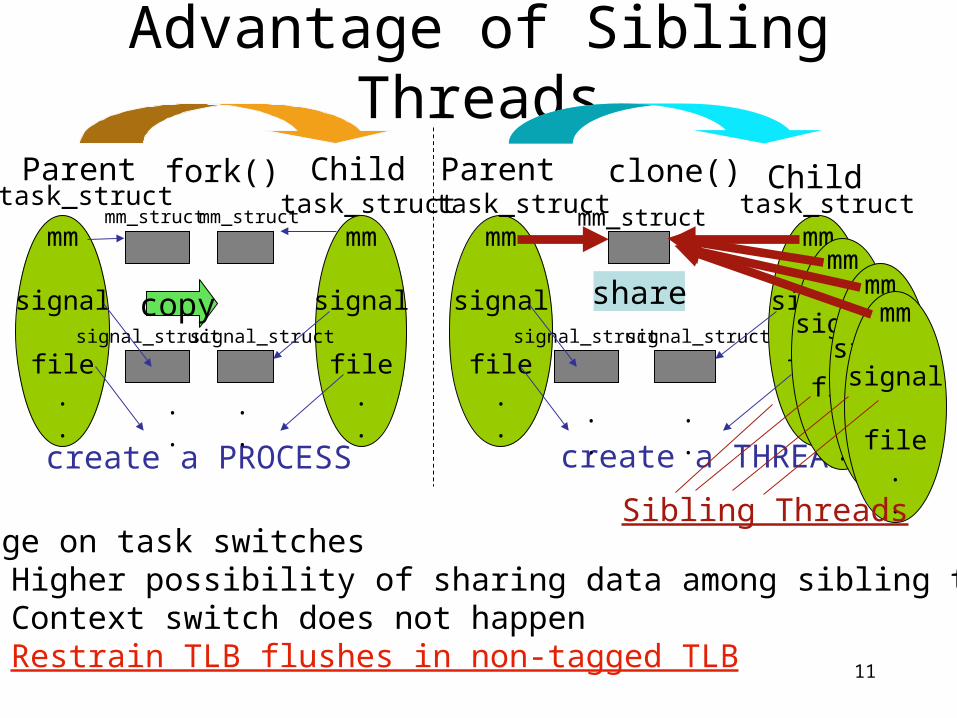
Advantage of Sibling Threads
mm
signal
file..
mm
signal
file..
fork()mm_struct
signal_struct
task_struct
create a PROCESS create a THREAD
task_struct
signal_struct
.
.
Advantage on task switches• Higher possibility of sharing data among sibling threads• Context switch does not happen• Restrain TLB flushes in non-tagged TLB
Parent Parenttask_struct
mm
signal
file..
copy
mm_struct
signal_struct
.
.
Child
mm
signal
file..
share
clone()mm_struct task_struct
signal_struct
.
...
Child
mm
signal
file..
mm
signal
file..
mm
signal
file..Sibling Threads
12
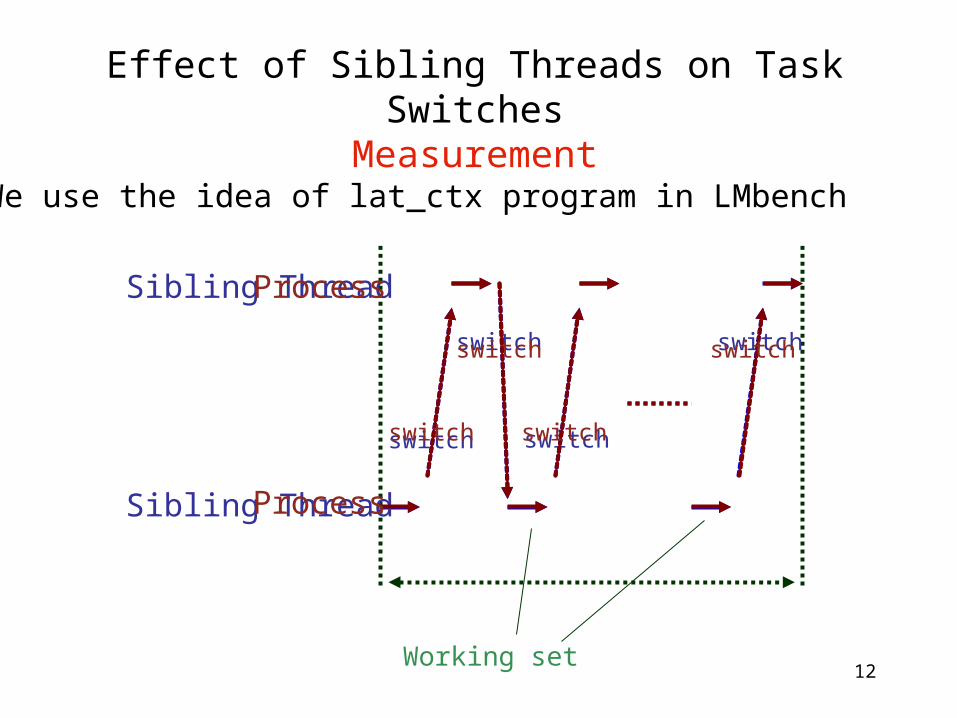
Effect of Sibling Threads on Task SwitchesMeasurement
Working set
Sibling Thread
switch
switch
switch
switch
Sibling Thread
Process
switch
switch
switch
switch
Process
We use the idea of lat_ctx program in LMbench
13
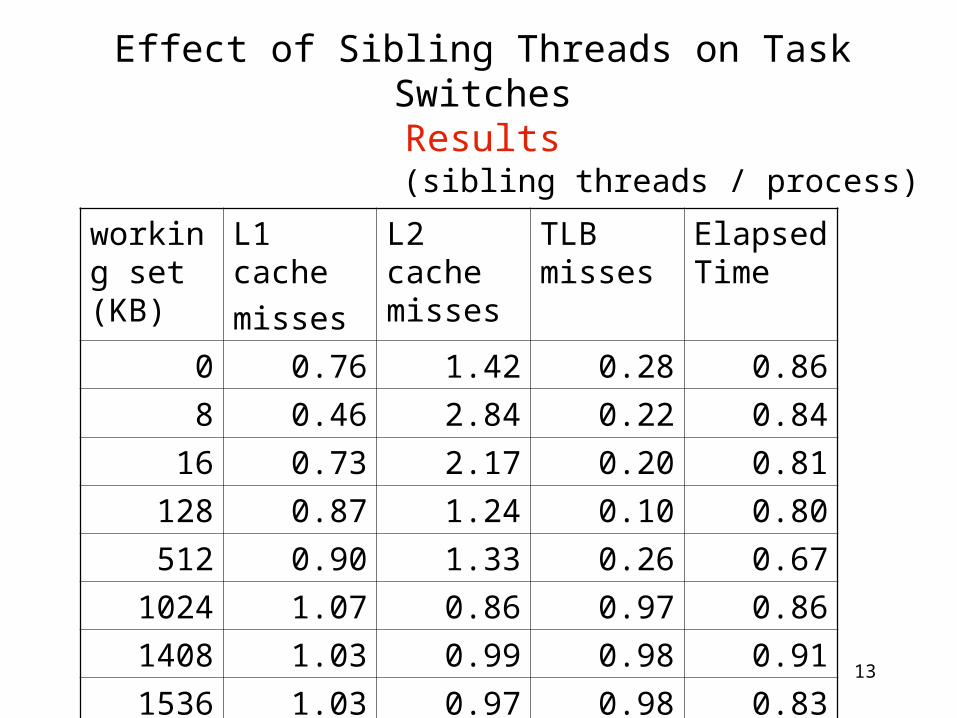
Effect of Sibling Threads on Task SwitchesResults
working set (KB)
L1 cache
misses
L2 cache misses
TLB misses
Elapsed Time
0 0.76 1.42 0.28 0.86
8 0.46 2.84 0.22 0.8416 0.73 2.17 0.20 0.81
128 0.87 1.24 0.10 0.80512 0.90 1.33 0.26 0.67
1024 1.07 0.86 0.97 0.861408 1.03 0.99 0.98 0.911536 1.03 0.97 0.98 0.83
(sibling threads / process)
14
Contents• Introduction• Effect of Sibling Threads on TLB• Context Aware Scheduler (CAS)
– O(1) Scheduler in Linux– Context Aware Scheduler (CAS)
• Benchmark Applications and Measurement Environment
• Result• Related Work• Conclusion
15
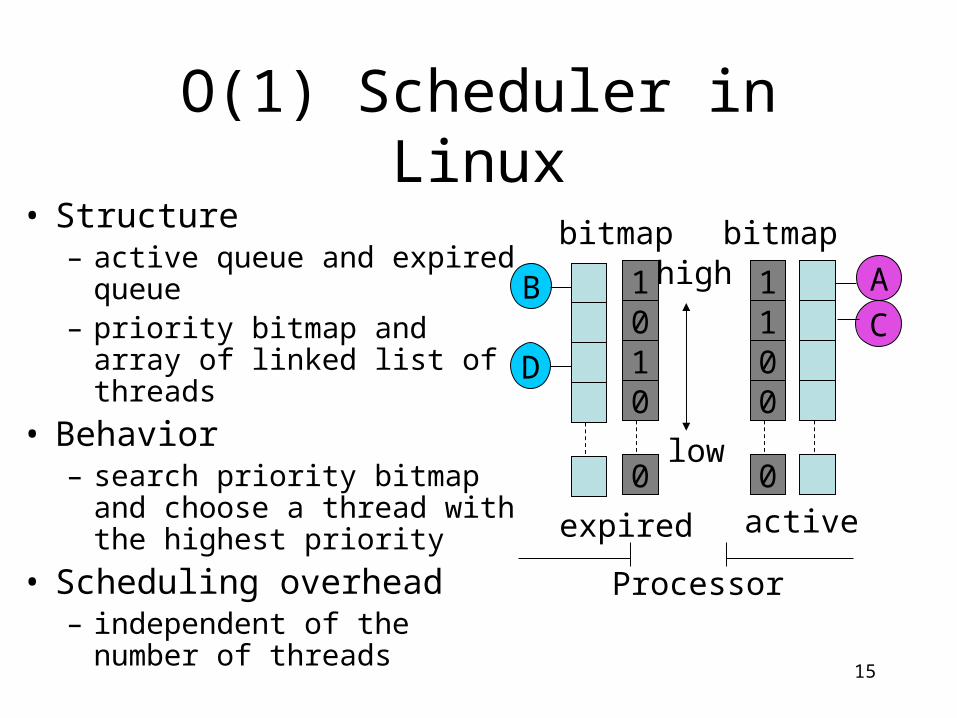
O(1) Scheduler in Linux
• Structure– active queue and expired
queue– priority bitmap and array of
linked list of threads
• Behavior – search priority bitmap and
choose a thread with the highest priority
• Scheduling overhead– independent of the number of
threads
A
C1100
0
B
D
1010
0
expired active
Processor
bitmaphigh
low
bitmap
16
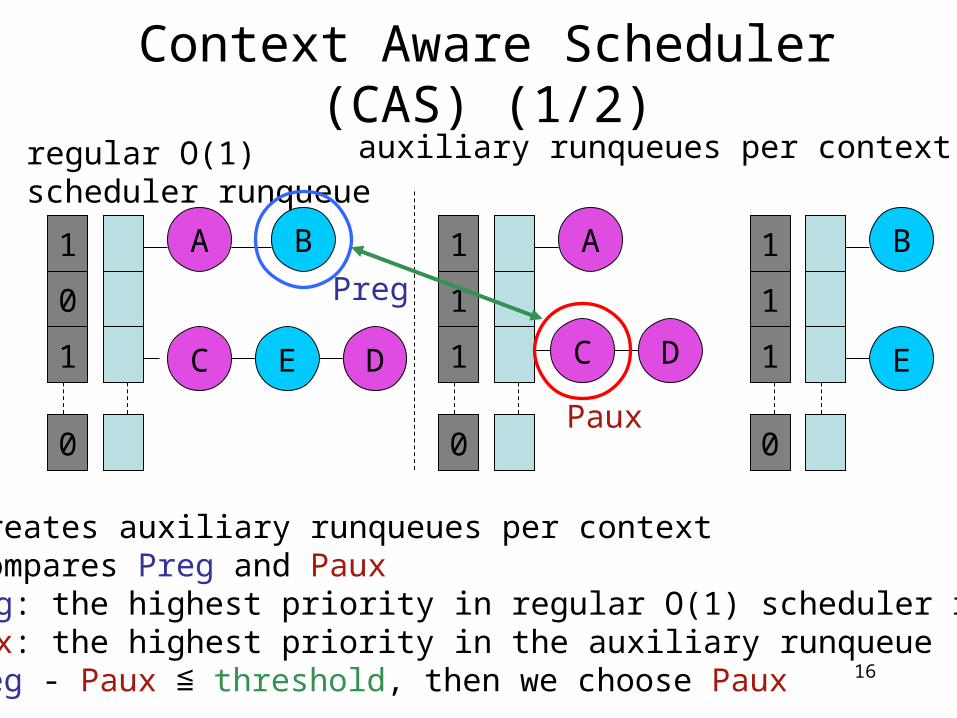
Context Aware Scheduler (CAS) (1/2)
• CAS creates auxiliary runqueues per context• CAS compares Preg and Paux
• Preg: the highest priority in regular O(1) scheduler runqueue• Paux: the highest priority in the auxiliary runqueue
• if Preg - Paux ≦ threshold, then we choose Paux
A
C D
B
E
1
0
1
0
regular O(1) scheduler runqueue
A
C D
1
1
1
0
B
E
1
1
1
0
auxiliary runqueues per context
Preg
Paux
17
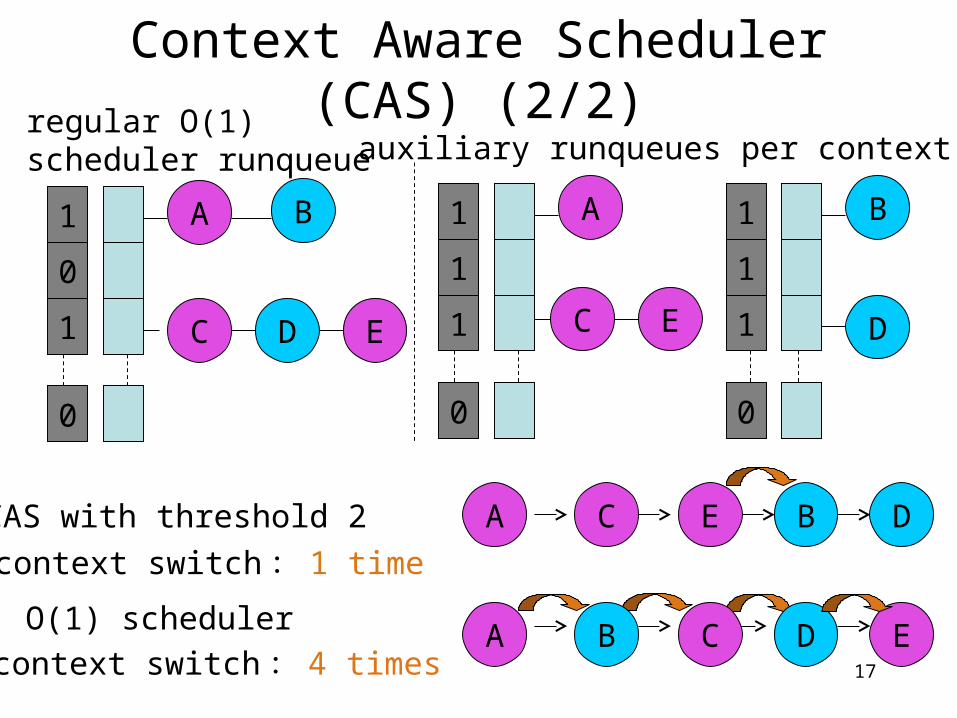
O(1) scheduler
context switch: 4 times
context switch: 1 time
CAS with threshold 2
A
C E
B
D
1
0
1
0
A
C E
1
1
1
0
B
D
1
1
1
0
regular O(1) scheduler runqueue auxiliary runqueues per context
A B C D E
A C E B D
Context Aware Scheduler (CAS) (2/2)
18
Contents• Introduction• Effect of Sibling Threads on TLB• Context Aware Scheduler (CAS)• Benchmark Applications and Measurement
Environment– Measurement Environment– Benchmarks– Measurements– Scheduler
• Result• Related Work• Conclusion
19
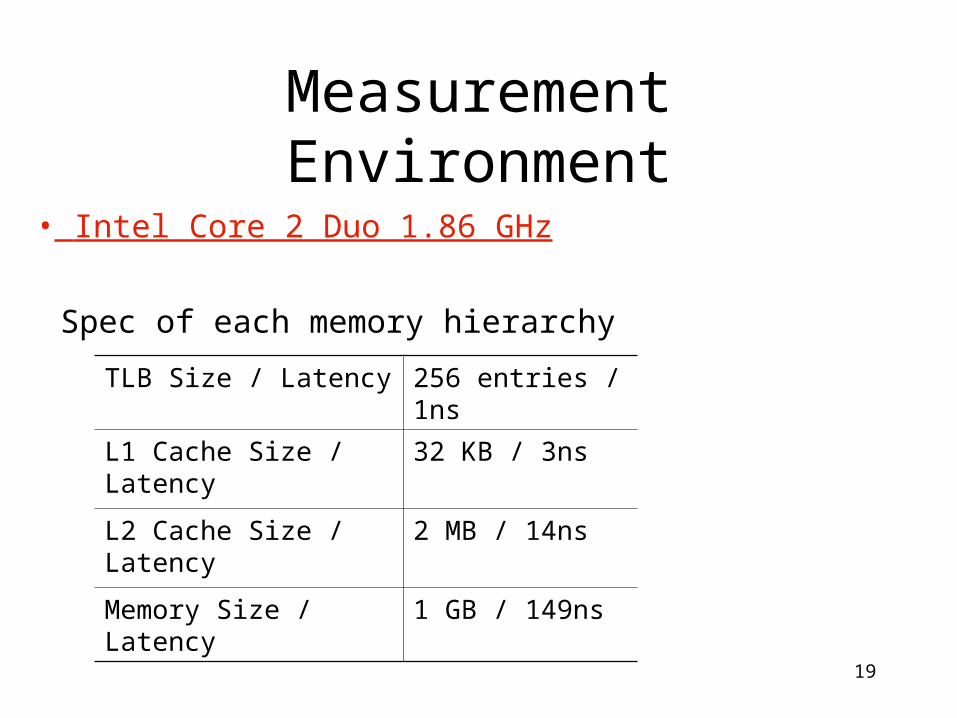
Measurement Environment
TLB Size / Latency 256 entries / 1ns
L1 Cache Size / Latency 32 KB / 3ns
L2 Cache Size / Latency 2 MB / 14ns
Memory Size / Latency 1 GB / 149ns
• Intel Core 2 Duo 1.86 GHz
Spec of each memory hierarchy
20
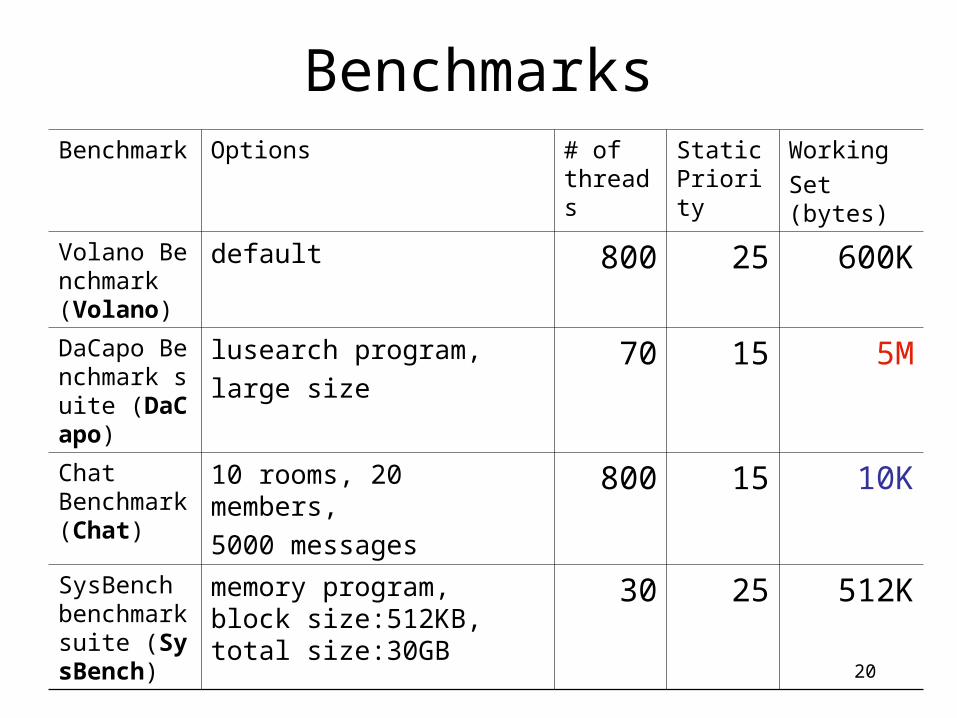
BenchmarksBenchmark Options # of
threadsStatic Priority
Working
Set (bytes)
Volano Benchmark (Volano)
default 800 25 600K
DaCapo Benchmark suite (DaCapo)
lusearch program,
large size70 15 5M
Chat Benchmark (Chat)
10 rooms, 20 members,
5000 messages800 15 10K
SysBench benchmark suite (SysBench)
memory program, block size:512KB, total size:30GB
30 25 512K
21
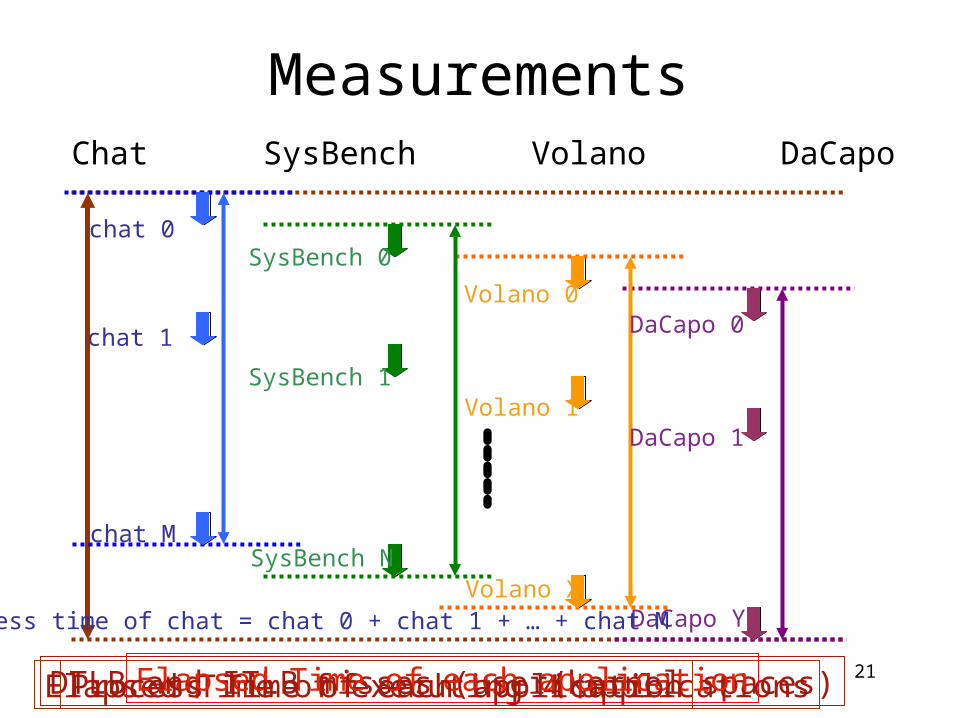
MeasurementsChat SysBench Volano DaCapo
DTLB and ITLB misses (user/kernel spaces)Elapsed Time of executing 4 applicationsElapsed Time of each application
chat 0
chat 1
chat M
SysBench 0
SysBench 1
SysBench N
Volano 0
Volano 1
Volano X
DaCapo 0
DaCapo 1
DaCapo Y
Process Time of each application
process time of chat = chat 0 + chat 1 + … + chat M
22
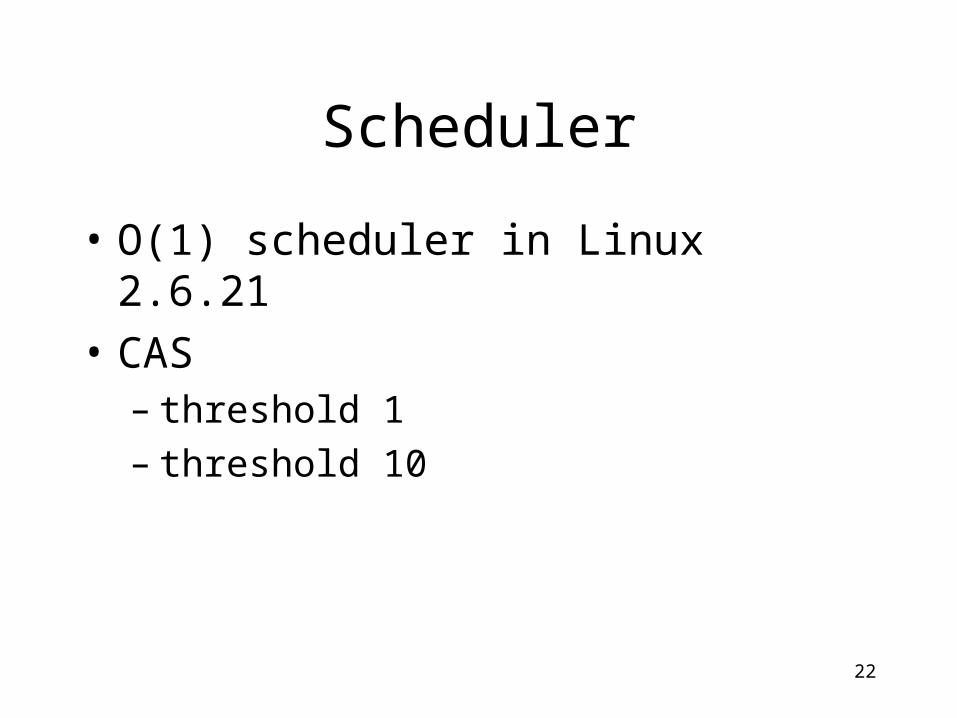
Scheduler
• O(1) scheduler in Linux 2.6.21
• CAS– threshold 1– threshold 10
23
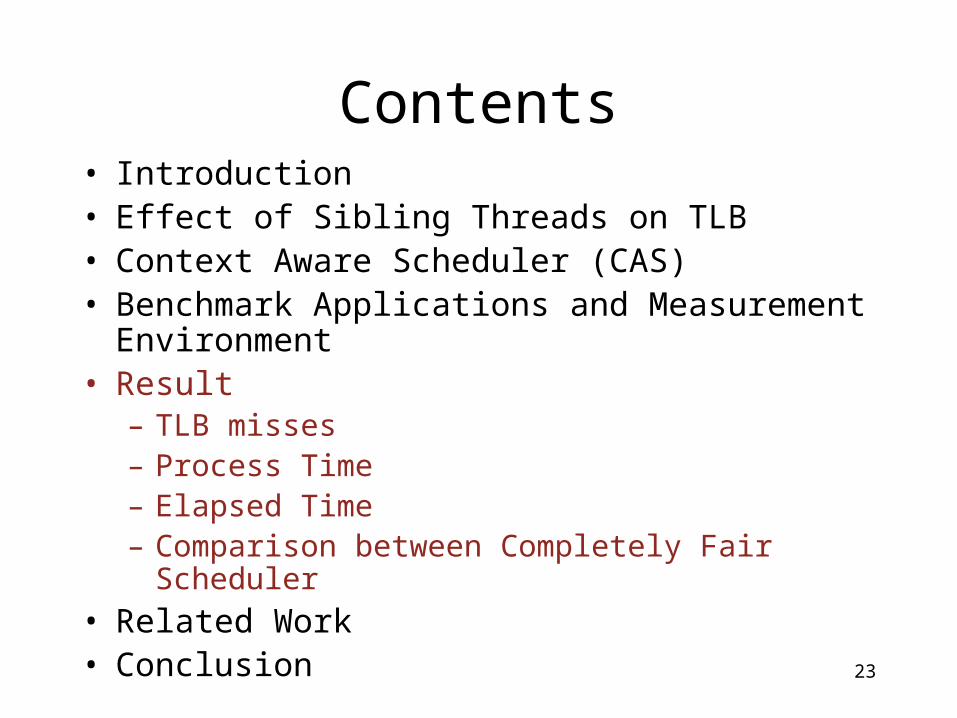
Contents• Introduction• Effect of Sibling Threads on TLB• Context Aware Scheduler (CAS)• Benchmark Applications and Measurement
Environment• Result
– TLB misses– Process Time– Elapsed Time– Comparison between Completely Fair Scheduler
• Related Work• Conclusion
24
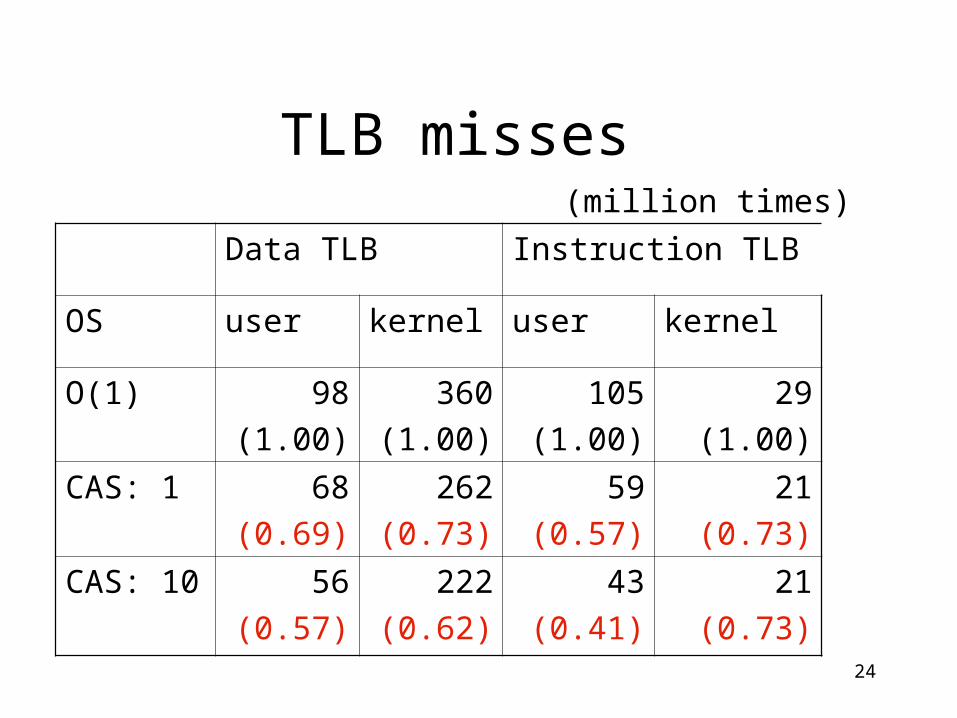
TLB misses
Data TLB Instruction TLB
OS user kernel user kernel
O(1) 98
(1.00)
360
(1.00)
105
(1.00)
29
(1.00)
CAS: 1 68
(0.69)
262
(0.73)
59
(0.57)
21
(0.73)
CAS: 10 56
(0.57)
222
(0.62)
43
(0.41)
21
(0.73)
(million times)
25
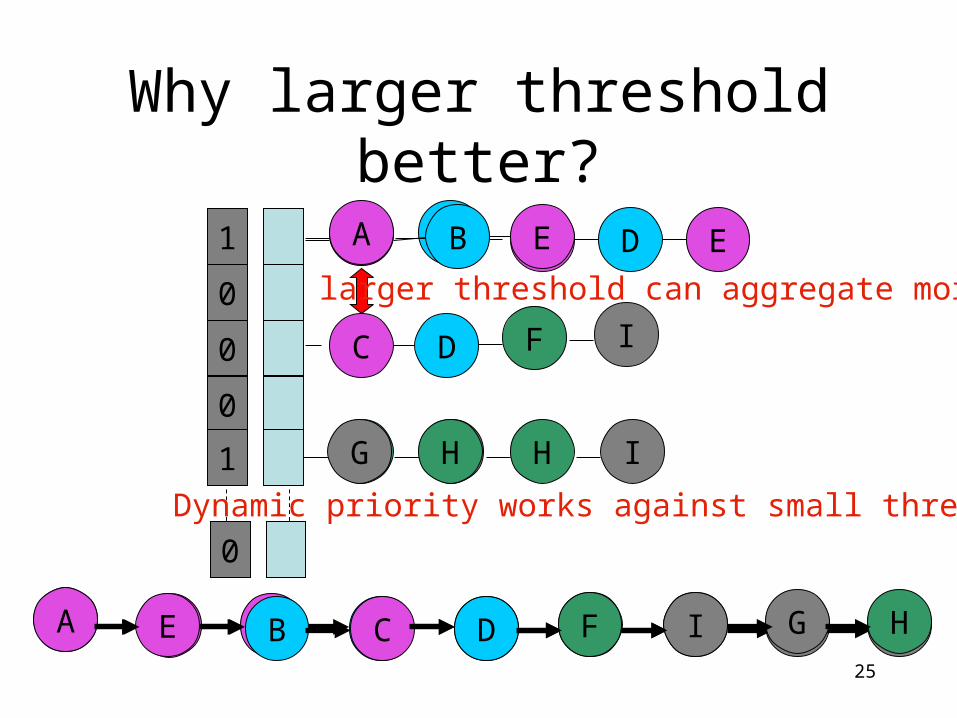
Why larger threshold better?
1
0
0
0
0
A C EB D
F G H I
A C E B D F GH I
1
A
DC
E
F
G H
I
B
A CE B D F G HI
larger threshold can aggregate more
Dynamic priority works against small threshold
26
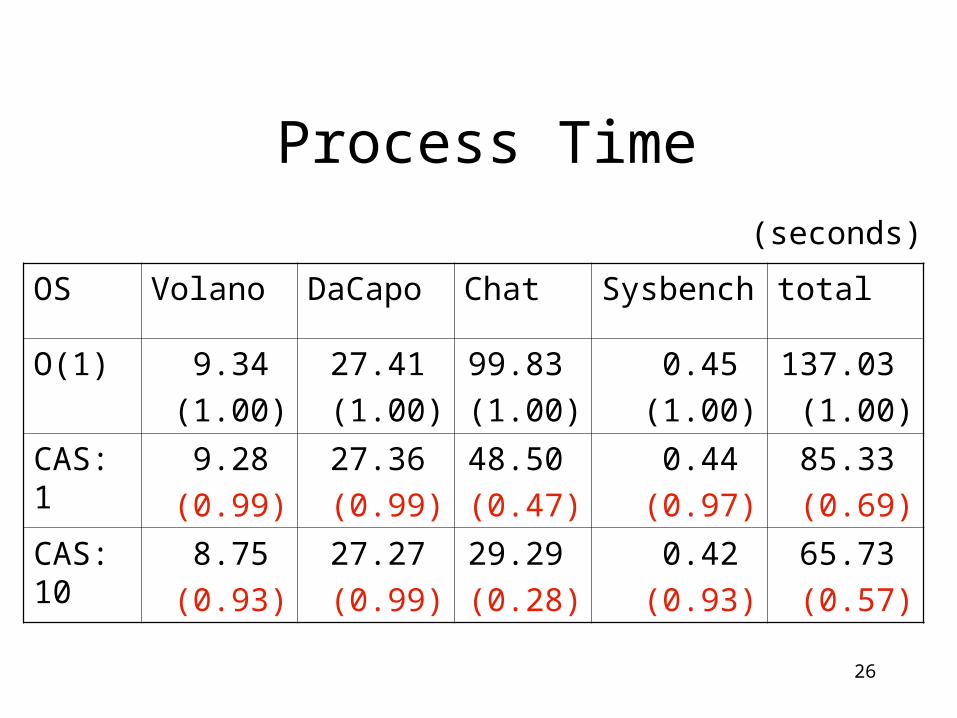
Process Time
OS Volano DaCapo Chat Sysbench total
O(1) 9.34
(1.00)
27.41
(1.00)
99.83
(1.00)
0.45
(1.00)
137.03
(1.00)
CAS: 1
9.28
(0.99)
27.36
(0.99)
48.50
(0.47)
0.44
(0.97)
85.33
(0.69)
CAS: 10
8.75
(0.93)
27.27
(0.99)
29.29
(0.28)
0.42
(0.93)
65.73
(0.57)
(seconds)
27
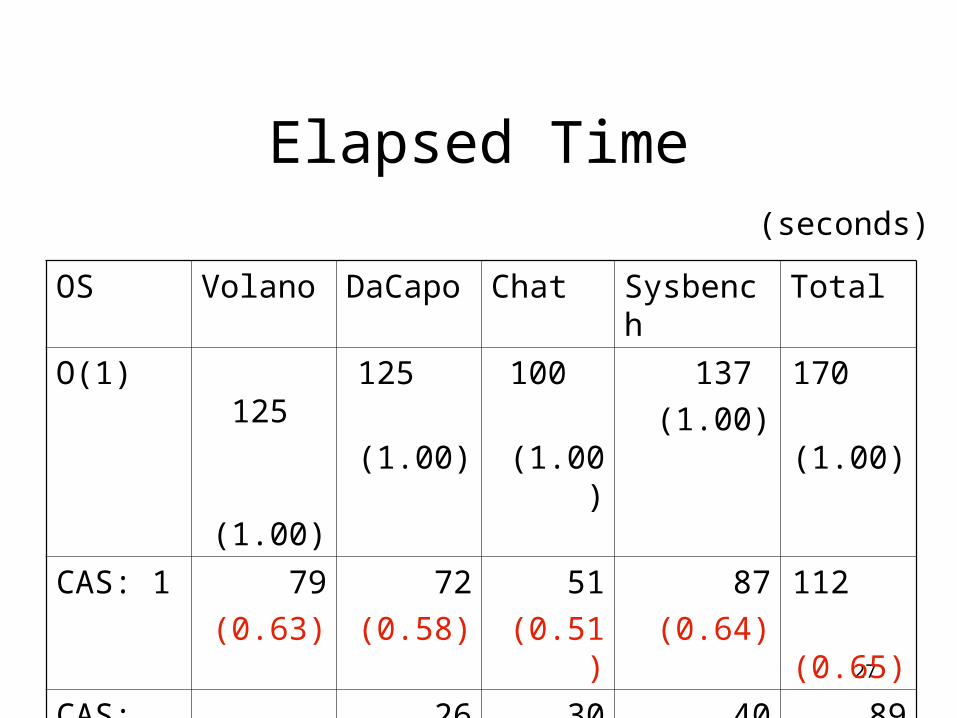
Elapsed Time
OS Volano DaCapo Chat Sysbench Total
O(1) 125
(1.00)
125
(1.00)
100
(1.00)
137
(1.00)
170
(1.00)
CAS: 1 79
(0.63)
72
(0.58)
51
(0.51)
87
(0.64)
112
(0.65)
CAS: 10 62
(0.50)
26
(0.21)
30
(0.31)
40
(0.30)
89
(0.52)
(seconds)
28
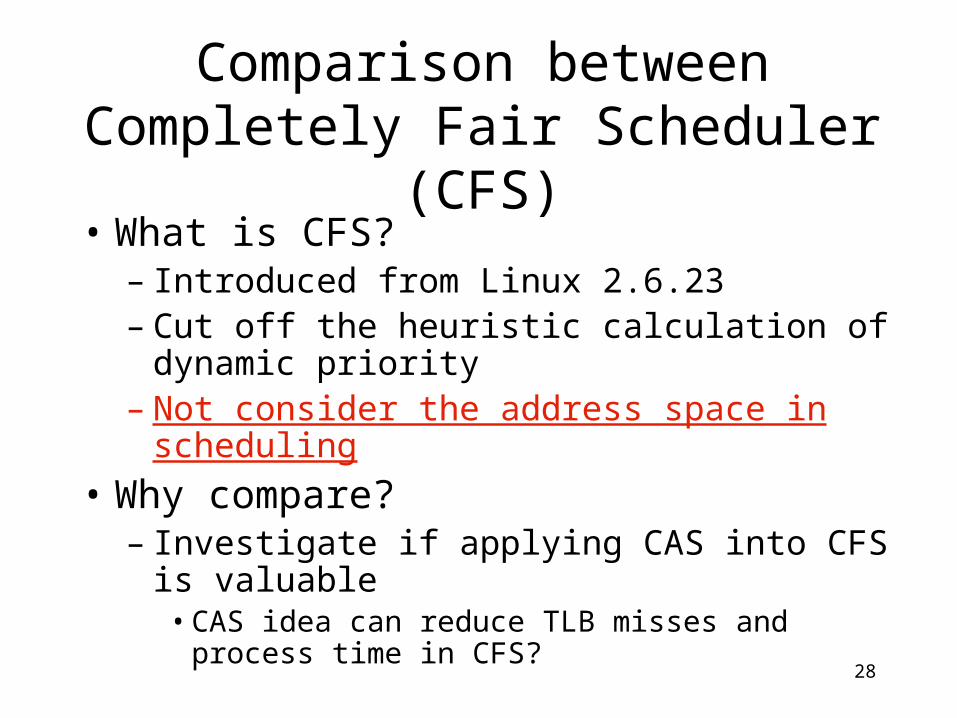
Comparison between Completely Fair Scheduler (CFS)
• What is CFS?– Introduced from Linux 2.6.23– Cut off the heuristic calculation of dynamic
priority– Not consider the address space in scheduling
• Why compare?– Investigate if applying CAS into CFS is
valuable• CAS idea can reduce TLB misses and process
time in CFS?
29
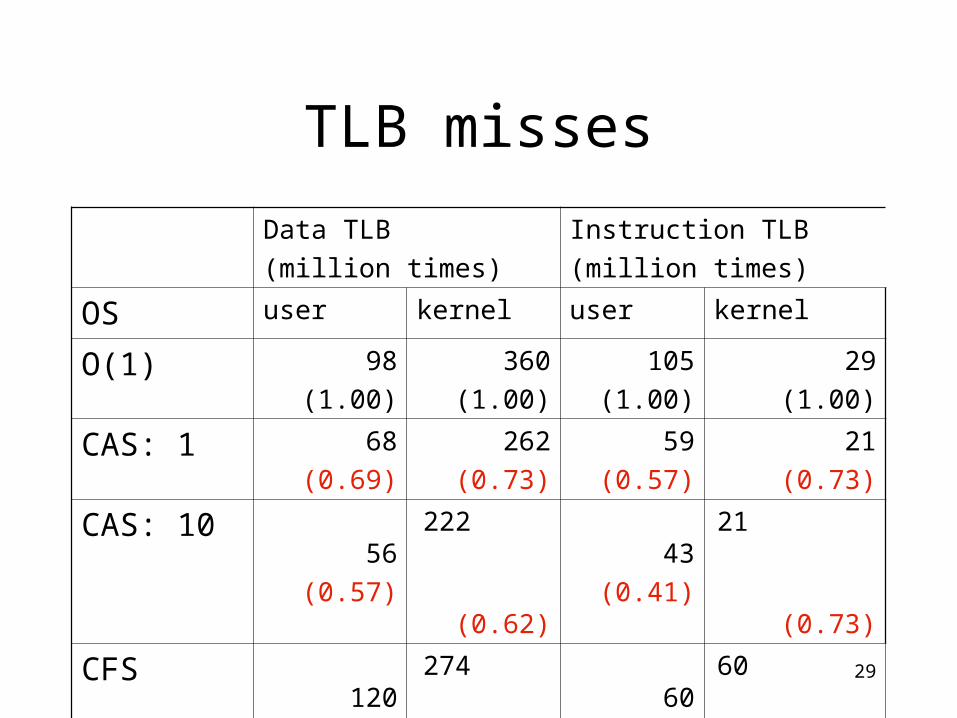
TLB misses
Data TLB
(million times)
Instruction TLB
(million times)
OS user kernel user kernel
O(1) 98
(1.00)
360
(1.00)
105
(1.00)
29
(1.00)
CAS: 1 68
(0.69)
262
(0.73)
59
(0.57)
21
(0.73)
CAS: 10 56
(0.57)
222
(0.62)
43
(0.41)
21
(0.73)
CFS 120
(1.23)
274
(0.76)
60
(0.57)
60
(0.80)
30
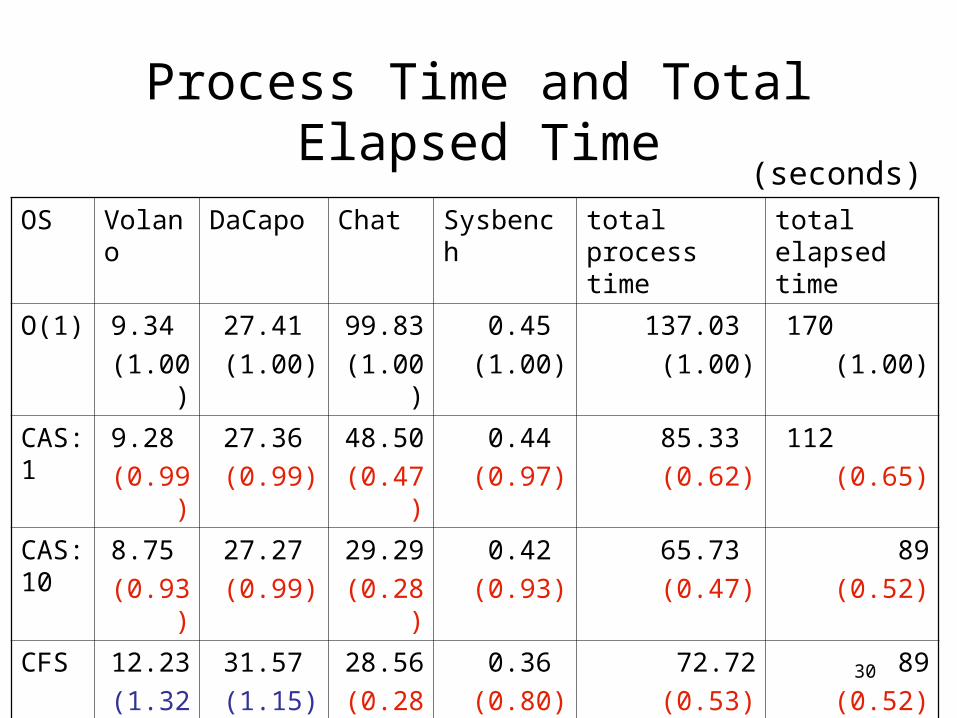
Process Time and Total Elapsed Time
OS Volano DaCapo Chat Sysbench total process time
total elapsed time
O(1) 9.34
(1.00)
27.41
(1.00)
99.83
(1.00)
0.45
(1.00)
137.03
(1.00)
170
(1.00)
CAS: 1
9.28
(0.99)
27.36
(0.99)
48.50
(0.47)
0.44
(0.97)
85.33
(0.62)
112
(0.65)
CAS: 10
8.75
(0.93)
27.27
(0.99)
29.29
(0.28)
0.42
(0.93)
65.73
(0.47)
89
(0.52)
CFS 12.23
(1.32)
31.57
(1.15)
28.56
(0.28)
0.36
(0.80)
72.72
(0.53)
89
(0.52)
(seconds)
31
Contents• Introduction• Effect of Sibling Threads on TLB• Context Aware Scheduler (CAS)• Benchmark Applications and Measurement
Environment• Result• Related Work• Conclusion
32
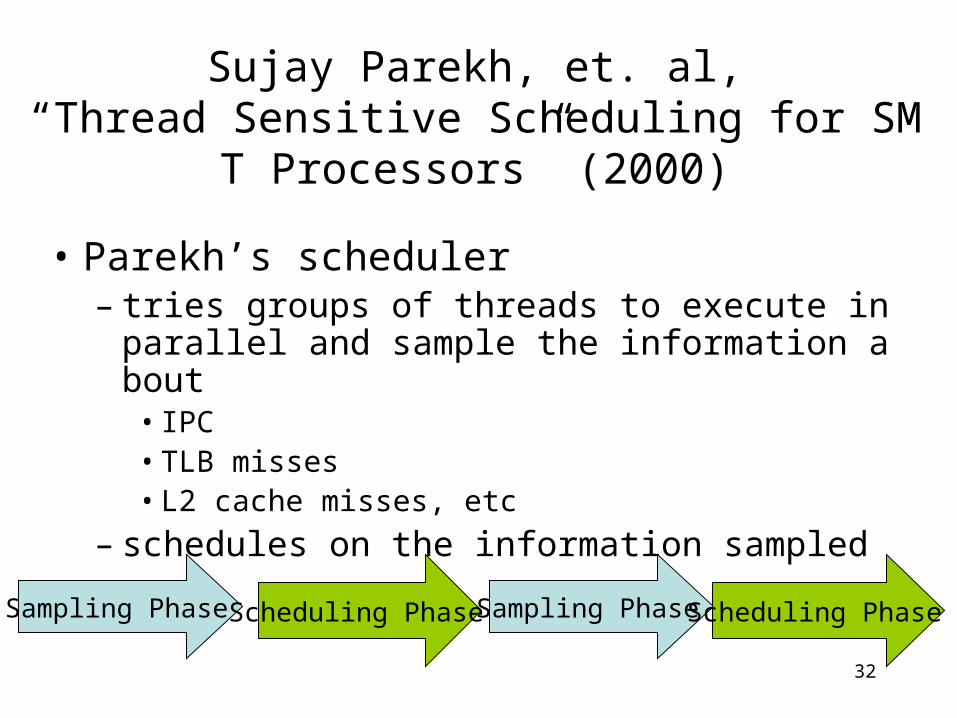
Sujay Parekh, et. al,“Thread Sensitive Scheduling for SMT Process
ors” (2000)
• Parekh’s scheduler– tries groups of threads to execute in parallel a
nd sample the information about• IPC• TLB misses• L2 cache misses, etc
– schedules on the information sampled
Sampling Phase Scheduling Phase Sampling Phase Scheduling Phase
33
Contents• Introduction• Effect of Sibling Threads on TLB• Context Aware Scheduler (CAS)• Benchmark Applications and Measurement
Environment• Result• Related Work• Conclusion
34
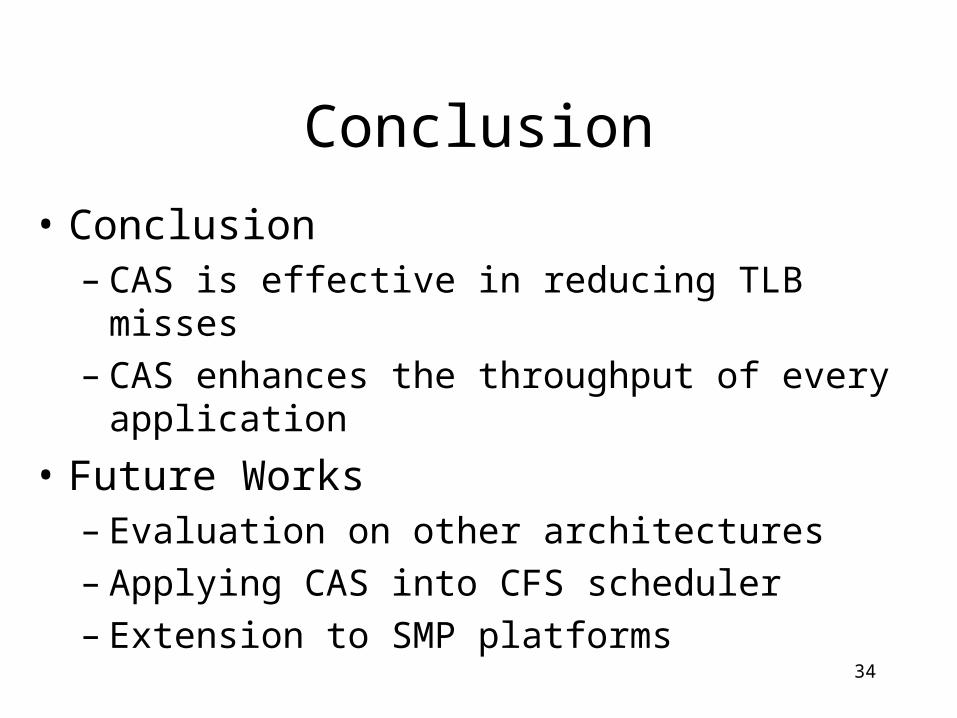
Conclusion
• Conclusion– CAS is effective in reducing TLB misses– CAS enhances the throughput of every
application
• Future Works– Evaluation on other architectures– Applying CAS into CFS scheduler– Extension to SMP platforms
35
additional slides
36
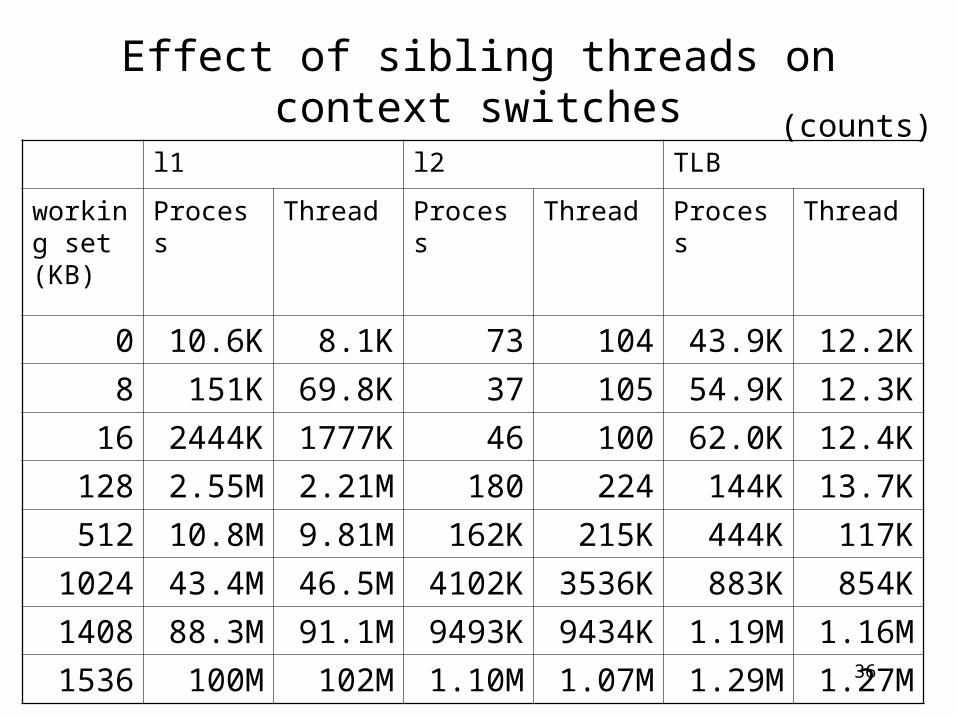
Effect of sibling threads on context switches
l1 l2 TLB
working set (KB)
Process Thread Process Thread Process Thread
0 10.6K 8.1K 73 104 43.9K 12.2K
8 151K 69.8K 37 105 54.9K 12.3K
16 2444K 1777K 46 100 62.0K 12.4K
128 2.55M 2.21M 180 224 144K 13.7K
512 10.8M 9.81M 162K 215K 444K 117K
1024 43.4M 46.5M 4102K 3536K 883K 854K
1408 88.3M 91.1M 9493K 9434K 1.19M 1.16M
1536 100M 102M 1.10M 1.07M 1.29M 1.27M
(counts)
37
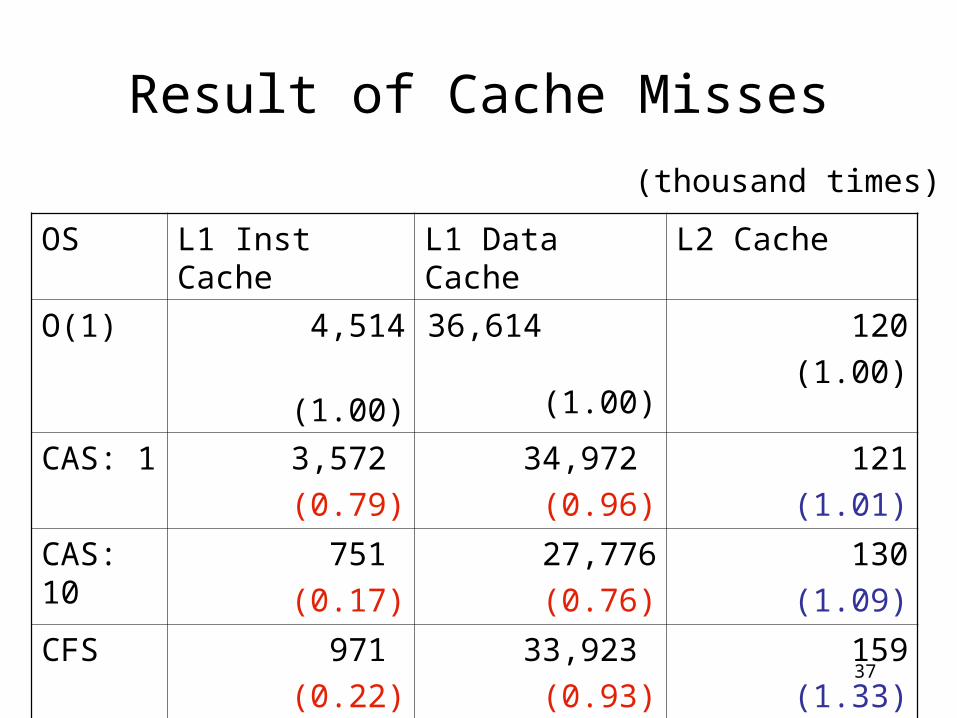
Result of Cache Misses
OS L1 Inst Cache L1 Data Cache L2 Cache
O(1) 4,514
(1.00)
36,614 (1.00)
120
(1.00)
CAS: 1 3,572
(0.79)
34,972
(0.96)
121
(1.01)
CAS: 10
751
(0.17)
27,776
(0.76)
130
(1.09)
CFS 971
(0.22)
33,923
(0.93)
159
(1.33)
(thousand times)
38
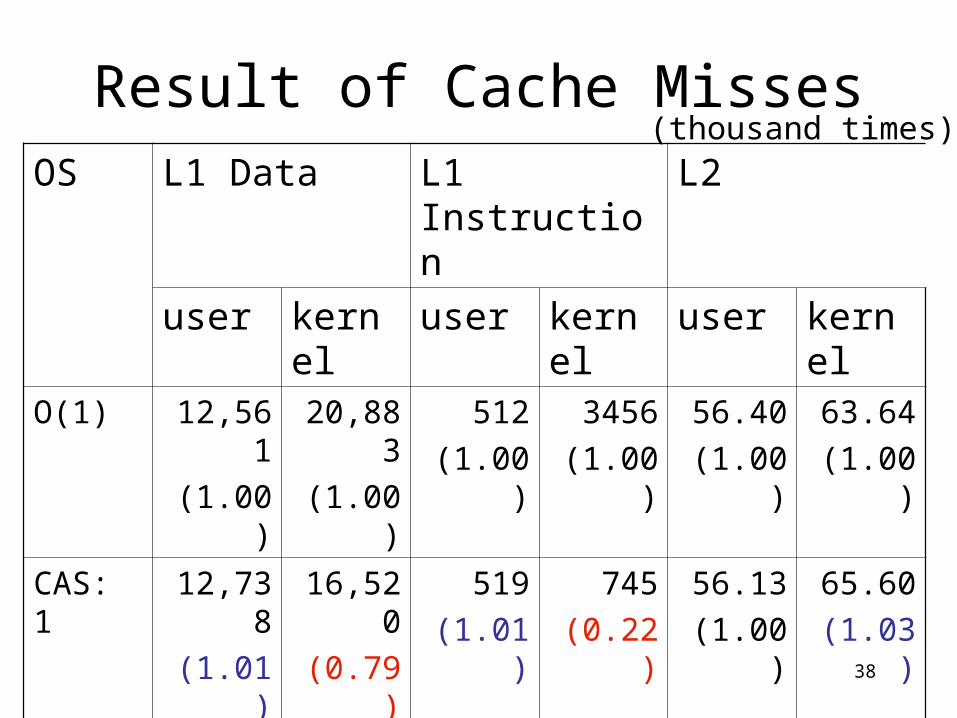
Result of Cache MissesOS L1 Data L1 Instruction L2
user kernel user kernel user kernel
O(1) 12,561
(1.00)
20,883
(1.00)
512
(1.00)
3456
(1.00)
56.40
(1.00)
63.64
(1.00)
CAS: 1 12,738
(1.01)
16,520
(0.79)
519
(1.01)
745
(0.22)
56.13
(1.00)
65.60
(1.03)
CAS: 10
11,601
(0.92)
14,872
(0.71)
446
(0.87)
282
(0.08)
54.70
(0.97)
76.26
(1.20)
CFS 14,785
(1.18)
15,840
(0.76)
355
(0.69)
365
(0.11)
82.64
(1.47)
77.16
(1.21)
(thousand times)
39
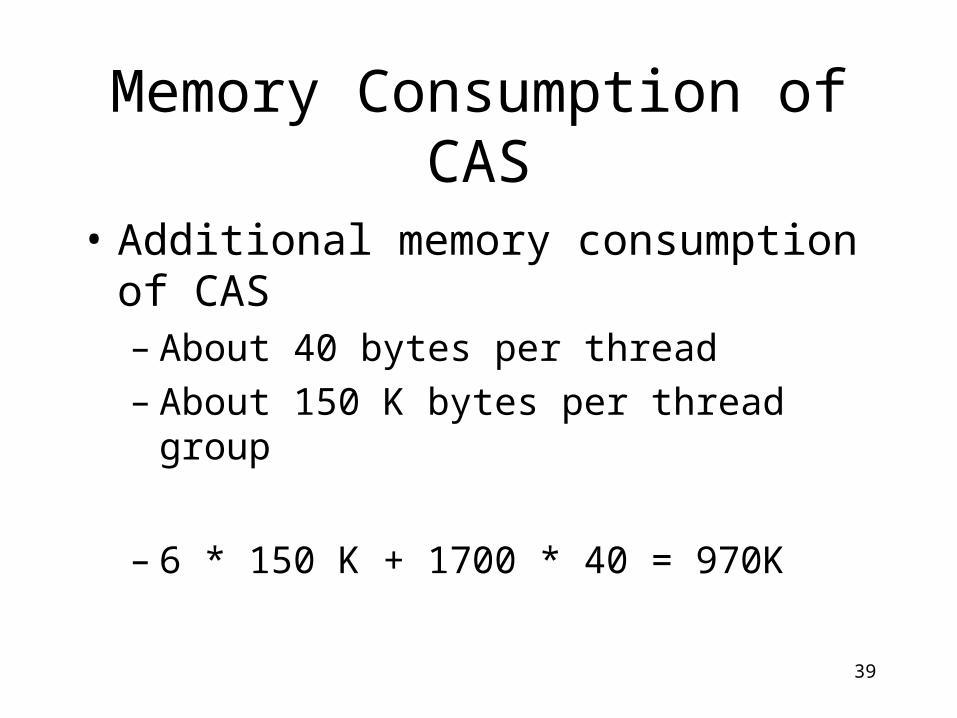
Memory Consumption of CAS
• Additional memory consumption of CAS– About 40 bytes per thread– About 150 K bytes per thread group
– 6 * 150 K + 1700 * 40 = 970K
40
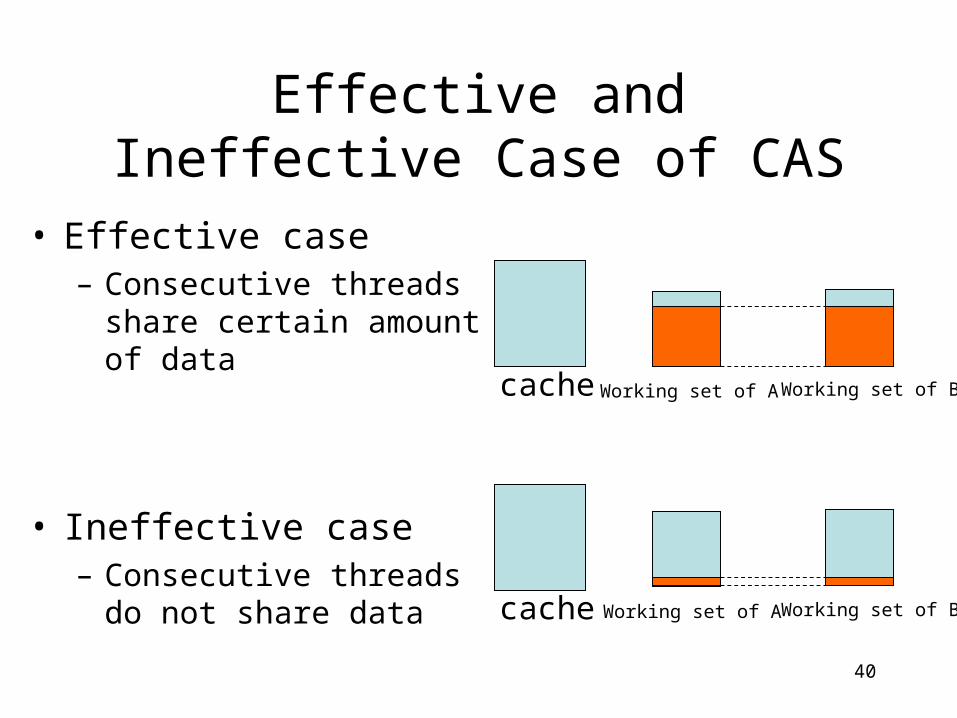
Effective and Ineffective Case of CAS
• Effective case– Consecutive threads
share certain amount of data
• Ineffective case– Consecutive threads do
not share data
cache Working set of A Working set of B
cache Working set of A Working set of B
41
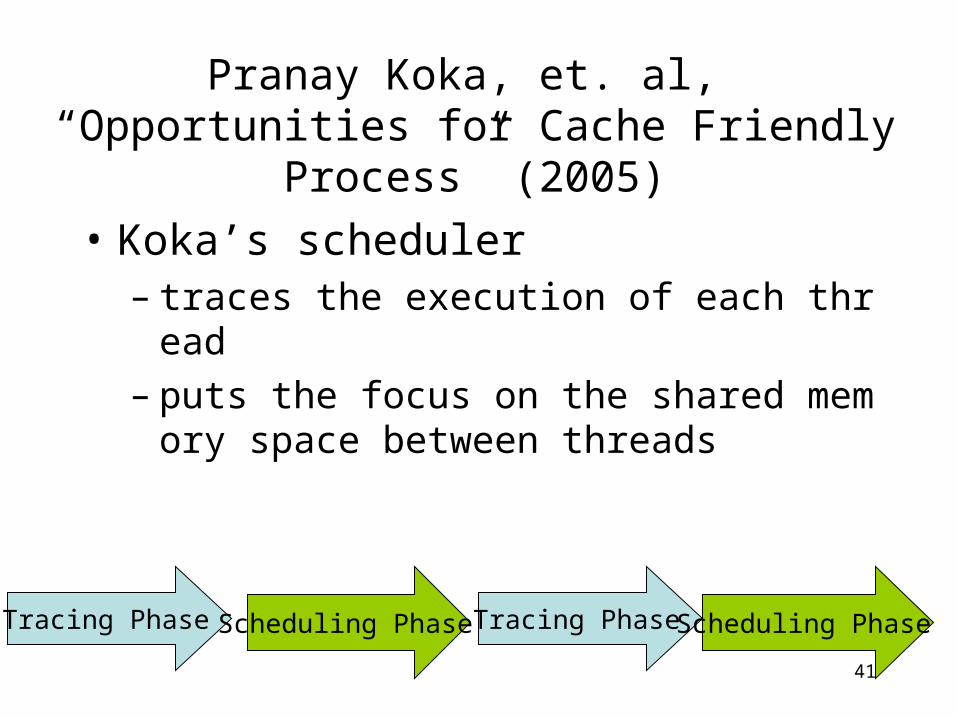
Pranay Koka, et. al, “Opportunities for Cache Friendly Process” (2
005)
• Koka’s scheduler– traces the execution of each thread– puts the focus on the shared memory spac
e between threads
Tracing Phase Scheduling Phase Tracing Phase Scheduling Phase
42
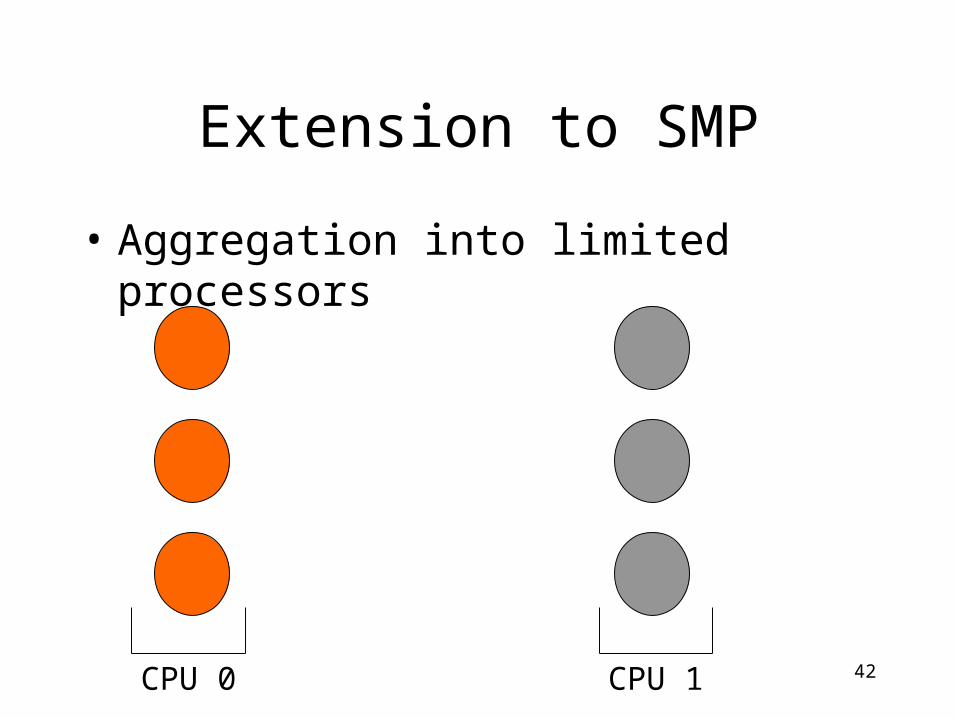
Extension to SMP
• Aggregation into limited processors
CPU 0 CPU 1
43
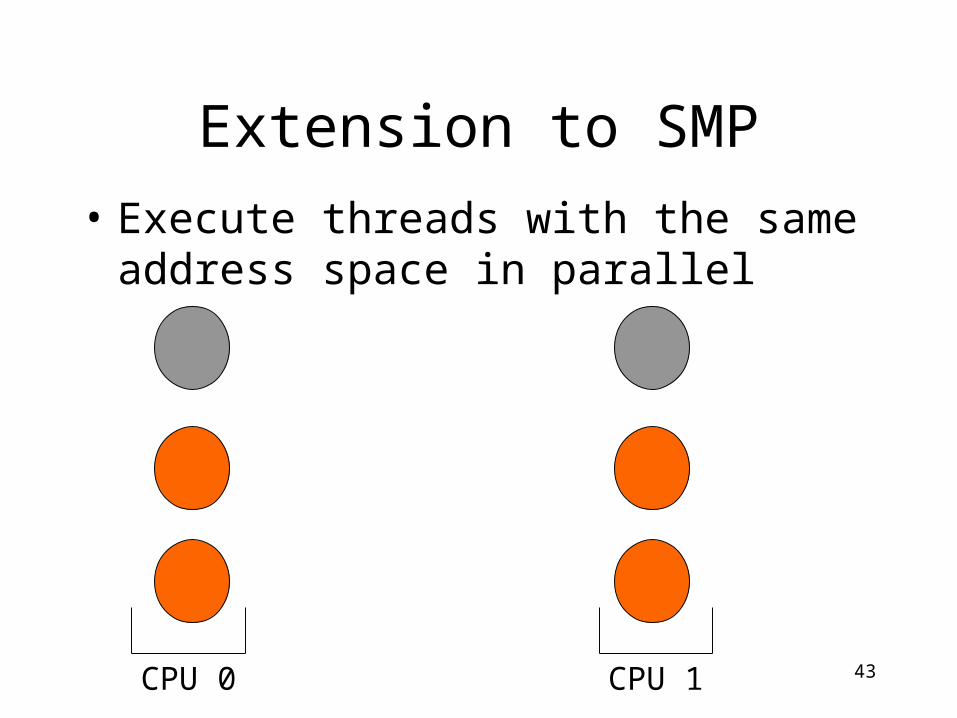
Extension to SMP
CPU 0 CPU 1
• Execute threads with the same address space in parallel
44
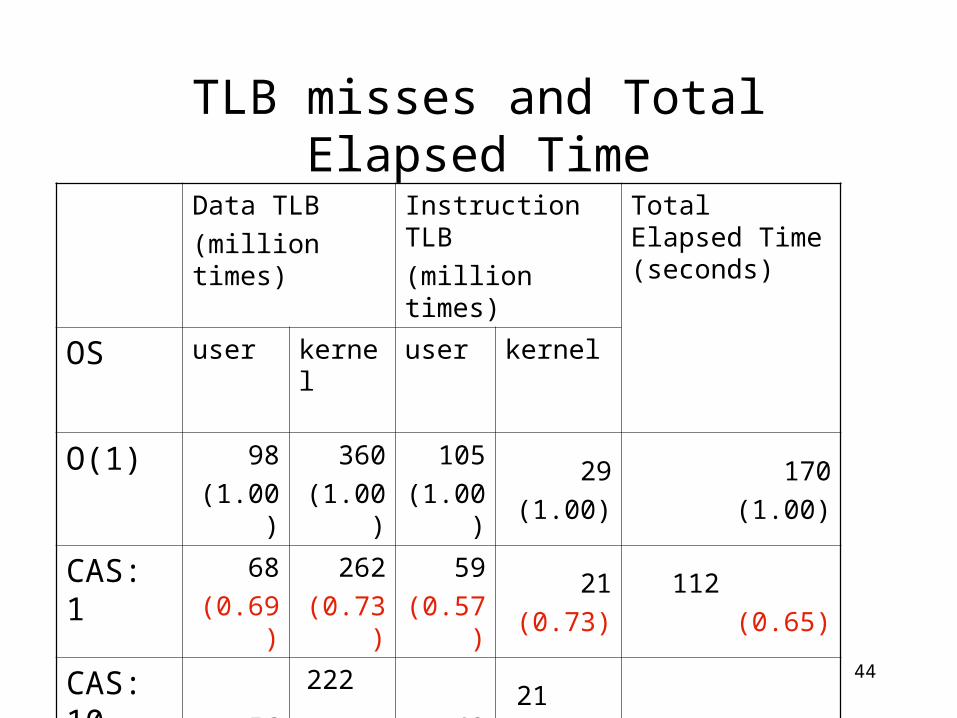
TLB misses and Total Elapsed Time
Data TLB
(million times)
Instruction TLB
(million times)
Total Elapsed Time (seconds)
OS user kernel user kernel
O(1) 98
(1.00)
360
(1.00)
105
(1.00)
29
(1.00)
170
(1.00)
CAS: 1 68
(0.69)
262
(0.73)
59
(0.57)
21
(0.73)
112
(0.65)
CAS: 10
56
(0.57)
222
(0.62)
43
(0.41)
21
(0.73)
89
(0.52)
CFS 120
(1.23)
274
(0.76)
60
(0.57)
60
(0.80)
89
(0.52)

45
46
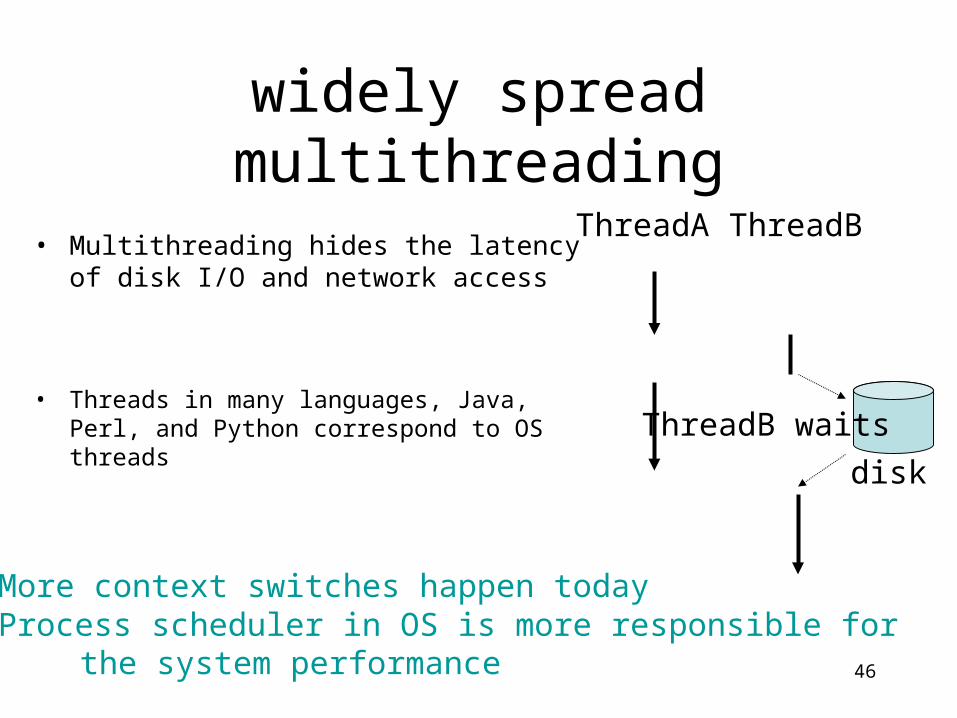
widely spread multithreading
• Multithreading hides the latency of disk I/O and network access
• Threads in many languages, Java, Perl, and Python correspond to OS threads
ThreadA ThreadB
disk
* More context switches happen today* Process scheduler in OS is more responsible for the system performance
ThreadB waits
47
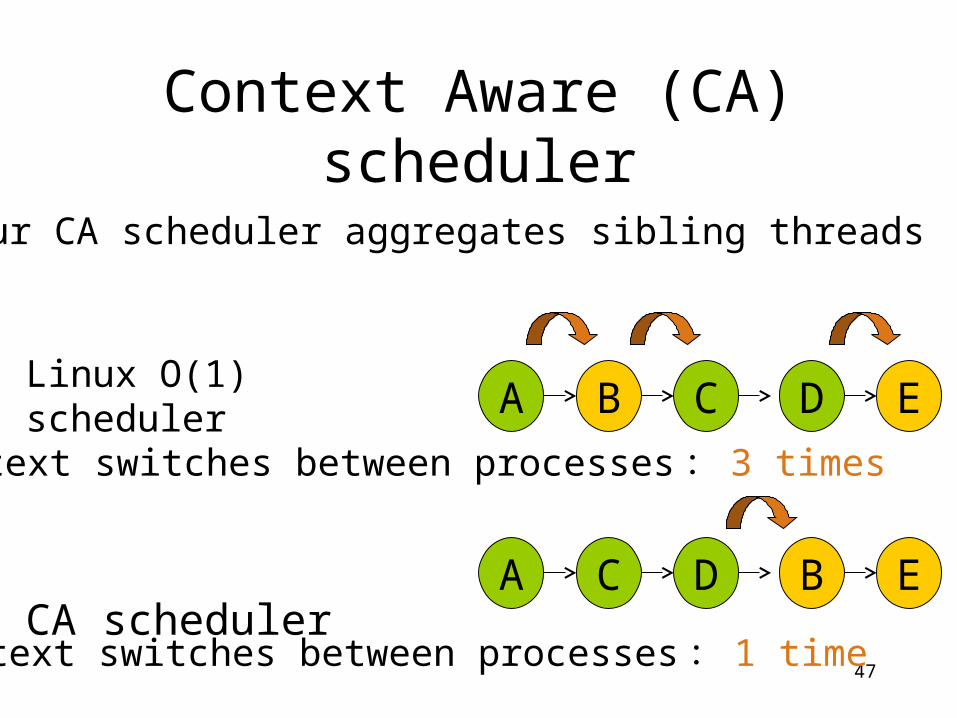
Context Aware (CA) scheduler
A C DB E
A C D B E
Linux O(1) scheduler
CA scheduler
Context switches between processes: 3 times
Context switches between processes: 1 time
Our CA scheduler aggregates sibling threads
48
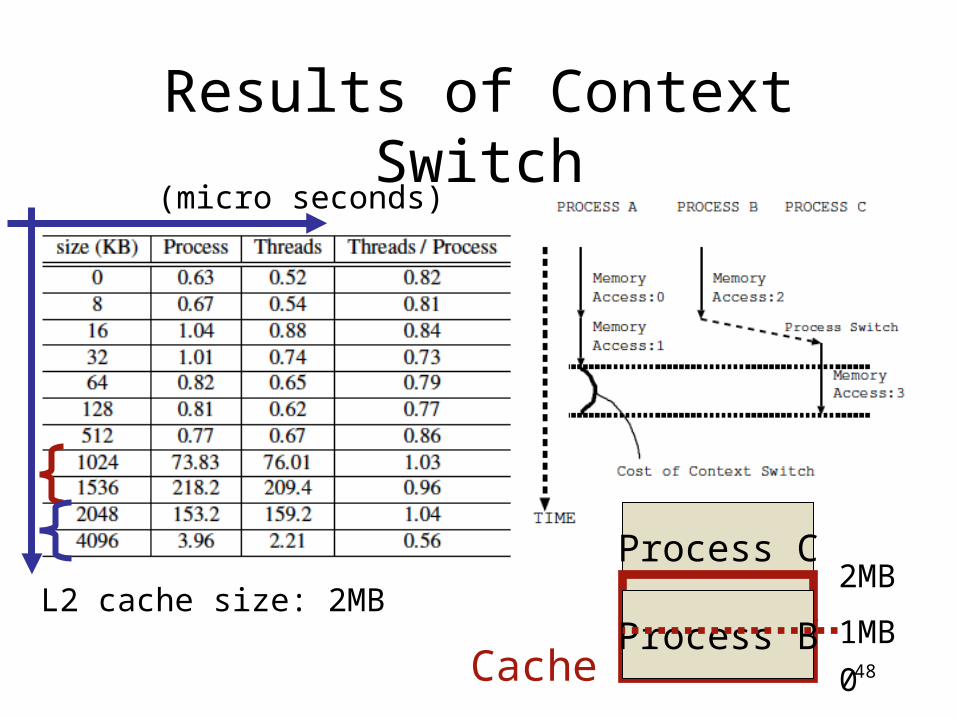
Process A
Process C
Results of Context Switch
L2 cache size: 2MB
(micro seconds)
Process BCache 0
1MB
2MB
49
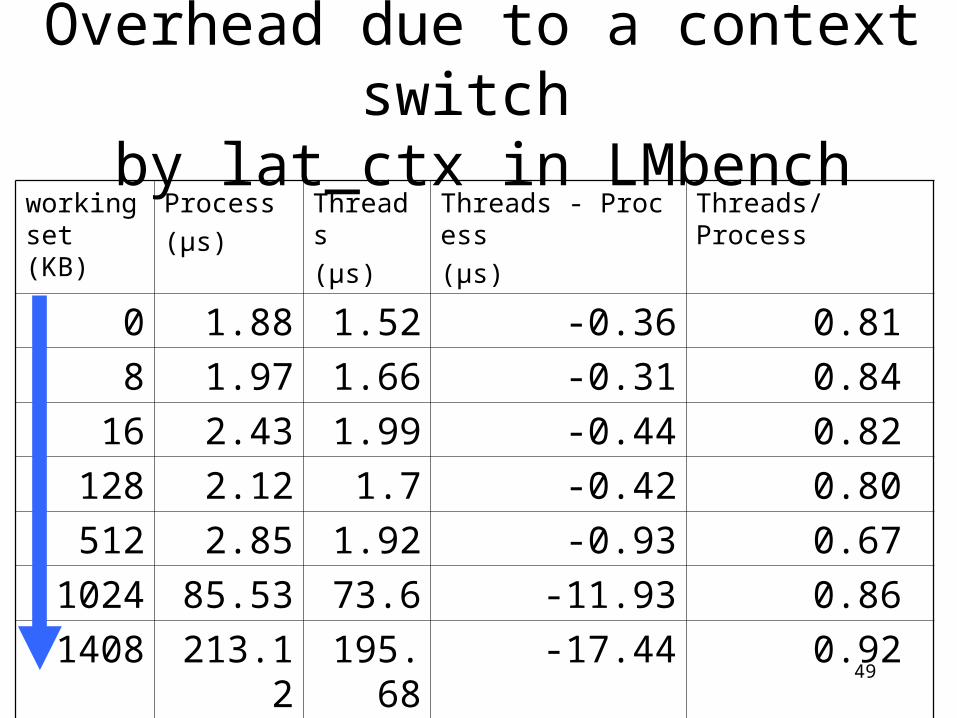
Overhead due to a context switch
by lat_ctx in LMbenchworking set (KB)
Process(μs)
Threads(μs)
Threads - Process(μs)
Threads/Process
0 1.88 1.52 -0.36 0.81 8 1.97 1.66 -0.31 0.84
16 2.43 1.99 -0.44 0.82 128 2.12 1.7 -0.42 0.80 512 2.85 1.92 -0.93 0.67
1024 85.53 73.6 -11.93 0.86 1408 213.12 195.6
8-17.44 0.92
1536 243.73 203.78
-39.95 0.84
50
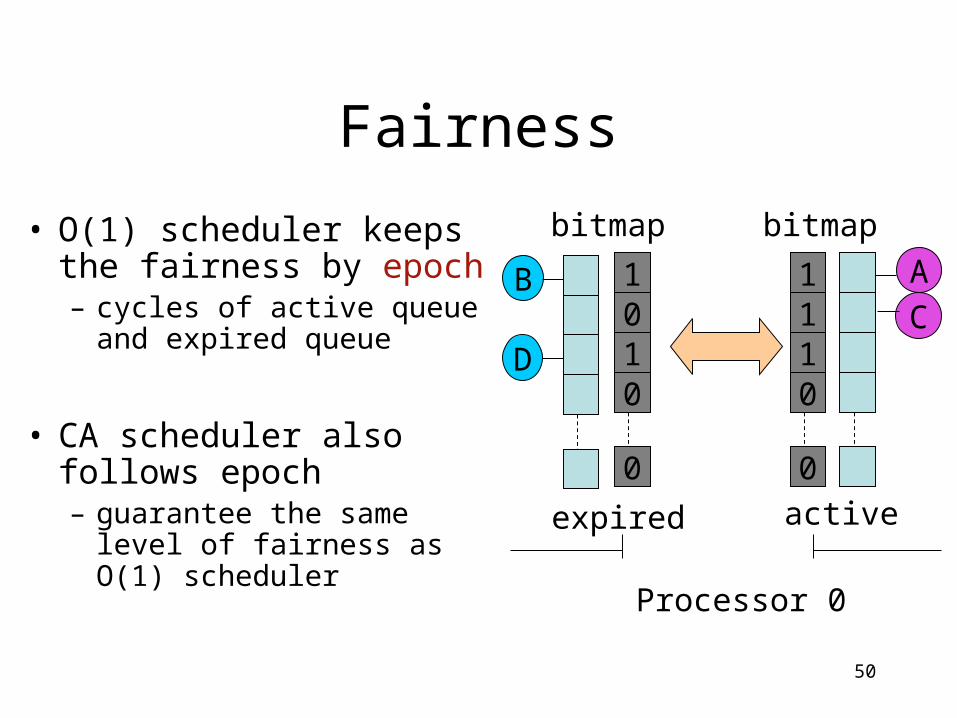
Fairness
• O(1) scheduler keeps the fairness by epoch– cycles of active queue and
expired queue
• CA scheduler also follows epoch – guarantee the same level
of fairness as O(1) scheduler
A
C1110
0
B
D
1010
0
expired active
Processor 0
bitmap bitmap
51
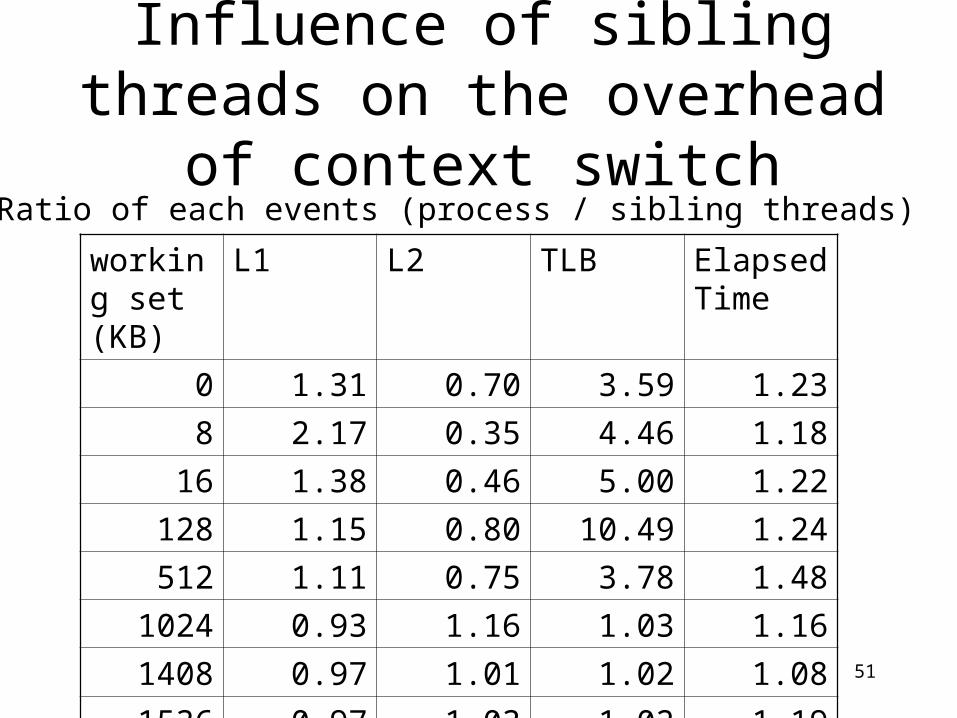
Influence of sibling threads on the overhead of context switch
working set (KB)
L1 L2 TLB Elapsed Time
0 1.31 0.70 3.59 1.23
8 2.17 0.35 4.46 1.1816 1.38 0.46 5.00 1.22
128 1.15 0.80 10.49 1.24512 1.11 0.75 3.78 1.48
1024 0.93 1.16 1.03 1.161408 0.97 1.01 1.02 1.081536 0.97 1.03 1.02 1.19
Ratio of each events (process / sibling threads)
52
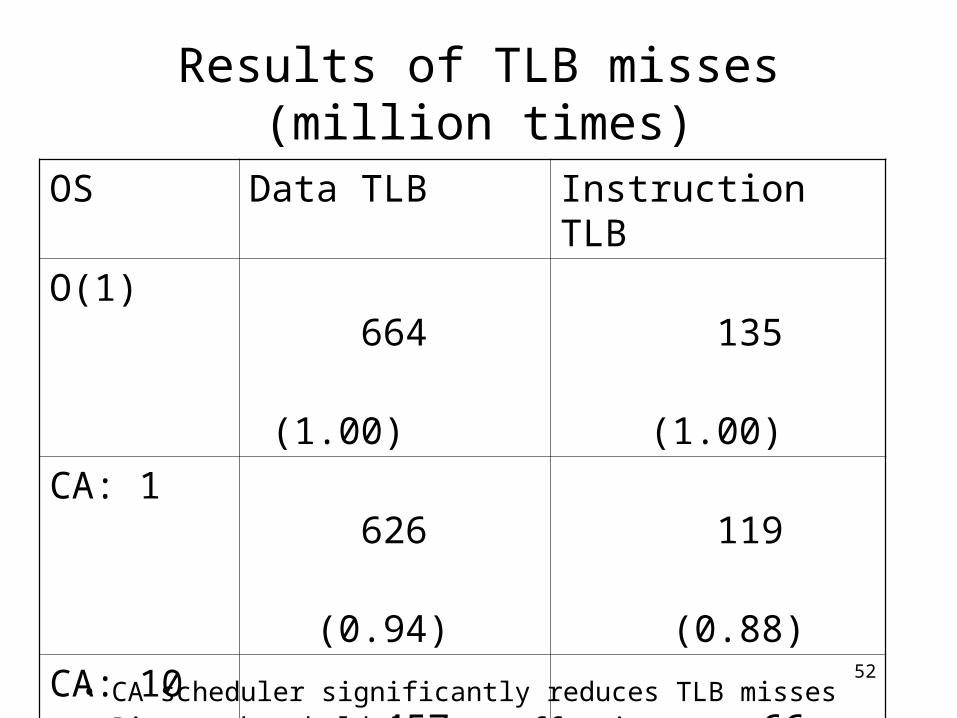
Results of TLB misses (million times)
• CA scheduler significantly reduces TLB misses• Bigger threshold is more effective
– frequent changes of priority happened especially in DaCapo and Volano
OS Data TLB Instruction TLB
O(1) 664
(1.00)
135
(1.00)
CA: 1 626
(0.94)
119
(0.88)
CA: 10 457
(0.68)
66
(0.48)
CFS 581
(0.87)
117
(0.86)
53
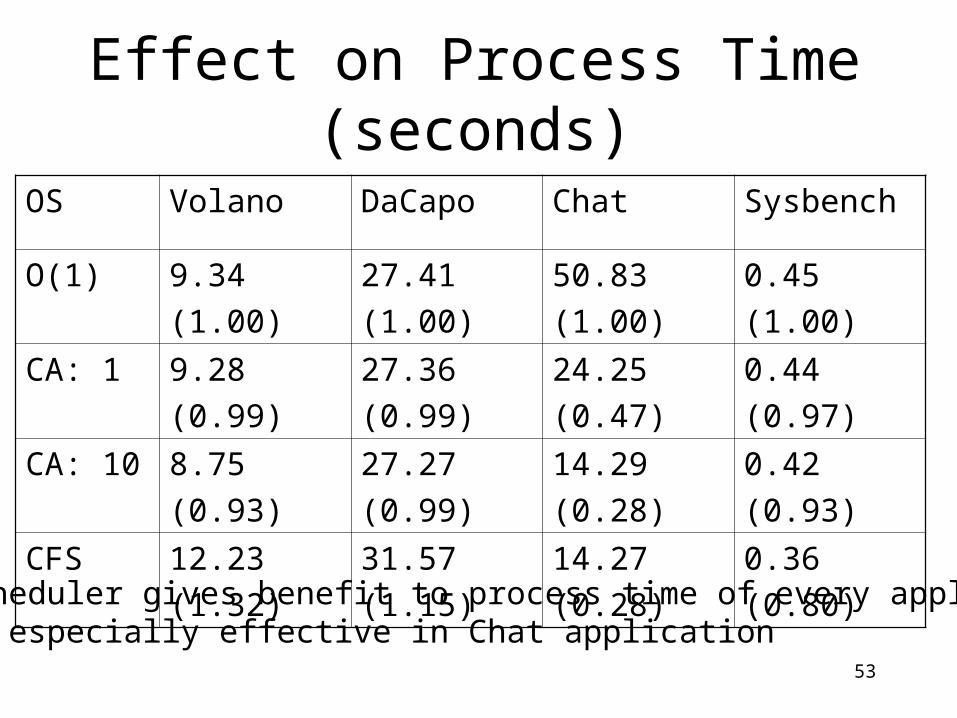
Effect on Process Time (seconds)
OS Volano DaCapo Chat Sysbench
O(1) 9.34
(1.00)
27.41
(1.00)
50.83
(1.00)
0.45
(1.00)
CA: 1 9.28
(0.99)
27.36
(0.99)
24.25
(0.47)
0.44
(0.97)
CA: 10 8.75
(0.93)
27.27
(0.99)
14.29
(0.28)
0.42
(0.93)
CFS 12.23
(1.32)
31.57
(1.15)
14.27
(0.28)
0.36
(0.80)• CA scheduler gives benefit to process time of every application• CA is especially effective in Chat application
54
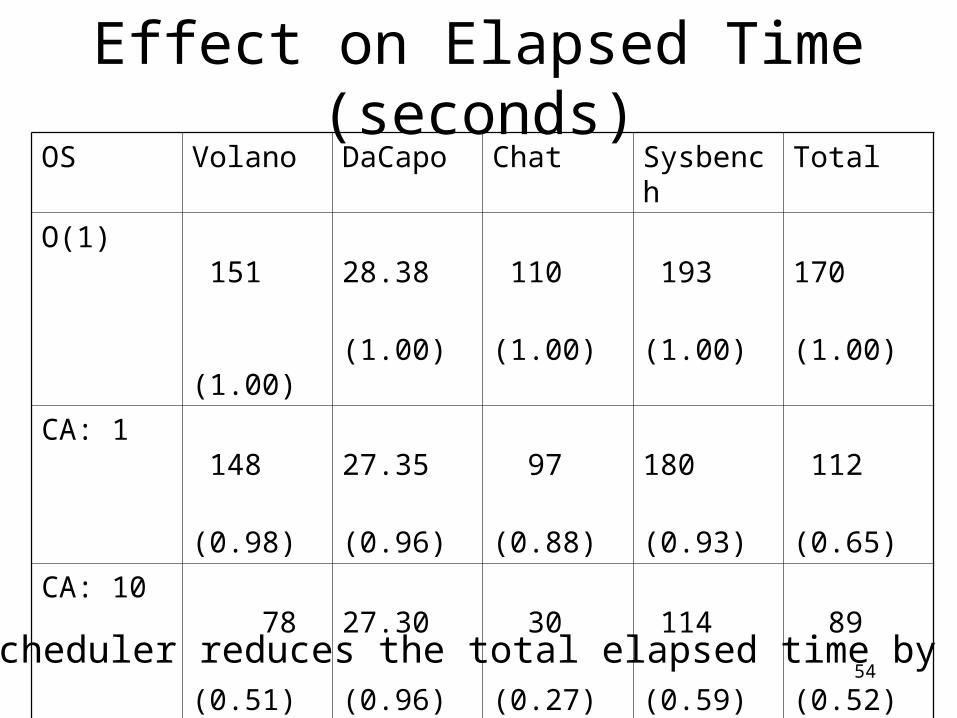
Effect on Elapsed Time (seconds)
OS Volano DaCapo Chat Sysbench Total
O(1) 151
(1.00)
28.38
(1.00)
110
(1.00)
193
(1.00)
170
(1.00)
CA: 1 148
(0.98)
27.35
(0.96)
97
(0.88)
180
(0.93)
112
(0.65)
CA: 10 78
(0.51)
27.30
(0.96)
30
(0.27)
114
(0.59)
89
(0.52)
CFS 38
(0.25)
83.78
(2.95)
40
(0.36)
99
(0.51)
89
(0.52)
CA scheduler reduces the total elapsed time by 48%
55
Measuring Tools
• Perfctr to count the TLB misses and Total Elapsed Time
• GNU’s time command to measure the process time
• Counter implemented in each application (elapsed time)
56
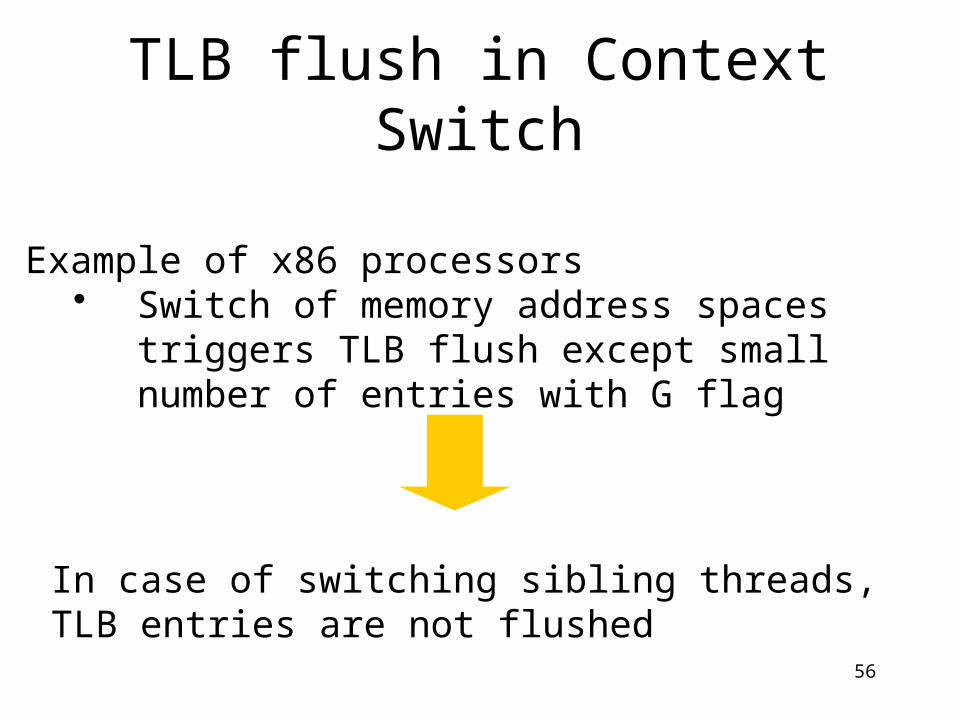
TLB flush in Context Switch
In case of switching sibling threads, TLB entries are not flushed
Example of x86 processors Switch of memory address spaces triggers TLB
flush except small number of entries with G flag


![Motohiko Kusakabe, 6 arXiv:1901.01715v2 [astro-ph.HE] 19](https://img.pdfslide.net/doc/110x75/61e27b9f9ae1075525424334/motohiko-kusakabe-6-arxiv190101715v2-astro-phhe-19-.jpg)