Embed Size (px)
Citation preview
11
EUE43E: ‘Trade & EUE43E: ‘Trade & Commerce’Commerce’
Understanding Cost BehaviourUnderstanding Cost Behaviour
Break-Even & Pricing PolicyBreak-Even & Pricing Policy
Robert J. WilliamsRobert J. Williams
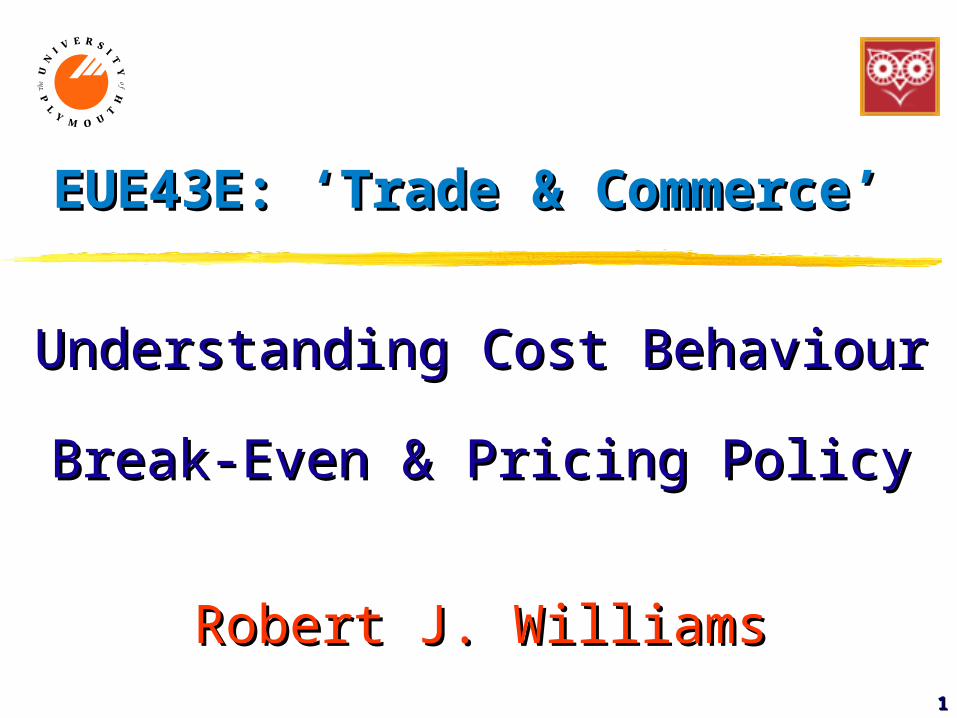
Differences in Industry Differences in Industry Profitability...Profitability...
22
33
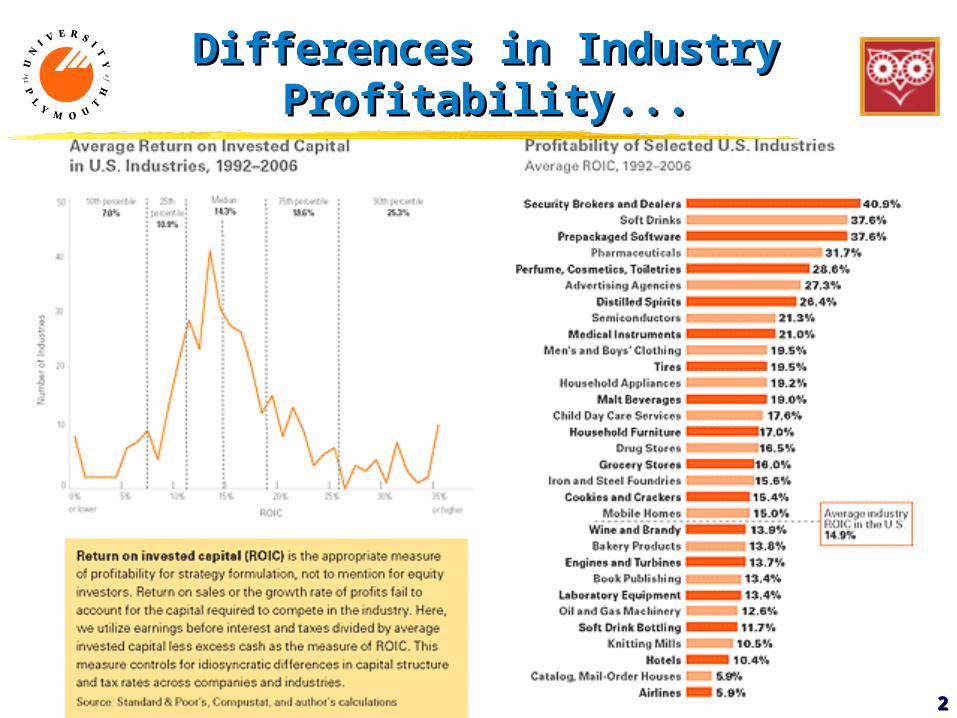
IntroductionIntroduction
Understand the Understand the categorisationcategorisation & & behaviourbehaviour of costs of costs and the implications for decision making based on:and the implications for decision making based on:
1.1. Categorisation 1 Categorisation 1 based on based on ease of allocation ease of allocation
2.2. Categorisation 2 Categorisation 2 based on behaviour with based on behaviour with changing changing
levels of productionlevels of production
3.3. Categorisation 3 Categorisation 3 based on behaviour at the based on behaviour at the margins of productionmargins of production
Categorising Costs 1Categorising Costs 1
1.1. Direct CostsDirect Costs
2.2. Indirect CostsIndirect Costs
44
55
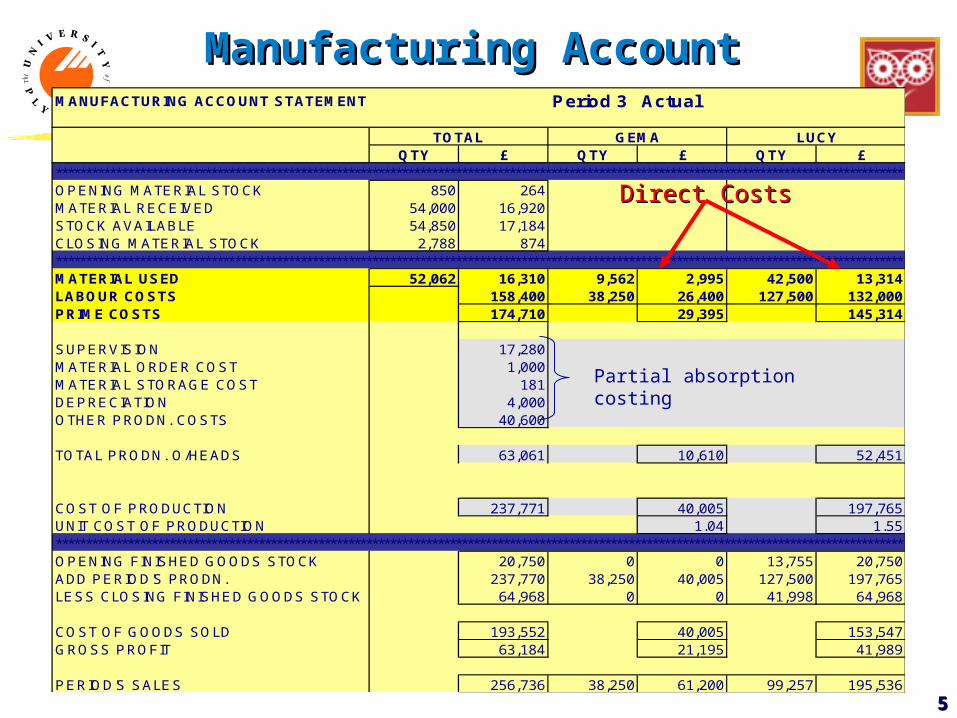
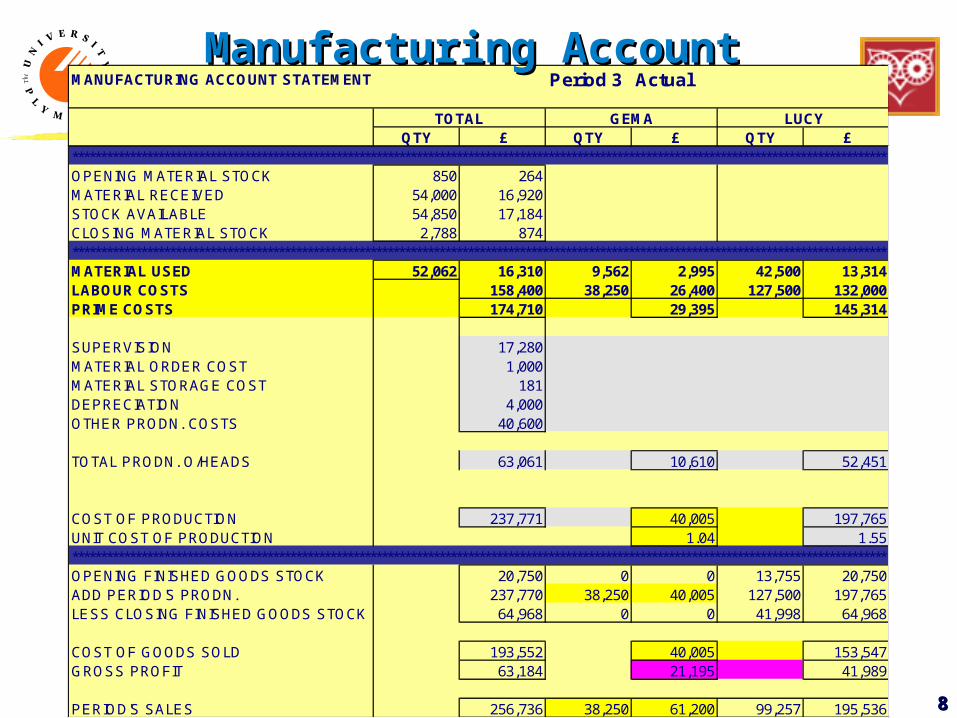
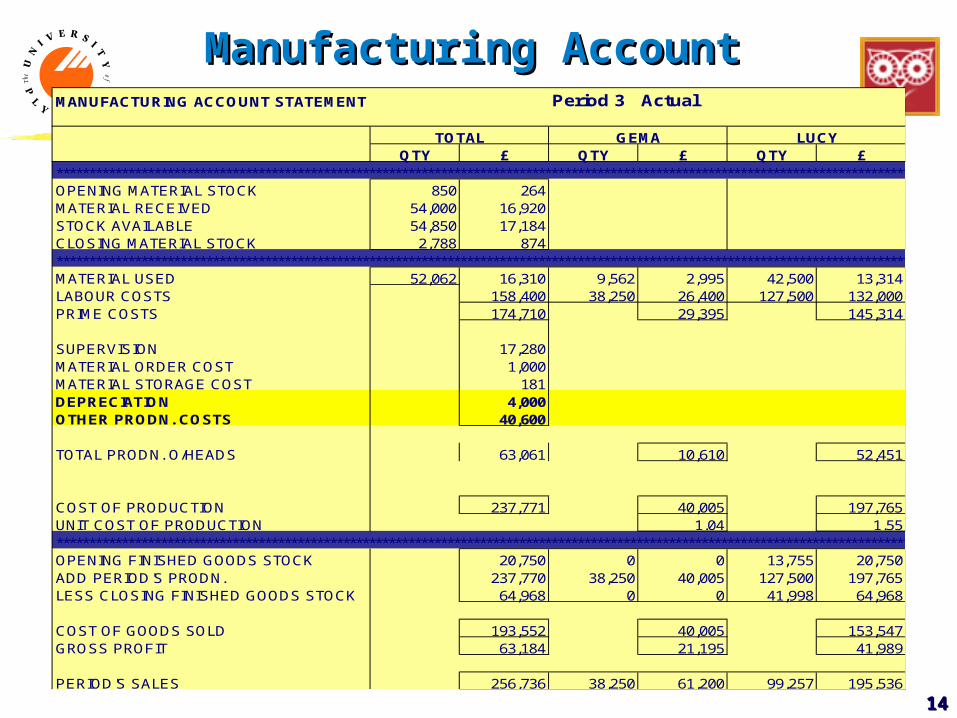
MANUFACTURING ACCOUNT STATEMENT Period 3 Actual
TOTAL GEMA LUCYQTY £ QTY £ QTY £
**********************************************************************************************************************************************OPENING MATERIAL STOCK 850 264MATERIAL RECEIVED 54,000 16,920STOCK AVAILABLE 54,850 17,184CLOSING MATERIAL STOCK 2,788 874**********************************************************************************************************************************************MATERIAL USED 52,062 16,310 9,562 2,995 42,500 13,314LABOUR COSTS 158,400 38,250 26,400 127,500 132,000PRIME COSTS 174,710 29,395 145,314
SUPERVISION 17,280MATERIAL ORDER COST 1,000MATERIAL STORAGE COST 181DEPRECIATION 4,000OTHER PRODN. COSTS 40,600
TOTAL PRODN. O/HEADS 63,061 10,610 52,451
COST OF PRODUCTION 237,771 40,005 197,765UNIT COST OF PRODUCTION 1.04 1.55**********************************************************************************************************************************************OPENING FINISHED GOODS STOCK 20,750 0 0 13,755 20,750ADD PERIOD'S PRODN. 237,770 38,250 40,005 127,500 197,765LESS CLOSING FINISHED GOODS STOCK 64,968 0 0 41,998 64,968
COST OF GOODS SOLD 193,552 40,005 153,547GROSS PROFIT 63,184 21,195 41,989
PERIOD'S SALES 256,736 38,250 61,200 99,257 195,536
Manufacturing AccountManufacturing Account
Partial absorption costing
Direct CostsDirect Costs
66
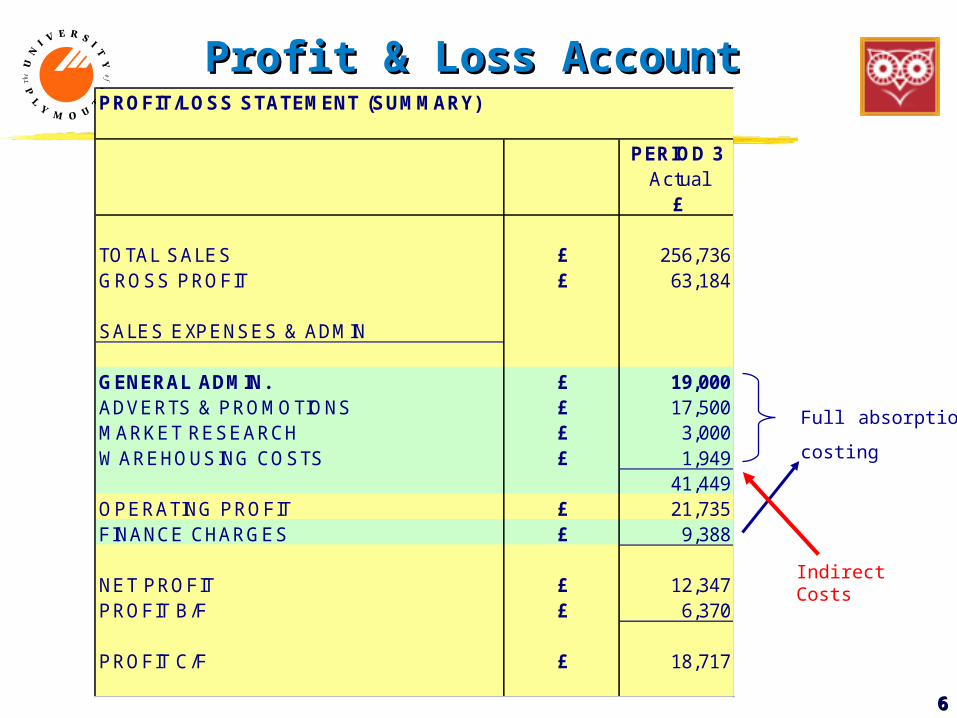
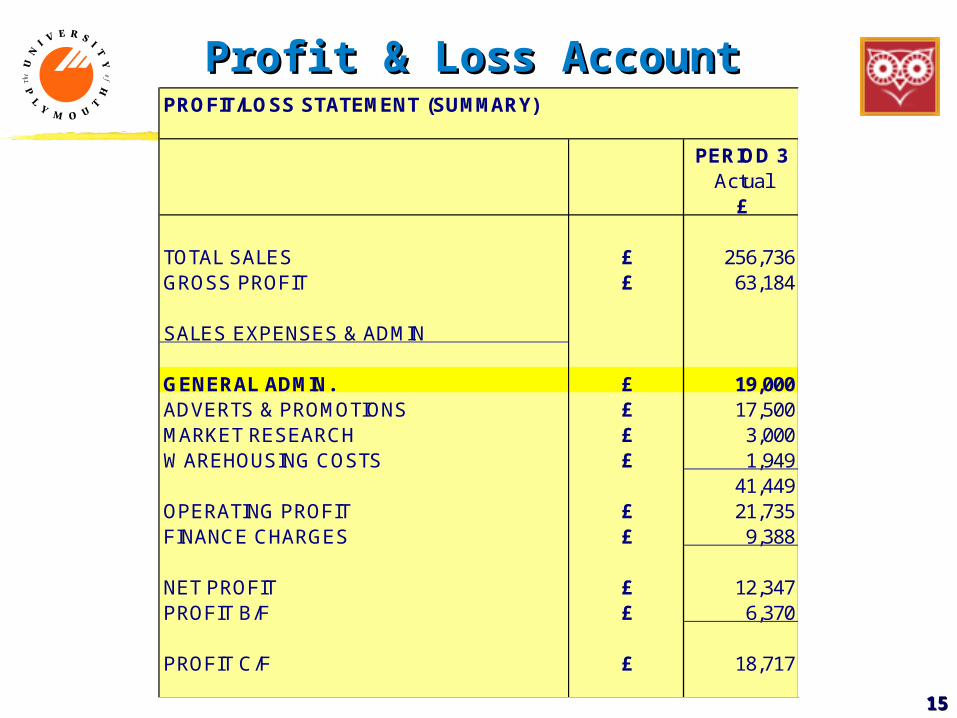
Profit & Loss AccountProfit & Loss AccountPROFIT/LOSS STATEMENT (SUMMARY)
PERIOD 3Actual
£
TOTAL SALES £ 256,736GROSS PROFIT £ 63,184
SALES EXPENSES & ADMIN
GENERAL ADMIN. £ 19,000ADVERTS & PROMOTIONS £ 17,500MARKET RESEARCH £ 3,000WAREHOUSING COSTS £ 1,949
41,449OPERATING PROFIT £ 21,735FINANCE CHARGES £ 9,388
NET PROFIT £ 12,347PROFIT B/F £ 6,370
PROFIT C/F £ 18,717
Full absorption
costing
Indirect Costs
77
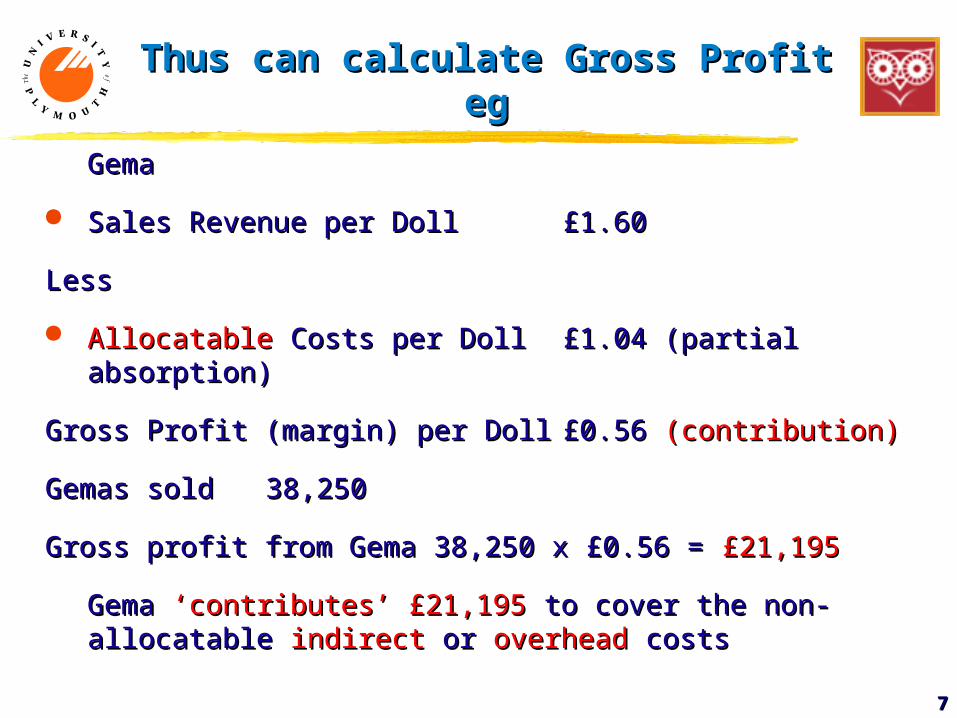
Thus can calculate Gross Profit Thus can calculate Gross Profit egeg
GemaGema
Sales Revenue per Doll Sales Revenue per Doll £1.60£1.60
LessLess
AllocatableAllocatable Costs per Doll Costs per Doll £1.04 (partial £1.04 (partial absorption)absorption)
Gross Profit (margin) per DollGross Profit (margin) per Doll £0.56 £0.56 (contribution)(contribution)
Gemas soldGemas sold 38,25038,250
Gross profit from Gema 38,250 x £0.56 = Gross profit from Gema 38,250 x £0.56 = £21,195£21,195
Gema Gema ‘contributes’ £21,195‘contributes’ £21,195 to cover the non- to cover the non-allocatable allocatable indirectindirect or or overheadoverhead costs costs
88
MANUFACTURING ACCOUNT STATEMENT Period 3 Actual
TOTAL GEMA LUCYQTY £ QTY £ QTY £
**********************************************************************************************************************************************OPENING MATERIAL STOCK 850 264MATERIAL RECEIVED 54,000 16,920STOCK AVAILABLE 54,850 17,184CLOSING MATERIAL STOCK 2,788 874**********************************************************************************************************************************************MATERIAL USED 52,062 16,310 9,562 2,995 42,500 13,314LABOUR COSTS 158,400 38,250 26,400 127,500 132,000PRIME COSTS 174,710 29,395 145,314
SUPERVISION 17,280MATERIAL ORDER COST 1,000MATERIAL STORAGE COST 181DEPRECIATION 4,000OTHER PRODN. COSTS 40,600
TOTAL PRODN. O/HEADS 63,061 10,610 52,451
COST OF PRODUCTION 237,771 40,005 197,765UNIT COST OF PRODUCTION 1.04 1.55**********************************************************************************************************************************************OPENING FINISHED GOODS STOCK 20,750 0 0 13,755 20,750ADD PERIOD'S PRODN. 237,770 38,250 40,005 127,500 197,765LESS CLOSING FINISHED GOODS STOCK 64,968 0 0 41,998 64,968
COST OF GOODS SOLD 193,552 40,005 153,547GROSS PROFIT 63,184 21,195 41,989
PERIOD'S SALES 256,736 38,250 61,200 99,257 195,536
Manufacturing AccountManufacturing Account
99
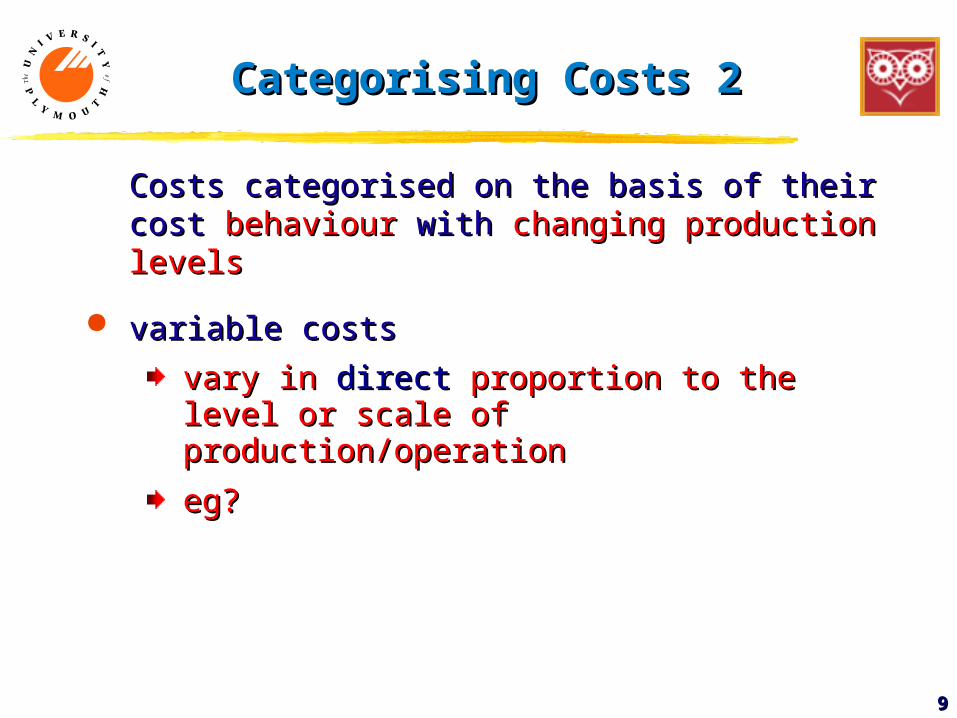
Costs categorised on the basis of their cost Costs categorised on the basis of their cost behaviourbehaviour with with changing production levelschanging production levels
variable costsvariable costs
vary in vary in directdirect proportion to the level or scale proportion to the level or scale of production/operationof production/operation
eg?eg?
Categorising Costs 2Categorising Costs 2
1010
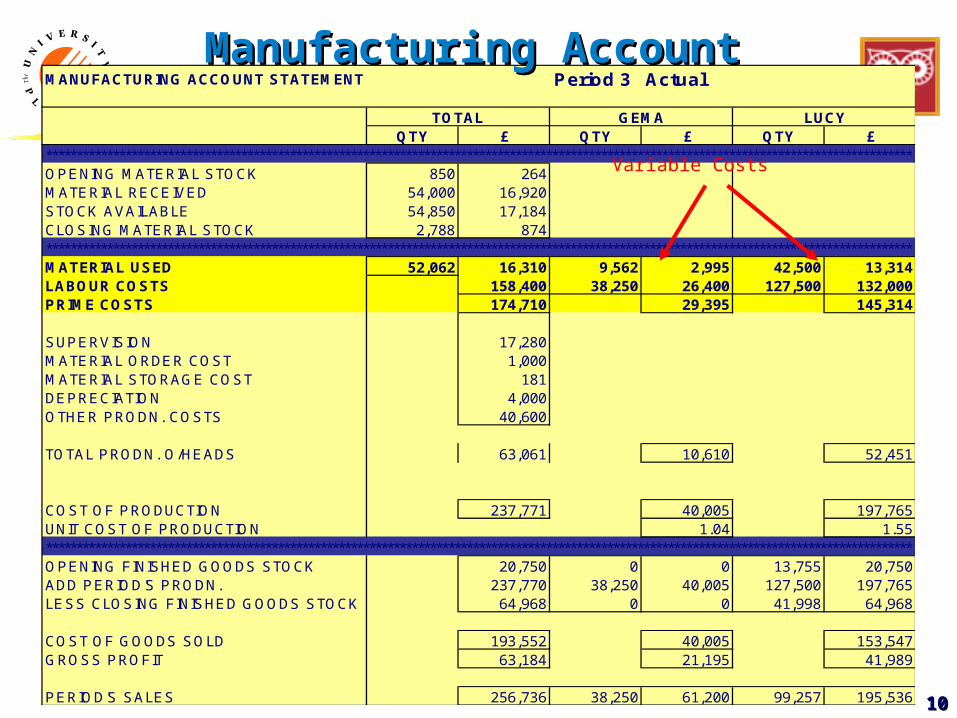
MANUFACTURING ACCOUNT STATEMENT Period 3 Actual
TOTAL GEMA LUCYQTY £ QTY £ QTY £
**********************************************************************************************************************************************OPENING MATERIAL STOCK 850 264MATERIAL RECEIVED 54,000 16,920STOCK AVAILABLE 54,850 17,184CLOSING MATERIAL STOCK 2,788 874**********************************************************************************************************************************************MATERIAL USED 52,062 16,310 9,562 2,995 42,500 13,314LABOUR COSTS 158,400 38,250 26,400 127,500 132,000PRIME COSTS 174,710 29,395 145,314
SUPERVISION 17,280MATERIAL ORDER COST 1,000MATERIAL STORAGE COST 181DEPRECIATION 4,000OTHER PRODN. COSTS 40,600
TOTAL PRODN. O/HEADS 63,061 10,610 52,451
COST OF PRODUCTION 237,771 40,005 197,765UNIT COST OF PRODUCTION 1.04 1.55**********************************************************************************************************************************************OPENING FINISHED GOODS STOCK 20,750 0 0 13,755 20,750ADD PERIOD'S PRODN. 237,770 38,250 40,005 127,500 197,765LESS CLOSING FINISHED GOODS STOCK 64,968 0 0 41,998 64,968
COST OF GOODS SOLD 193,552 40,005 153,547GROSS PROFIT 63,184 21,195 41,989
PERIOD'S SALES 256,736 38,250 61,200 99,257 195,536
Manufacturing AccountManufacturing Account
Variable Costs
1111
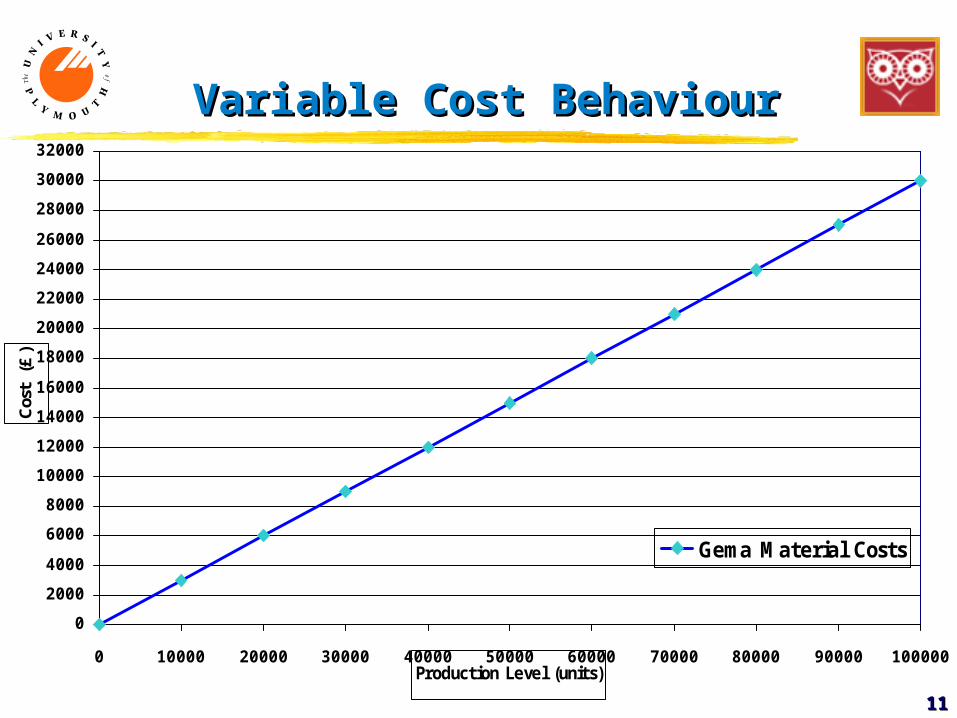
Variable Cost BehaviourVariable Cost Behaviour
0
2000
4000
6000
8000
10000
12000
14000
16000
18000
20000
22000
24000
26000
28000
30000
32000
0 10000 20000 30000 40000 50000 60000 70000 80000 90000 100000Production Level (units)
Cos
t (
£)
Gema Material Costs
1212
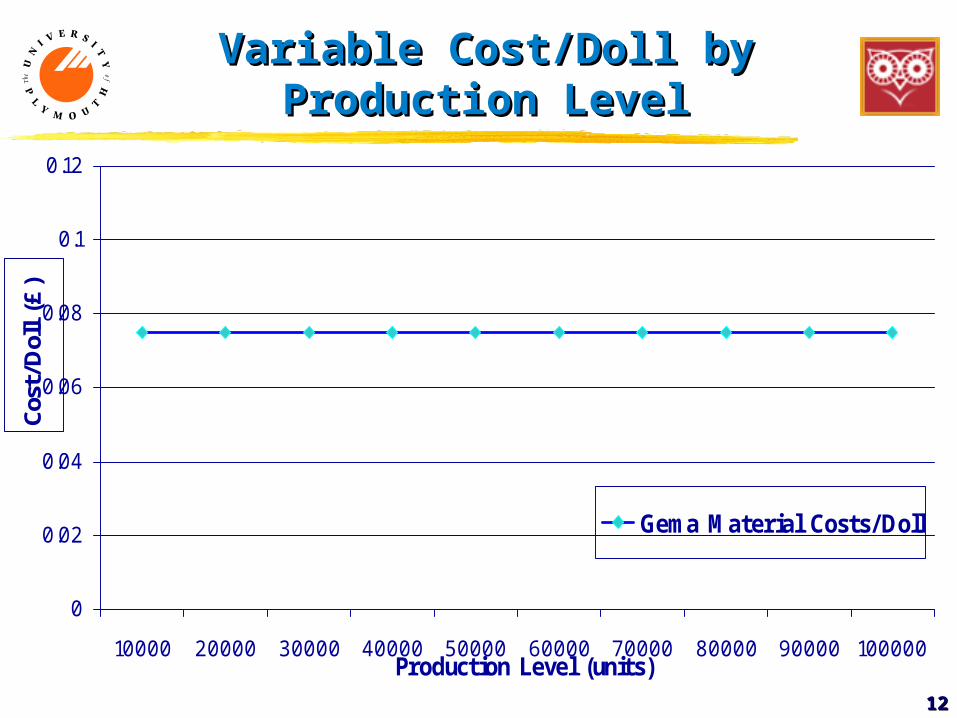
Variable Cost/Doll by Variable Cost/Doll by Production LevelProduction Level
0
0.02
0.04
0.06
0.08
0.1
0.12
10000 20000 30000 40000 50000 60000 70000 80000 90000 100000Production Level (units)
Cost
/Dol
l (£
)
Gema Material Costs/Doll
1313
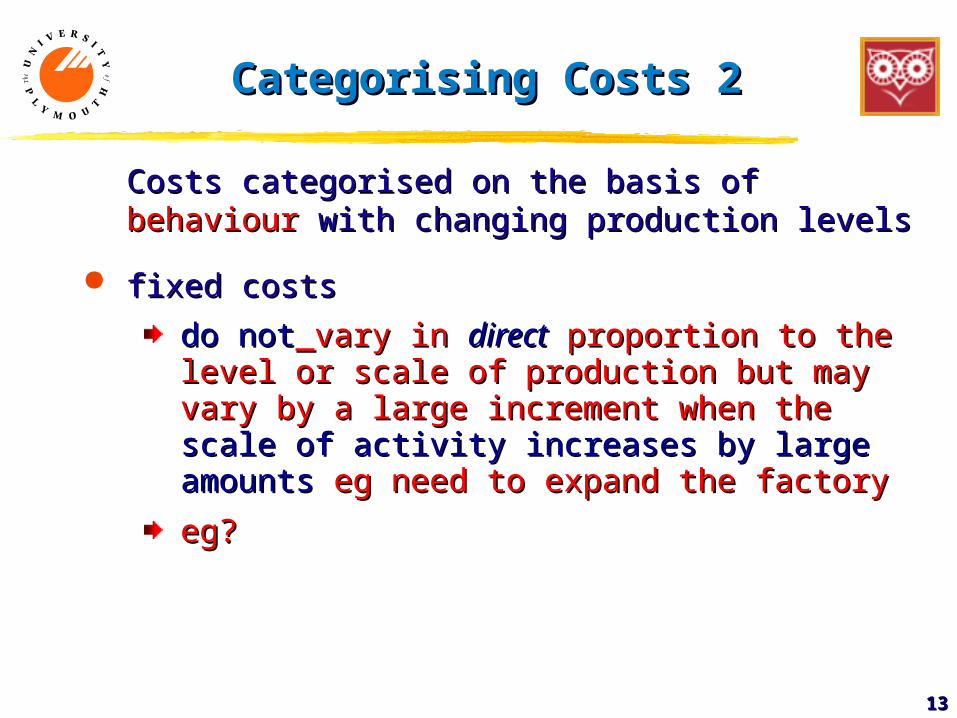
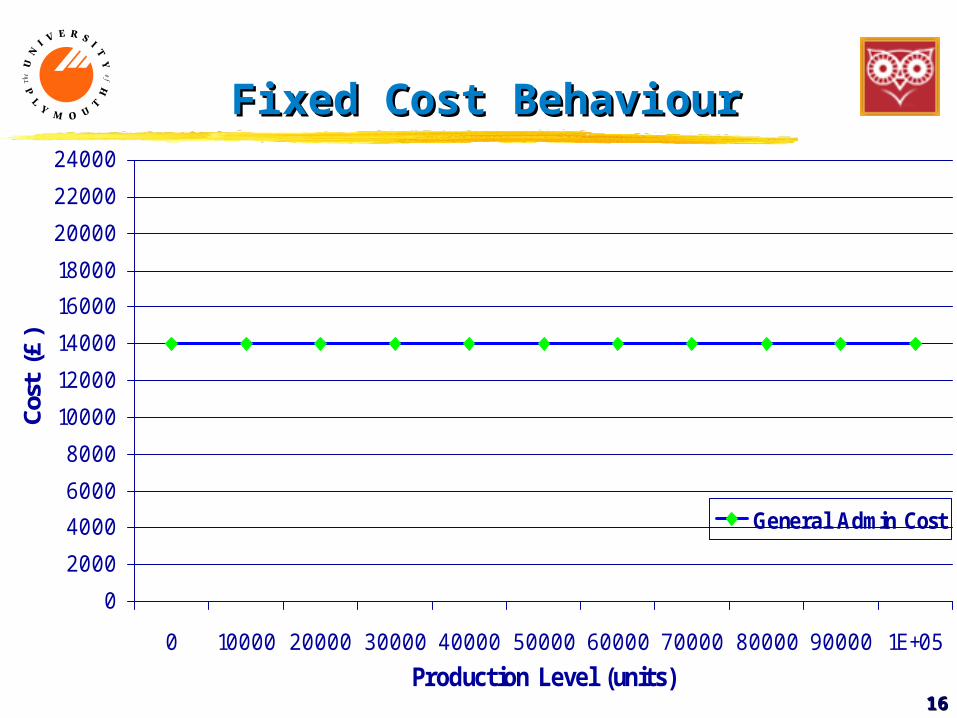
Costs categorised on the basis of Costs categorised on the basis of behaviourbehaviour with with changing production levelschanging production levels
fixed costsfixed costs
do notdo not vary in vary in directdirect proportion to the level or proportion to the level or scale of production but may vary by a large scale of production but may vary by a large increment when the increment when the scale of activity scale of activity increases by large amountsincreases by large amounts eg need to eg need to expand the factoryexpand the factory
eg?eg?
Categorising Costs 2Categorising Costs 2
1414
MANUFACTURING ACCOUNT STATEMENT Period 3 Actual
TOTAL GEMA LUCYQTY £ QTY £ QTY £
**********************************************************************************************************************************************OPENING MATERIAL STOCK 850 264MATERIAL RECEIVED 54,000 16,920STOCK AVAILABLE 54,850 17,184CLOSING MATERIAL STOCK 2,788 874**********************************************************************************************************************************************MATERIAL USED 52,062 16,310 9,562 2,995 42,500 13,314LABOUR COSTS 158,400 38,250 26,400 127,500 132,000PRIME COSTS 174,710 29,395 145,314
SUPERVISION 17,280MATERIAL ORDER COST 1,000MATERIAL STORAGE COST 181DEPRECIATION 4,000OTHER PRODN. COSTS 40,600
TOTAL PRODN. O/HEADS 63,061 10,610 52,451
COST OF PRODUCTION 237,771 40,005 197,765UNIT COST OF PRODUCTION 1.04 1.55**********************************************************************************************************************************************OPENING FINISHED GOODS STOCK 20,750 0 0 13,755 20,750ADD PERIOD'S PRODN. 237,770 38,250 40,005 127,500 197,765LESS CLOSING FINISHED GOODS STOCK 64,968 0 0 41,998 64,968
COST OF GOODS SOLD 193,552 40,005 153,547GROSS PROFIT 63,184 21,195 41,989
PERIOD'S SALES 256,736 38,250 61,200 99,257 195,536
Manufacturing AccountManufacturing Account
1515
Profit & Loss AccountProfit & Loss AccountPROFIT/LOSS STATEMENT (SUMMARY)
PERIOD 3Actual
£
TOTAL SALES £ 256,736GROSS PROFIT £ 63,184
SALES EXPENSES & ADMIN
GENERAL ADMIN. £ 19,000ADVERTS & PROMOTIONS £ 17,500MARKET RESEARCH £ 3,000WAREHOUSING COSTS £ 1,949
41,449OPERATING PROFIT £ 21,735FINANCE CHARGES £ 9,388
NET PROFIT £ 12,347PROFIT B/F £ 6,370
PROFIT C/F £ 18,717
1616
Fixed Cost BehaviourFixed Cost Behaviour
0
2000
4000
6000
8000
10000
12000
14000
16000
18000
20000
22000
24000
0 10000 20000 30000 40000 50000 60000 70000 80000 90000 1E+05
Production Level (units)
Cost
(£
)
General Admin Cost
1717
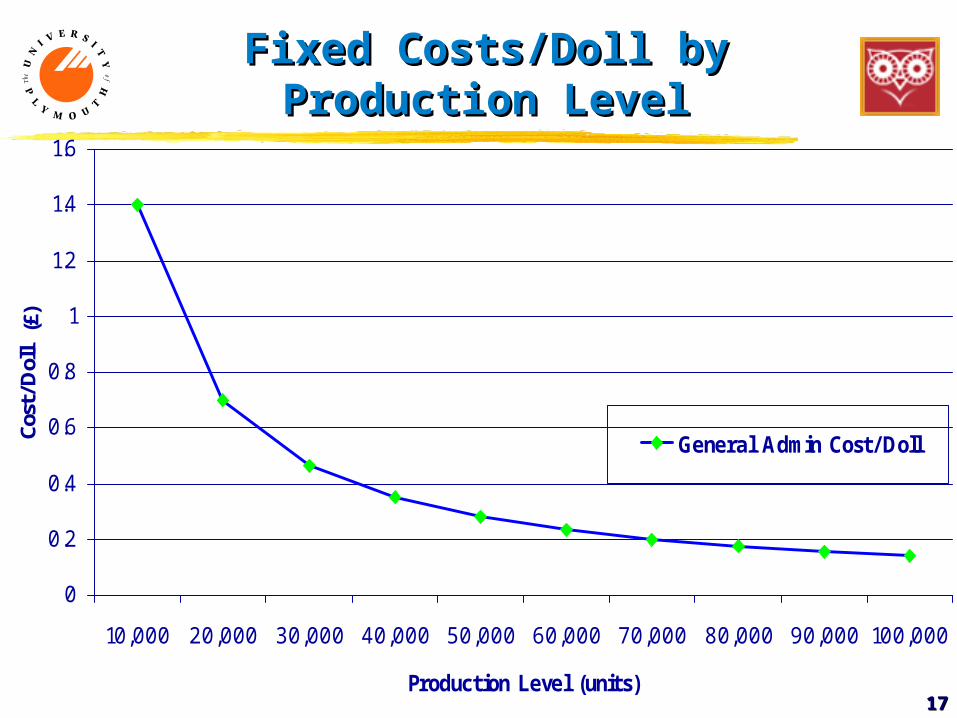
Fixed Costs/Doll by Fixed Costs/Doll by Production LevelProduction Level
0
0.2
0.4
0.6
0.8
1
1.2
1.4
1.6
10,000 20,000 30,000 40,000 50,000 60,000 70,000 80,000 90,000 100,000
Production Level (units)
Cost
/Dol
l (£
)
General Admin Cost/Doll
1818
Categorising Costs 2Categorising Costs 2
Costs categorised on the basis of Costs categorised on the basis of behaviourbehaviour with with
changing production levelschanging production levels
semi-variablesemi-variable
contain both contain both fixedfixed & & variablevariable elements elements
eg?eg? business vehicles: ownership costs; tax, business vehicles: ownership costs; tax,
insurance - fixed insurance - fixed use costs; fuel, oil - variableuse costs; fuel, oil - variable what about depreciation? what about depreciation?
see graphsee graph
1919
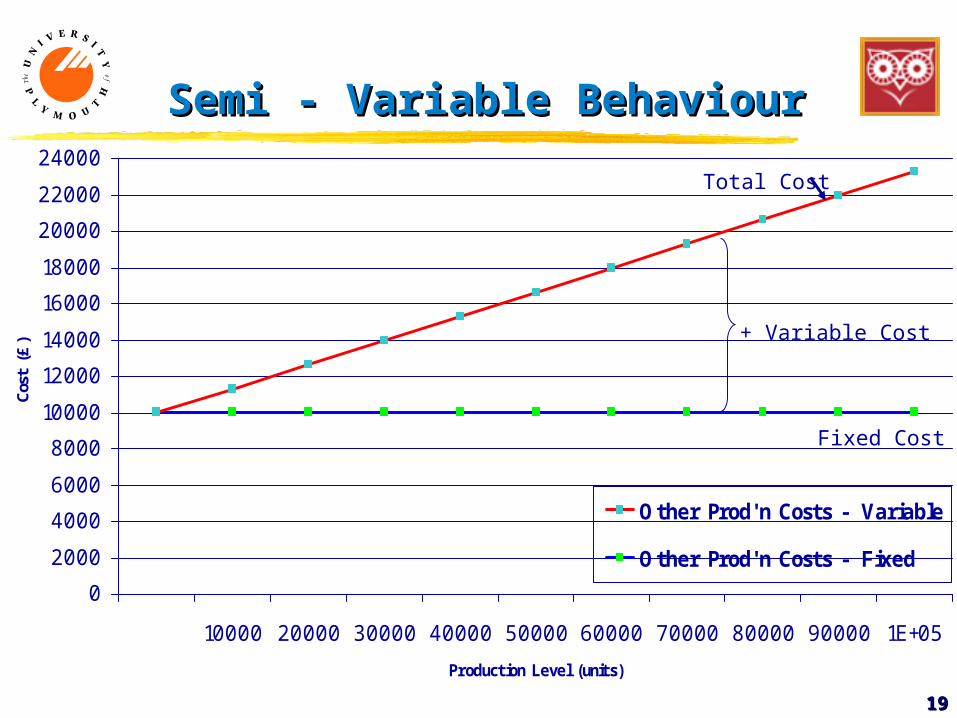
Semi - Variable BehaviourSemi - Variable Behaviour
0
2000
4000
6000
8000
10000
12000
14000
16000
18000
20000
22000
24000
10000 20000 30000 40000 50000 60000 70000 80000 90000 1E+05
Production Level (units)
Cost
(£
)
Other Prod'n Costs - Variable
Other Prod'n Costs - Fixed
Fixed Cost
+ Variable Cost
Total Cost
2020
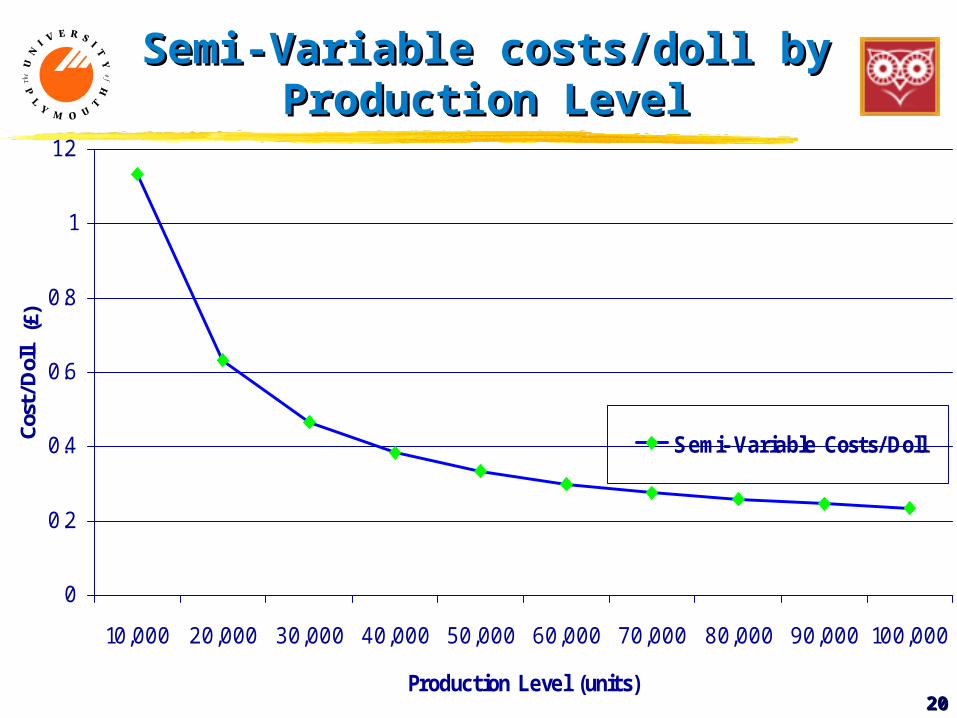
Semi-Variable costs/doll by Semi-Variable costs/doll by Production LevelProduction Level
0
0.2
0.4
0.6
0.8
1
1.2
10,000 20,000 30,000 40,000 50,000 60,000 70,000 80,000 90,000 100,000
Production Level (units)
Cost
/Dol
l (£
)
Semi- Variable Costs/Doll
2121
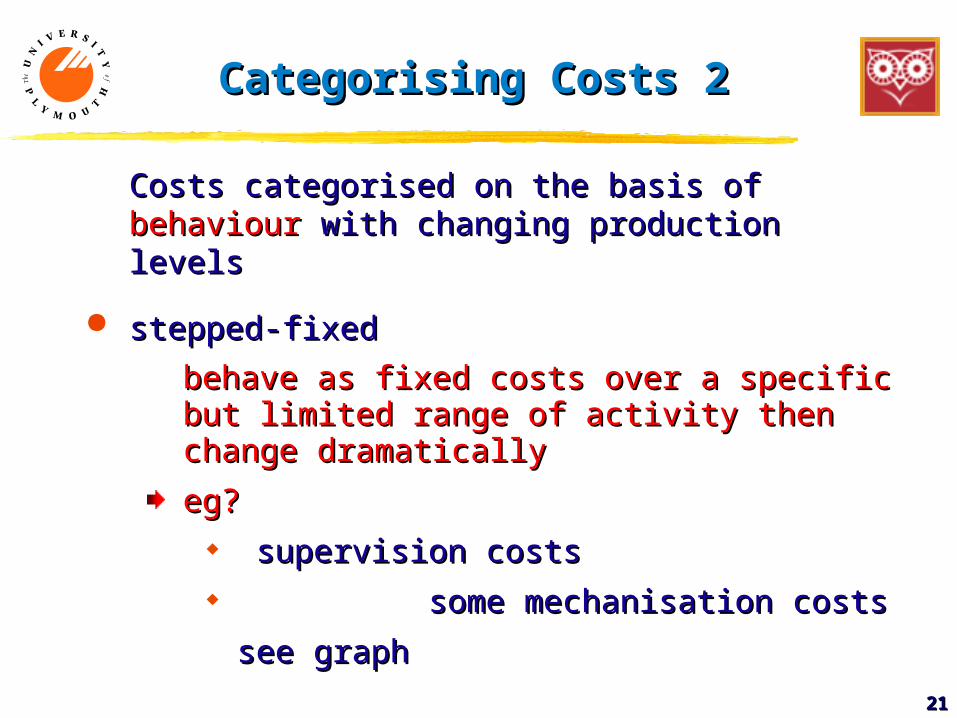
Costs categorised on the basis of Costs categorised on the basis of behaviourbehaviour with changing production levelswith changing production levels
stepped-fixedstepped-fixed
behave as fixed costs over a specific but behave as fixed costs over a specific but limited range of activity then change limited range of activity then change dramaticallydramatically
eg?eg? supervision costssupervision costs some mechanisation costssome mechanisation costs
see graphsee graph
Categorising Costs 2 Categorising Costs 2
2222
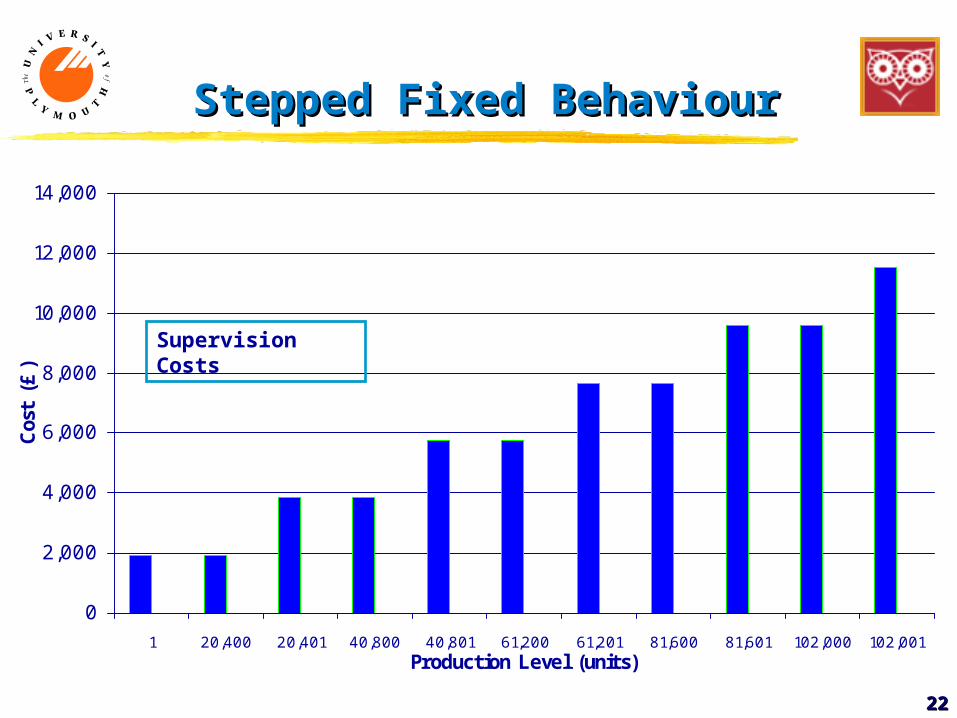
Stepped Fixed BehaviourStepped Fixed Behaviour
0
2,000
4,000
6,000
8,000
10,000
12,000
14,000
1 20,400 20,401 40,800 40,801 61,200 61,201 81,600 81,601 102,000 102,001Production Level (units)
Cos
t (£
)
Supervision Costs
2323
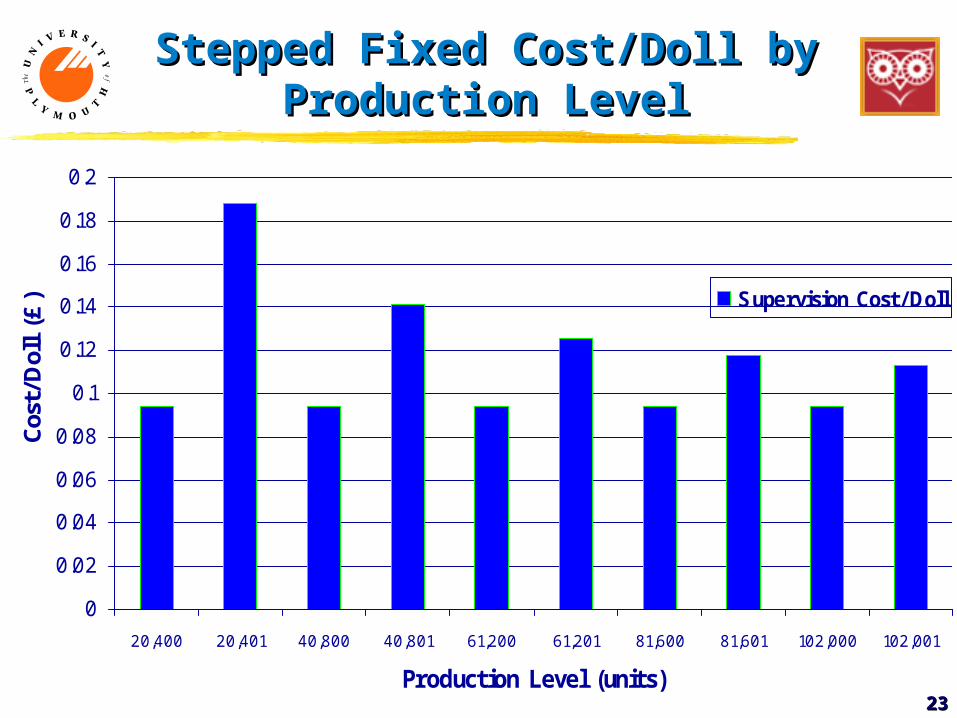
Stepped Fixed Cost/Doll by Stepped Fixed Cost/Doll by Production LevelProduction Level
0
0.02
0.04
0.06
0.08
0.1
0.12
0.14
0.16
0.18
0.2
20,400 20,401 40,800 40,801 61,200 61,201 81,600 81,601 102,000 102,001
Production Level (units)
Cos
t/D
oll
(£) Supervision Cost/Doll
2424
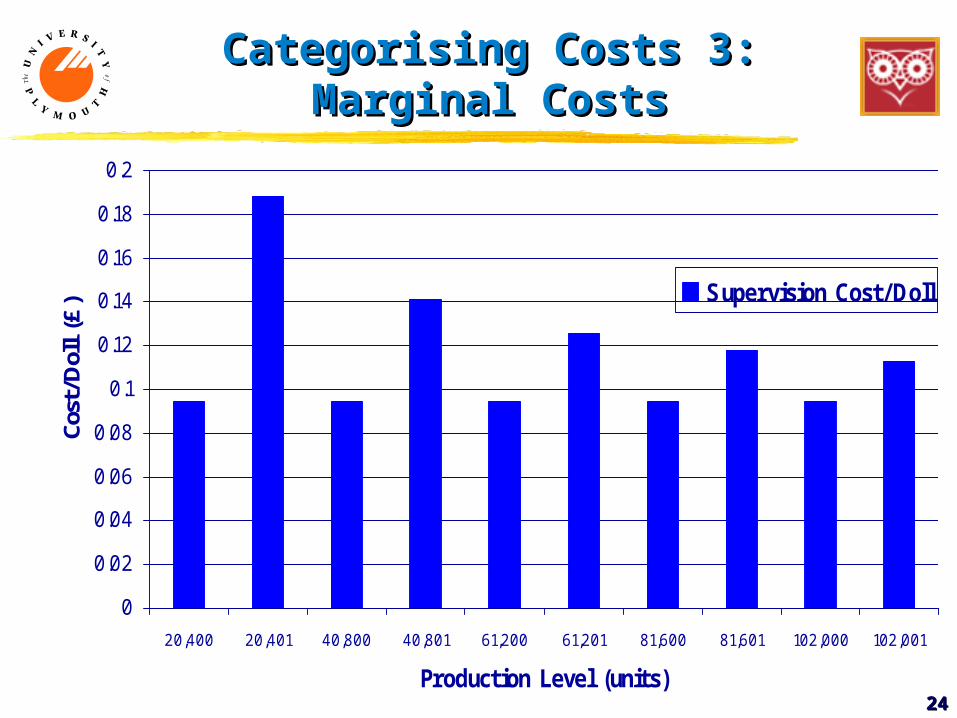
Categorising Costs 3: Categorising Costs 3: Marginal CostsMarginal Costs
0
0.02
0.04
0.06
0.08
0.1
0.12
0.14
0.16
0.18
0.2
20,400 20,401 40,800 40,801 61,200 61,201 81,600 81,601 102,000 102,001
Production Level (units)
Cost
/Dol
l (£
) Supervision Cost/Doll
2525
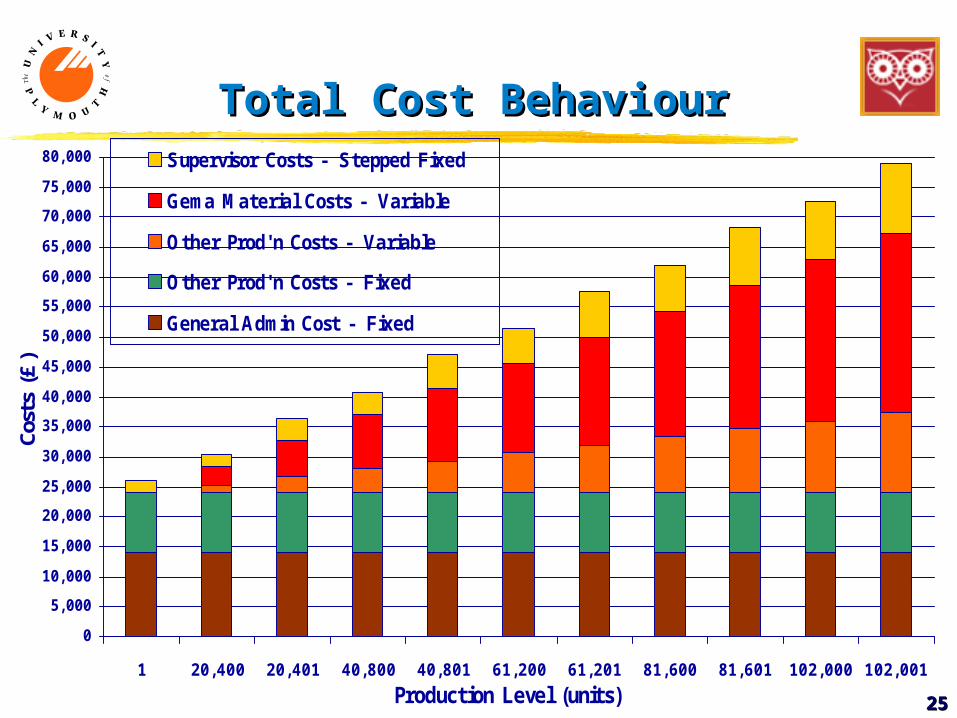
Total Cost Behaviour Total Cost Behaviour
0
5,000
10,000
15,000
20,000
25,000
30,000
35,000
40,000
45,000
50,000
55,000
60,000
65,000
70,000
75,000
80,000
1 20,400 20,401 40,800 40,801 61,200 61,201 81,600 81,601 102,000 102,001
Production Level (units)
Cost
s (£
)
Supervisor Costs - Stepped Fixed
Gema Material Costs - Variable
Other Prod'n Costs - Variable
Other Prod'n Costs - Fixed
General Admin Cost - Fixed
2626
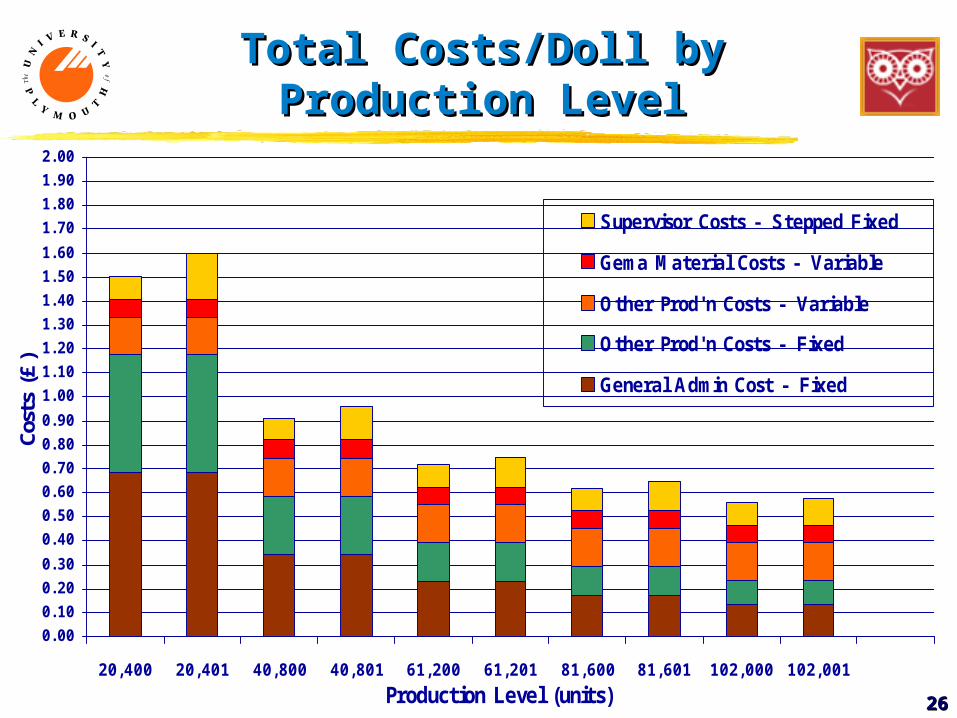
Total Costs/Doll by Total Costs/Doll by Production LevelProduction Level
0.00
0.10
0.20
0.30
0.40
0.50
0.60
0.70
0.80
0.90
1.00
1.10
1.20
1.30
1.40
1.50
1.60
1.70
1.80
1.90
2.00
20,400 20,401 40,800 40,801 61,200 61,201 81,600 81,601 102,000 102,001
Production Level (units)
Cost
s (£
)
Supervisor Costs - Stepped Fixed
Gema Material Costs - Variable
Other Prod'n Costs - Variable
Other Prod'n Costs - Fixed
General Admin Cost - Fixed
2727
Total Costs Behaviour?Total Costs Behaviour?
How will the cost per doll change with increased How will the cost per doll change with increased production?production?
What do we call this phenomenon?What do we call this phenomenon?
Does this principal invariably work?Does this principal invariably work?
Can you think of a wider impact of this Can you think of a wider impact of this phenomenon?phenomenon?
2828
Why do women live longer than Why do women live longer than men?men?
2929
3030
EUE43E: ‘Trade & EUE43E: ‘Trade & Commerce’Commerce’
Understanding Break-Even Understanding Break-Even
Robert J. WilliamsRobert J. Williams
3131
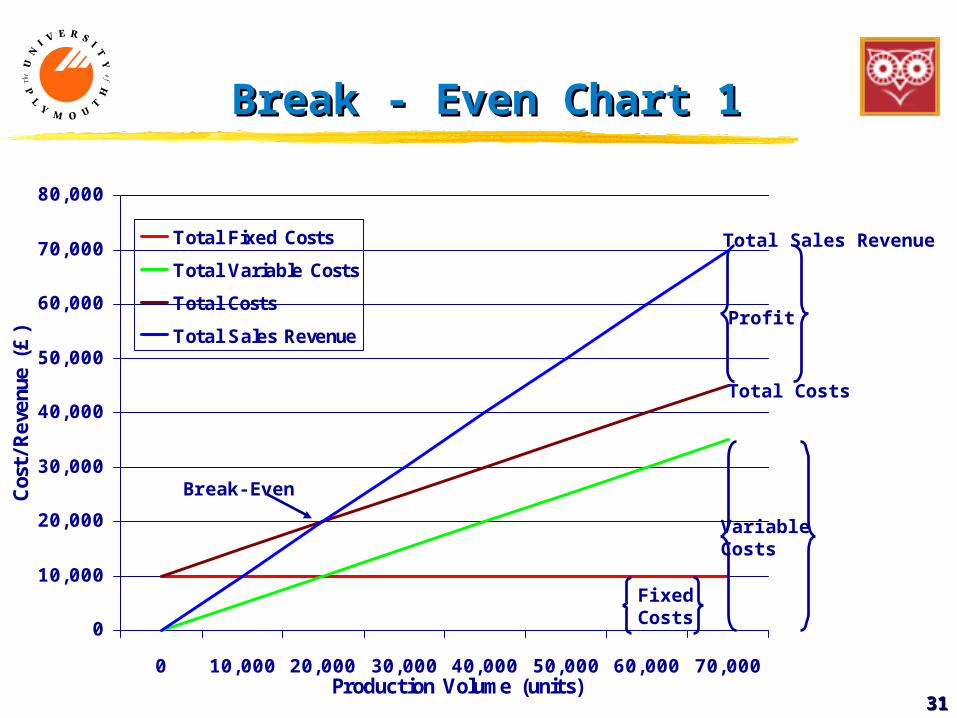
Break - Even Chart 1Break - Even Chart 1
0
10,000
20,000
30,000
40,000
50,000
60,000
70,000
80,000
0 10,000 20,000 30,000 40,000 50,000 60,000 70,000Production Volume (units)
Cos
t/Rev
enue
(£
)
Total Fixed Costs
Total Variable Costs
Total Costs
Total Sales Revenue
FixedCosts
Variable Costs
Total Costs
Total Sales Revenue
Profit
Break-Even
3232
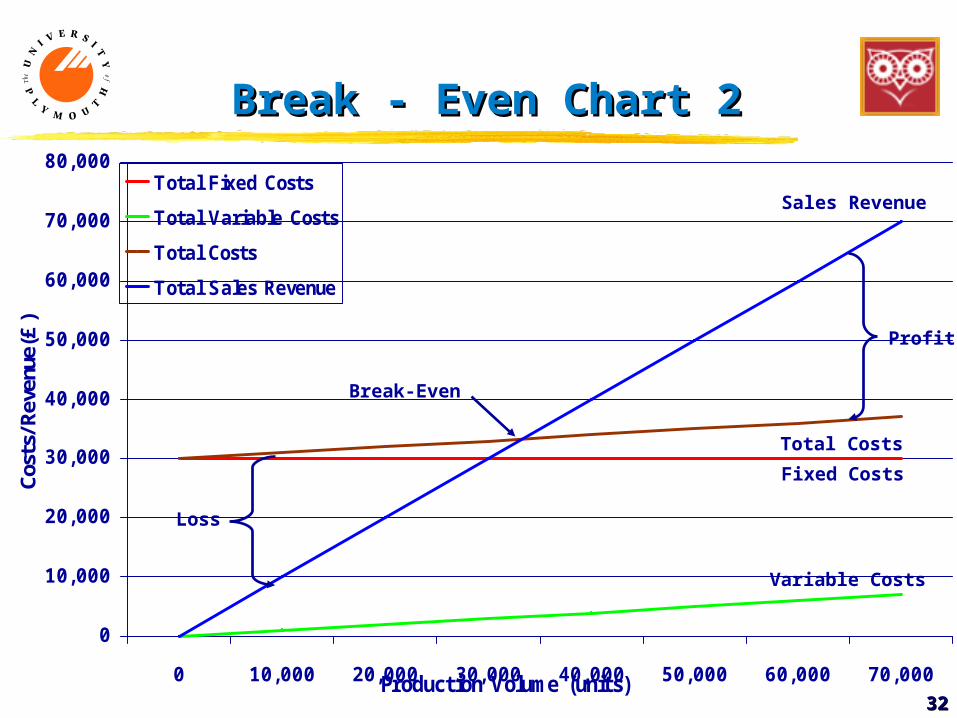
Break - Even Chart 2Break - Even Chart 2
0
10,000
20,000
30,000
40,000
50,000
60,000
70,000
80,000
0 10,000 20,000 30,000 40,000 50,000 60,000 70,000Production Volume (units)
Cos
ts/R
even
ue(£
)
Total Fixed Costs
Total Variable Costs
Total Costs
Total Sales Revenue
Fixed Costs
Variable Costs
Total Costs
Sales Revenue
Profit
Loss
Break-Even
3333
3434
EUE43E: ‘Trade & EUE43E: ‘Trade & Commerce’Commerce’
ProductProduct Pricing Pricing
Robert J. WilliamsRobert J. Williams
3535
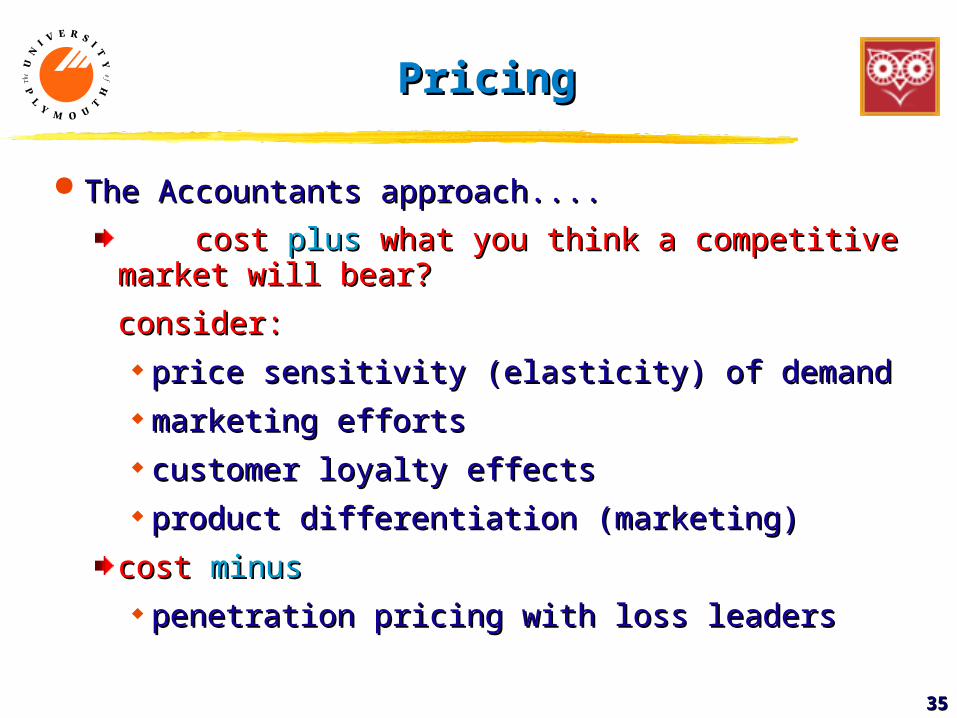
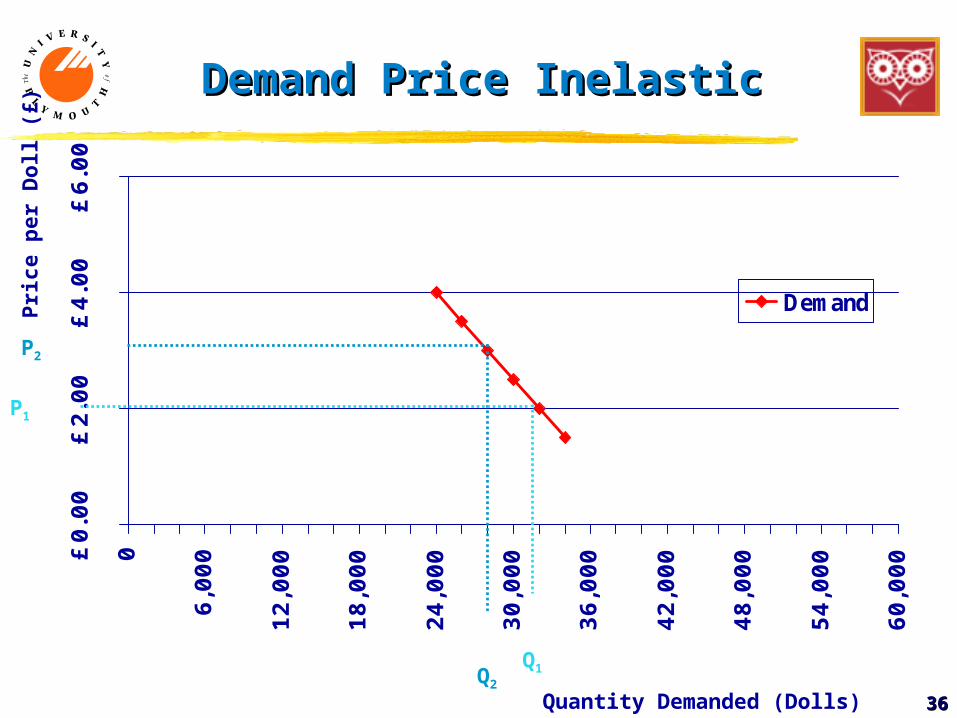
PricingPricing
The Accountants approach....The Accountants approach....
cost cost plusplus what you think a competitive what you think a competitive market will bear?market will bear?
consider:consider: price sensitivity (elasticity) of demandprice sensitivity (elasticity) of demand marketing effortsmarketing efforts customer loyalty effectscustomer loyalty effects product differentiation (marketing)product differentiation (marketing)
cost cost minus minus penetration pricing with loss leaderspenetration pricing with loss leaders
3636
Demand Price InelasticDemand Price Inelastic£
0.0
0£
2.0
0£
4.0
0£
6.0
0
0
6,0
00
12,0
00
18,0
00
24,0
00
30,0
00
36,0
00
42,0
00
48,0
00
54,0
00
60,0
00
DemandPri
ce p
er
Doll (
£)
Quantity Demanded (Dolls)
P2
Q2
P1
Q1
3737
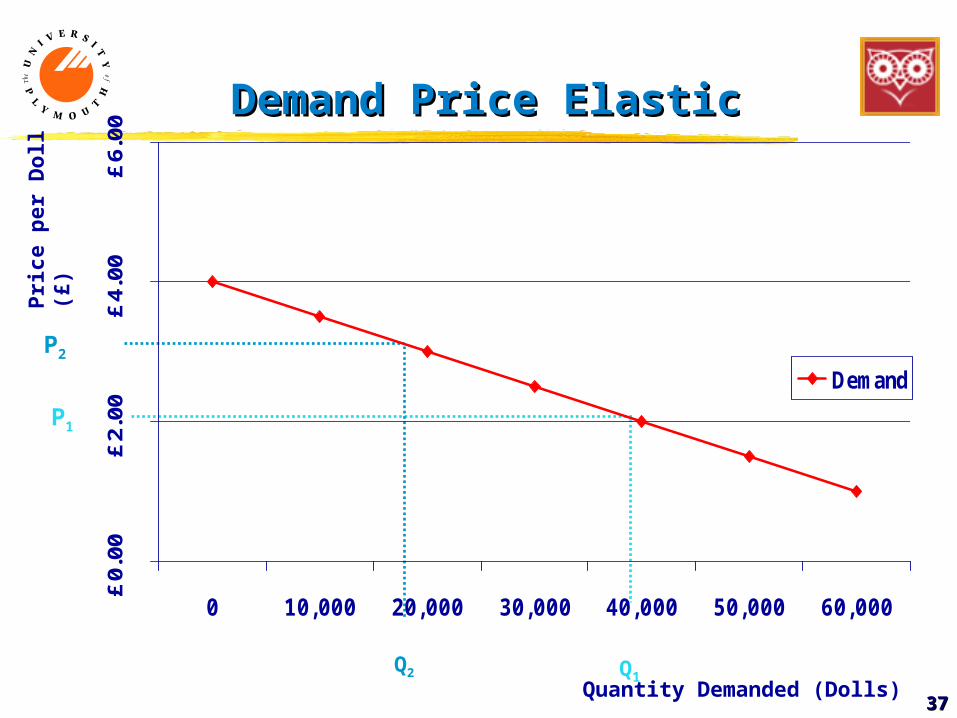
Demand Price ElasticDemand Price Elastic
P1
Q1
P2
Q2
£0.
00£
2.00
£4.
00£
6.00
0 10,000 20,000 30,000 40,000 50,000 60,000
Demand
Pri
ce p
er
Doll
(£)
Quantity Demanded (Dolls)
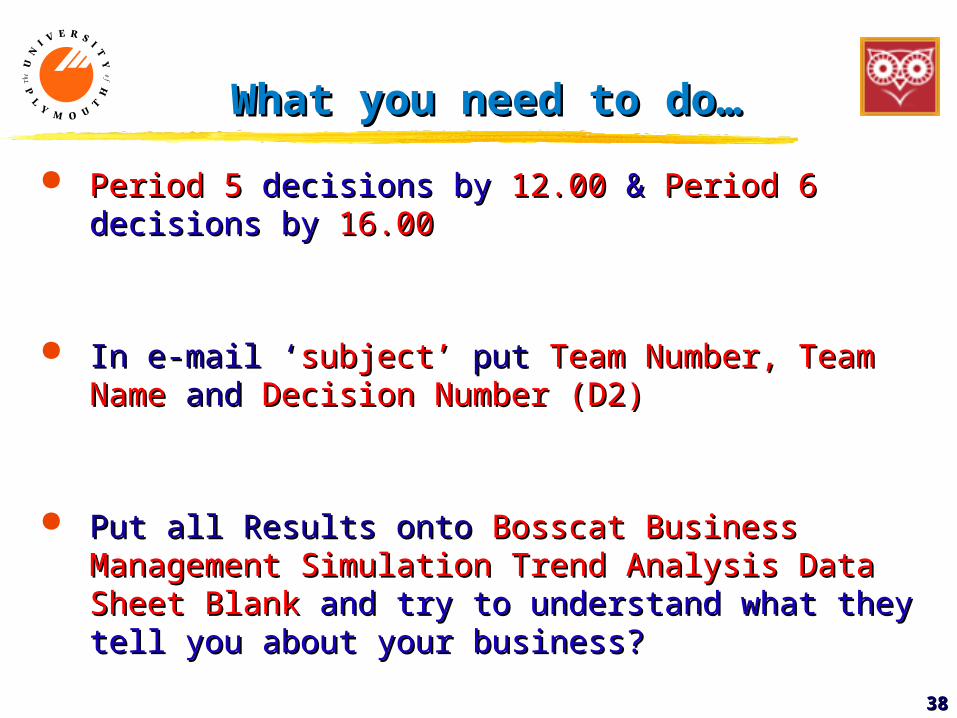
What you need to do…What you need to do…
Period 5 Period 5 decisions bydecisions by 12.00 12.00 & & Period 6 Period 6 decisions bydecisions by 16.0016.00
In e-mail ‘In e-mail ‘subject’subject’ put put Team Number, Team NameTeam Number, Team Name and and Decision Number (D2)Decision Number (D2)
Put all Results onto Put all Results onto Bosscat Business Management Bosscat Business Management Simulation Trend Analysis Data Sheet Blank Simulation Trend Analysis Data Sheet Blank and try and try to understand what they tell you about your to understand what they tell you about your business?business?
3838
3939
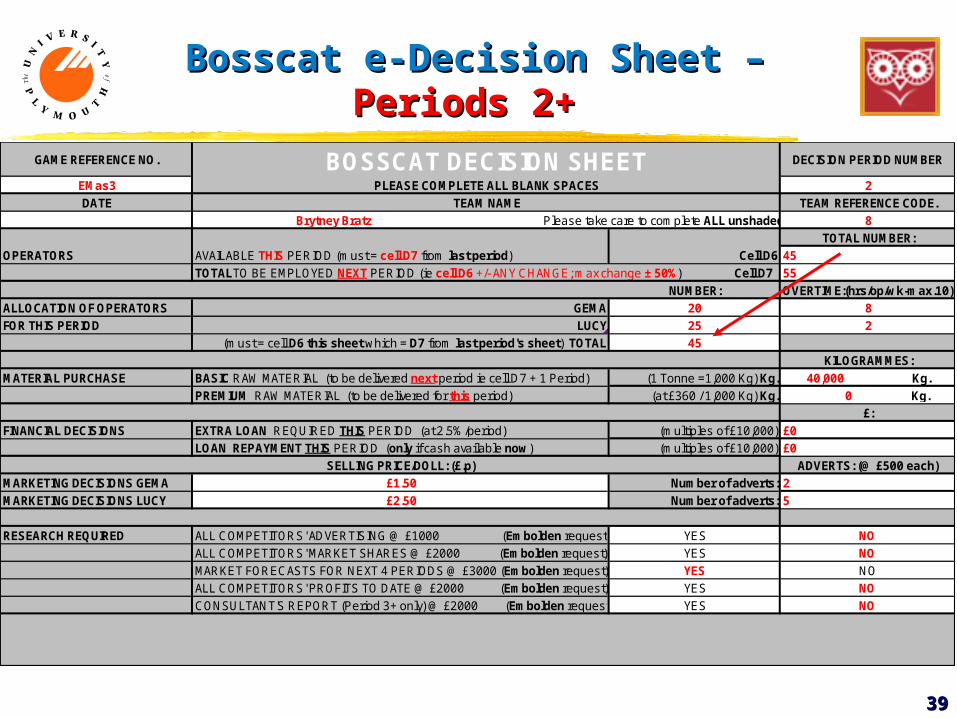
Bosscat e-Decision Sheet – Bosscat e-Decision Sheet – Periods 2+Periods 2+
GAME REFERENCE NO. DECISION PERIOD NUMBER
EMas3 2DATE TEAM REFERENCE CODE.
8TOTAL NUMBER:
OPERATORS AVAILABLE THIS PERIOD (must = cell D7 from last period) Cell D6 4555
NUMBER: OVERTIME:(hrs/op/wk-max.10)ALLOCATION OF OPERATORS GEMA 20 8FOR THIS PERIOD LUCY 25 2
(must = cell D6 this sheet which = D7 from last period's sheet) TOTAL 45KILOGRAMMES:
MATERIAL PURCHASE BASIC RAW MATERIAL (to be delivered next period ie cell D7 + 1 Period) (1 Tonne =1,000 Kg) Kg. 40,000 Kg.PREMIUM RAW MATERIAL (to be delivered for this period) (at £360 / 1,000 Kg) Kg. 0 Kg.
£:FINANCIAL DECISIONS EXTRA LOAN REQUIRED THIS PERIOD (at 2.5%/period) (multiples of £10,000) £0
LOAN REPAYMENT THIS PERIOD (only if cash available now) (multiples of £10,000) £0SELLING PRICE/DOLL: (£.p) ADVERTS: (@ £500 each)
MARKETING DECISIONS GEMA £1.50 Number of adverts: 2MARKETING DECISIONS LUCY £2.50 Number of adverts: 5
RESEARCH REQUIRED ALL COMPETITORS' ADVERTISING @ £1000 (Embolden request) YES NO ALL COMPETITORS' MARKET SHARES @ £2000 (Embolden request) YES NO MARKET FORECASTS FOR NEXT 4 PERIODS @ £3000 (Embolden request) YES NO ALL COMPETITORS' PROFITS TO DATE @ £2000 (Embolden request) YES NO CONSULTANT'S REPORT (Period 3+ only) @ £2000 (Embolden request) YES NO
TOTALTO BE EMPLOYED NEXT PERIOD (ie cell D6 +/- ANY CHANGE; max change ± 50%) Cell D7
PLEASE COMPLETE ALL BLANK SPACESTEAM NAME
BOSSCAT DECISION SHEET
Brytney Bratz Please take care to complete ALL unshaded cells correctly.
4040
EUE43E: ‘Trade & EUE43E: ‘Trade & Commerce’Commerce’
The EndThe End
Robert WilliamsRobert Williams