Embed Size (px)
Citation preview

1
Fall 2004 Freshman
Profile
September 9, 2004

2
2004-2005 Fall Freshman Applicants by Residency
63%
37%
Resident 6690Non-Resident 3918
Total Number of Applications = 10608 (+13%)
2004-2005 Fall Freshman Applicants by Ethnicity
7% 7%
86%
African-American Students - 766
Other Minority Students - 729
Non-Minority Students - 9113

3
2004-2005 Fall Freshman Admission Summary
77%
23%
Admitted Students - 8141
Denied Students - 2467
Total Number of Applications = 10608 (+13%)

4
2004-2005 Fall Freshman Admitted by Selective/Competitive
Selective - 91.4%
Competitive - 8.6%
Total Number of Admitted Students = 8141 (+8%)

5
2004-2005 Fall Freshman Enrollment by Gender
47%
53%
Male Female
2004-2005 Fall Freshman Resident/Non-Resident Enrollment
22%
78%
Non-Resident Students -878Resident Students - 3109
Total Number of Enrolled Students = 3987 (+9%)
2004-2005 Fall Freshman Enrollment by Ethnicity
6% 5%
89%
African-American - 256Other Minority - 199Non-Minority - 3532

6
2004 to 2005 Fall Freshman Academic Profile (Middle 50 %)* (Admitted)
Academic Grade Point Average 3.3 - 3.9 / 2.5 2.6 2.7 2.8 2.9 3.0 3.1 3.2 3.3 3.4 3.5 3.6 3.7 3.8 3.9 4.0 3.3 – 3.9
ACT Composite 22 – 28/ 20 21 22 23 24 25 26 27 28 29 30 22 - 28 *The College Board encourages institutions to report their academic profiles using the range of the middle fifty percent as more descriptive of the freshman class than the use of a mean. Twenty-five percent of the admitted freshman class have qualifications on either side of the shaded area.
2004
2004
2003
2003

7
2004 to 2005 Fall Freshman Academic Profile (Middle 50 %)* (Enrolled)
Academic Grade Point Average 3.3 - 3.9 / 2.5 2.6 2.7 2.8 2.9 3.0 3.1 3.2 3.3 3.4 3.5 3.6 3.7 3.8 3.9 4.0 3.3 – 3.9
ACT Composite 22 – 27/ 20 21 22 23 24 25 26 27 28 29 30 22-27 *The College Board encourages institutions to report their academic profiles using the range of the middle fifty percent as more descriptive of the freshman class than the use of a mean. Twenty-five percent of the admitted freshman class have qualifications on either side of the shaded area.
2004
2004
2003
2003

8
Comparative Mid-Fifty Freshman Students Profile
ACT Composite Scores
33
32
University of Kentucky 31
30
29
28
27
26
25
24
23
22
21
20
19
18
17
16
15
KY ACT Scores of High School Students (17 – 23)
National ACT (18 –25)

9
Benchmark Comparison of Mid-Fifty Percentile on ACT
From: www.collegeboard.com/Splash
University of Kentucky 22-27
University of Arizona 21-26
Purdue University 23-28
Ohio State University 23-27
University of Iowa 22-27
University of Minnesota - Twin Cities 22-28
University of Washington 22-28
North Carolina State University 23-28
Pennsylvania State University 24-29
Texas A&M University 23-28
University of Georgia 24-29
University of Texas - Austin 22-28
University of Illinois - Urbana-Champaign 26-30
University of Wisconsin - Madison 25-30
University of Florida 24-29
University of Maryland - College Park 26-31
University of North Carolina - Chapel Hill 24-30
University of California - Los Angeles 22-29
University of Michigan - Ann Arbor 26-30
University of Virginia 25-31

10
2004-2005 Freshman Class Highlights
35 National Merit Scholars
2 National Achievement Scholars
275 Governor’s Scholars
28 Governor’s School for the Arts
157 Valedictorians
256 African-Americans (+20%) (Applicants 766 (+31%))
Top 24% of Freshman Class scored 28 or higher on
ACT
Top 35% of the Freshman Class presented high school GPA of 3.8 or higher
11
Fall 2004
Enrollment Report
September 9, 2004

12
Fall 2004 Total Enrollment Comparisons
0
5000
10000
15000
20000
25000
30000
Undergraduate Graduate Professional Total
Fall 2004 Fall 2003 Fall 2002

13
Fall 2004 Enrollment by Full-Time/Part-Time
21584
21051
20416
5316
5362
5475
0 5000 10000 15000 20000 25000 30000
Total 26900
Total 26413
Total 25891
Fal
l 200
4F
all 2
003
Fal
l 200
2
Full-Time Students Part-Time Students

14
Fall 2004 Enrollment Comparison by Residency
21347
21133
20909
4098
3777
3434
1455
1503
1548
0 5000 10000 15000 20000 25000 30000
Fall 2004 26900
Fall 2003 26413
Fall 2002 25891
Resident Non-Resident International
15
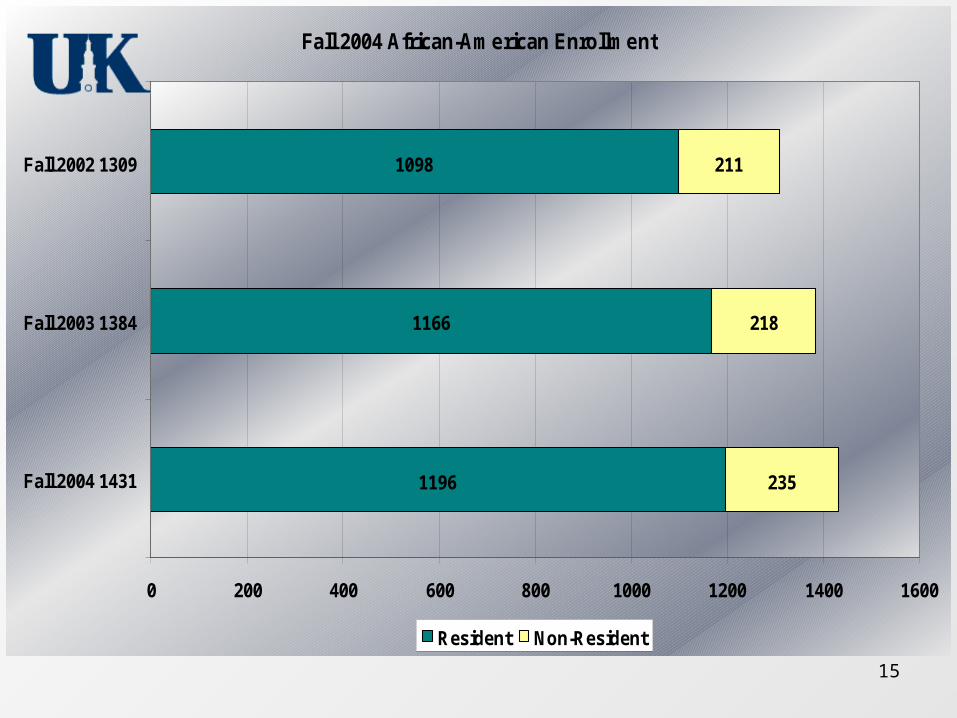
Fall 2004 African-American Enrollment
1196
1166
1098
235
218
211
0 200 400 600 800 1000 1200 1400 1600
Fall 2004 1431
Fall 2003 1384
Fall 2002 1309
Resident Non-Resident

16
September 9, 2004
Fall 2004
Undergraduate
Enrollment Report

17
Fall 2004 Undergraduate Full-Time/Part-Time Enrollment
16963
16453
16011
1853
1885
1975
14500 15000 15500 16000 16500 17000 17500 18000 18500 19000 19500
Total 18816
Total 18338
Total 17986
Fall
2004
Fall
2003
Fall
2002
UG Full-Time UG Part-Time

18
Fall 2004 Undergraduate Enrollment by College
1725
0
4137
2330
517
1329 16
39 1931
745
534
0
561
203
69
3096
1748
0
3868
2547
508
1243 15
15
1967
732
444
0
488
228
87
2963
1093
326
3559
2713
0
1269 14
56
2004
757
428
790
446
207
44
2894
0
500
1000
1500
2000
2500
3000
3500
4000
4500
Fall 2004 Fall 2003 Fall 2002
* Changes in Departments & Colleges Affect the Comparisons

19
Fall 2004 Undergraduate Enrollment by Type
0
2000
4000
6000
8000
10000
12000
14000
New Freshmen New Transfers New Non-Degree &Readmitted
Returning
Fall 2004 Fall 2003 Fall 2002

20
September 9, 2004
Fall 2004
Graduate
Enrollment Report

21
Fall 2004 Graduate Full-Time & Part-Time Enrollment
3201
3213
3051
2945
2950
2926
0 1000 2000 3000 4000 5000 6000 7000
Total 6146
Total 6163
Total 5977
Fal
l 200
4F
all 2
003
Fall
2002
Grad Full-Time Grad Part-Time

22
Fall 2004 Graduate Enrollment by Type
1481
249
4416
6146
1631
249
4283
6163
1669
227
4081
5977
0
1000
2000
3000
4000
5000
6000
7000
New Readmitted Returning Total
Fall 2004 Fall 2003 Fall 2002

23
September 9, 2004
Fall 2004
Professional
Enrollment Report

24
Fall 2004 Professional Full-Time & Part-Time Enrollment
1420
1385
1354
518
527
574
0 500 1000 1500 2000 2500
Total 1938
Total 1912
Total 1928
Prof Full-Time Prof Part-Time

25
Fall 2004 Professional Schools by College
235
424
863
416
230
413
841
428
206
397
849
419
0
100
200
300
400
500
600
700
800
900
1000
Dentistry Law Medicine Pharmacy
Fall 2004 Fall 2003 Fall 2002

26
Fall 2004 Professional Schools by Type
545
1393
1938
539
1373
1912
563
1365
1928
0
500
1000
1500
2000
2500
New & Readmitted Returning Total
Fall 2004 Fall 2003 Fall 2002

27
Fall 2004
Student
Assessments
September 9, 2004

28
Fall 2004 Student Fee Assessment
$77,320,832.40 77%
$109,734.90 0%
$8,439,800.00 8%
$14,830,785.00 15%
Fall 2004 Tuition -77,320,832 Study Aboard Program - 109,734.90
Fees - 8,439,800 Housing/Dining - 14,830,785

29
2004 Fall Tuition Assessmentby Residency
64%
36%
Resident - $49,163,156 Non-Resident-$28,157,676
Total - $77,320,832 (+17%)

30
Fall 2004 Student Fee Assessment
by Classification
66%
21%
3% 2% 4%
1%
0%
3%
Undergraduate-$50,926,079.40 Graduate-$16,075,282.20
Law-$2,347,951 Dentistry-$1,870,698
Medicine-$3,455,026 PubHlth/PhysAsst/RadHlth-$574,427.60
NursingP-$97,956 Pharmacy-$1,973,412.20

31
Fall 2004
Highlights
Total Enrollment 26,900 (+2%)
Undergraduate Enrollment 18,816 (+3%)
A Freshman class of 3987 (+9%)
Increased Non-Resident Enrollment (+9%)
Increased African-American Enrollment (+3%)
Increased Full-Time Enrollment (+3%)
337 Legacy Scholarships (+23%) (152 Freshmen, 92 Sophomores, 53 Juniors, 40 Seniors)