Embed Size (px)
Citation preview

1
FI 8360 Spring 2003
Corporate Financial Strategy Roger A. Morin, PhDDistinguished Professor Finance,
College of Business, Georgia State University
Chairman & CEO Utility Research International

2
FI 8360Lecture #1 Roadmap
Course overview & organization Valuation and the “Value Movement” Lecture #2 preview

3
Value Creation
Principle that overall business strategies and their implementation should be guided by the pursuit and selection of alternatives which maximize shareholder value

4
The Va lue- Ba sed M a na gem ent Fra m ework
Va lue
Figure 1. The Va lue- Ba sedM a na gem ent Fra m ew ork
Stra teg ic
Fina ncia l
Corpora teG overna nce

5
Present Va lue
PresentVa lue
FutureCa sh Flows
Cost ofCa p ita l
Figure 2. Present Va lue

6
Economic Value
n E(Ct)
Present Value = ------------- t=0 (1 + k)t
Future value corresponds to future and uncertain business cash flows, Ct. So we discount expected cash flows
Cash flow and Risk
Because business cash flows occur over many future periods, we locate them in time, then discount and add them all.
Timing
Because business cash flows are risky, investors demand a higher return: the discount rate, k, contains a risk premium.
Risk

EMBA Finance II
Asset Valuation
PV =
CF
1+ k ... +
CF
1+k1 n
12
21
CF
kn .
0 1 2 nk
CF1 CFnCF2Value
...
+ ++

8
How Investors Value Securities
n
Bond Value = Cash Flowt
t=1 (1 + k)t
n
Stock Value = Dividendst ~ D1
t=1 (1 + k)t k - g
9
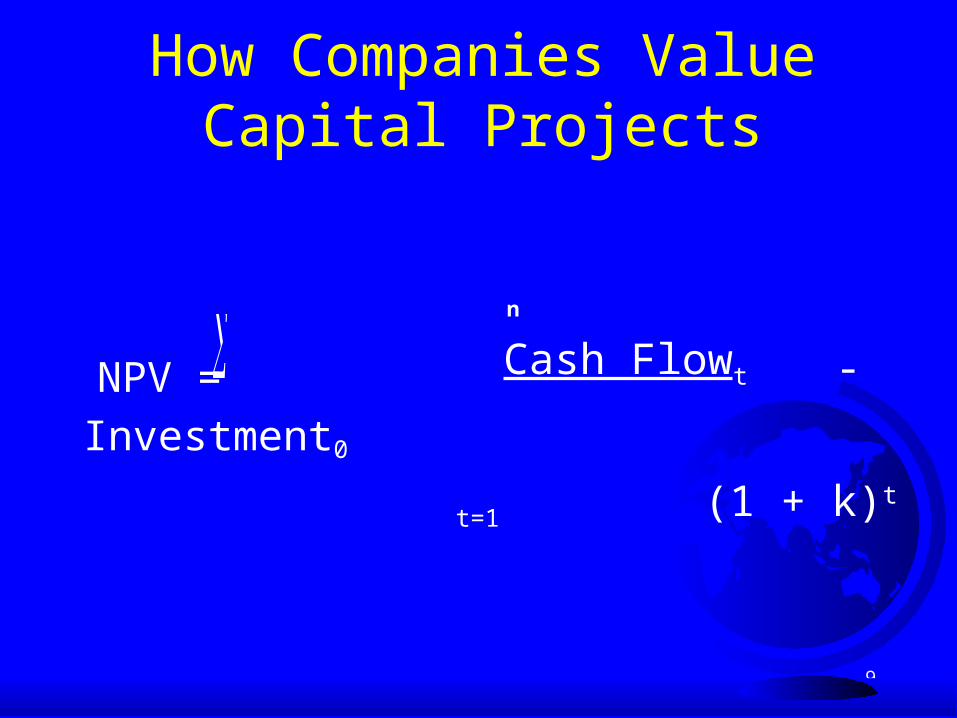
How Companies Value Capital Projects
n
NPV = Cash Flowt - Investment0
t=1 (1 + k)t

10
Corporate Value
infinity
Value = Cash Flowt
t=0 (1 + Cost of Capital)t

11
Free cash flow is the basis of value!
Investors watch this pattern……
….which is “cash in and cash out”
Free cash flow = NOPAT adjusted for depreciation and other accounting elementsLess net investment in working capital, fixed assets, capitalized R&D, etc.
Trend
Time

12
Shareholder value analysis focuses on the factors that investor use to
value companies:
Cash Flows Long-Term Expected Performance Risk

13

14
Com pa ny Va lue
Ca shFlow
Cost ofCa p ita l
Com pa nyVa lue
Figure 3. Determ ina nts of Va lue
Return
Risk
G rowth
Ca pita l

15
Alternative Valuation Framework
NOPAT
V = -------------
K
Where: NOPAT = Net Operating Profits After Tax
K = Cost of Capital
V = As Is Value

16
Valuation Framework
NOPAT R - K
V = ------------- + ------------ * I * T
K K
WHERE: NOPAT = NET OPERATING PROFITS AFTER TAX
K = COST OF CAPITAL
R = RETURN ON CAPITAL
I = ANNUAL INCREMENTAL INVESTMENT
T = NO. OF YEARS THAT I CAN BE INVESTED
AT R > K
V = As Is Value + Value Growth Opportunities

17
3 Factors in Value Creation
ROI > WACCAmount of InvestmentInterval of Competitive Advantage
Note:
– Forward-looking– Expected cash flows

18
Fundamental Principle of Valuation
CORPORATE RETURN
MARKET VALUE = ---------------------------------------------------
INVESTORS’ REQUIRED RETURN
MARKET VALUE RETURN ON TOTAL CAPITAL
-------------------------------- = -------------------------------------------
CAPITAL EMPLOYED COST OF CAPITAL

19
Value Created for Shareholders
(R - K) M/B - 1 = ------------- (K - G)
Spread return on equity over cost of equity Volume of new investment measured as earnings
retained in the business Duration of positive spread Note: Growth adds value only if R > K

20
VALUE CREATION
VALUE
SPREAD
RETURN ONEQUITY
COST OFEQUITY
GROWTH
Value Creation

21
0
2
4
6
SALES GROWTH
MA
RK
ET
-TO
-BO
OK
RA
TIO
3.00% 4.50% 7.50% 10.50% 13.50% 15.00%
SPREAD < -5%
SPREAD -5% to -2%
SPREAD -2% to +2%
SPREAD +2% to +5%
SPREAD > 5%
VALUE vs SPREADS & GROWTHMARKET-TO-BOOK RATIOS

22
Shareholder Value Network
Creating ShareholderValue
Shareholder Return• Dividends• Capital Gains
CorporateObjective

23
Shareholder Value Network
Creating ShareholderValue
Shareholder Return• Dividends• Capital Gains
Cash Flow FromOperations
Discount Rate Debt
CorporateObjective
ValuationComponents

24
Shareholder Value Network
Creating ShareholderValue
Shareholder Return• Dividends• Capital Gains
Cash Flow FromOperations
Discount Rate Debt
• Value Growth Duration
• Sales Growth• Operation Profit Margin• Income Tax Rate
• Working Capital Investment• Fixed Capital Investment
• Cost of Capital
CorporateObjective
ValuationComponents
ValueDrivers

25
Shareholder Value Network
Creating ShareholderValue
Shareholder Return• Dividends• Capital Gains
Cash Flow FromOperations
Discount Rate Debt
• Value Growth Duration
• Sales Growth• Operation Profit Margin• Income Tax Rate
• Working Capital Investment• Fixed Capital Investment
• Cost of Capital
Operating Investment Financing
CorporateObjective
ValuationComponents
ValueDrivers
ManagementDecisions

26
Shareholder Value and Value Drivers
Investment decisions Working capital investment Fixed capital investment
Financing decisions Cost of capital Debt-equity mix Dividend policy
Operating decisions Sales growth Operating profit margin Income tax rate
Value growth duration

27
Value Creation - Another View
Value Created = (Return On Investment
- Cost of Capital)
x Capital employed
Dependent Upon: Cost of Capital Spread Duration of Spread Amount of Capital Employed

28
Economic Value Added
(r - c*) x capital
NOPAT - c* x capital
Operating profits - a capital charge
EVA ties directly to NPV
NPV = market value - capital
NPV = the present value of projected EVA
Market value = capital + P.V. of projected EVA
c* = WACC r = NOPAT / Capital

29
The Va lue- Ba sed M a na gem ent Fra m ework
Va lue
Figure 1. The Va lue- Ba sedM a na gem ent Fra m ew ork
Stra teg ic
Fina ncia l
Corpora teG overna nce

30
Stra teg ic D eterm ina nts of Va lue Crea tion
Com petitive PositionFinancia l
Determ ina nts
M a rket Econom ics
Figure 6. Stra teg ic D etermina nts of Va lue Crea tion
Differentia tion ,Cost Position
Structura lFa cto rs & Trends
Va lue
Sprea d
G rowth
Investm entSca le

31
H igh
W eak A verage Stro ng
M ed ium
Low
Increa sing Va lue Crea tion Potentia l
Incre
asin
g V
alu
e C
rea
tion
Po
ten
tial
MA
RK
ET A
TTR
AC
TIV
ENES
S
CO M PETITIVE PO SITIO N
Actua l
Desired
Improving Stra tegic Position Crea tes Va lue
Figure 7. M a rket A ttra ctiveness/ Comp etitive Position M a trix

32
H ig h
Wea k
Excellen t va lue crea tion po tentia l(h ig h susta ina b le p ro fits a nd growth)G row - a nd - b uild stra tegy
D a ng er o f va lue d issipa tion(low or n eg a tive RO I sp rea ds)Position a nd / or stra teg y cha ng e need ed
Va lue destruction like ly(neg a tive RO I sprea d s)Divest unless p osition ca n b e im p roved
G ood va lue crea tion p oten tia l(keep RO I sp rea d p ositive)Selective g row th
Fa ir to p oor va lue crea tion p oten tia l(d epen din g on susta in a ble ca sh flows)Emp ha size ca sh flow a nd w a tch RO I sp rea d
A vera g e Strong
M edium
Low
Increa sing Va lue Crea tion Potentia l
Incre
asin
g V
alu
e C
rea
tion
Po
tentia
l
IND
USTR
Y R
OI
SPR
EAD
CO M PAN Y RO I SPREAD(RO I - Cost of Ca pita l)
PO SITIO N S A N D IM PLICATIO N S FO R CO RPO RATE STRATEG Y
Im porving Stra tegic Position Crea tes Va lue
Figure 8. Stra tegy a nd Va lue Crea tion
F
A
33
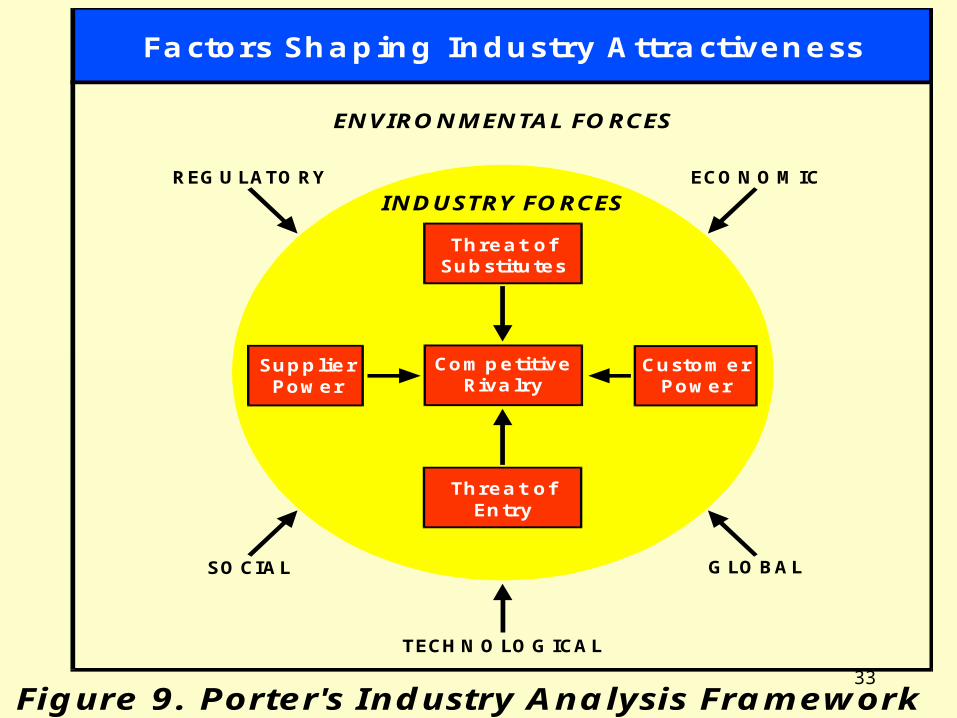
Fa ctors Sha ping Industry A ttra ctiveness
Com petitiveRiva lry
Custom erPower
SupplierPower
REG U LATO RY
SO CIAL G LO BAL
ECO N O M IC
IN DUSTRY FO RCES
EN VIRO N M EN TAL FO RCES
TECH N O LO G ICA L
Threa t ofSubstitutes
Threa t ofEntry
Fig ure 9. Porter's Ind ustry Ana lysis Fra m ew ork

34
Va lue Cha in Business Systemor
Support A ctivities
Prima ry A ctivities
M a rg in
O U TPU TSIN PU TS
Figure 10. The Ba sic Va lue Cha in

35
Flexib ility to Exercise G rowth O ptions
IntenseCompetitive
Riva lry
Sha redO ptions
Threa t o f pre- em ptio n ; the m a rketpo w er o f do m ina nt firm s increa sestheir ab ility to o bta in fu ll va lue o fthe o ptio ns exercised .
Tendency to de la y o ptio n exerciseuntil the w ea ker p layers exercisethem .
N o threa t o f to ta l p re- em ptio n ; butrisk o f lo ss o f va lue o f the o ptio nbecause o f co m petitio n .
Tendency to exercise the o ptio n ea rlyin o rder to a vo id ero d ing the va lueo f the o ptio n .
D o m ina nt firm s ca n benefit fu lly fro mthe va lue o f the o ptio n .
N o risk o f pre - em ptio n ; o ptio ns a reheld until m a turity.
Little a b ility to benefit fro m the fu llva lue o f a n investm ent o ppo rtunity.
Q u ick exercise o f o ptio ns in orderto surpa ss a co m petito r o r fo rdefensive rea so ns.
Proprieta ryO ptions
M inima lCompetitive
Riva lry
Figure 11. Stra tegy a nd O p tion Va lue

36
Stra tegic Determ ina nts of Va lue
Figure 12. Stra tegy M odule of VBM Fra m ew ork
FO RCES
IN DUSTRY
FO RCES
EN VIRO N M EN TAL O PTIO N VALU E
Sup port A ctivities
Prima ry Activities
M a rgin O U TPU TSIN PU TS
Increa sing Va lue Crea tionPotentia l
Incre
asin
g V
alu
e C
rea
tion
Po
ten
tial
MA
RK
ET A
TTR
AC
TIV
EN
ESS
CO M PETITIVE PO SITIO N
A ctua l
Desired
IntenseCompetitive Riva lry
Sha redO ptions
Proprieta ryO ptions
M inima lComp etitive Riva lry

37
Strategic Drivers
Optimal Cost Structure Competitive Advantage Asset Utilization Protect Strategic Resources Reduce Risk Value Based Management

38
Value Drivers and Strategy
VALUE
Cash Flows Discount Rate
Value Growth Duration
• Sales Growth• Profit Margin• Tax Rate
• Working Capital • Fixed Capital
Cost of Capital
Operating Investment Financing
CorporateObjective
ValuationComponents
ValueDrivers
ManagementStrategies

39
Strategic Value Drivers
ReturnRisk
Value
Financial Value Drivers
Sales growth Working Capital Tax rate
Profit Margin Fixed Assets Cost of Capital
OperationalValue Drivers
Unit sales volume Selling termsPrices Vendor termsProduct mix Purchasing policiesLabour rate Payment proceduresOverhead Sourcing strategiesProductivity Capital budgetingWork schedules Innovation tacticsDowntime Location decisions
From Macro to Micro Drivers

40
Strategic Value Drivers
ReturnRisk
Value
Financial Value Drivers
Sales growth Working Capital Tax rate
Profit Margin Fixed Assets Cost of Capital
OperationalValue Drivers
Production costs per kWhNon-production costs per kWhLoad factorFuel mix in MWhGrowth in total MWh salesAverage prices
From Macro to Micro Drivers

41
Strategic Value Drivers
ReturnRisk
Value
Financial Value Drivers
Sales growth Working Capital Tax rate
Profit Margin Fixed Assets Cost of Capital
OperationalValue Drivers
Operating cost per customerOperating cost per units distributedElectricity/gas distributed per employeeDistribution operating profit per customer
From Macro to Micro Drivers

42
The Va lue- Ba sed M a na gem ent Fra m ework
Va lue
Figure 1. The Va lue- Ba sedM a na gem ent Fra m ew ork
Stra teg ic
Fina ncia l
Corpora teG overna nce

43
Fina ncia l D eterm ina nts
Figure 13. Fina ncia l D eterm ina nts of Va lue
Re
turn
Re
turn
% Debt/ Equity Risk

44
Financial Drivers
Optimal Capital Structure Capital Allocation Based on Value Financial Engineering Minimize Tax Rate Dividend Policy

45
The Va lue- Ba sed M a na gem ent Fra m ework
Va lue
Figure 1. The Va lue- Ba sedM a na gem ent Fra m ew ork
Stra teg ic
Fina ncia l
Corpora teG overna nce

46
Corporate Drivers
Governance Performance Evaluation Incentive Compensation

47
VBM
Are accounting metrics consistent with value creation?
48
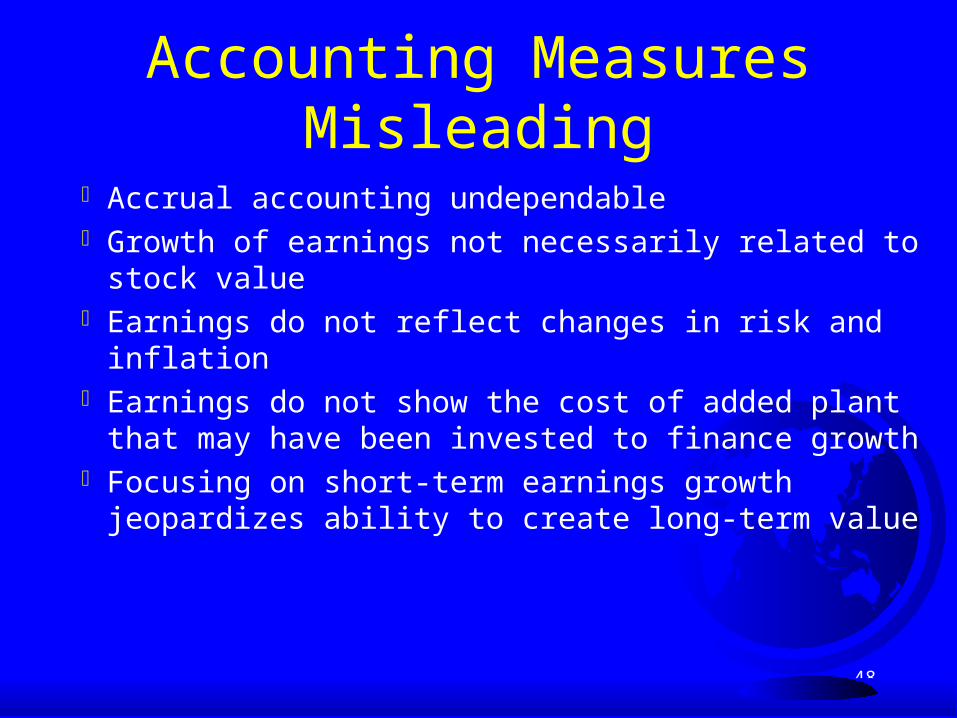
Accounting Measures Misleading
Accrual accounting undependable Growth of earnings not necessarily related to stock
value Earnings do not reflect changes in risk and inflation Earnings do not show the cost of added plant that
may have been invested to finance growth Focusing on short-term earnings growth jeopardizes
ability to create long-term value
49
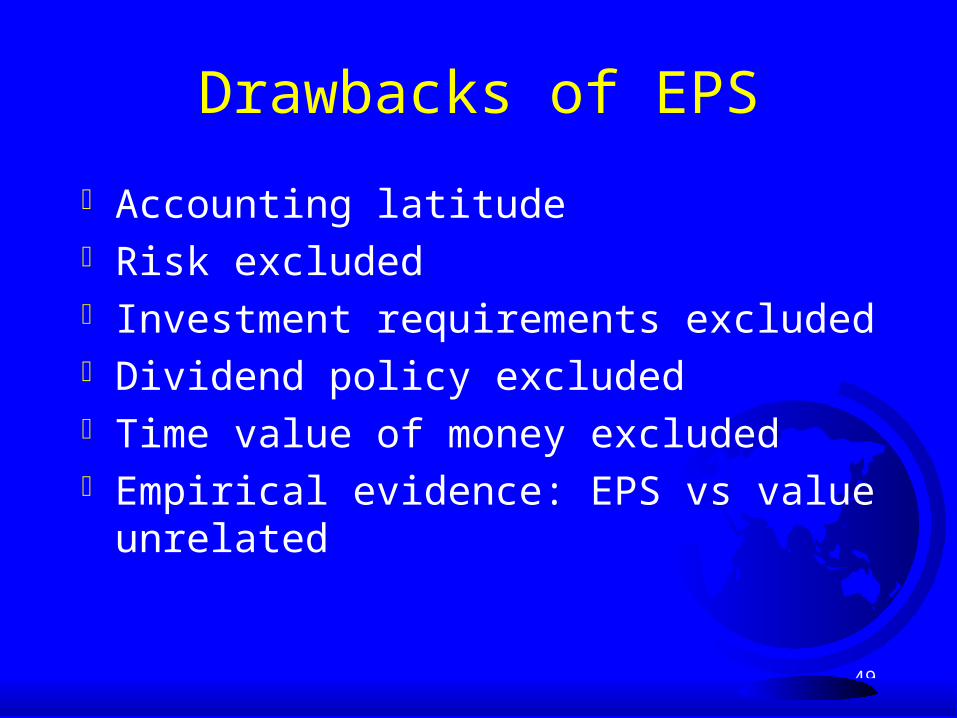
Drawbacks of EPS
Accounting latitude Risk excluded Investment requirements excluded Dividend policy excluded Time value of money excluded Empirical evidence: EPS vs value unrelated
50
The Agency Problem
Managers act in their own self-interest (corporate jets, country clubs, perks, etc.)
Shareholders do not have the influence or finances to govern issues such as election of board members
Board members tend to be largely responsive to mgt..; top mgrs... are often board members
Mgt time horizon may be short-term, due to compensation mode
Mgt tends to have lower risk tolerance than sh’ers due to compensation mode

51
How to reduce the agency problem
Large ownership positions Compensation tied to shareholder return Threat of takeovers Competitive labor markets for corporate
executives

52
VBM Fra m ework : Putting It A ll Together
Va lue
Ca shFlow
Cost ofCap ita l
CompanyVa lue
Return
Risk
G rowth
Cap ita l
Fina ncia l
Re
turn
Re
turn
% D eb t/ Eq uity Risk
Corpora te G overna nce
Perform a nce
Com pensa tion
Investor Rela tions
Stra tegic
FO RCES
IN DU STRY
FO RCES
EN VIRO N M EN TA L O PTIO N VA LU E
Supp ort Activ ities
Prima ry A ctiv ities
M a rg in O UTPU TSIN P U TS
In crea sing Va lue C reationPotentia l
Increa
sing
Va
lue
Cre
atio
nP
oten
tial
MA
RK
ET A
TTR
AC
TIV
ENES
S
CO M PETITIV E PO SITIO N
A ctu a l
D esi red
IntenseCom p etitive Riva lry
Sha redO p tions
Prop rietaryO ptions
M inim a lCom p etitive Riva lry
Figure 14. VBM Fra mew ork: Putting It A ll Together

53
VBM Process
Experiment Strategic Restructuring Value-based Planning Value-based Compensation

54
Restructuring
Value “as is” Internal improvements
– Strategic & Operating External improvements
– Acquisitions, divestitures, jvs Financial engineering HQ costs
55
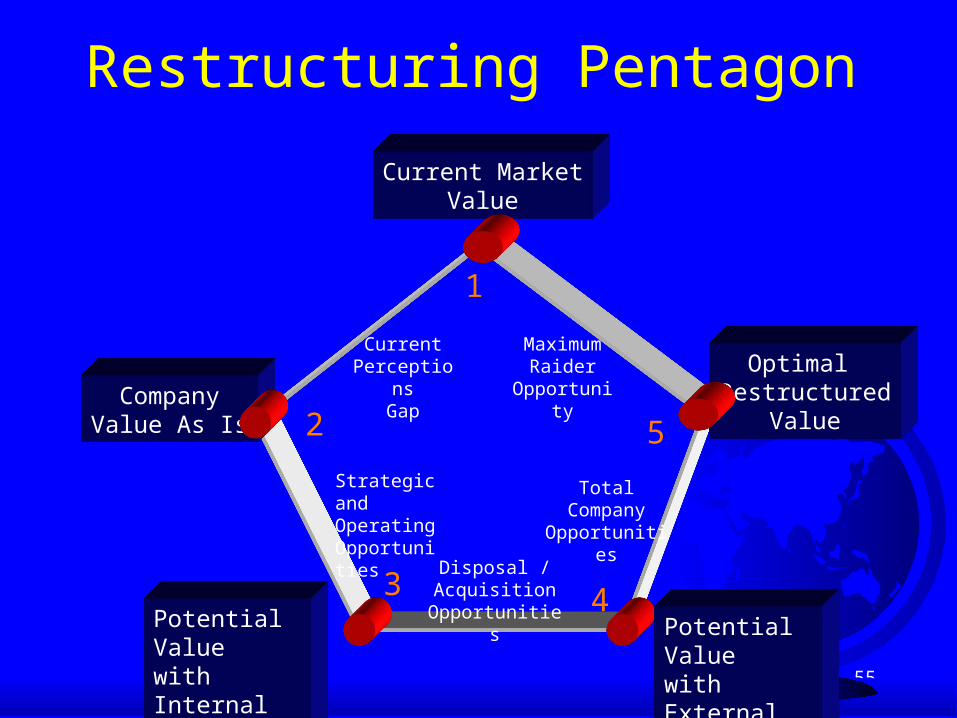
Restructuring Pentagon
Current MarketValue
Optimal Restructured
Value
Potential Valuewith Internal Improvements
CompanyValue As Is
1
2
3 4
5
Potential Valuewith External Improvements
Strategic andOperatingOpportunities
CurrentPerceptions
Gap
Disposal / Acquisition
Opportunities
MaximumRaider
Opportunity
Total CompanyOpportunities

56
Value-Based Planning
Value-creation potential of each SBU Value drivers controlled by SBU mgrs. Value objectives Capital allocation based on value-
creation potential of each SBU

57
Value Planning
$543
$438
$445
$500
$0
$500
$1,000
$1,500
$2,000
Ba
se
line
Va
lue
Gro
wth
Str
ate
gie
s
Ma
rgin
Init
iati
ve
s
Inv
es
t-m
en
ts
Me
rge
rS
av
ing
s
Sh
are
-h
old
er
Va
lue
Expected Value Creation
Mill
ion
s o
f D
olla
rs
($43)
$1,883

58
Foundations of a VBM System
Committed CEO Properly organized company Credible plans Supportive functional action
plans Realistic resource allocations Culturally compatible
strategies Effective strategy monitoring
system Compensation linked to
strategy

59
VALUE HALL OF FAME
GENERAL ELECTRIC COCA-COLA WAL-MART MERCK PHILIP MORRIS PROCTER & GAMBLE EXXON AT&T PEPSICO JOHNSON & JOHNSON BRISTOR-MYERS ABBOTT LABS
MICROSOFT WALT DISNEY INTEL MOTOROLA PFIZER HOME DEPOT AMERICAN HOME PRODUCT 3M GTE McDONALD’S BELLSOUTH GILLETTE

60
Hall of Fame CompaniesCommon Traits
Focus Global Innovation Leadership Continuous improvement Empowerment

61
Innovation
Greater new product intro Engineering, benchmarking Reward risk-taking

62
FI 8360Lecture #2 Preview
Value and Capital Markets Why Value Value The Value Manager Valuation Frameworks: DCF
NPV, FTE, FCF, APV, etc.

63
THE END