Embed Size (px)
Citation preview

1FIN 2802, Spring 10 - TangChapter 17: Macroeconomic and Industry Analysis
Fin2802: Investments
Spring, 2010Dragon Tang
Fin2802: Investments
Spring, 2010Dragon Tang
Lecture 16Macroeconomic and Industry Analysis
March 23, 2009
Readings: Chapter 17Practice CFA Problem Sets: 4,6,9,12,15
2
The Greenspan/Bernanke PutThe Greenspan/Bernanke Put
• Investors hold a put option from the Fed/Government
• When market drops, government rescues
• What’s the problem?
FIN 2802, Spring 10 - TangChapter 17: Macroeconomic and Industry Analysis

3
Current ProblemCurrent Problem
• Long term vs. short term
• Growth vs. inflation
• Trust vs. gaming
• …
FIN 2802, Spring 10 - TangChapter 17: Macroeconomic and Industry Analysis

4FIN 2802, Spring 10 - TangChapter 17: Macroeconomic and Industry Analysis
What is this?What is this?
• What’s daily trading volume of US stock market?
• What’s daily trading volume of US Treasury bonds?
• Total market size $250.8 trillion
• Daily trading volume $1.8 trillion

5FIN 2802, Spring 10 - TangChapter 17: Macroeconomic and Industry Analysis
What is this?What is this?
• What’s daily trading volume of US stock market?
– $10 billion
• What’s daily trading volume of US Treasury bonds?
– $300 billion
• Total market size $250.8 trillion
– Interest rate derivatives
• Daily trading volume $1.8 trillion
– Foreign exchanges

6FIN 2802, Spring 10 - TangChapter 17: Macroeconomic and Industry Analysis
“The actual interest rate forecast record of the world's highest paid financial ‘experts’ for forecasting interest rates is nothing short of disastrous.”
http://www.opalmagazine.com/members/_financial_articles/articles/Wall_March-2001_files/Wall_March-2001.htm

7FIN 2802, Spring 10 - TangChapter 17: Macroeconomic and Industry Analysis
Macroeconomic and Industry AnalysisMacroeconomic and Industry Analysis
Objectives:
• Effect of monetary and fiscal policies
• Economic indicators (leading, coincident, and lagging)
• Business cycles
• Effect of industry life cycles and structure

8FIN 2802, Spring 10 - TangChapter 17: Macroeconomic and Industry Analysis
Fundamental AnalysisFundamental Analysis
• Economics– Investment and consumption
• Finance
• Accounting

9FIN 2802, Spring 10 - TangChapter 17: Macroeconomic and Industry Analysis
Internet:Google
Geography and Finance

10FIN 2802, Spring 10 - TangChapter 17: Macroeconomic and Industry Analysis
• Fundamental Analysis
• Approach to Fundamental Analysis– Domestic and global economic analysis
– Industry analysis
– Company analysis
• Why use the top-down approach
Framework of AnalysisFramework of Analysis

11FIN 2802, Spring 10 - TangChapter 17: Macroeconomic and Industry Analysis
Finance and GrowthFinance and Growth

12FIN 2802, Spring 10 - TangChapter 17: Macroeconomic and Industry Analysis
Shocks to Finance and GrowthShocks to Finance and Growth
Shock to bothstock market andmacroeconomy
Shock tomacroeconomy
Shock tostock market
Stock Market Macroeconomy

13FIN 2802, Spring 10 - TangChapter 17: Macroeconomic and Industry Analysis
Global Economic ConsiderationsGlobal Economic Considerations
• Performance in countries and regions is highly variable
• Political risk
• Exchange rate risk– Sales
– Profits
– Stock returns

14FIN 2802, Spring 10 - TangChapter 17: Macroeconomic and Industry Analysis
Change in Real Exchange Rate: Dollar Versus Major Currencies. 1999-2003
Change in Real Exchange Rate: Dollar Versus Major Currencies. 1999-2003

15FIN 2802, Spring 10 - TangChapter 17: Macroeconomic and Industry Analysis
Key Economic VariablesKey Economic Variables
• Gross domestic product
• Unemployment rates
• Interest rates & inflation
• Budget Deficits
• Consumer sentiment

16FIN 2802, Spring 10 - TangChapter 17: Macroeconomic and Industry Analysis
S&P 500 Versus EPS EstimateS&P 500 Versus EPS Estimate

17FIN 2802, Spring 10 - TangChapter 17: Macroeconomic and Industry Analysis
Determination of the Equilibrium Real Rate of InterestDetermination of the Equilibrium Real Rate of Interest

18FIN 2802, Spring 10 - TangChapter 17: Macroeconomic and Industry Analysis
Federal Government PolicyFederal Government Policy
• Fiscal Policy - government spending and taxing actions– Direct policy
– Slowly implemented

19FIN 2802, Spring 10 - TangChapter 17: Macroeconomic and Industry Analysis
Federal Government Policy (cont.)Federal Government Policy (cont.)
• Monetary Policy - manipulation of the money supply to influence economic activity– Initial & feedback effects
• Tools of monetary policy– Open market operations( federal funds rate)
– Discount rate
– Reserve requirements

20FIN 2802, Spring 10 - TangChapter 17: Macroeconomic and Industry Analysis
Demand ShocksDemand Shocks
• Demand shock - an event that affects demand for goods and services in the economy– Tax rate cut
– Increases in government spending
21FIN 2802, Spring 10 - TangChapter 17: Macroeconomic and Industry Analysis
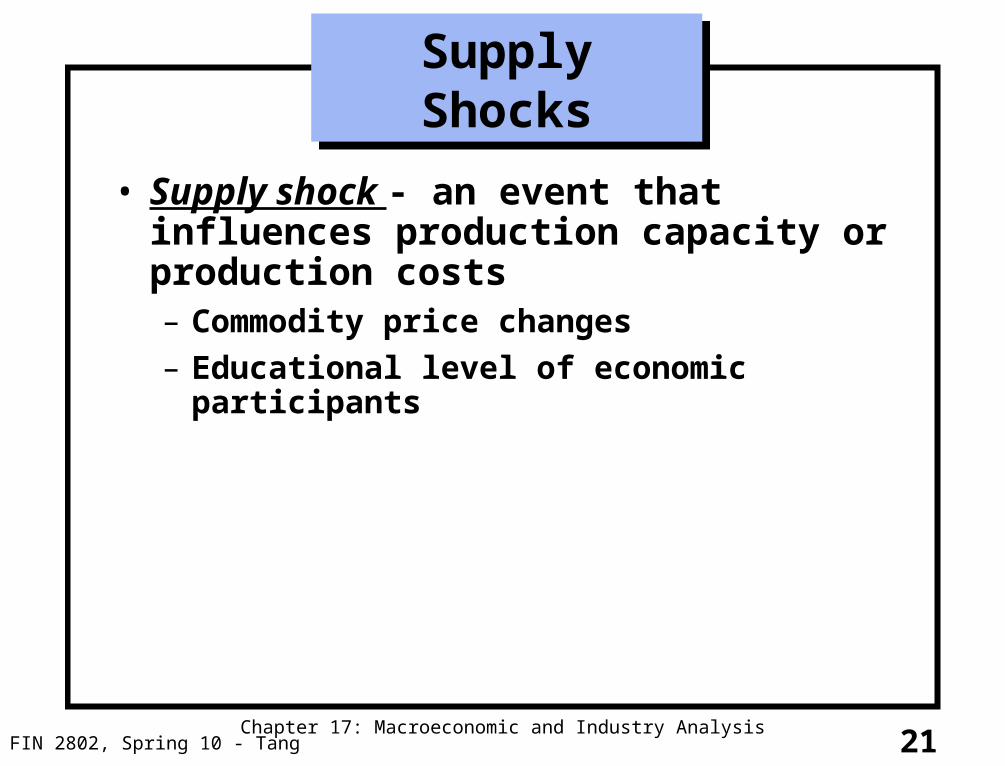
• Supply shock - an event that influences production capacity or production costs– Commodity price changes
– Educational level of economic participants
Supply ShocksSupply Shocks

22FIN 2802, Spring 10 - TangChapter 17: Macroeconomic and Industry Analysis
Business CyclesBusiness Cycles
• Business Cycle– Peak
– Trough
• Industry relationship to business cycles– Cyclical
– Defensive

23FIN 2802, Spring 10 - TangChapter 17: Macroeconomic and Industry Analysis
Leading Indicators - tend to rise and fall in advance of the economy
Examples– Avg. weekly hours of production workers
– Stock Prices
– Initial claims for unemployment
– Manufacturer’s new orders
NBER Cyclical Indicators: LeadingNBER Cyclical Indicators: Leading
24FIN 2802, Spring 10 - TangChapter 17: Macroeconomic and Industry Analysis
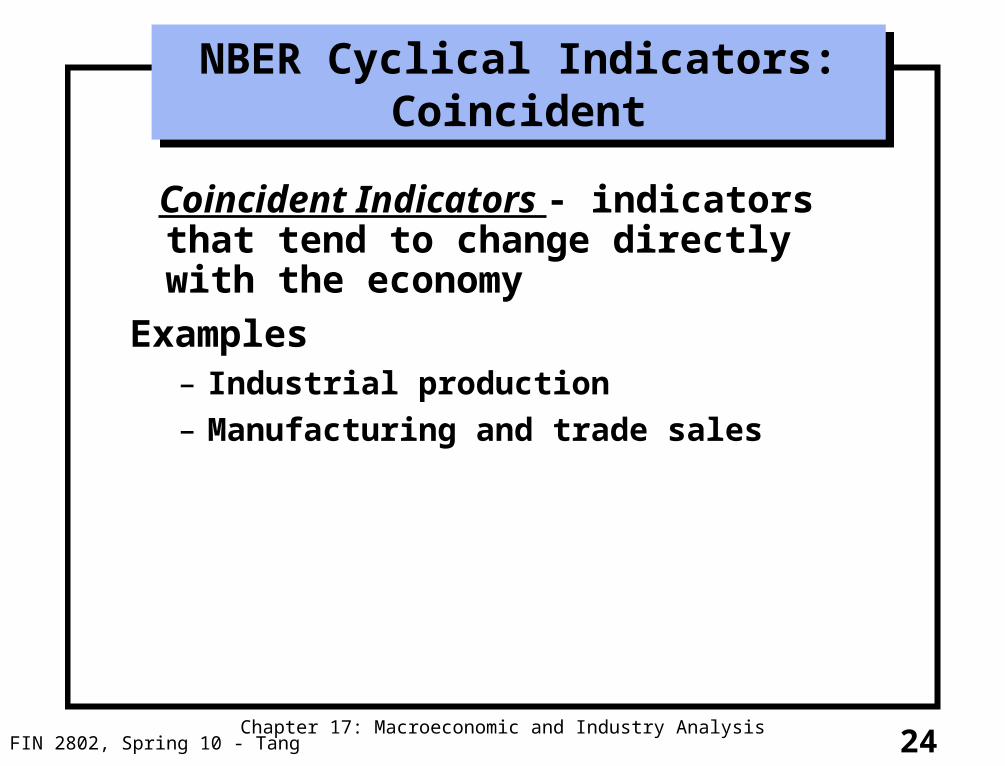
Coincident Indicators - indicators that tend to change directly with the economy
Examples– Industrial production
– Manufacturing and trade sales
NBER Cyclical Indicators: CoincidentNBER Cyclical Indicators: Coincident

25FIN 2802, Spring 10 - TangChapter 17: Macroeconomic and Industry Analysis
Lagging Indicators - indicators that tend to follow the lag economic performance
Examples– Ratio of trade inventories to sales
– Ratio of consumer installment credit outstanding to personal income
NBER Cyclical Indicators: LaggingNBER Cyclical Indicators: Lagging
26FIN 2802, Spring 10 - TangChapter 17: Macroeconomic and Industry Analysis
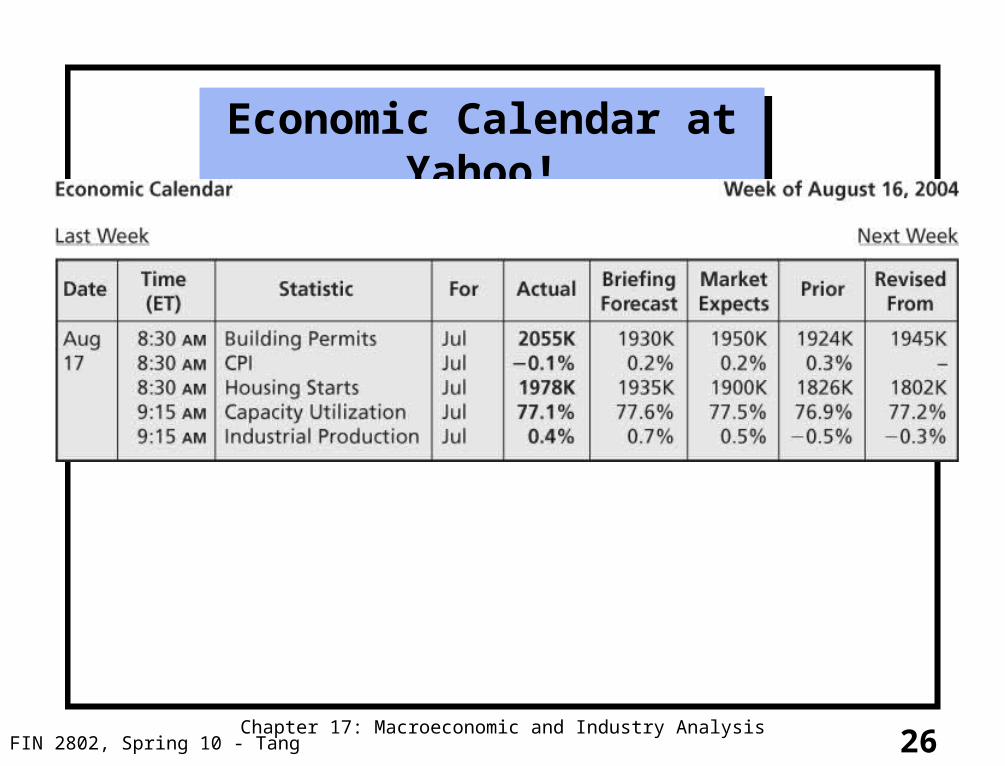
Economic Calendar at Yahoo!Economic Calendar at Yahoo!

27FIN 2802, Spring 10 - TangChapter 17: Macroeconomic and Industry Analysis
Industry AnalysisIndustry Analysis
• Sensitivity to business cycles• Sector Rotation• Industry life cycles

28FIN 2802, Spring 10 - TangChapter 17: Macroeconomic and Industry Analysis
Estimates of Earnings Growth Rates in Several Industries, 2004
Estimates of Earnings Growth Rates in Several Industries, 2004

29FIN 2802, Spring 10 - TangChapter 17: Macroeconomic and Industry Analysis
Sensitivity to Business CycleSensitivity to Business Cycle
• Factors affecting sensitivity of earnings to business cycles– Sensitivity of sales of the firm’s product to the
business cycles– Operating leverage– Financial leverage

30FIN 2802, Spring 10 - TangChapter 17: Macroeconomic and Industry Analysis
Industry CyclicalityIndustry Cyclicality

31FIN 2802, Spring 10 - TangChapter 17: Macroeconomic and Industry Analysis
A Stylized Depiction of the Business CycleA Stylized Depiction of the Business Cycle

32
Figure 17.6 Returns on Equity, 2005 Figure 17.6 Returns on Equity, 2005
FIN 2802, Spring 10 - TangChapter 17: Macroeconomic and Industry Analysis

33
Figure 17.7 Rate of Return, 2005Figure 17.7 Rate of Return, 2005
FIN 2802, Spring 10 - TangChapter 17: Macroeconomic and Industry Analysis

34FIN 2802, Spring 10 - TangChapter 17: Macroeconomic and Industry Analysis
Sector RotationSector Rotation• Selecting Industries in line with the stage of
the business cycle
• Peak – natural resource firms
• Contraction – defensive firms
• Trough – equipment, transportation and construction firms
• Expanding – cyclical industries

35FIN 2802, Spring 10 - TangChapter 17: Macroeconomic and Industry Analysis
Sector Rotation GainsSector Rotation Gains

36FIN 2802, Spring 10 - TangChapter 17: Macroeconomic and Industry Analysis
Historical Sector PerformanceHistorical Sector Performance
Total returns on a representative group of Fidelity Select funds from 1999 to 2003 (fund with highest return for the year in blue).
Yr Biotech Finance Const. Media Gas Tech Wilshire
1999 77.8% 30.6% 12.5% 44.1% 26.2% 132.4% 23.6%
2000 32.8% 28.3% 8.8% -23.1% 71.0% -31.8% -10.9%
2001 -25.0% -9.2% 20.0% -1.0% -22.9% -31.7% -11.0%
2002 -40.5% -17.2% -8.5% -12.8% -9.6% -37.8% -20.9%
2003 32.9% 36.5% 44.1% 43.9% 28.7% 59.4% 31.6%
37FIN 2802, Spring 10 - TangChapter 17: Macroeconomic and Industry Analysis
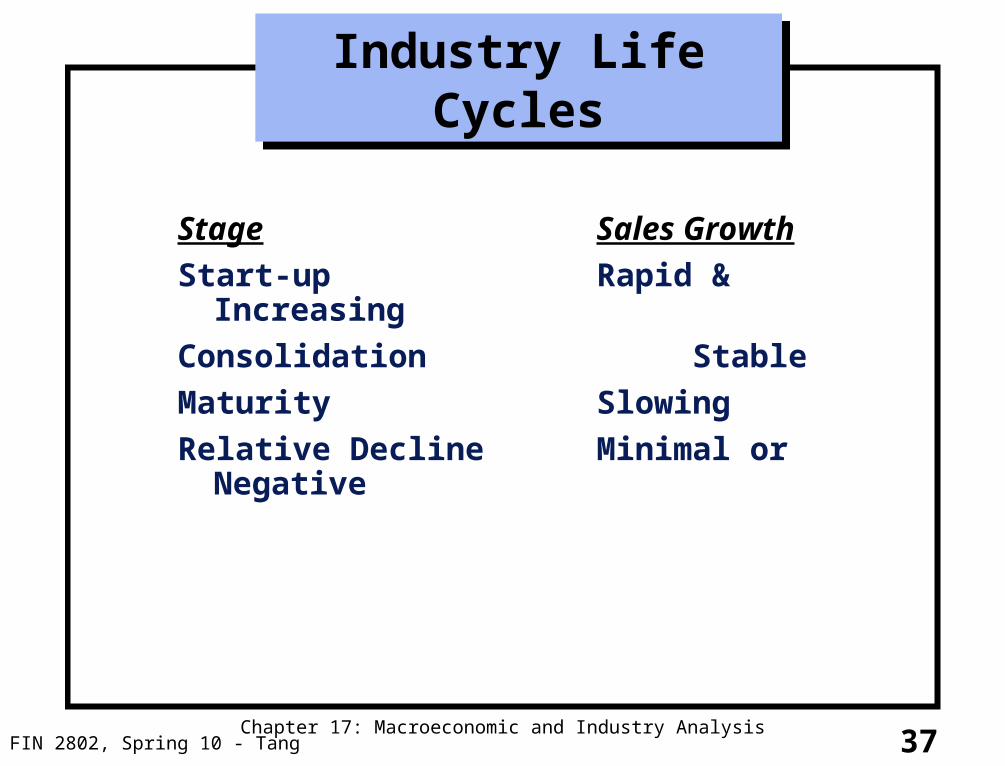
Industry Life CyclesIndustry Life Cycles
Stage Sales Growth
Start-up Rapid & Increasing
Consolidation Stable
Maturity Slowing
Relative Decline Minimal or Negative

38FIN 2802, Spring 10 - TangChapter 17: Macroeconomic and Industry Analysis
The Industry Life CycleThe Industry Life Cycle

39FIN 2802, Spring 10 - TangChapter 17: Macroeconomic and Industry Analysis
PracticePracticeChoose an industry and identify the factors that will
determine its performance in the next three years. What is your forecast for performance in that time period.

40FIN 2802, Spring 10 - TangChapter 17: Macroeconomic and Industry Analysis
Case Analysis: Tech Bubble/Bust and the FedCase Analysis: Tech Bubble/Bust and the Fed
• 1990s—especially second half—saw dramatic rise in stock prices
– Growth in real GDP averaged 4.2% annually from 1995-2000
• Technological changes of 1990s were an example of a shock to both stock market and economy
• The market—especially high-tech NASDAQ stocks—began to decline in early 2000
• Faced with these demand shocks, Federal Reserve would ordinarily have raised its interest rate target to prevent real GDP from exceeding potential output
• Fed increased rates 6 times in 1999 and 2000 from 5% to 6.5%, then reduced rates 11 times in 2001 to 1.75% (1.00% by 6/25/2003)

41FIN 2802, Spring 10 - TangChapter 17: Macroeconomic and Industry Analysis
The Fed’s Problem In 2000: An AS-AD ViewThe Fed’s Problem In 2000: An AS-AD View
Real GDP
Price Level
Y1 Y2
(a)
P1 AD2A
BP2
AD1
AS AS1
AS2
A AD2
AD1
(b)
Real GDP
P1
P2
Y1 Y2
B
CP3
Price Level
If output exceeds potential, the self-correcting mechanism will raise the price level further
Wealth effect of rising stock prices shifts AD rightward, raising real GDP and the price level

42FIN 2802, Spring 10 - TangChapter 17: Macroeconomic and Industry Analysis
The Fed’s Problem in 2000: A Phillips Curve ViewThe Fed’s Problem in 2000: A Phillips Curve View
A
C
B
D
4%5%
2.5%
5.0%
1.5%
PC1 PC2
. . . or recession
Unemployment Rate
InflationRate
A
4%
2.5%
PC1
UN?
(a) (b)Inflation
RateIf the natural rate of unemployment is 4%, the Fed can keep the economy at point A in the long run
Unemployment Rate
UN?
But if the natural rate is above 4% the Phillips curve will shift upward and the Fed must choose between higher inflation . . .

43FIN 2802, Spring 10 - TangChapter 17: Macroeconomic and Industry Analysis
The Fed and the Stock Market The Fed and the Stock Market
• Might think Fed can estimate natural rate by a process of trial and error– Bring unemployment rate to a certain level (such as 4%) and see
what happens to inflation
• However, Fed looks ahead and determines whether current economic conditions are likely to raise inflation rate in the future– By raising interest rates to rein in the economy, Fed also brought
down stock prices– By 2001, high-tech bust, recession of 2001, and attacks of
September 11 brought criticism to an end– As the economy began a slow expansion, in 2002 and early 2003,
Fed kept the interest rate low
• Unresolved question: Who should be setting the general level of share prices—millions of stockholders who buy and sell shares, or Federal Reserve?

44FIN 2802, Spring 10 - TangChapter 17: Macroeconomic and Industry Analysis
SummarySummary
• Economic environment
• Monetary and fiscal policies
• Economic indicators
• Business and industry cycles
• Next: Asset Pricing Theory


![NATO phonetic alphabet - · PDF file14.06.2015 · RAH SEE-AIR-AH ERR-ah T Tango TANG go TANG GO TANGGO or TANG-GO ˈtænɡo tang go [ˈtæŋɡoʊ] /ˈtæŋɡoʊ/ TANG-goh U Uniform](https://img.pdfslide.net/doc/110x75/5a7a9f247f8b9abd768d9267/nato-phonetic-alphabet-see-air-ah-err-ah-t-tango-tang-go-tang-go-tanggo-or-tang-go.jpg)