Embed Size (px)
Citation preview

1
Food Security and Nutrition NetworkRegional Knowledge Sharing Meeting
Washington, DCNovember 15, 2012
WASH and Health and Nutrition
Chris Seremet, PE
Technical Advisor – Water Supply and Sanitation
Catholic Relief Services
Baltimore, MD

Food For Peace Goal
• To minimize hunger in the world so that people everywhere can enjoy active and productive lives and, ultimately, to ensure that one day no one needs food aid
2

However, there are barriers to realizing healthy, productive lives…….
3

Diarrhea
• 2.2 million deaths each year– 1.6 million preventable child deaths per year
• 73 million DALYs lost per year• 80% of cases of diarrhea worldwide are attributable
to the ingestion of pathogens, especially in unsafe drinking water, in contaminated food or from unclean hands.
• Cholera, typhoid and dysentery
4

Neglected Tropical Diseases
• Soil-transmitted Helminths (Ascariasis, Trichuriasis and Hookworm)
– 2 billion infections—affecting one third of the world’s population—that could be prevented
– 4 million DALYs lost per year– Affects 400 million school-aged children per year– Transmission of intestinal parasitic worm infections
occurs through soil contaminated with feces. – Entirely preventable by adequate sanitation, and
intervention outcomes are reinforced by good hygiene.
5

Neglected Tropical Diseases
• Schistosomiasis– 200 million people with preventable infections– 1.7 million DALYs lost per year – Caused by contact with water bodies
contaminated with the excreta of infected people
6

Malnutrition
• 860,000 preventable child deaths per year• 17 million DALYs lost per year• Childhood underweight causes about 35% of all
deaths of children <5 years worldwide. • An estimated 50% of this underweight or
malnutrition is associated with repeated diarrhea or intestinal parasite infections – a result of unsafe water, inadequate sanitation or
insufficient hygiene.
7

Tropical Enteropathy
• Changing the structure and function of the small intestine leads to undernutrition
• Reduced surface area of small intestine - decreased villous height - ‘flat architecture’
– Lowers nutrient absorption• ‘Leaky gut’ (increased permeability of the intestinal
tract) and impaired ability to prevent pathogens from breaching the intestinal barrier
– Elevated immune response– Nutrients diverted from growth to defense
8

Tropical Enteropathy
• Thought to be caused by chronic ingestion of pathogenic microorganisms.
• Linked to living conditions with poor sanitation and hygiene practices.
• Likely to be prevalent in developing countries.
9
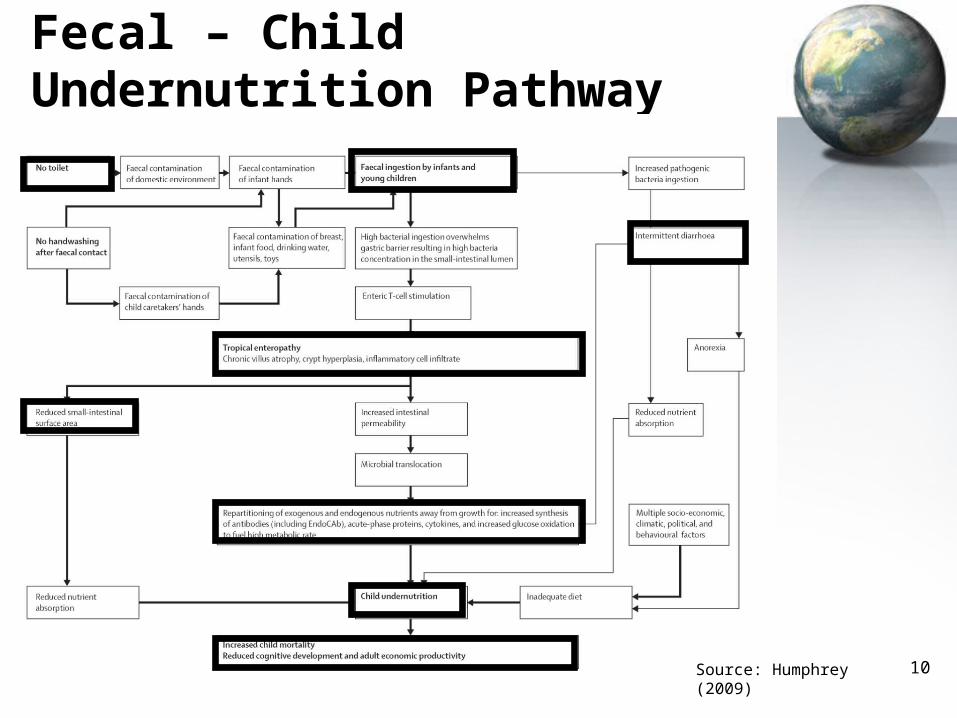
Fecal – Child Undernutrition Pathway
10Source: Humphrey (2009)
Evidence is Lacking
• Many studies, many methodological issues• Limited evidence
– Suggests that nutrition interventions can substantially reduce or even eliminate the negative effect of diarrheal disease on child growth.
– Can’t conclude that high rates of infection make nutrition interventions ineffective for improving child growth.
• Likely a combination of improved nutrition and infection prevention and control efforts
11

Evidence is Lacking
• Most studies agree with WASH interventions
• Randomized controlled trials of toilet provision and handwashing promotion that include tropical enteropathy and child growth as outcomes
12

The F-Diagram
13
Source: UNICEF

Nutrition and infection prevention and control interventions
• Hygiene Behavior Change– Handwashing with soap at key times– PHAST / CLTS
• Sanitation– Latrines – household and at the fields– Improve drainage around muddy areas
• Water– Drinking Water Supply from a protected source
• Drinking water system at same time as irrigation system• The potential health gains are reduced sharply with even
occasional consumption of untreated drinking water
– POU Treatment and Storage14

FFP Standard WASH Indicators
• Percentage of households using an improved drinking water source
• Percentage of households with access to an improved sanitation facility
• Percentage of households with children aged 0–23 months that have water and soap or locally available cleansing agent at a hand washing place
15

Improved Drinking Water Source
• An improved water source is an infrastructure improvement to a water source, a distribution system, or a delivery point. By nature of its design and construction, the improvement is likely to protect the water source from external contamination, in particular fecal matter.
• Improved drinking water sources are: – Piped water into dwelling, plot, or yard – Public tap/standpipe – Tube well/borehole – Protected dug well – Protected spring – Rainwater collection
16

Improved Sanitation Facility
• A sanitary facility in the household and whether that sanitary facility meets the improved sanitation standards defined in the Millennium Development Goals (MDGs).
• Improved sanitation is defined as: – Flush or pour/flush facilities connected to a:
• Piped sewer system • Septic system • Pit latrine
– Pit latrines with a slab – Composting toilets – Ventilated improved pit latrines
17

Improved hygiene practices
• At households with children aged 0–23 months:– Presence of a hand washing station– Presence of water in hand washing station– Presence of soap or other cleansing agent at hand
washing station
18

Thank You
• Chris Seremet
• Technical Advisor – Water Supply and Sanitation
• Catholic Relief Services
• E-mail: [email protected]
• Website for CRS publications: www.crsprogramquality.org
19

Fecal – Child Undernutrition Pathway
20