Embed Size (px)
Citation preview
1
Foreign Exchange
MBA 774Macroeconomics
Class Notes - Part 3
2
Foreign Exchange Rates
• The exchange rate is the price of one country’s currency in terms of another country’s currency
• Quoted exchange rates can be either direct or indirect, one method is usually the convention – Direct: home currency per unit of foreign currency
• Examples from US perspective: 1.676 US Dollars (USD) per British Pound (GBP)1.152 US Dollars (USD) per Euro (EUR)
– Indirect: foreign currency per unit of home currency• Examples from US perspective:
109.58 Japanese Yen (JPY) per US Dollar (USD)1.3664 Swiss Francs (CHF) per US Dollar (USD)
3
Prices in Foreign Currency
• Use the exchange rate in direct terms
Example 1: How much does a €100 sweater cost an American if the exchange rate is 1.15 $/€?
Price in $ = €100 * 1.15 $/€ = $115.00
Example 2: How much does a 100 CHF sweater cost an American if the exchange rate is 1.37 CHF/$?
Price in $ = 100 CHF * (1 / 1.37 CHF/$) = $72.99
4
Depreciation and Appreciation
• A depreciation of the local currency means that it takes more local currency to buy a unit of foreign currency– An appreciation of the local currency is the opposite
• Example: – If the $/€ exchange rate goes up from 1.10 to 1.20
the dollar has depreciated against the euro
– but, the euro has appreciated against the dollar.
5
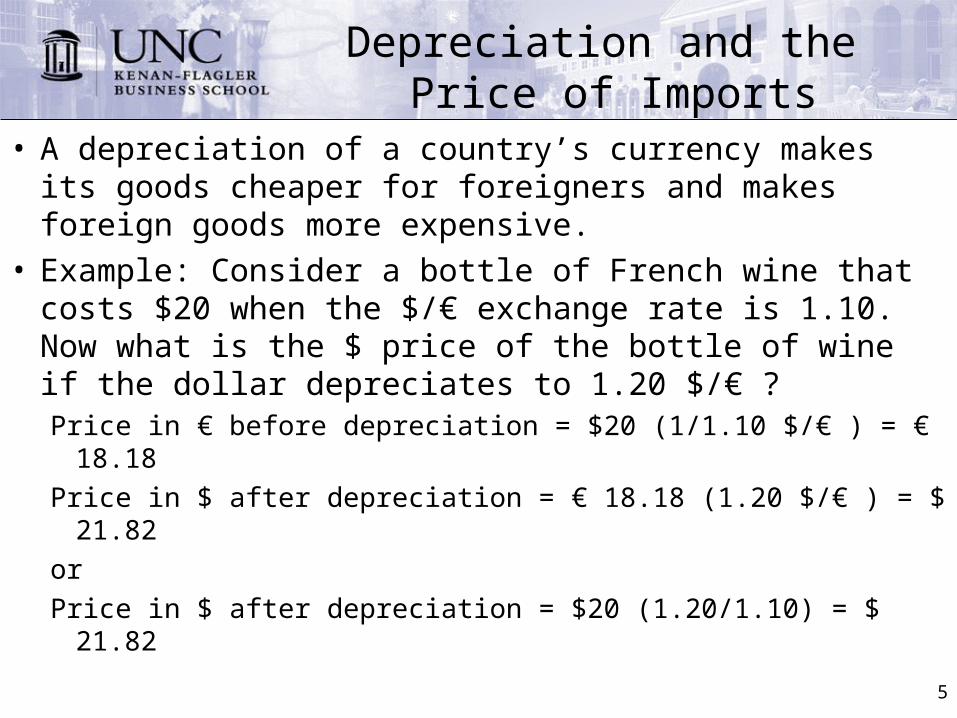
Depreciation and the Price of Imports
• A depreciation of a country’s currency makes its goods cheaper for foreigners and makes foreign goods more expensive.
• Example: Consider a bottle of French wine that costs $20 when the $/€ exchange rate is 1.10. Now what is the $ price of the bottle of wine if the dollar depreciates to 1.20 $/€ ?Price in € before depreciation = $20 (1/1.10 $/€ ) = € 18.18Price in $ after depreciation = € 18.18 (1.20 $/€ ) = $ 21.82orPrice in $ after depreciation = $20 (1.20/1.10) = $ 21.82
6
Foreign Exchange Trading
• The vast majority of foreign exchange (FX) trading is done over-the-counter (OTC)
• Most transactions have the USD on one side– Dollar is called a vehicle currency
• Trading is centered at major multinational banks (called dealers) such as Citibank, Bank of America, Deutsche Bank, HSBC, etc.
• By volume, it is the largest market in the world– Average daily turnover is about 2 trillion USD
7
Foreign Exchange Trading
• Trading takes place 24 hours a day during the business week
• Trading moves around the globe:London => New York => Tokyo => London
• Other important participants are– Corporations – Nonbank financial institutions – Central banks
• For current rates see the Wall Street Journal or Bloomberg
8
Spot vs. Forward rates
• Spot Rate: the exchange rate that is applicable today – The settlement or value date for a spot transaction
(the date on which the parties actually exchange assets) occurs two business days after the deal is made
• Forward Rate: the exchange rate agreed on today for a transaction at a future date. – Most commonly quoted 30, 90, or 180 days in the
future. – The forward exchange rate is set so that no money
changes hands today.
9
Forward Example
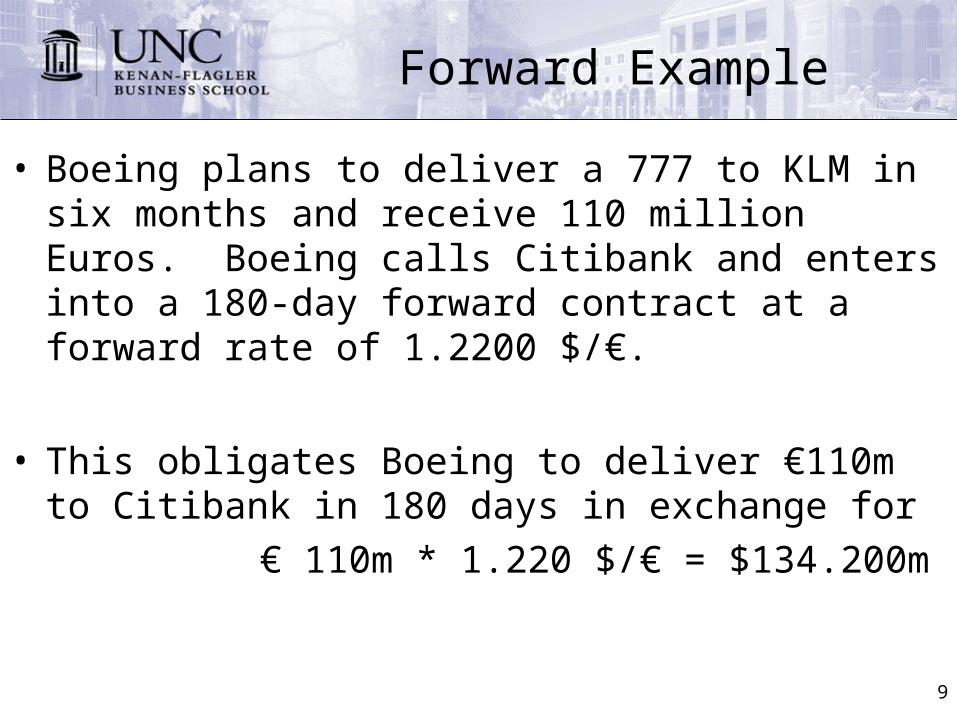
• Boeing plans to deliver a 777 to KLM in six months and receive 110 million Euros. Boeing calls Citibank and enters into a 180-day forward contract at a forward rate of 1.2200 $/€.
• This obligates Boeing to deliver €110m to Citibank in 180 days in exchange for
€ 110m * 1.220 $/€ = $134.200m
10
Why Use Forwards
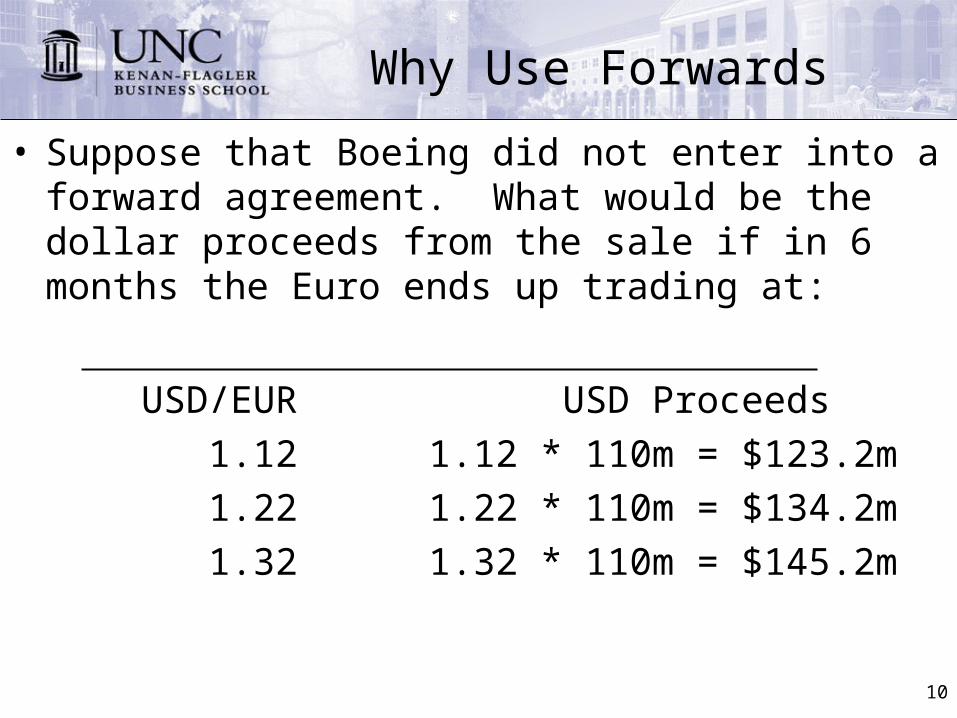
• Suppose that Boeing did not enter into a forward agreement. What would be the dollar proceeds from the sale if in 6 months the Euro ends up trading at:
USD/EUR USD Proceeds 1.12 1.12 * 110m = $123.2m 1.22 1.22 * 110m = $134.2m 1.32 1.32 * 110m = $145.2m
11
Derivative Securities
• A forward contract is the simplest form of a derivative security
• Definition: A derivative security is a financial contract that derives its value from the price of another underlying asset.
• Other common examples:– Swaps– Put and call options– Futures contracts (exchange-traded forwards)
12
FX Trading Statistics
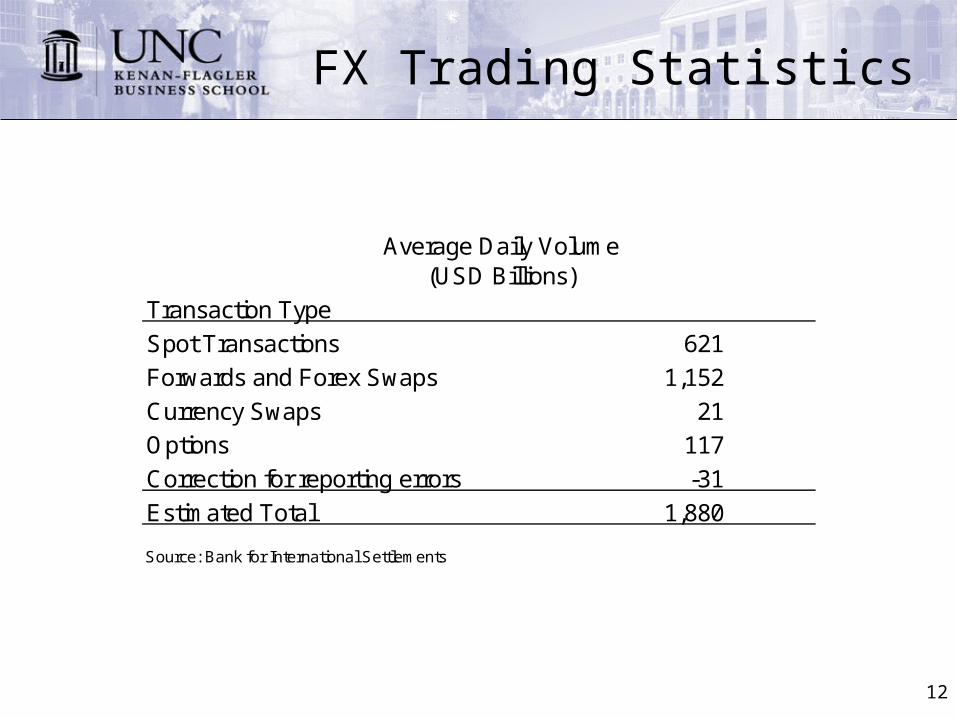
Average Daily Volume(USD Billions)
Transaction Type
Spot Transactions 621
Forwards and Forex Swaps 1,152
Currency Swaps 21
Options 117
Correction for reporting errors -31
Estimated Total 1,880
Source: Bank for International Settlements
13
FX Derivative Market Stats
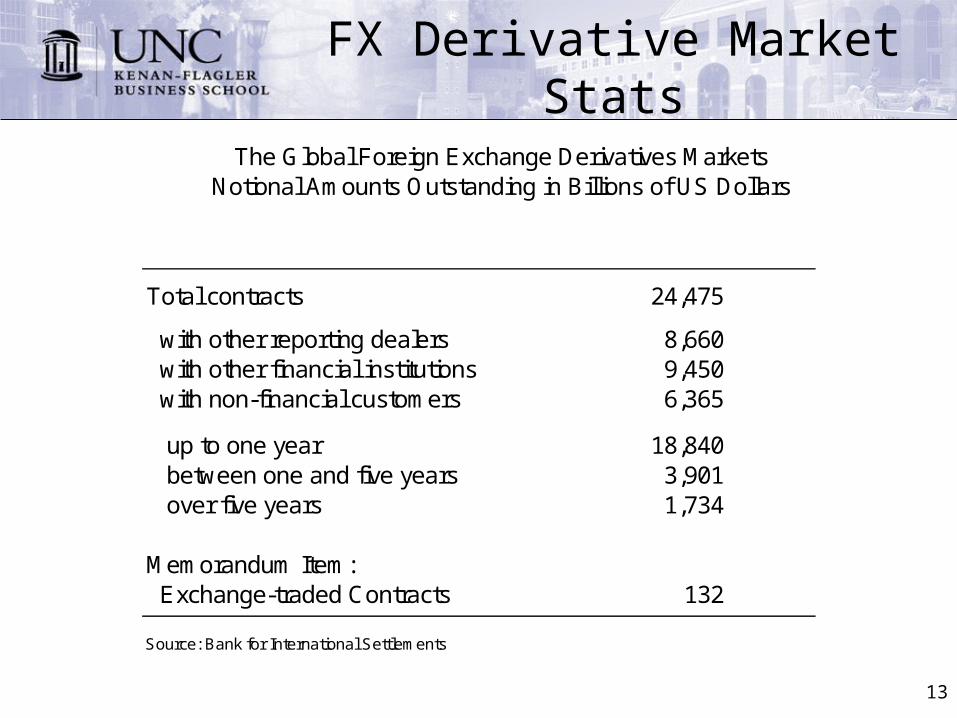
The Global Foreign Exchange Derivatives MarketsNotional Amounts Outstanding in Billions of US Dollars
Total contracts 24,475
with other reporting dealers 8,660 with other financial institutions 9,450 with non-financial customers 6,365
up to one year 18,840 between one and five years 3,901 over five years 1,734
Memorandum Item: Exchange-traded Contracts 132
Source: Bank for International Settlements
14
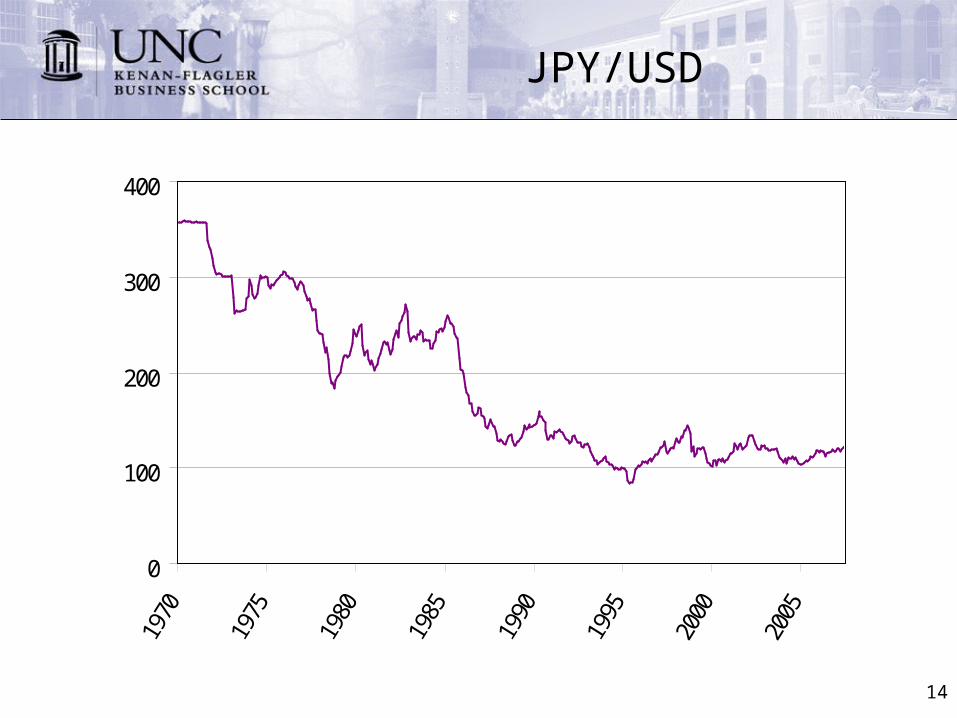
JPY/USD
0
100
200
300
400
1970
1975
1980
1985
1990
1995
2000
2005
15
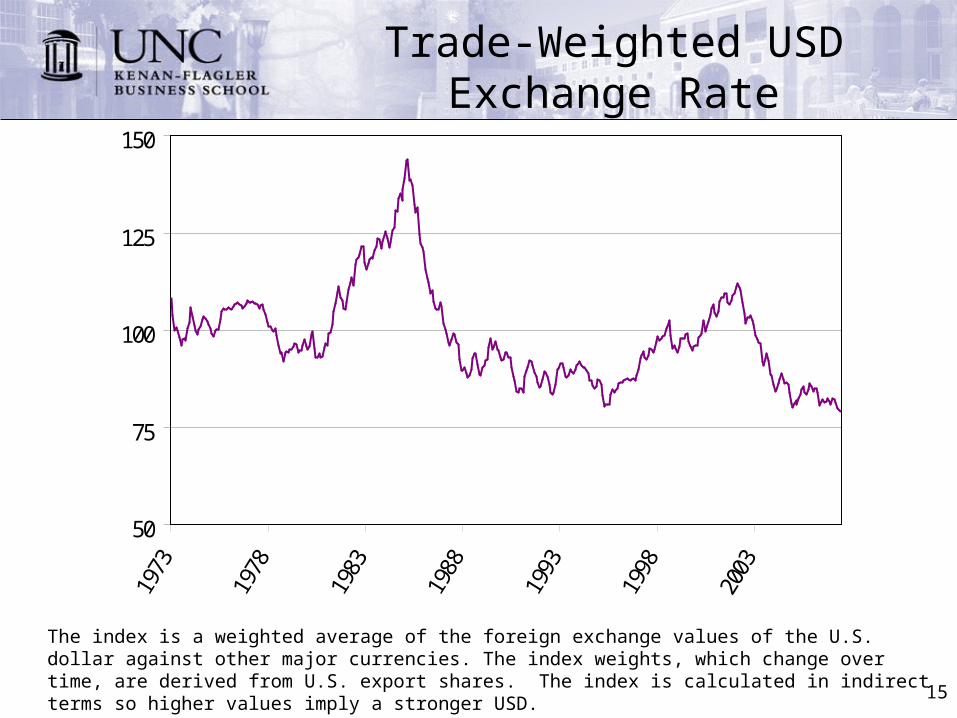
Trade-Weighted USD Exchange Rate
The index is a weighted average of the foreign exchange values of the U.S. dollar against other major currencies. The index weights, which change over time, are derived from U.S. export shares. The index is calculated in indirect terms so higher values imply a stronger USD.
50
75
100
125
1501973
1978
1983
1988
1993
1998
2003
16
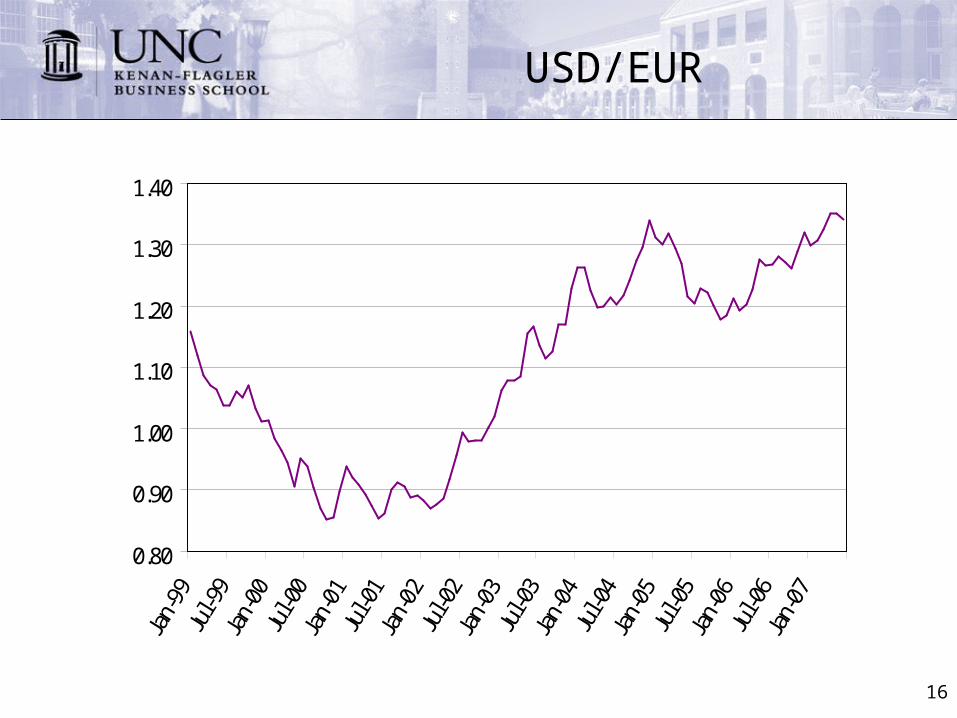
USD/EUR
0.80
0.90
1.00
1.10
1.20
1.30
1.40
Jan-99
Jul-99
Jan-00
Jul-00
Jan-01
Jul-01
Jan-02
Jul-02
Jan-03
Jul-03
Jan-04
Jul-04
Jan-05
Jul-05
Jan-06
Jul-06
Jan-07
17
The Law of One Price
• In competitive markets free of transportation costs and other barriers to trade, identical goods sold in different countries must sell for the same price (when expressed in the same currency).
• Why?
18
The Law of One Price
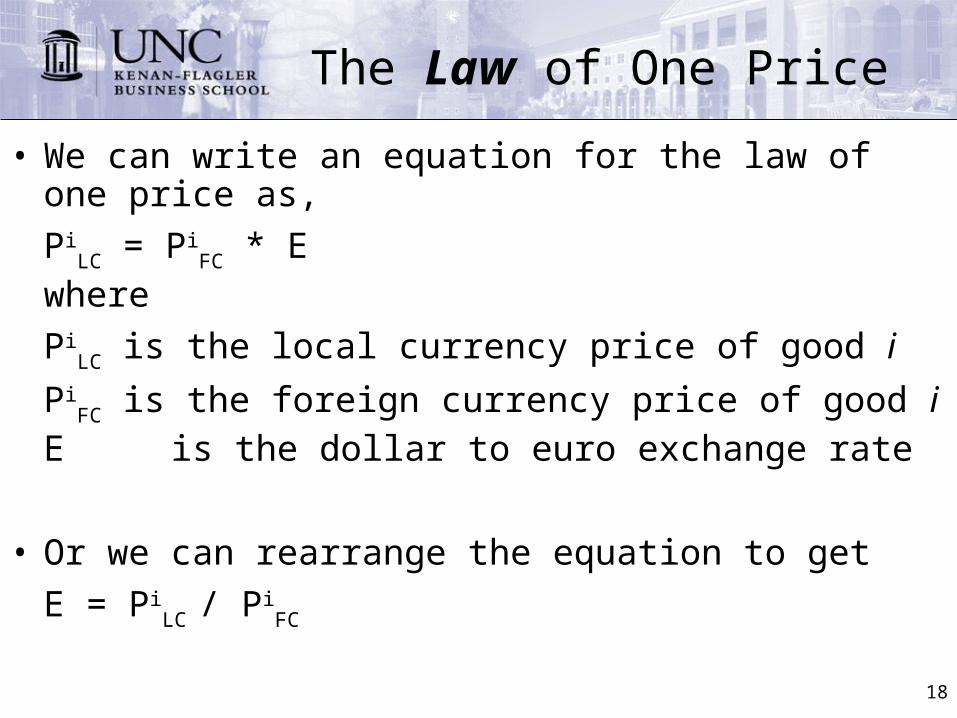
• We can write an equation for the law of one price as,
PiLC = Pi
FC * Ewhere
PiLC is the local currency price of good i
PiFC is the foreign currency price of good i
E is the dollar to euro exchange rate
• Or we can rearrange the equation to get
E = PiLC / P
iFC
19
Purchasing Power Parity (PPP)
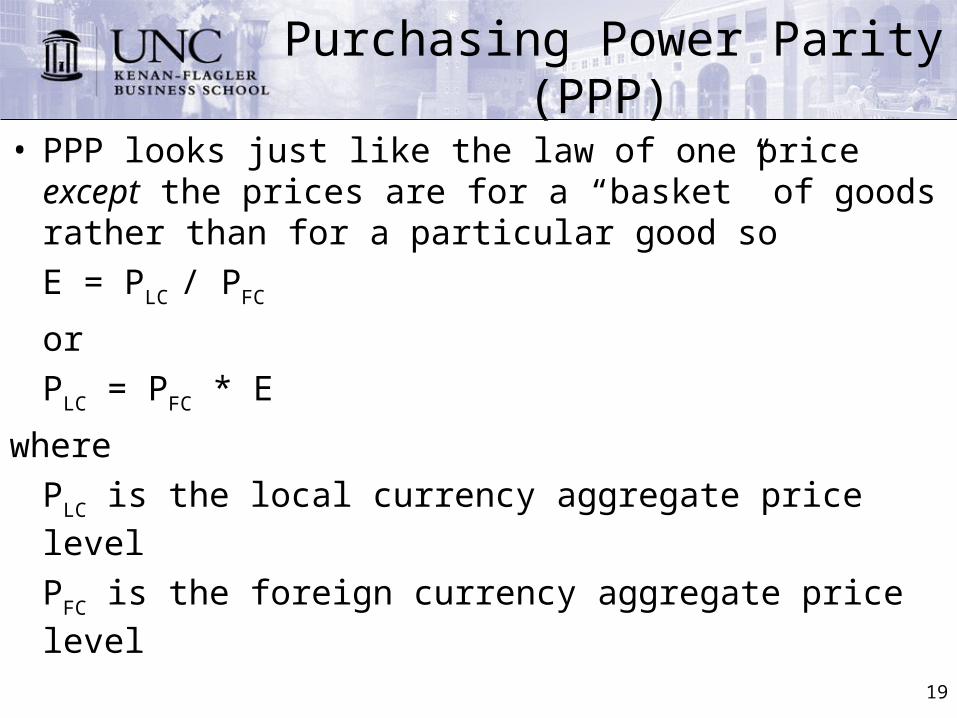
• PPP looks just like the law of one price except the prices are for a “basket” of goods rather than for a particular good so
E = PLC / PFC
or PLC = PFC * E
wherePLC is the local currency aggregate price
levelPFC is the foreign currency aggregate price
level
20
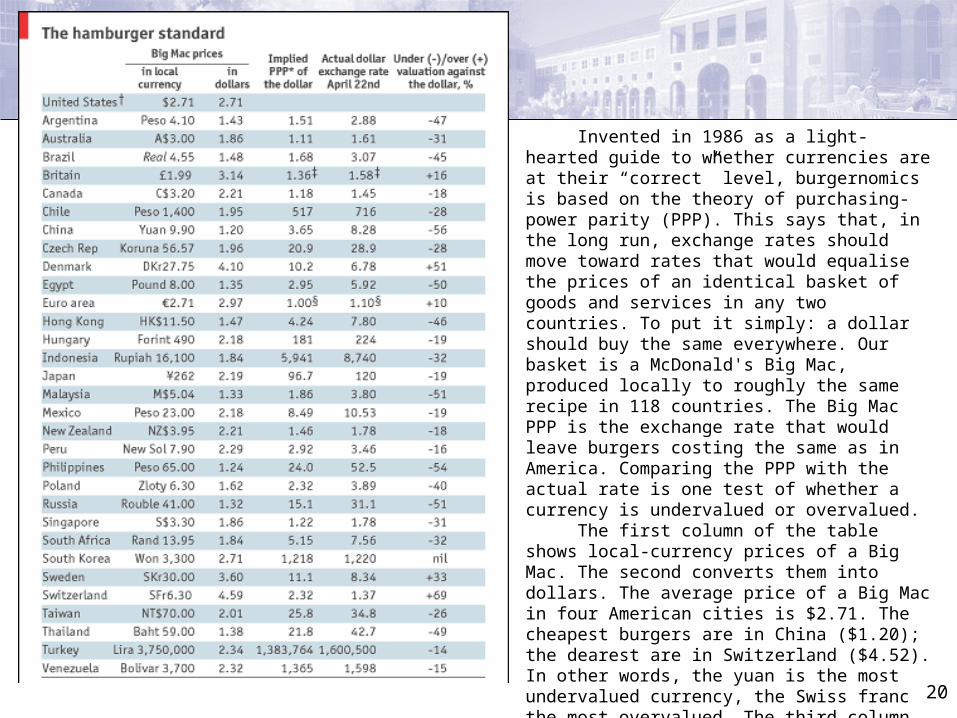
Invented in 1986 as a light-hearted guide to whether currencies are at their “correct” level, burgernomics is based on the theory of purchasing-power parity (PPP). This says that, in the long run, exchange rates should move toward rates that would equalise the prices of an identical basket of goods and services in any two countries. To put it simply: a dollar should buy the same everywhere. Our basket is a McDonald's Big Mac, produced locally to roughly the same recipe in 118 countries. The Big Mac PPP is the exchange rate that would leave burgers costing the same as in America. Comparing the PPP with the actual rate is one test of whether a currency is undervalued or overvalued. The first column of the table shows local-currency prices of a Big Mac. The second converts them into dollars. The average price of a Big Mac in four American cities is $2.71. The cheapest burgers are in China ($1.20); the dearest are in Switzerland ($4.52). In other words, the yuan is the most undervalued currency, the Swiss franc the most overvalued. The third column calculates Big Mac PPPs. Dividing the local Chinese price by the American price gives a dollar PPP of 3.65 yuan. The actual exchange rate is 8.28 yuan, implying that the Chinese currency is undervalued by 56% against the dollar.
21
Purchasing Power Parity (PPP)
• PPP asserts that all countries’ price levels are equal when measured in terms of the same currency – Note: In practice the basket of goods is the same as
the one used for the CPI
• PPP predicts that a decline (increase) in a currency’s domestic purchasing power will be associated with a proportional currency depreciation (appreciation) in the foreign exchange market
22
Absolute PPP vs. Relative PPP
• Absolute PPP (PLC = PFC * E) represents the relationship between the level of the exchange rate and the level of prices in the two economies
• Relative PPP states that the percentage change in the exchange rate will be equal to the difference in the percentage change in the price levels in the two countries
23
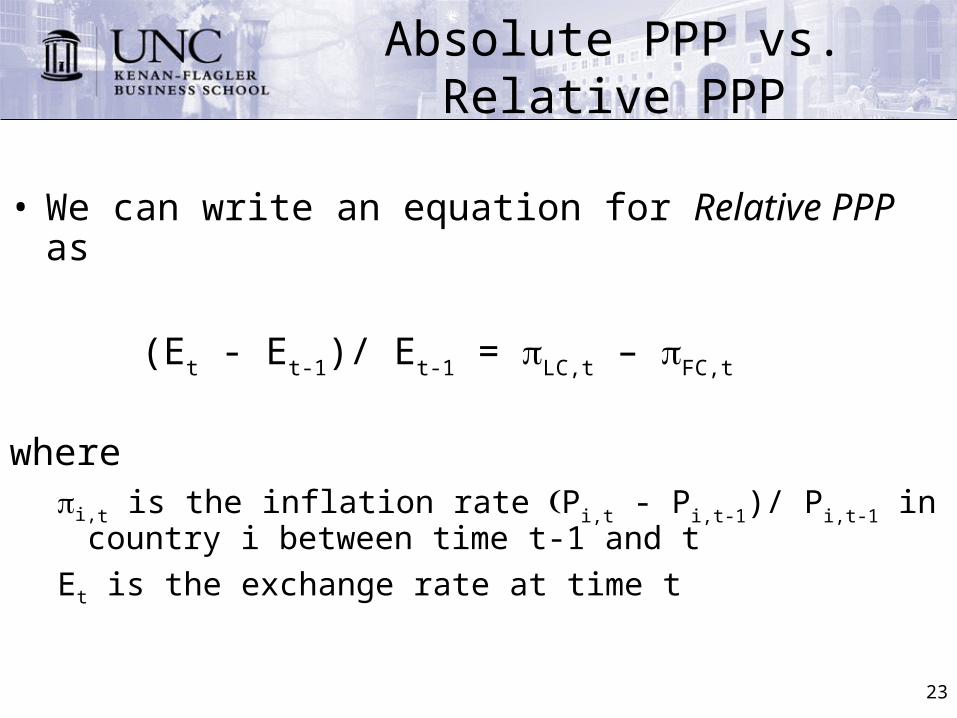
Absolute PPP vs. Relative PPP
• We can write an equation for Relative PPP as
(Et - Et-1)/ Et-1 = LC,t – FC,t
where i,t is the inflation rate Pi,t - Pi,t-1)/ Pi,t-1 in country i
between time t-1 and tEt is the exchange rate at time t
24
Empirical Evidence on PPP
• To test absolute PPP, we measure the price level of a basket of goods in various countries.– For example, The Economist’s Big Mac Index
• To test relative PPP we can look at the correlation between exchange rates and relative price levels– Typically correlations are low
• Empirically, PPP theory does poorly in predicting exchange rate movements for developed countries
• Why is it hard to test these theories?
25
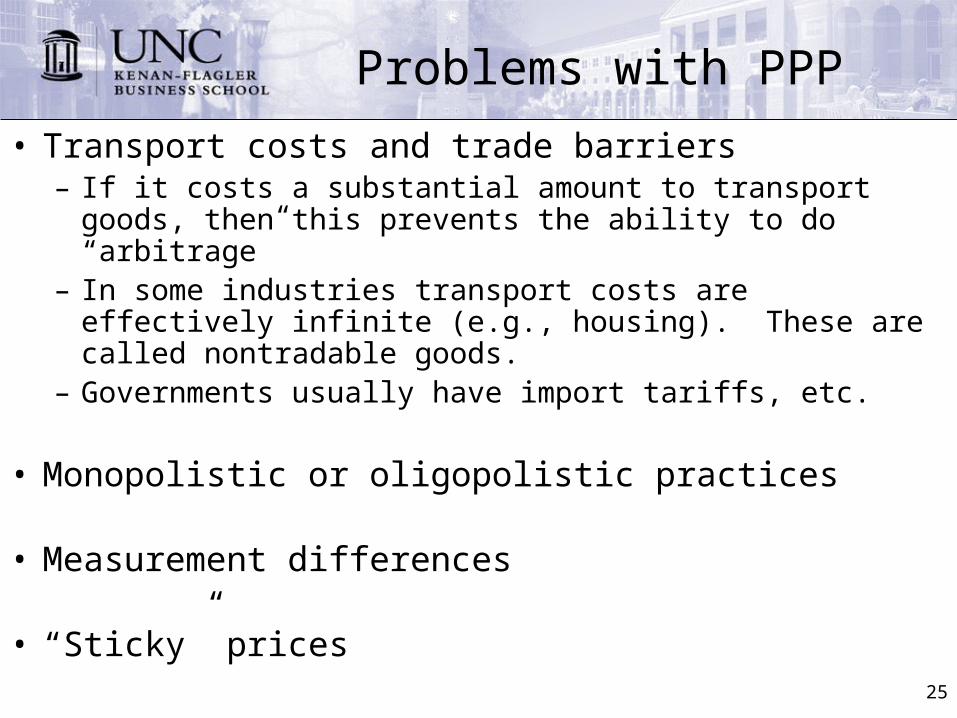
Problems with PPP
• Transport costs and trade barriers– If it costs a substantial amount to transport goods,
then this prevents the ability to do “arbitrage”– In some industries transport costs are effectively
infinite (e.g., housing). These are called nontradable goods.
– Governments usually have import tariffs, etc.
• Monopolistic or oligopolistic practices
• Measurement differences
• “Sticky” prices
26
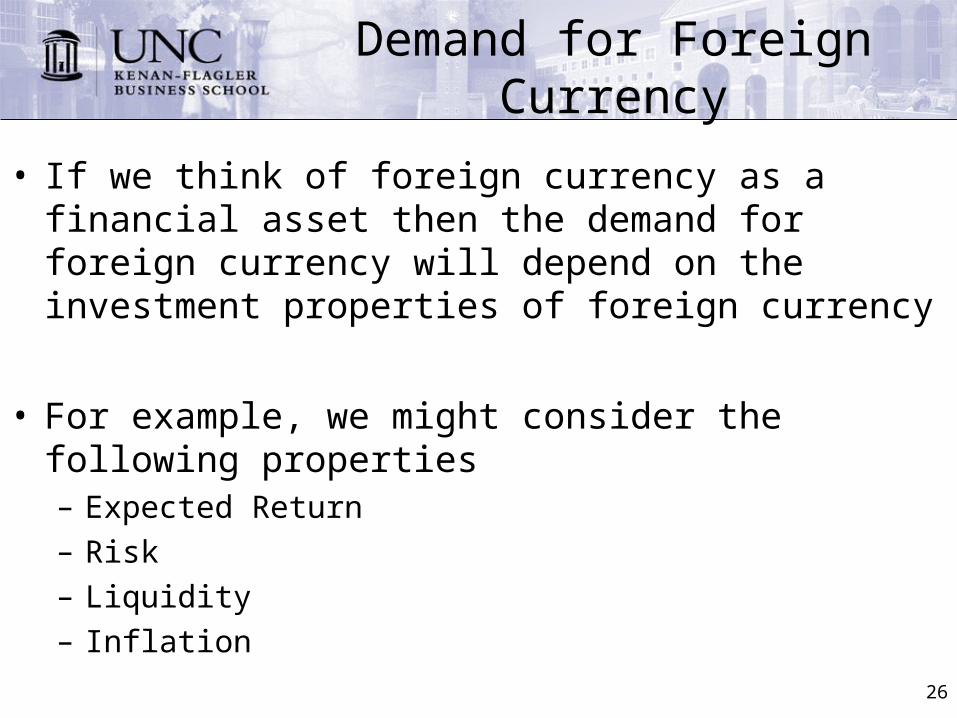
Demand for Foreign Currency
• If we think of foreign currency as a financial asset then the demand for foreign currency will depend on the investment properties of foreign currency
• For example, we might consider the following properties– Expected Return– Risk– Liquidity– Inflation
27
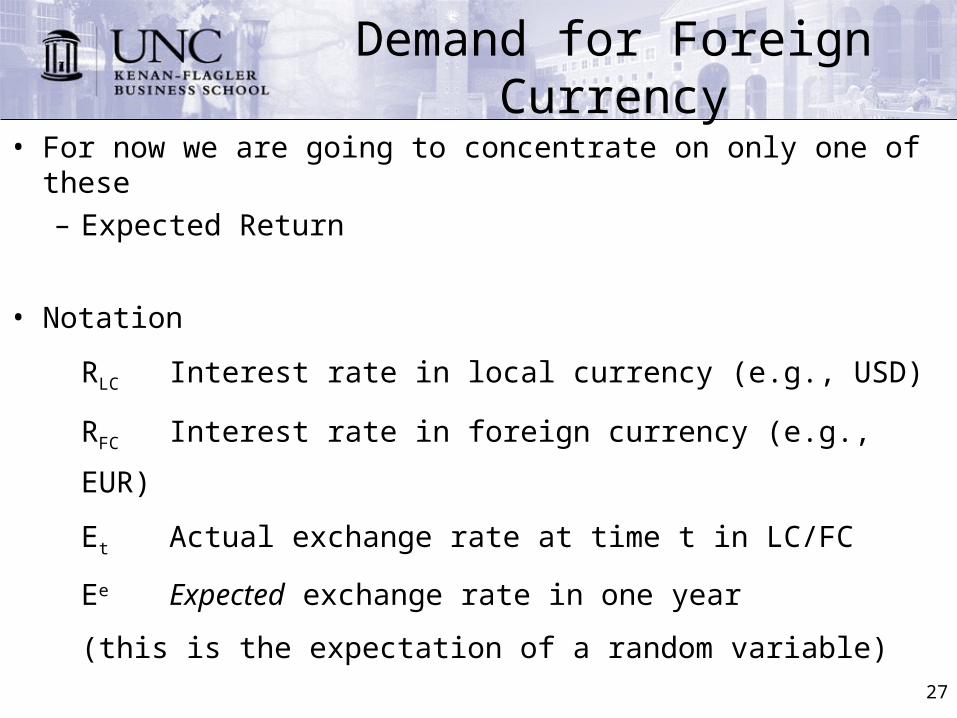
Demand for Foreign Currency
• For now we are going to concentrate on only one of these– Expected Return
• Notation
RLC Interest rate in local currency (e.g., USD)
RFC Interest rate in foreign currency (e.g., EUR)
Et Actual exchange rate at time t in LC/FC
Ee Expected exchange rate in one year
(this is the expectation of a random
variable)
28
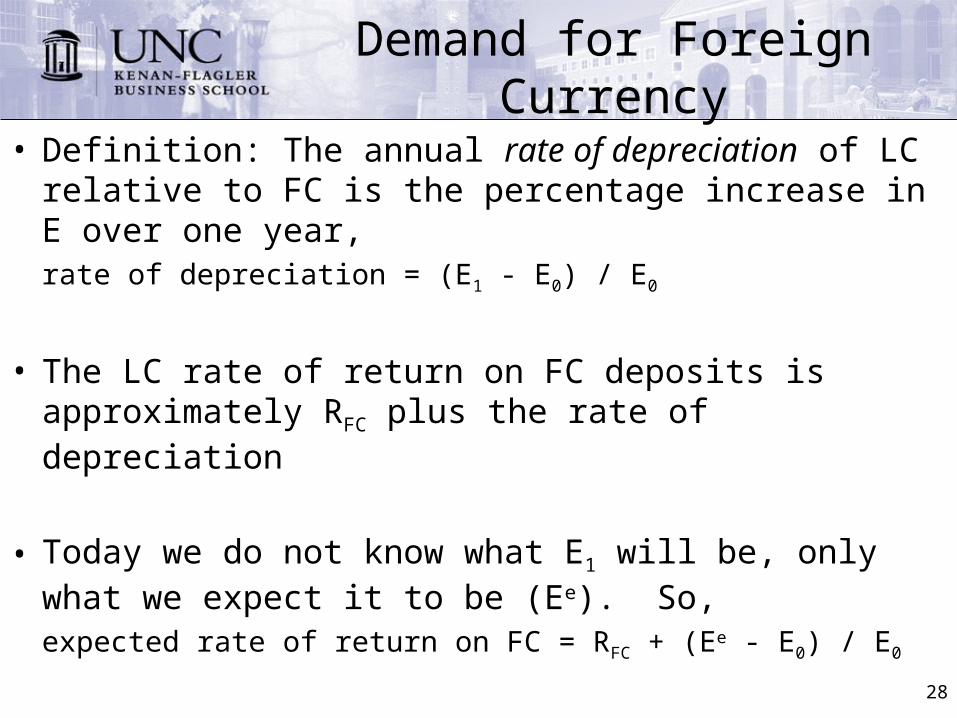
Demand for Foreign Currency
• Definition: The annual rate of depreciation of LC relative to FC is the percentage increase in E over one year,
rate of depreciation = (E1 - E0) / E0
• The LC rate of return on FC deposits is approximately RFC plus the rate of depreciation
• Today we do not know what E1 will be, only what we expect it to be (Ee). So,
expected rate of return on FC = RFC + (Ee - E0) / E0
29
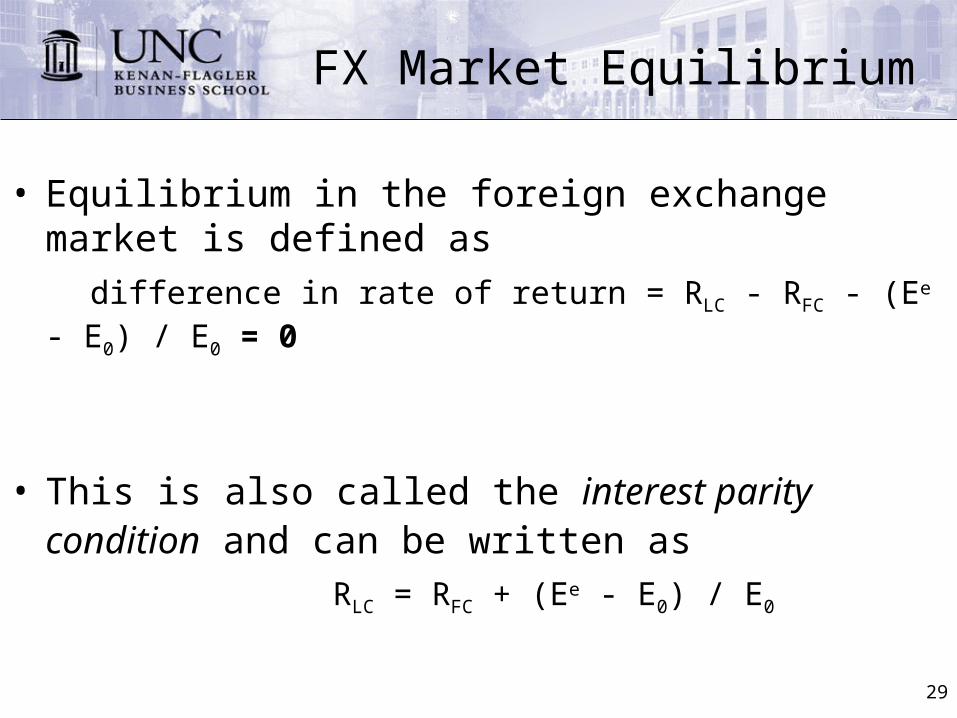
FX Market Equilibrium
• Equilibrium in the foreign exchange market is defined as difference in rate of return = RLC - RFC - (Ee - E0) / E0 = 0
• This is also called the interest parity condition and can be written as
RLC = RFC + (Ee - E0) / E0
30
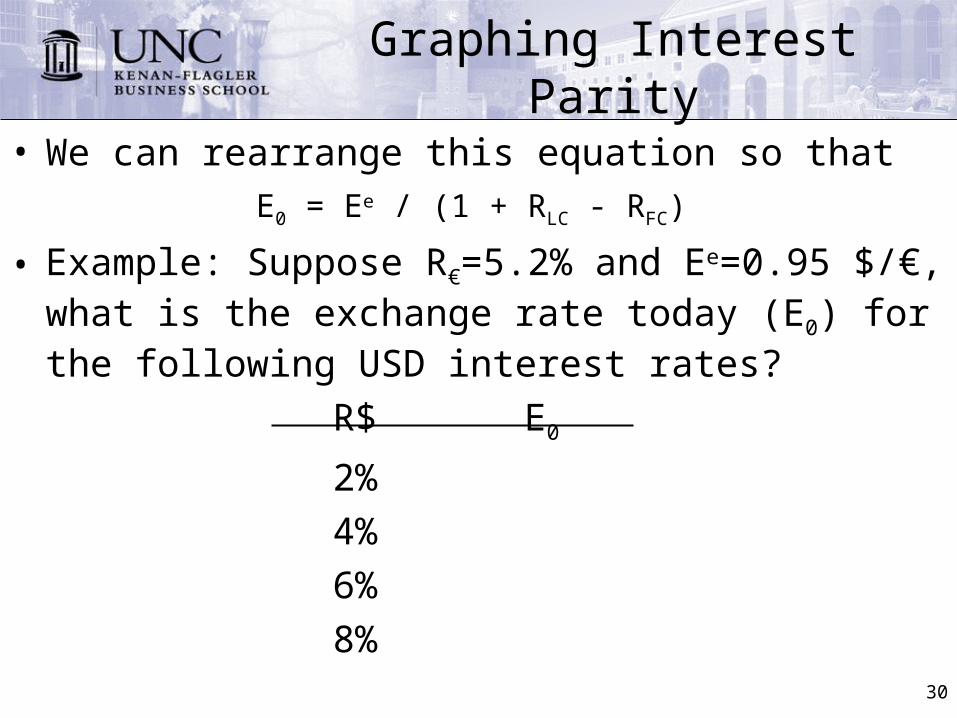
Graphing Interest Parity
• We can rearrange this equation so that E0 = Ee / (1 + RLC - RFC)
• Example: Suppose R€=5.2% and Ee=0.95 $/€, what is the exchange rate today (E0) for the following USD interest rates?
R$ E0
2%4%6%8%
31
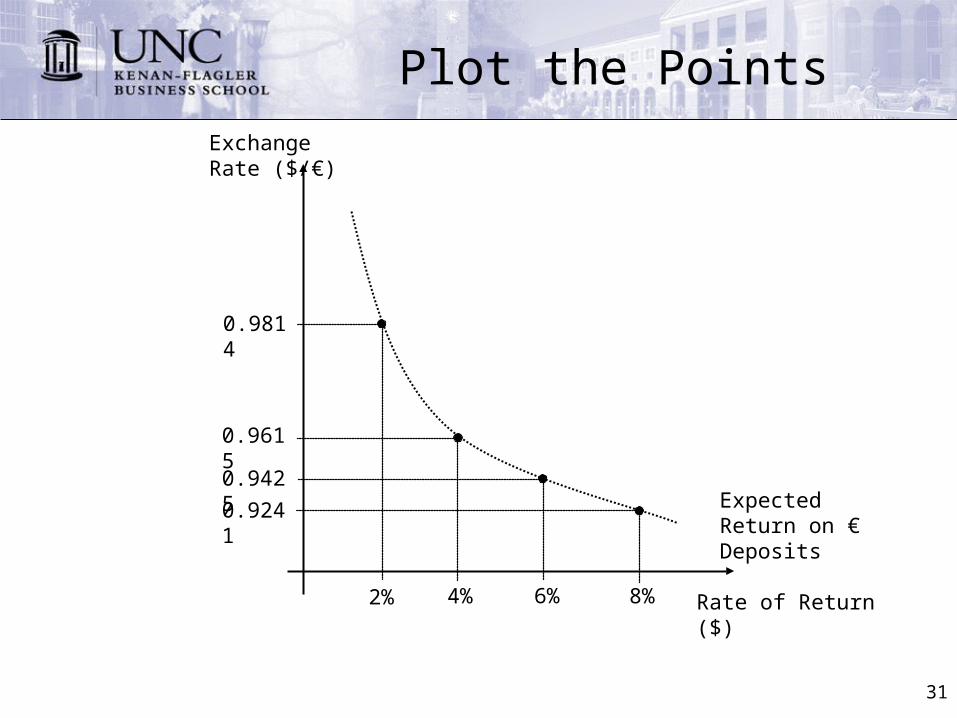
Plot the Points
Rate of Return ($)
Exchange Rate ($/€)
Expected Return on € Deposits
8%6%4%2%
0.9814
0.9615
0.9425
0.9241
32
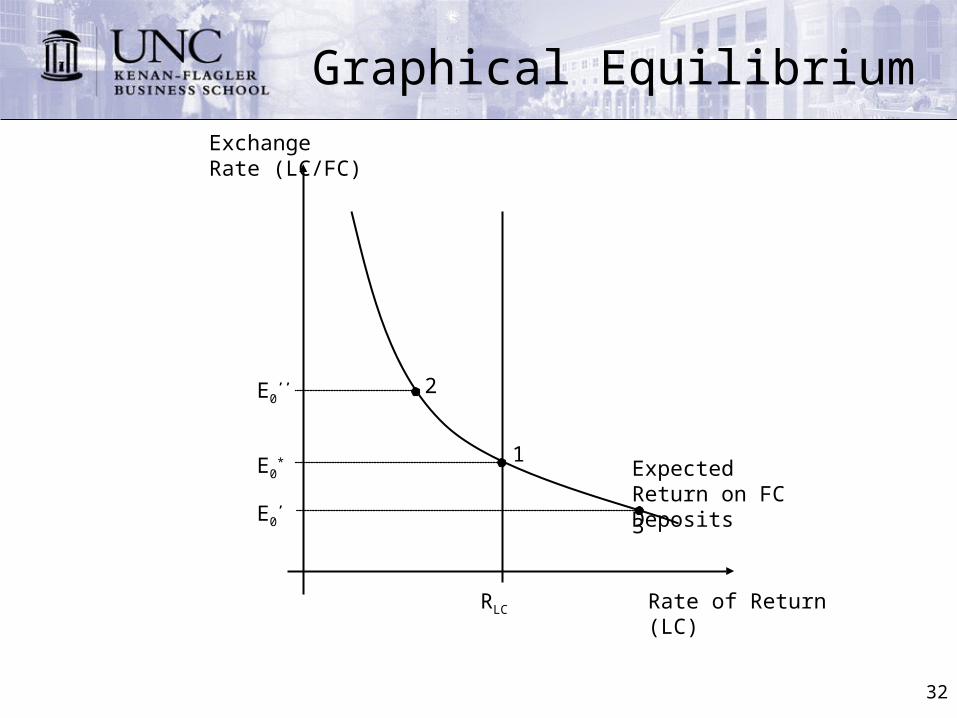
Graphical Equilibrium
Rate of Return (LC)
Exchange Rate (LC/FC)
RLC
E0*
E0’
E0’’
Expected Return on FC Deposits
1
2
3
33
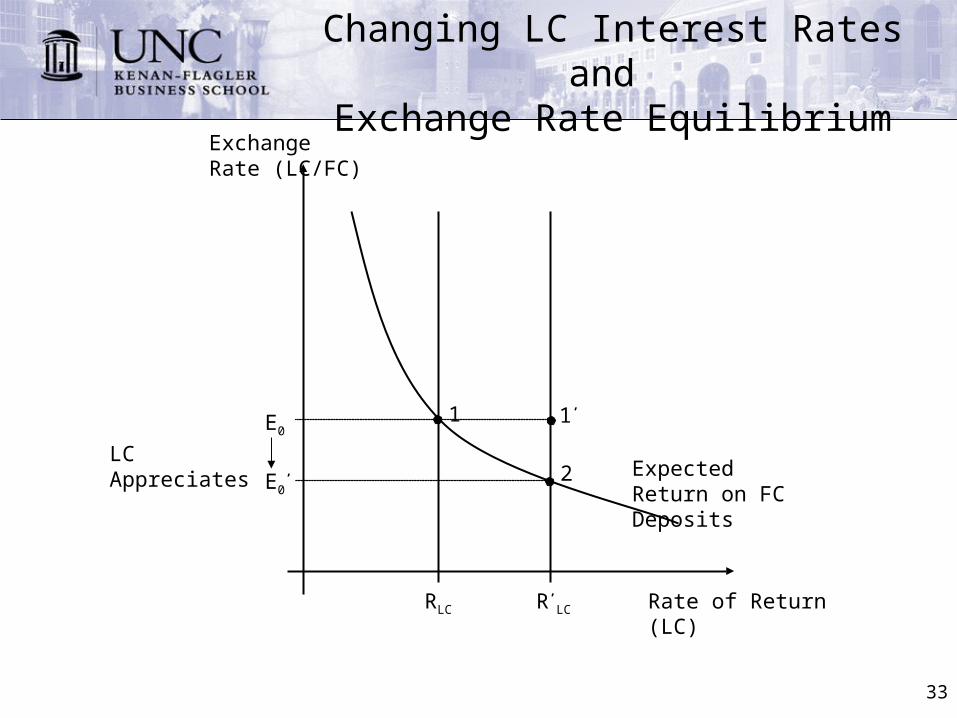
Changing LC Interest Rates and Exchange Rate Equilibrium
Rate of Return (LC)
Exchange Rate (LC/FC)
RLC
E0’
E0
Expected Return on FC Deposits
1
2
R’LC
1’
LC Appreciates
34
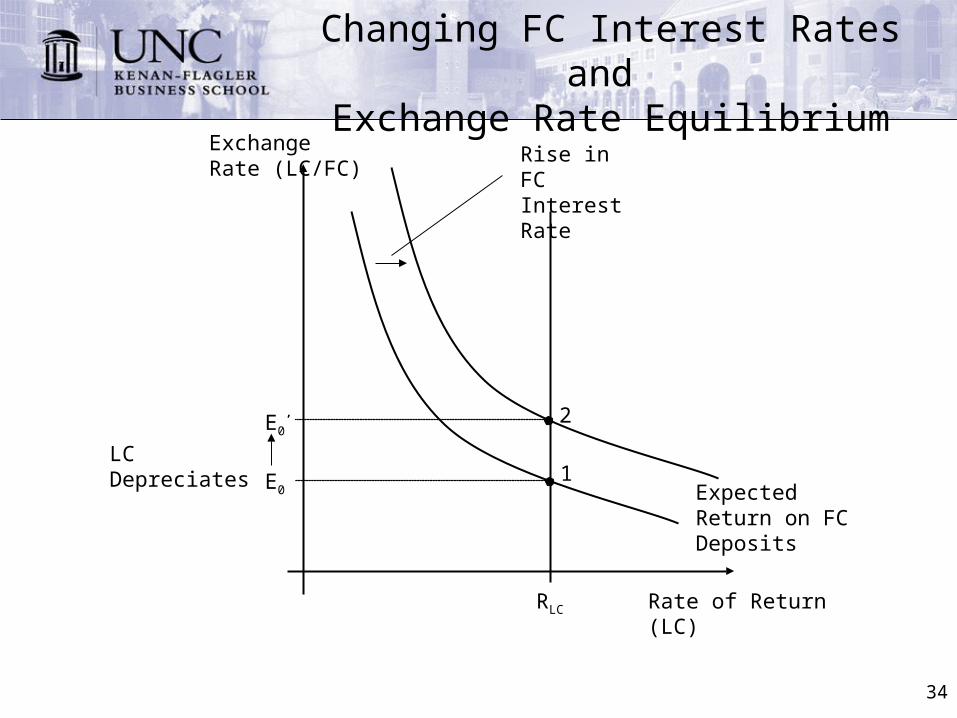
Changing FC Interest Rates and Exchange Rate Equilibrium
Rate of Return (LC)
Exchange Rate (LC/FC)
E0
E0’
Expected Return on FC Deposits
1
RLC
2
Rise in FC Interest Rate
LC Depreciates
35
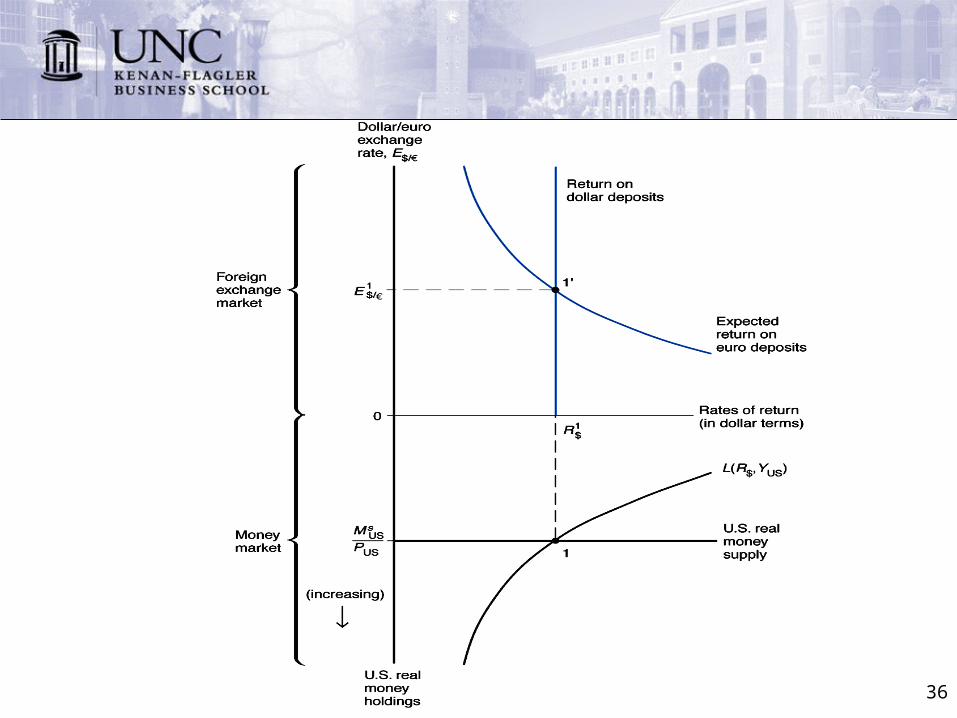
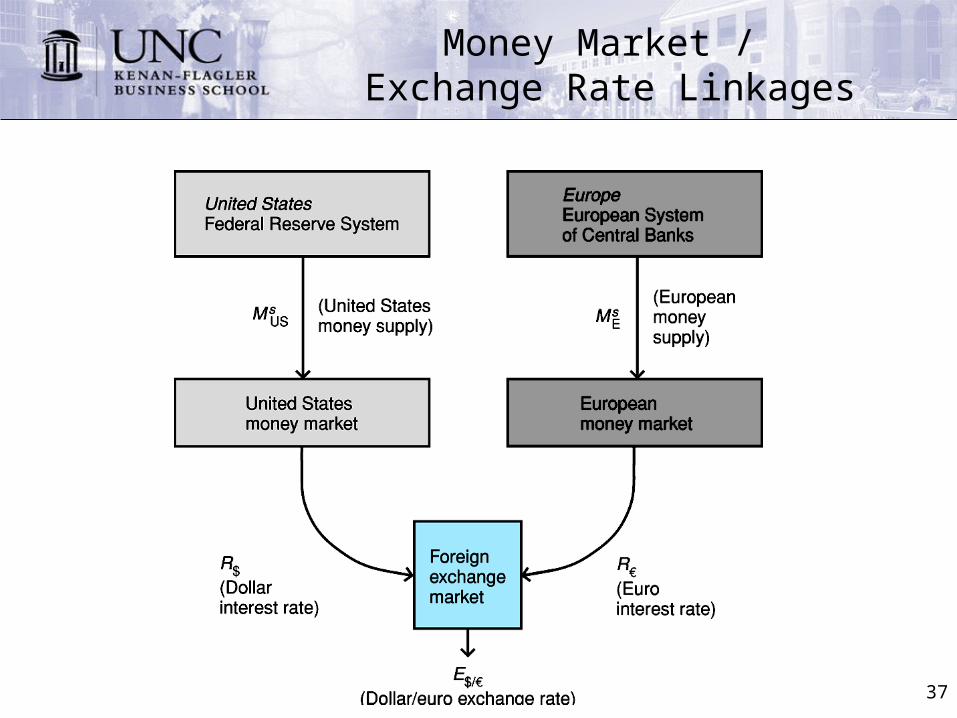
Money, Interest Rates, & Exchange Rates
• We can combine what we learned previously about the demand for money with what we now know about exchange rates
• This gives a more integrated picture of how money, interest rates, and exchange rates interact
• For convenience let’s rotate the money market graph clockwise 90o and combine it with the FX market graph
36
37
Money Market / Exchange Rate Linkages
38
39
40
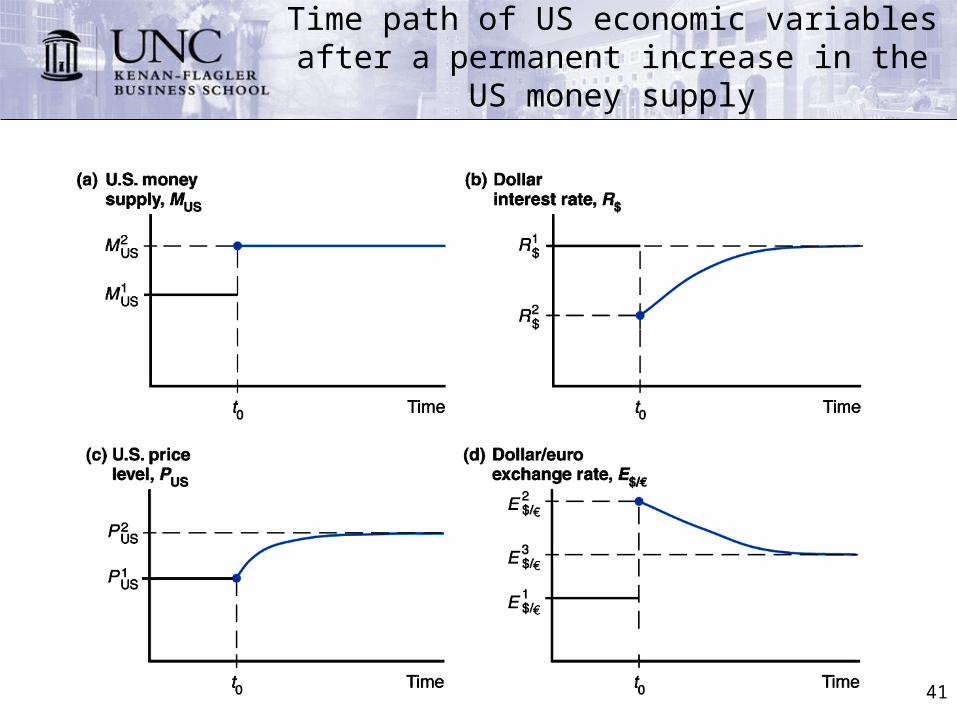
41
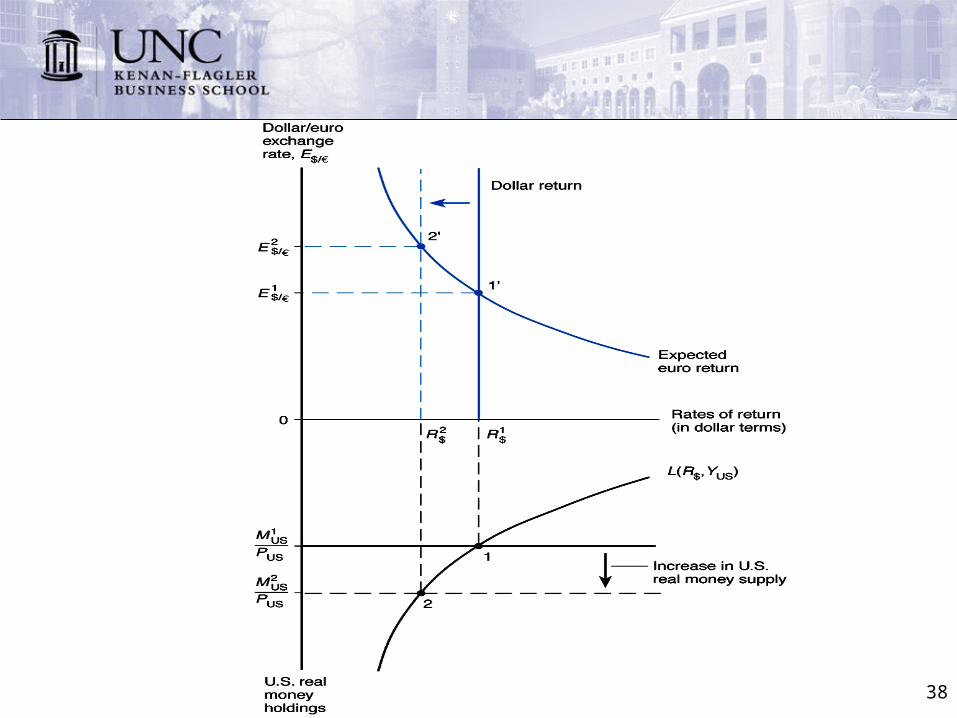
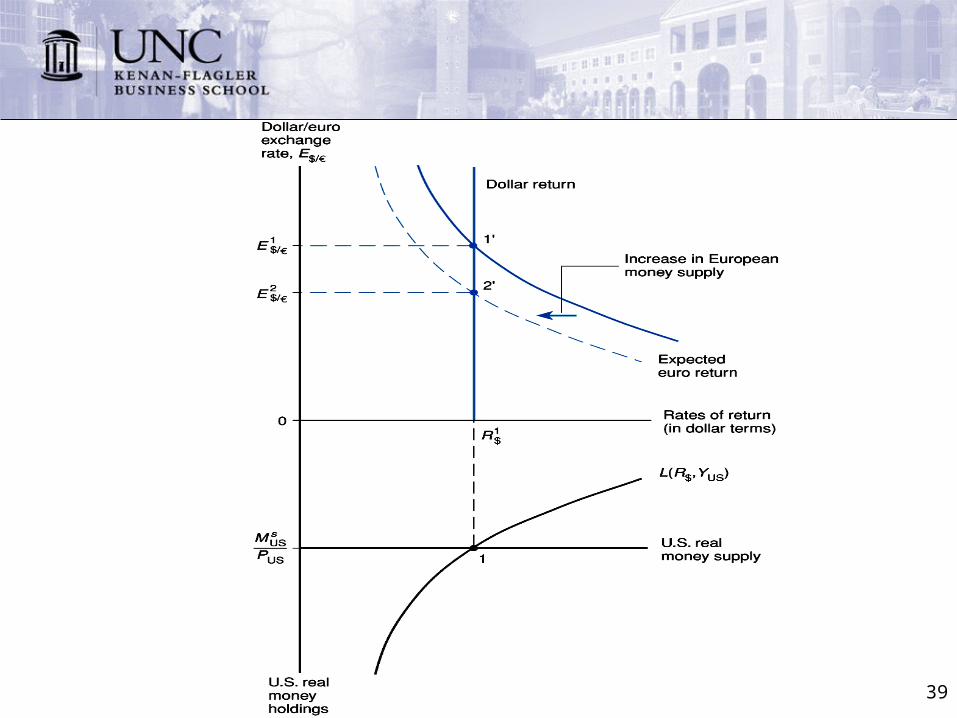
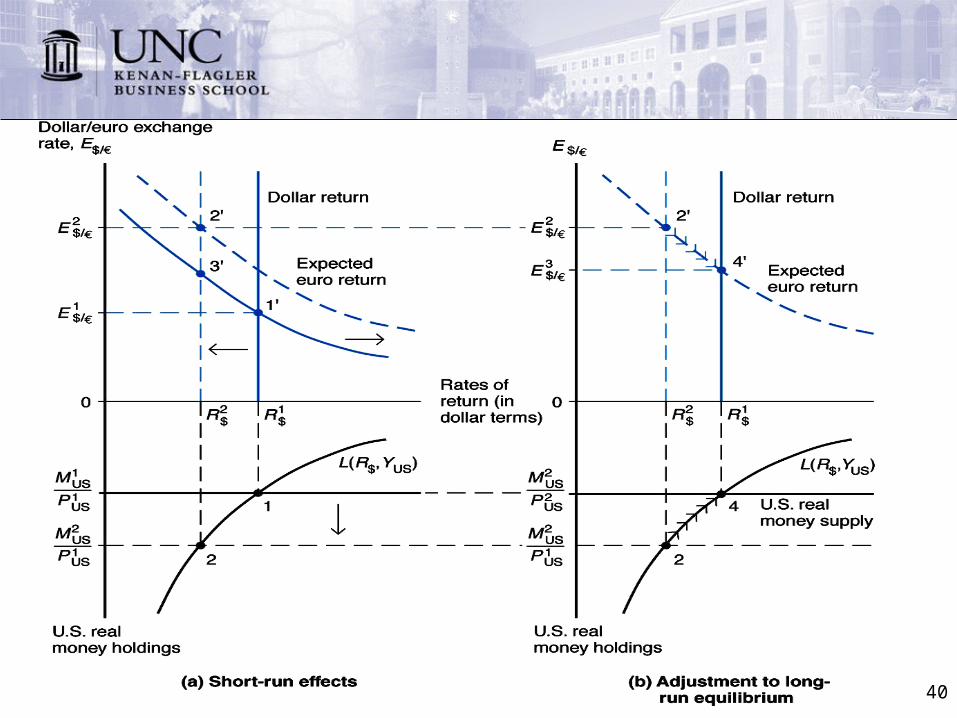
Time path of US economic variables after a permanent increase in the US
money supply