Embed Size (px)
Citation preview

http://go.warwick.ac.uk/lib-publications
Original citation: Johnson, M. R. D., Clark, M. D. (Michael D.), Owen, David (David W.) and Szczepura, A. (1999) The unavoidable costs of ethnicity : a review of evidence on health costs. Coventry, UK: Centre for Health Services Studies, University of Warwick. http://wrap.warwick.ac.uk/55735 Copyright and reuse: The Warwick Research Archive Portal (WRAP) makes this work by researchers of the University of Warwick available open access under the following conditions. Copyright © and all moral rights to the version of the paper presented here belong to the individual author(s) and/or other copyright owners. To the extent reasonable and practicable the material made available in WRAP has been checked for eligibility before being made available. Copies of full items can be used for personal research or study, educational, or not-for-profit purposes without prior permission or charge. Provided that the authors, title and full bibliographic details are credited, a hyperlink and/or URL is given for the original metadata page and the content is not changed in any way. A note on versions: The version presented here may differ from the published version or, version of record, if you wish to cite this item you are advised to consult the publisher’s version. Please see the ‘permanent WRAP url’ above for details on accessing the published version and note that access may require a subscription. For more information, please contact the WRAP Team at: [email protected]


‘The Unavoidable Costs of Ethnicity’
A review of evidence on health costs
presented by
Mark R D JohnsonMary Seacole Research Centre, De Monfort University
Michael ClarkCentre for Health Services Studies, University of Warwick
David OwenCentre for Research in Ethnic Relations, University of Warwick
Ala SzczepuraCentre for Health Services Studies, University of Warwick
January 1998Revised June 1999
Digital Version Updated in 2013 by Anne Shaw and Josh Elliott
Published by Centre for Health Services Studies, University of Warwick

1
The Unavoidable Costs of Ethnicity: Executive Summary
This report was commissioned by the Advisory Committee on Resource Allocation (ACRA), and preparedby the Centre for Health Services Studies (CHESS) and the Centre for Research in Ethnic Relations(CRER) at the University of Warwick. The NHS Executive does not necessarily assent to the factualaccuracy of the report, nor necessarily share the opinions and recommendations of the authors.
The study reviews the evidence concerning the degree to which the presence of populations of minorityethnic origin was associated with ‘unavoidable additional costs’ in health service delivery. While localhealth authorities retail full autonomy in their use of funds allocated to them under the Hospital andCommunity Health Services formula, the size of that budget is governed by a set of weightings applied totheir population, to allow for factors known to influence levels of need, and the costs of providing services.
The study began by considering the definitions used in describing ‘ethnicity’ and ethnic groups in relevantmedical and social policy literature. It is clear that no fixed set of terms can be adopted, and that flexibilityis required to respond to social changes. The terms used in the 1991 Census, with additions to allow forlocal and contemporary developments, provide a suitable baseline but require additional information onreligion language and migration history for clinical and health service delivery planning.
There have been notable developments in health service strategy to meet the needs of black and minorityethnic groups which have been encouraged by good practice guidelines and local initiatives. Together withresearch into epidemiology and ethnic monitoring of services, these have enlarged understanding of theimpact of diversity. A conceptual model is developed which explores the potential for such diversity to leadto variations in the cost of providing health services to a multi-ethnic population.
The research team reviewed the existing published evidence relating to ethnic health and disease treatmentin medical, social science, academic and practitioner literature, using conventional techniques. Additionalevidence was located through trawls of ‘grey’ literature in specialist collections, and through contacting allEnglish health districts with a request for information. A number of authorities and trusts provided writtenand oral evidence, and a bibliography of key materials is provided.
Key issues considered include the need for and use of, interpreter and translation services, the incidence of‘ethnically-specific’ disease, and variations in the prevalence and cost of treating ‘common’ conditions inminority ethnic populations. Sources of variation are discussed, and a ‘scoping’ approach adopted toexplore the extent to which these variations could be adequately modelled. It is clear that while someadditional costs can be identified, and seen to be unavoidable, there are other areas where the presence ofminority populations may lead to lessened pressures on budgets, or where provision of ‘ethnic-specific’facilities may be alternative to existing needs.
The literature provides a range of estimates which can be used in a modelling exercise, but is deficient inmany respects, particularly in terms of precise costs associated with procedure and conditions, or inassociating precise and consistent categories of ethnic group with epidemiological and operational serviceprovision data. Certain other activities require funding to set them up, and may not be directly related topopulation size. There is considerable variation in the approaches adopted by different health authorities,and many services are provided by agencies not funded by NHS budgets. The study was completed beforethe announcement of proposed changes in health service commissioning which may have other implicationsfor ethnic diversity.

2
Conclusions and Recommendations
The presence of minorities is associated with the need to provide additional services in respect ofinterpreting and translation, and the media of communication.
In order to achieve clinical effectiveness, a range of advocacy support facilities or alternative models ofprovision seem to be desirable.
Ethnic diversity requires adaptation and additional evidence in order to inform processes of consultationand commissioning.
Minority populations do create demands for certain additional specific clinical services not required by thebulk of the majority population: it is not yet clear to what extent the reverse can be stated since research on‘under-use’ is less well developed.
Some variations in levels of need, particularly those relating to established clinical difference insusceptibility or deprivation, are already incorporated in funding formulae although it is not clear how farthe indicators adequately reflect these factors.
Costs are not necessarily simply related to the size of minority populations.
The provision of services to meet minority needs is not always a reflection of their presence, but hasfrequently depended upon the provision of additional specific funds.
There is a consensus that the NHS research and development strategy should accept the need for more workto establish the actual levels of need and usage of service by ethnic minority groups, and that effort shouldbe made to use and improve the growing collection of relevant information through ethnic monitoringactivities.
A variety of modelling techniques are suggested, and can be shown to have the potential to providepractical guidance to future policy in the field.
Current data availability at a national or regional scale is inadequate to provide estimates of the ‘additionalcosts of ethnicity’ but locally collected data and the existence of relevant policy initiatives suggest that afocused study in selected districts would provide sufficiently robust information to provide reliableestimates.
The review has demonstrated that there are costs associated with the presence of minority ethnic groups inthe population which can be shown to be unavoidable and additional, but that others are either ‘desirable’ or‘alternative’. It would be wrong to assume that all cost pressures of this nature are in the same direction.Our study has drawn attention to deficiencies in data collection and budgeting which may hinderinvestigation of the effectiveness of the service in general. The process of drawing attention to ethnicminority needs itself leads to developments in services which are functional and desirable for the majoritypopulation.
Mark R D Johnson, Michael Clark, David Owen, Ala SzczepuraUniversity of Warwick, January 1998

3
INTRODUCTION
This report was commissioned by the Advisory Committee on Resource Allocation Group (ACRA), as afeasibility study to be based on a search of available literature which might serve to answer the question:‘Are there unavoidable costs associated with ethnicity’ in health service provision. The answer to thisquestion might justify or require allocation of additional funding to Health Authorities which wereresponsible for the care of areas containing significant numbers of people belonging to minority ethnicgroups. The enquiry was in part stimulated by the observation of a London authority that:
The more ethnic communities a District has in its total population the higher the costs faced by theirproviders if they provide appropriate and timely services. Put simply, a DHA/Trust which has apopulation which only speaks one language faces no increases in costs due to language. If thepopulation has two major languages (e.g. Florida: English and Spanish) costs associated withlanguage will be small as the infrastructure to set up and maintain appropriate language facilitiesneed only be done once and the population should be able to respond to those needs overtime. If aDHA/Trust has a population which uses, say, over 10 languages the cost of setting up andmaintaining language services has to be repeated and increases as the number of groups increase orchange. Whether the population has 500 or 5,000 members, costs are incurred. Typically inner cityDHAs and Trusts face dynamic and rapidly changing populations due to international instabilityand requests for asylum. (Leahy, pers. comm. 1997).
We should note that this is not a ‘new’ question or issue for welfare service providers: it is an issue acrossEurope, where (for example) German insurance funds have begun to employ ‘second generationimmigrants’ or foreign workers to cater for the needs of Turks in Berlin or Italians in Cologne (Abel Smithet al 1995). Within Britain the Local Government Act of 1966, which re-organised the rating system andmethod of funding local authority services, contained a specific provision which is widely referred to as‘Section 11’. This regulation was to allow Central Government (through the ‘Secretary of State’) to makeadditional special payments to local authorities in respect of the cost of what was perceived as temporary ortransitional arrangements for language training and employment of interpreters or bilingual workers.Despite many subsequent revisions of local government and funding regimes, this provision remains inforce, and was reprieved by the Labour Government following its election. While more than four fifths ofthis funding has historically been spent on educational provision (97% in 1996/7), it is clear that in itsorigins, it was available to health services, and that a significant amount of use has been made by socialservices departments (Johnson, Cross & Cox 1988). The Home Office (the responsible department) wasunable to provide information about its current use in respect of health and welfare services, but notes that areview of the programme is currently underway. There are a number of other programmes and policieswithin the broader sphere of ‘urban policy’ which also make allowance for, or provide services to, minorityethnic groups and their needs, which we have not explicitly sought to examine in this study. Equally, it is atpresent uncertain to what extent the declaration of ‘Health Action Zones’ targeted at areas of urbandeprivation (and Health Improvement Programmes) will provide another means of meeting those needs.
The allocation of funds to health authorities (HAs), to provide them with a base budget or revenue resourceto purchase Hospital and Community Health Services (HCHS) has evolved from that laid out in the‘Resource Allocation Working Party’ (RAWP) formula, but is still based upon a weighting applied to thecapitation (number of people) of the area in question. This formula is revised from time to time, accordingto current evidence and priorities, and applies only to the core services for which HAs are responsible. Itshould be noted, however that the formula provides an overall figure and is not prescriptive as to theallocation of the funds to specific services. Further, activities which were formerly the responsibility ofFamily Health Service Authorities (FHSAs) are in general treated separately. This therefore excludes fromthe HCHS formula services provided by ‘independent contractors’ such as General Practitioners (GPs),which are governed by different rules including the ‘Statement of Fees and Allowances’. This report is notconcerned with those, except insofar as GPs are the gatekeepers (and may indeed be ‘purchasers’) of muchhealth service provision and expenditure - and their activity cannot therefore be entirely divorced from anyanalysis of health service use. However, we have not attempted in general to explore the costs to that sectorof primary care provision, of serving an ethnically diverse population. We would, however, wish to drawattention to the implications of the move to new models of commissioning which involve primary careproviders and communities more.

4
The existing NHS formula for the allocation of revenue resources to Health Authorities does to a smallextent make some acknowledgement of the effects of ethnic minority presence on health service deliveryneed (NHSE 1997). The principles by which funds are allocated derive from the original formula devisedby the Resource Allocation Working Party in 1976, and adapted and adjusted subsequently in the light ofchanging information and priorities. The core element is that the budgets should respond to ‘need andunavoidable differences in costs of provision’, while being quite explicitly non-directive in terms of relatingfunding to specific provisions. Local autonomy is thereby upheld, and none of this core budget is ‘ringfenced’ or linked to a particular service or activity. Special weights are applied to the overall formula (orsections of it) to allow for such ‘unavoidable costs’ as labour market forces, and other special allocationsare made in respect of particular issues where a highly skewed distribution of demand is noted (e.g. AIDS).Age-related weights are also applied to allow for demographic factors beyond the overall populationnumbers, derived from projections of Census-based population data. At present however, these do not takeaccount of the ‘ethnic minority’ composition of the population, although it is possible that the differentialbirth-rates of certain groups (younger, or more recent, migrants) may be picked up in these calculations.More significantly, it can be seen that the historic indicator (i.e. that used in the 1971 Census and itsanalyses) of ‘ethnic minority’ presence: ‘proportion born in the New Commonwealth’ (NCWP), is used attwo points in the formula’s calculation. These relate to the Psychiatric Needs Index (NHSE 1997 p17 Table5) and within the Non-Psychiatric Community Needs Index, as a weighting for Chiropody care (NHSE1997 p19). Perhaps surprisingly (in the light of the findings of this enquiry), there is no such weighting inthe allocation relating to Joint Finance activity (p37) where proxies for four other ‘client groups’ are used.We discuss below the potential value or weakness of this particular indicator, but conclude by observingthat, in principle, it appears that the case for a weighting relating to ‘unavoidable cost(s) of ethnicity’ hasalready been accepted, albeit imperfectly and not necessarily in the sense that it would be accepted orunderstood by all those involved in the present enquiry. We are unable to estimate the effect of replacing‘the ‘NCWP’ weighting with the more modern Census estimator of ethnic minority numbers.
There is a well developed literature which has established significant variations in health among migrantand ethnic minority populations - indeed, there is a tradition in the science of epidemiology of using suchvariations as a means of understanding the causes of some aspects of ill health (Ahmad et al 1996).Confusingly, not all research demonstrates the same differences, and there are certain conditions (andservices or procedures) where the minority groups are found to show under-representation, and otherswhere there are clear excesses of morbidity, mortality, or treatment. Some difficulties of interpretationarise from differing categories of description - country of birth or ‘origin’ not always being clearly linkedwith other personal or genetic characteristics, and yet the former is most commonly the only informationrecorded routinely on medical (or death) files and certificates. These matters are discussed in greater detailbelow.
Particular attention has been paid to the question of ‘ethnic health’ in Britain since the 1991 report of theMedical Officer of Health (Calman 1992), which drew attention to the facts which had been established,and fitted them into the context of the developing ‘Health of the Nation’ programme (Balarajan & Raleigh1993). More recently available data have enabled a clearer look at the relationship between ‘ethnic health’(more properly, minority ethnic health) and the health variations selected for consideration in the Healthof the Nation strategy (Balarajan 1995). The current move towards a broader focus on health inequalitiesand variations has accentuated, rather than reduced, the significance of these findings, while at the sametime enabling greater consideration of certain other differences. We have drawn selectively upon the nowrather extensive consequent literature, much of which is polemic or technical, in seeking evidence which isrelevant to the specific question at issue, which is the extent to which there can be said to be ‘unavoidable’health service costs associated with membership of, or provision of services to, specific minority ethnicgroups.
DEFINING ‘ETHNICITY’ and ‘ETHNIC GROUPS’
Ethnic categorisation is a complex issue. Traditional anthropology, which defined four major human races,identifies ‘Caucasian’ (‘white’ or European), ‘Negroid’ (Black or African), ‘Mongoloid’ (Asian, Chinese orIndic), and ‘Australoid’. The latter three terms have largely been abandoned in scientific discourse,

5
although they still are used occasionally. Strictly, the majority of people from the Indian sub-continentbelong to the same ‘race’ and meta-language group (Aryan, Indo-Sanskritic) as the inhabitants of Europe.Indeed, the group ‘Caucasian’ can be argued to be misleading, and to ignore significant genetic (orheredity-linked) variation within the populations of western Europe. The term is reported to have beenoriginated by a German professor of natural history who sought to trace the origins of humanity to thegrounding of Noah’s Ark on Mount Ararat in the Caucasus mountains (Spencer, 1996). Some scientificreports, as recently as 1997, use a mixture of the above terms, and the term ‘Europid’ (White Caucasian ofEuropean origin) also appears. None of these group labels are regarded by most present-day geneticists asbeing of great scientific validity or practical value: policy and practice have led to new usages, and anincreasing reliance on concepts of ‘ethnicity’, based on traditions of common descent or intermarriage andshared culture or history. Necessarily, in a world of migration and mixing, cultures and societies aredynamic rather than fixed.
The root of the problem of scientific usage is that the terms used are at present most carefully debated bysocial scientists, following an agreement under the auspices of the United Nations that the term ‘race’ hadno scientific validity. The different words used (AfroCaribbean, African-Caribbean, etc) have variousimplications and are claimed or promoted by a variety of schools of thought, and may have politicalovertones. At the same time, they are also words in ‘common parlance’ and change their meaning with littlerecourse to formal definitions. There are further international differences - for example, American usage isto refer to ‘race’, defined as ‘Black’ and non-black; and to map across that and categories based on‘geographies of origin’ (African, American, Pacific Island) the category of ‘Hispanic’, implying a Spanishlanguage and cultural heritage (Hahn & Stroup 1994). Frequently only context and footnotes can be reliedupon to clarify ‘common sense’ interpretation. However, at the same time, it can be shown thatdiscrimination and aspects of disadvantage, as well as genetically-linked disorders and lifestyle behavioursare closely associated with the groups labelled in these ways: in short, there is little alternative to using aselection of these labels and categories (Bhopal 1997).
Medical journals are, slowly, moving towards a consensus, but have to wrestle with the issue ofinternational comparability. The process of searching for references using Medline and other computeriseddatabases elicited a number of categories which we had not expected to find, including ‘Caucasoid-race’and ‘Negroid-race’ among MeSH terms, and MeSH terms whose use was idiosyncratic. The broad term‘ethnic’ (22619 hits in this particular run) included ‘ethnic groups’ (17897), ‘ethnic mixed’ (1), ethnical(61), ‘ethnically white’ (2), and ‘ethnioatrics’ (1). The British Medical Journal has published a series ofarticles discussing the question of terminology and good practice. Its current guidelines provide a usefulway forward (BMJ 1996: 1094).
Authors should describe in their methods section the logic behind their ‘ethnic’ groupings. Termsused should be as descriptive as possible and reflect how the groups were demarcated. ... if it isunknown which ... is the most important influence then an attempt should be made to measure all ofthem. A range of information is best collected:
Genetic differences Self assigned ethnicity using nationally agreed guidelines Observer assigned ethnicity using ... national census categories Country or area of birth ... Years in country of residence Religion
The journal ‘Ethnicity and Health’ itself avoids a definitive ruling, and recently published a review ofeditorial policies (Bhopal, Kohli and Rankin 1997). Their conclusion is that there is at present muchconfusion and that the issue requires further debate.
The original legislation relevant to formal record keeping in Britain was the Race Relations Act 1976,which (Sect 3) defined a ‘racial group’ as ‘a group of persons defined by reference to colour, race,nationality or ethnic or national origins...’, while the scientific concept of ‘race’ had already been officiallydiscredited for several years. ‘Ethnicity’ became more formally defined in UK law by a House of Lordsdecision (Mandla v Lee 1983) as relating to group with ‘a long shared history and a distinct culture’. Other

6
‘relevant’ characteristics in defining an ethnic group include ‘a common geographic origin or descent froma small number of common ancestors; a common language; a common literature; a common religion andbeing a minority within a larger community’. Specific ethnic groups, given that social scientists tend toargue (following the Swedish anthropologist Barth) that ‘ethnicity’ is a self-defined identity relating toboundaries placed in relation to ‘others’, can be as many as may be self-defined. For practical purposes,however, in most arenas of social policy, the ten or so groups identified by the 1991 UK Census arenormally regarded as the most significant groups. The Department of Health & NHS guidance, in settingup the requirement that ‘ethnic group’ data be collected on all in-patient episodes, was that these Censuscategories should be the minimum, but that additional groups might be added if local circumstancesrequired.
Subsequent to the 1991 census, new groups of interest to health policy have emerged, some due to recentrefugee movements of population (Kurds, Bosnians etc), and there has been a growing tendency for youngpeople of African-Caribbean origins born in Britain to determine their own identity as ‘Black British’. Forother health researchers (e.g. the current study of ‘quality at consultations’ by Prof. Howie at EdinburghUniversity), the most useful proxy is ‘language used in the home’; while research in Peterborough on healthservice complaints (Imtiaz and Johnson 1993) found that the critical delimiter was religion, and members ofthe Muslim, Punjabi-speaking population of Birmingham often self-identify as ‘Kashmiri’ or ‘Mirpuri’(Johnson et al 1996), referring to local district names in the place where they or their parents were born.These kinds of detailed self-identification, which may appear in local ethnic monitoring, are not available inthe Census, creating some difficulties in calculating ‘rates’ based on an agreed denominator. The sameproblem arises with smaller groups such as Arabs, large groups without a clearly accepted ‘ethnic label’but displaying relevant characteristics (e.g. the Irish), and most particularly, when the identifier is religious- as is increasingly being felt in relation to the need to respond to the requirements of Islam (Muslimpatients), Sikhism, Buddhism and also of Hindus.
In terms of epidemiological research, the tendency in medical research has been to rely upon the relativelyunequivocal and commonly recorded variable ‘place of birth’. This data is, for example, normally availableon death certificates. Consequently much of the current information on ethnic variation in health reliesupon the analyses conducted (see Balarajani et al 1984; Balarajan & Raleigh 1993; Marmot et al) on thosedata and compared against the denominator of the 1971 and 1981 Census. However, there are clearproblems in this, since in 1971 it was estimated that perhaps as many as 10% of those ‘born in India’ wereof white ethnic origin, while in 1981 at least 5% of the heads of household (the proxy variable used in thatCensus) of Asian ethnic origin were UK-born. At the time of the 1991 Census, when for the first time anethnic origin question was asked, over half the population in the ‘Black’ categories (54% Black Caribbean,84% Black Other, and 36% Black African) were UK-born, as were half of those giving their ethnic group asPakistani, 42% of ‘Indians’ and 37% of ‘Pakistanis’. Clearly, with relatively high birth rates and a youthfulage profile, these figures will now have increased to the point that considerably less than 40% of the ethnicminority population can be identified by birthplace - and increasingly few by the birthplace of their parents(a proxy variable used extensively in Scandinavia for similar analyses).
Certain other groups which need to be considered in any discussion of ethnicity and health service costs, arenot recorded in any sense either in the census data nor in any other database providing a denominator forepidemiological studies or a basis for estimation of needs in any other sense. These include, in particular,‘gypsies’ (Roma or travellers - McKee 1997) regarding whose health there is already a considerable lack ofknowledge but growing interest (Feder et al 1993). The second, larger and more problematic but less easilydefined, is the growing population of refugees and asylum seekers (for a review of the literature on thisgroup, see Johnson & Akinwolere 1997). Both groups place particular demands on the health service,including a necessity of specialist knowledge and peripatetic service provision, as well as having distinctivelanguage and cultural needs and creating problems for administrative record keeping when they have nolong-term fixed residential address. A significant proportion of the ‘grey literature’ and comments receivedrelating to unusual costs in response to our survey referred to these groups.
It is also important to note that while the greater proportion of ethnic minority groups are located withinurban metropolitan districts, this is certainly not necessarily the case for gypsy groups. The consensus ofexpert opinion is that most refugees are located in London, with lesser concentrations in other metropolitanareas, most of which may have their own ethnic minority concentrations some of which are able to assist

7
with linguistic or cultural support. However, there is no necessary correlation between these, and manyformal refugee resettlement camps were located in places such as Rugby, or on former military bases in thecountryside. Recent flows of refugees have included groups (Kurds, Bosnians) for whom there are few‘traditional’ UK-based communities of settlement, although some such as the Somalis have been able tolocate long-established communities in Wales, Merseyside Birmingham and London (amongst others).
For the purposes of health service planning and needs assessment, there is clearly a need for local studiesand close relationships with relevant third sector agencies which may be able to provide up-to-dateestimates of numbers in specific ethnic groups locally. Costing of such services will also need to beundertaken on an ad hoc basis. By the same token, identification, categorisation and ‘ethnic monitoring’will need to be reactive to local conditions, and sensitive to the political (data protection) fears of themembers of such groups as refugees. In the interim, however, and until the inclusion of a religion questionin the Census (which is currently under discussion), there is little alternative for national purposes otherthan the use of the OPCS-defined 10-fold categorisation developed for the 1991 census, which provides theonly workable denominator. Good practice and consistency with Census planning requires that individualsare allowed to define their own ethnic group, based on the provision of suggested key categories, butallowing a ‘write-in’ option (as was the case leading to the category ‘Black British’). Local requirementsmay suggest the value of including prompted names of other groups of special local interest for serviceplanning (e.g. Somali), which may be ‘mapped back’ to the census definitions using the broader list ofgroups (see 1991 Census ‘table A’ which includes 35 categories) and expert advice. To this, as suggestedby the BMJ, should be added the collection of information on religion, language, and if it is thoughtrelevant to the issue, migration history. None of these questions, however, should only be asked of peoplewho (may be thought to) belong to a minority group: if they are relevant, then they need to be collected andanalysed for the whole population under consideration. Experience in implementation of ethnic monitoringhas shown that the opportunity to self-identify in terms of culture, religion and so on is often welcomed alsoby members of the ‘majority’ population.
THE DEVELOPMENT OF ETHNIC HEALTH STRATEGY
A number of reports in the grey literature, as well as some of the academic studies reviewed, draw attentionto the history of the development of ethnic health strategies. These ‘milestones’ are perhaps significant, butequally, recording them demonstrates clearly that there has been a delay between rhetoric and statutoryguidance, and the implementation of the elements of the strategy.
Johnson (1984) has drawn attention to the first reported concerns with ethnic health, in the guise of ‘portmedicine’, and the ways in which these have developed through an interest in ‘exotic’ disease to a growingawareness of the importance of considering access to services and the treatment or prevention of ‘commondiseases’. Other commentators (cf Ahmad 1993) have remarked on the unbalanced nature of this attention,with greater resources being allocated to ‘control’ than to ‘care’, and ethnic-specific interests frequentlybeing ignored in policy allocation and development.
By 1981, Department of Health initiatives had begun specifically to address the issues of ethnic health, withthe publication of ‘Development of Interpreting and Advocacy Services’ (1981) and the funding of the StopRickets Campaign. In 1984, a workshop led to the publication of ‘Providing Effective Health Care in aMulti-Racial Society’ and the DoH funded Asian Mother and Baby campaign. Subsequently, NAHA (nowthe NHS Confederation) published a report entitled ‘Action not Words’, commenting adversely on thespeed at which HAs were implementing the earlier recommendations, and in 1989 the Departmentappointed its Ethnic Health advisor. Two year later, the SHARE database was established at the King’sFund as part of a wider initiative to develop information resources to support ethnic health initiatives, andthe CMO’s annual report (Calman 1992) drew explicit national attention to the state of ethnic minorityhealth. Subsequent separate publication of the relevant chapter was intended to increase debate andawareness, and in 1993 the NHSE Ethnic Health Unit was set up with a brief to support developmentalprojects and encourage inclusion of monitoring of ethnic health as part of the quality standards approach.The 1994 Planning and Priorities Guidance issued to all commissioning bodies included a requirement toaddress ethnic health issues, and this was supported by information becoming available from the HEAsurvey of health and lifestyles (Rudat 1994) and the DoH Variations in Health initiative. After severalyears of experimentation and development, and debate, ethnic monitoring of inpatient events was also

8
required from April 1995 (EL(94)77 and CHIR), although some authorities had been doing this for at leasttwo years previously. All of these were also supported by the production of materials from the Kings Fund,DoH and NHSEHU (e.g. Checklist on Health & Race - Gunaratnam 1993; Purchasing for BlackPopulations - Jamdagni 1996; Facing up to Difference 1996).
Given this history, it is alarming to note that in all the DPH reports received and reviewed by this study in1997, only a minority have any explicit reference to these matters, and exceptionally few contain any ethnicmonitoring data. It is clear that the Department of Health and authoritative reports already make a numberof significant recommendations for ‘additional’ or ‘special’ services, and that health authorities mustnecessarily incur some additional costs through introducing and continuing to provide these. One of thesecosts is the requirement to implement ethnic monitoring, which is still not universally available - there arealso ‘opportunity costs’ when data is collected and not used.
METHOD OF THE STUDY
The project began by drawing on critical reviews of research-based literature and other relevant studies. Inaddition to searching the CRER resources centre database and the results of our own previous researchactivities in this field, which include significant amounts of material for the Health Education Authority andvarious health authorities and commissions, we consulted the standard Medline database, the Leicester,Bradford and Kings Fund specialist ‘ethnic health’ databases, and our collection of (often unpublished)reports from good practice development projects. Edited textbooks, collections of papers from conferencesand other similar materials (e.g. the review essay by Smaje 1995) were also examined.
In order to obtain the widest possible selection of ‘grey literature’ in the time available, health authoritiesand selected relevant community-based organisations, were contacted. In particular, we requested reportsand costings from Directors of Public Health and ‘ethnic health’ projects (cf Scally 1997). A copy of theletter is attached as an appendix.
An outline of the conceptual modelling approach adopted (and developed throughout the project) is givenin Appendix D below. It includes consideration of issues relevant to ‘support’ services such as translation,advocacy and dietary needs; ‘ethnic-related’ conditions such as the haemoglobinopathies (and relative lackof others such as Cystic Fibrosis or factor V Leiden); differences in prevalences of common ‘conditions’(including maternity, acute and chronic physical services, mental health etc); and clinical services such astesting and diagnostics and blood/tissue banking. A critical element is the assessment of the degree towhich costs are ‘Unavoidable’ and ‘Additional’. It will also be apparent that in some cases the direction ofcost variation may be negative, and in others, additive, while in others, the effects depend upon the degreeto which an outcome or action is seen to be relevant to, or desirable for, health policy and practice. As aconceptual model, we are not in all cases able at this point to establish whether there is evidence of an‘ethnic effect’, but all elements are based upon a reading of the relevant literature that suggests that theremay be such an implication.
The starting point of the model is that there will be variations in costs arising from a series of differentfactors, some of which overlap, and others of which may be complementary or counter-balancing. Themost immediately apparent effect of ethnic or cultural diversity, in service delivery terms, is perhaps theexistence of linguistic barriers to communication. Consequently, one starting point is to examine the needfor additional ‘support services’, which will include not only the translation of printed materials and signs,but also the costs of reproduction (which may be higher, because of special fonts or other technical issuesas well as being in ‘short runs’). The employment of interpreters will be necessary, together with theoverhead costs of their accommodation and administration, and the impact of their work on others - whichmay include training in their use. In the field of ‘ethnic health’, there is now an established pattern of use ofspecialist advocates, to a higher degree than their broader use within the majority community. Culturalvariation may also be responded to by additional or alternative provision in terms of food to meet religiousconstraints, prayer facilities and ‘chaplains’. The degree to which these latter costs are additional, ratherthan alternative, will depend on establishing a cost differential between the facility or ‘good’ supplied to themajority and minority groups: it might be argued that atheists or voluntary cultural centre support save theNHS the cost of chaplains, for example.

9
Following on from the notion of cultural difference, we can examine the extent to which minority groupshave access to, or prefer to use, ‘alternative’ therapies. Such evidence as we have identified (e.g. Ahmad1993) suggests that the use of complementary therapies in minority communities, as in the majority, tend tobe additional rather than alternatives to NHS service use. Indeed, the early research focus on ‘ethno-medicine’ (use of hakims, Ayurvedic remedies etc.) now appears to have been misleading. However, it wasalso suggested that some minorities may seek treatment when ‘overseas’ visiting relatives - and historicallyit was believed that use of private (paid-for) treatment was also commoner among certain ethnic minorities.In this review, we were unable to find conclusive evidence of these matters.
In addition to cultural difference, the existence of ethnic variation carries a number of clinical implications.We were concerned to examine the extent to which diversity might impact upon clinical support serviceswhich would have to extend the number of tissue types, clinical/biochemical tests and related costs to dealwith these. Some costs (e.g. advertising for donors in minority media) might be subsumed under thetranslation and advocacy element while others would relate to the internal management or material budgets.In most cases, we would expect these to be additive, or to be more expensive ‘replacement’ (alternative)costs.
Ethnic minority epidemiology implies that there will be variations in the diagnostic and disease mixpresented by communities of diversity. There is no prima facie reason to assume that these will necessarilybe all additional - absence of susceptibility to certain diseases is as likely as the presence of ‘exotic’(additional) conditions. This has been, after the language issue, the area where most observed variation hasbeen remarked. We have attempted to review the field of ethnic-specific disease broadly, but are aware thatwe have not presented a fully comprehensive review of all such conditions.
In addition to the management of ‘additional’ ethnically specific disease, it is necessary to consider that themajority of expenditure is on ‘common’ diseases and conditions, both ‘acute’ and chronic. There aresignificant costs associated with nursing, therapies and with episodic use of services arising from maternity,mental health, and disability. These also may vary, and be affected by differential ‘ethnic epidemiology’.Variations in costs may also arise from different patterns of treatment, including specialist staffing. Theprevalence of chronic conditions will have similar implications.
Finally, we are aware that there is a literature within the social services field which lays stress upondifferent patterns of family life. There has been an assumption, which is now being challenged, that ethnicminority communities will ‘prefer’ to care for their own members, and thus relieve the statutory services ofan element of this burden. Equally, in health services research there are references to poorer complianceand problems of access to community-based services which go beyond language. The need to provide (forexample) gender-specific facilities or clinics at times to suit the work patterns of groups (e.g. the Chinese orBangladeshi) who are apparently predominantly employed in catering trades, may be included in thiscategory. Equally, there may be costs to other agencies, such as Social Services, and to communitiesthemselves, in meeting culturally required care needs, providing day centre facilities and the like, some ofwhich may be shared with NHS providers through joint finance. Similarly, as noted above, these facilitiesmay be provided through alternative sources of funding.
In an attempt to establish the excess costs arising because of these factors systematic literature reviews wereconducted in order to identify relevant recent literature. Searches were conducted using Medline for theperiod 1990-1997. Using simple high-level free-text and key-word searching (‘Ethnic’ and ‘Cost’)generated a fair number of citations under each of the two terms (drawing in ‘Ethnic Groups’ and ‘Cost-of-Illness’ as well as ‘Cost-Benefit-Analysis’ etc from the MeSH terms). Combined, fewer citations wereelicited.
Following an initial trawl of the literature, it became apparent that it would be necessary to restrict thenumber of conditions on which we would seek more detailed information. A selection of disease groupswhich were felt to be most significant, and on which data appeared most likely to be available, wereidentified and are subsequently referred to as the ‘index’ conditions. These included:
i. Diabetesii. Renal Failure

10
iii. Hepatitis Civ. Tuberculosisv. Stroke or Cardiovascular Diseasevi. Thalassaemiavii. Sickle Cell
Keywords for each of the index problems, as well as the keyword ‘interpret(er)’, were also used incombination with the keyword ‘cost(s)’, and then later for another search, in combination with the keyword‘ethnic’. The keyword ‘cost’ was used in order to identify any material which might contain relevant costinformation. This, if combined with epidemiological information indicating a different incidence orprevalence of a particular condition, could potentially be used in order to assess the additional costs to theNHS arising because of variation in the prevalence of a given health problem. The searches conductedusing the keyword ethnic, in combination with keywords for the selected health problems inevitably‘picked-up’ epidemiological papers relating to the disease areas, alongside some other potentially usefulliterature.
In order to adequately assess any unavoidable NHS costs associated with ethnicity, for the index problemsit is necessary to obtain cost and incidence / prevalence estimates for the United Kingdom. However, wemade an explicit decision not to restrict our searches to British literature. This was because overseaseconomic analyses may contain useful information relating to the range of costs which could arise in theNHS due to a given health problem. Furthermore in the absence of good epidemiological information forthe UK, overseas analyses may provide some indication of the extent to which a given health problem islikely to be related to ethnicity.
Other search terms were also deployed. We wanted to establish whether there were any good ‘burden-of-illness’ or ‘cost-of-illness’ studies which might be of use. Thus these keywords were used, and the ‘hits’were trawled to identify papers of relevance. We then attempted to combine epidemiological information,treatment information, and cost information in order to assess the unavoidable costs of health problemsassociated with ethnicity, for each of the index conditions. The extent to which we could do this dependedupon the extent of the availability of robust information on epidemiology and cost for the United Kingdom.Ideally, the epidemiological information needed should provide evidence on the extent to which theprevalence or incidence of conditions varies in the United Kingdom between whites and minority ethnicgroups - with some level of detail. The cost information also should relate to the UK, and ideally shouldinclude the full range of costs associated with a given condition. In so far as procedure costs are likely tovary amongst ethnic minorities relative to the mainstream population, this should be reflected in the costfigures selected. This level of epidemiological and cost information was rarely identifiable.
LITERATURE ON COSTS AND PURCHASING
The suggestion that ethnic or ‘racial’ diversity, associated with migration and settlement from territories ofthe ‘New Commonwealth’, has costs for the British welfare state is not particularly new. Debates inParliament in the 1960s referred to the greater propensity of ‘immigrant’ mothers to give birth in hospitalrather than at home, and the Local Government Act contained a provision whereby the Secretary of Statecould make payments to local authorities where additional costs could be shown to be associated withcultural or linguistic diversity (‘Section 11 payments’). A study undertaken by the Cambridge NationalInstitute for Social and Economic Research found that overall, migrant labour was cost-effective for thenational economy (Jones & Smith 1971). Recent reports still suggest that ethnic differentials may be anissue:
Diversity is London’s most distinctive feature, with a striking variety of ethnicity, cultures, povertyand wealth within different parts of the city. Health services must address extremes of affluenceand deprivation and differences of culture and race greater than anywhere else in the UK (King’sFund London Commission 1997 :13)
These issues of diversity have also been responded to by the relatively recent expansion of conferences andguidance literature, most notably under the auspices of the King’s Fund itself, the NHS Ethnic Health Unitand Department of Health, and the Royal Colleges, to inform the processes of purchasing andcommissioning for black and minority ethnic health (e.g. Office for Public Management 1996; NHS EHU
11
1996; McIver 1994; Gunaratnam 1993; Mohammed 1993; Hopkins & Bahl 1993). These highlight a seriesof issues, which while they may be also covering areas of general concern in purchasing (e.g. consultation,media of communication), are shown to have particular relevance and require particular attention in order tomake them appropriate to minority ethnic groups. Suggestions, for example, include the necessity forsingle sex meetings, outreach events in community centres, and the problems of overcoming a history ofnegative relationships between black and minority ethnic groups and authorities. In nearly all reports, keyrecommendations include information gathering relating to local black and minority ethnic groups and theirneeds, revision of record forms and procedures to facilitate ethnic record keeping and monitoring, andtraining of reception and professional staff in cultural or racism awareness. In very few cases is attentionpaid to the resource implications of these, but it must be assumed that given their authoritative sponsorship,these are ‘unavoidable’ costs.
There are a few other items of NHS expenditure which may be described as ‘ethnic-specific’, and for whichit is possible to derive costs, although in most cases we have found it impossible to obtain detailed or clearup-to-date estimates. The clearest example may be the additional or particular cost of conductinglaboratory tests to identify diseases which are not (commonly) associated with the native white population:such as the tests required to identify cases of the haemoglobinopathies associated with the minority ethnicpopulations. Certainly in the early years of black and minority settlement, there was some resistanceexpressed to the possibility of routinely screening blood from mothers or births in the African-Caribbeanpopulation, sometimes on the ground of cost. Subsequent research has demonstrated that the necessaryinvestigation can be conducted within the procedures used for routine testing conducted on the generalpopulation to identify cases of phenylketonuria, a condition rarely found in the minority population. It isimportant to note that this is not the only condition which demonstrates this kind of distribution - factor VLeiden, for example, is a carrier state which leads to an increased risk of deep vein thrombosis, and issignificantly more common among European (white) populations, notably those of Swedish origin (Sarasin,Bounameaux 1998). The effective cost of screening cord blood for sickle haemoglobinopathies was at thattime calculated at 30p/test, and the cost of using the ‘heel-tap’ blood for this screening was of the sameorder. (Henthorn J, Anionwu E, Brozovic M 1984). We have not attempted to include this small figure inour modelling.
The study was commissioned to inform the allocation of funds to Districts through the HCHS formula,which essentially refers to hospital and community costs, rather than the GMS monies which relate toGeneral Practitioner activity. Given the ‘independent contractor’ status of GPs, and lack of discussion inany of the literature previously reviewed regarding the ‘costs of ethnicity’ in primary care, we have notattempted to model or examine in any depth the possible unavoidable costs of service delivery throughGeneral Practice. We should note that there are likely to be similar issues at work in this sector, and thatthere is some evidence of differential rates of consultation between white and minority ethnic communities(Balarajan & Raleigh 1995; Yee 1997; Johnson- unpublished data for HEA). Although higher rates areattributed by some to ‘attendance with trivial complaints’ (Smaje 1995), this is disputed (Johnson 1986) andrecent data suggests that patient consultation rates for Black and Asian patients tend to be high for seriousconditions (McCormick et al 1990; 1996). Irrespective of these facts, there will also be at leastproportionate needs for interpreter and advocacy services, supply of female practitioners, and other mattersrelating to language and culture which affect hospital services in meeting the needs of minority ethnicgroups. On the other hand, ‘Jarman’ weightings of GP remuneration using deprivation scores do alreadyincorporate an element reflecting the well-established use by Department of Environment and Departmentof Health of ‘ethnic minority presence’ in those indicators. These do not however, cover the additional costsarising from the more transient presence of refugees, which were recently anecdotally reported to ‘represent5 per cent of my list and 30 per cent of my workload’ (Dr Skolar, Camden & Islington LMC, reported inGP magazine 9 Jan 1998 :20). Where we have encountered data which directly relate to primary-careprovision and ‘unavoidable costs’ relating to the ethnic composition of the population, we haveincorporated them in this review.
INTERPRETING and TRANSLATION
The general issue of ‘communication’ is a priority not only for minority groups, but across the healthservice, and has been highlighted by the Audit Commission (1993), amongst others. That reportdemonstrated clearly that good communication was valuable in terms of clinical outcomes and business

12
efficiency, and detailed the mechanisms and sites where communication was a critical issue. A number ofexamples are drawn from places such as ‘a hospital with a large non-English speaking population’, as wellas making reference to the needs of visually impaired and deaf people. A chapter is devoted to‘Communication with Non-English Speaking Patients’ but comments that ‘there is very little research’ inthis area. A review carried out for the West Midlands NHSE (Johnson 1996) located a significant numberof items, but again, none of these were costed, and few would have measured up to ‘gold standard’ researchevaluation. There is agreement that there should be more professionalism in the provision of interpretingservices, and that their availability is poor, but that some examples of ‘good practice’ can be identified. Aresearch study of these, including cost data, would be helpful for others seeking to develop their services.Useful data to feed into the needs assessment that should be associated with this can be located, includingresearch conducted by the Health Education Authority and for the Basic Skills Agency (Carr Hill et al1996). This latter provides a range of estimates of functional literacy in five minority linguistic groups(Bengali, Gujerati, Urdu, Punjabi and Chinese) and a variety of refugee groups (Bosnia, Tamil, Somali andKurd). One of the tests used was an estimate of the ability to read instructions on a medicine bottle. Morethan a third of non-UK-born (and non-UK educated) Bengali and Punjabi speakers were unable to meet thebasic test of completing their name and address on a library card application form. Nearly three out of fourof those born outside the UK were ‘below survival level’ - an argument for including birthplace in any datacollection and analysis related to ethnic minority group service provision. An appendix to that reportprovides a possible model for predicting interpreter provision need against census data.
Australian papers located (over the Internet) indicate that the Western Health Care Network budgetaryformula includes a ‘non-English speaking adjustment’, particularly in relation to the needs of the mentalhealth service, based on the fact that up to two thirds of the ‘NESB’ population may require interpretersupport, and longer consultations. British grey literature suggest that at least one third of Chinese patientsneed an interpreter.
Evidence relating to the use of interpreters is accumulating, and a recent study of interpreter availability inLondon across several services noted that the health service provision was relatively well developed(Stewart and Bartram 1996). An unsupported observation within that report suggested that medicalconsultations (across languages) without the use of a proper interpreter could take three or four times aslong, and result in a less satisfactory (effective) diagnosis and treatment. The same report noted that twoout of three NHS Trusts also provided interpreters for BSL (British Sign Language - used by those withhearing loss). Some cost data is provided, including the ‘set-up’ cost of a subscription to the telephone-based Language Line (at that time between £1,200 and around £2,000), but no detail of the overall cost perpatient or the amount of use made of that service on a ‘pay-per-minute’ basis. Other estimates of theadditional cost of interpreters suggest an extra 15% of consultation time or an additional 50%: this is anarea where research would be beneficial.
CLINICAL CONDITIONS: PREVALENCE AND COST
It is possible to identify a variety of clinical conditions considered to be potentially more or less prevalentin ethnic minority populations. Research and monitoring is continually increasing the number of diseasesfor which this can be stated. For example, standard text books refer to the fact that Systematic LupusErythematosis is more commonly found in the United States of America among Black women, and in the‘Far East’. No British ‘ethnic epidemiology’ of this disease can be identified as yet, but there is growinginterest (and concern) about the disease among the minority communities here. Since this report concernsitself with trying to establish the costs to the NHS arising because of a higher prevalence of certain healthproblems among ethnic minorities, we have concentrated in the scoping exercise on a limited number ofconditions where the evidence currently appears to be strongest on both cost and prevalence. The indexconditions are considered in greater depth, following a shorter review of evidence relating to otherconditions.
The original Health of the Nation white paper selected five key areas, and seventeen indicators, (includingten mortality indexes) for particular attention. Data for morbidity was not always available to distinguishbetween ‘ethnic’ groups, although there is a complex and well-established pattern of differences in respectof admission to hospital for mental illness. In terms of mortality, in each of the main areas, there weresignificant ‘ethnic’ differentials, although for the area of Cancer there was in general a lower incidence

13
(except for certain selected but relatively rare varieties) among most minority ethnic groups. Irish bornpersons, however, exhibited much higher rates of lung cancer and suicide. Particular attention was drawn toraised mortality from Coronary Heart Disease (CHD) amongst people ‘born in’ the Indian subcontinent,from Stroke amongst those born in Bangladesh, the Caribbean and (Commonwealth) Africa; and Suicide(amongst Indian-born people, but equally significantly rarer among those born elsewhere on thatsubcontinent). There was some suggestion, but relatively little satisfactory evidence, of ethnic variations inaccidents. It is however agreed that for purposes of planning service provision, it is more useful to payattention to specific conditions which may not directly be recorded as ‘cause of death’, or which may formpart of a complex leading to death - or to morbidity requiring intervention.
We therefore here review the evidence from the literature which relates to the prevalence of various typesof ill-health, including both infectious diseases, and ‘conditions’ which may relate to lifestyle or beinherited, and for which there appears to be evidence of distinct variation between one or more ethnicgroups. In some cases, the possibility of ethnic variance comes from reports located in the grey literaturesearch of this project. We begin with some conditions for which there is relatively speaking, less evidenceof relevance to the subject of this report - without implying that they are in any other sense ‘less important’.
Accidents
An early ‘classic’ study on (immigrant) ethnic minority health differentials was commissioned because ofan observation that immigrant workers appeared to be more susceptible to industrial accidents (Lee &Wrench 1980). Detailed investigation revealed that this was attributable to racially biased patterns ofemployment and work-place job allocation, rather than any inherent (unavoidable) characteristics of theminorities concerned (Wrench 1995). There remains some concern that there are similar differentials today,including a higher risk of Asian children’s involvement in traffic accidents, but these too may be explicablein ‘environmental’ (spatial and socio-economic) patterns of risk, rather than being specifically ‘ethnic’issues, except in an indirect sense. There is no clear evidence, despite a long-term study of the issue byRoSPA (pers. comm).
Attempted Suicide
There is a well established link between areas of deprivation and high rates of suicide: included in thesedata is an association between areas with high rates of settlement by people born outside the UK, and otherindicators of migration. We have not been able to identify references to rates of suicide among Blackgroups, but there is a repeated reference in the medical literature and less formal sources to problems ofsuicide and parasuicide among young Asian women in particular. Irrespective of the priority given to thisquestion in the Health of the Nation initiative, this is clearly an issue meriting serious intervention, butagain, no cost estimates, or even consideration as to whether this is a matter for NHS services or othersources of intervention, were identified.
Asthma
While there is some evidence that asthma may be provoked by migration, most notably from rural to urbansettings, there is no UK based survey data which indicates a clear ethnic variation in the prevalence (ortreatment) of this disease. However, it is clear that some communities (notably the South Asian) regard thisas a disease which they are unfamiliar with or blame on ‘British living conditions’, and they therefore mayrequire additional service input in terms of patients (and family) education (Sahara Project, Birmingham:unpublished study). The Doncaster health needs survey reported that Pakistani respondents were twice aslikely as the average (14% : 7% overall) to report having asthma.
Coronary Heart Disease and Hypertension
Over one in four deaths in Britain are attributable directly to CHD, and it is probably the commonest formof disease, as well as being to a large extent preventable. Direct NHS costs attributable to CHD have beenestimated at around £500 million annually, with another £10 million spent on preventive action (Langhamet al 1990). Very high levels of undetected heart disease are known to exist, so that there is no accurateestimation possible of incidence or prevalence. Best estimates are derived from mortality data, which show

14
that ‘Asian immigrants’ (i.e. those born in South Asia) display SMRs (Standardised Mortality ratios)around 120 - i.e. an excess of about 20% deaths in both men and women aged 20-70. Other estimatessuggest higher rates, particularly among diabetics (Chaturvedi & Fuller 1996). The pattern for those born inthe West Indies or other sources of ethnic minority migration does not show such a difference. At present,however, there is no good data for ‘ethnicity’, although in this case, given the age-related patterns, it maybe possible to accept birthplace as a suitable proxy for ethnic origin. A very high proportion of the costburden of CHD falls upon the general practitioner service, mostly through the cost of prescriptionmedicines. There is some evidence of a need for different patterns of prescribing, since ACE inhibitorshave been shown to be somewhat less effective in the control of hypertension in African-Caribbeanpatients. We have not located any economic data relevant to this question.
Cancers
In general, there seems to be a lower incidence of most forms of cancer among minority ethnic groups. Thereasons for this are unclear and may relate to environmental factors (exposure to trigger factors) as much asethnicity, although changes can be expected in the UK-born population as it ages. Certain forms of cancerrelated to diet and lifestyle (notably smoking and the chewing of paan - a mixture of areca nut, lime, betelpepper leaf and sometimes tobacco and spices) are associated with some South Asian population groups,and oral cancers are particularly more common among Bangladeshi people. These, however, may be seenas ‘lifestyle’ or behavioural rather than ‘ethnic’ and unavoidable variations - HEA interventions havealready been dedicated to bringing about a greater awareness of risk factors and change in these groups.Less explicable are reported excesses in Liver (SMR 910) and Gall Bladder (SMR 538) cancers amongBangladeshi men (Balarajan and Raleigh 1997). The same, relatively recent, data also show rather lowerthan expected rates of cancers among Bangladeshi women, in particular deaths from Breast (SMR 16) andCervical (SMR 51) cancers. Despite high smoking rates, Lung cancer SMRs for both Bengali men (SMR82) and women (SMR 54) are significantly lower than the national.
Dental Health
We have identified a small but growing literature relevant to dental health among minorities. It appears thatwhile there is a low level of service utilisation among older people of minority origin, there is growingconcern about their oral health - often related to gum diseases as much as dental caries, while levels ofdental caries among Asian children seem to be leading to a resurgence in health care need. There is someevidence that different approaches for preventive dentistry may be required among Asian populations (Holt1990; Bedi 1989).
Eye Disease
There is very little information relating to the use of ophthalmic services or eye disease amongst minorityethnic groups. A report in grey literature from Nottingham notes that a Leicester study found 24% of theSouth Asian population aged 40-49 had signs of cataract (rate for whites = 0) : at age 60+ 73% SouthAsians compared to 41% whites had this condition. Overall, Leicester data imply a six-fold increase invision problems among minorities. Diabetic retinopathy is slightly less common in South Asians.
Inflammatory Bowel Disease
While the search of medical literature failed to identify any published reference to this area of disease, theNottingham HNA notes that ulcerative colitis appeared to be twice as common among the S Asianpopulation; while coeliac disease is raised among Punjabi, compared to either white or Gujeratipopulations.
Mental health
Mental illness includes a wide variety of conditions and diagnoses, and is responded to with treatmentderiving from a number of sources, including both NHS and ‘joint finance’ as well as other non NHS costs.In addition to the input of social service departments with an interest in the topic, provision is also governedby the Mental Health Acts, which place certain powers and responsibilities on the criminal justice system.

15
There are well established patterns of ethnic differentiation in the experience of mental health and use oruptake of relevant services, recorded by both social science as well as medical researchers. In particular,these suggest an over-representation of people of African-Caribbean origin (and under-use by those ofSouth Asian background) as well as different patterns of experience within mental health services - notablyin respect of diagnoses of schizophrenia and paranoid psychoses and the use of more interventionist formsof treatment (restraint, drugs and electro-therapy) (see Ahmad, Sheldon & Stewart 1996; also Nazroo 1997,for a more detailed review of this literature). This is not the place to continue that debate nor to attempt toresolve the causes of these patterns. Because of the contested nature of diagnosis in this field (see Johnson1994, Halpern 1993), there are inherent difficulties in presenting definitive projections of prevalence. It isprobably certain that current recording has under-estimated the need for mental health services (based onobserved diagnosis) among British Asian populations (Williams et al 1997).
There is a paucity of data relating to the costing of mental health services, although a few recent papershave begun to address this question (cf Chisholm et al 1997). These do appear to indicate that there is anelement of cost which may be independently explained by ethnic group, after taking location and ‘provider’costs into account, although in statistical terms, only very small proportions of the variance can beattributed to ethnicity.
There are, however, certain aspects of mental health treatment which suggest that there should be particularattention paid to ethnic variation in the population. Diagnosis, and treatment, are peculiarly dependentupon communication (both in terms of direct language and cultural sensitivity to conceptual models andmetaphor) and hence questions of training and interpretation are particularly significant (Johnson 1996).Many Trusts employ specialist transcultural psychiatric nurses, who may legitimately be seen as an‘unavoidable cost’ - indeed, the Mental Health Act also requires Local Authorities to take explicit note ofethno-cultural differences and to have appropriately trained social workers available. The Australian studyof interpreters referred to earlier was conducted specifically because of the expectation that interpreterswould be required for those of ‘Non-English Speaking Backgrounds’ (NESB), and that the use ofinterpretation would have a direct impact on the length of the consultation. Unfortunately, beyond someanecdotal data in the survey of Districts (see above), we cannot locate any appropriate data on thedifferential cost of mental health services for minority population in Britain. We were, however, advised inclear terms during the fieldwork phase of the study that some Districts felt that they were considerablyaffected by the presence of significant numbers of African-Caribbean people in their area, and the tendencyfor people of this background to be referred to higher-security facilities, which had serious cost implicationsfor them. There are also clear implications of ‘ethnicity’ for the training of workers and the provision ofculturally, religiously appropriate and linguistically accessible information. We feel that this questionwould repay separate investigation.
Sexual health and HIV/AIDS-related disease
There is little evidence on the needs of minority groups for sexual health-related treatment, but papers havecaused controversy by drawing attention to the number of people from Africa attending for AIDS-relatedconditions. Some grey literature referred to the demands of overseas visitors, but these are generally not‘UK citizen’ minority ethnic patients, and should not be attributed to the same element of the cost formulae.Anecdotally, there appears to be a low uptake of many services, and additional costs have been incurred inoutreach and patient education programmes. This may be an area justifying further research despite itsdifficulties (Fenton, Johnson & Nicoll 1997).
Index Conditions: Literature on Prevalence and Cost
Literature was examined which related both to variations in prevalence and cost variation between one ormore ethnic groups. It has been pointed out that “There are two main ways of conducting cost of illnessstudies” (McGuire 1996). These include a ‘top down approach’ and a ‘bottom down approach.’ A ‘topdown’ approach combines aggregate data relating to variables such as mortality, hospital admissions, GPconsultations etc, and their associated costs in order to estimate the cost of illness. In contrast a ‘bottomdown’ approach combines data on disease incidence and prevalence with information on disease andtreatment probabilities and costs in order to estimate the cost of illness. As McGuire (1996) points out, a

16
major limitation of the ‘top down’ approach is that it may result in a misleading picture if the incidence of adisease is changing. We therefore attempted in the scoping exercise to utilise a ‘bottom down’ approach inorder to estimate the cost-of-illness arising as a result of an increased health burden upon the NHS due toethnicity. This involved examining the epidemiological evidence on variations in prevalence and anyevidence of differences in treatment requirements between ethnic groups, in order to estimate their impacton cost of illness. However in the light of the limitations of the available cost and epidemiological data inthe literature, this has proved to be problematic.
The ‘index’ conditions for which we were able to obtain most detailed data on prevalence and costs arereviewed below in order to assess whether there is sufficient information available to compile an indicativemodel.
i) Diabetes
Diabetes is a ‘group of disorders with common features’ with particular significance for the NHS, beingestimated to be responsible for around 5% of UK health expenditure (Laing and Williams 1989; Grimshaw1996). It includes a number of closely related but clinically distinguishable conditions: viz InsulinDependent Diabetes Mellitus (IDDM or Type 1), Non-Insulin Dependent Diabetes Mellitus (NIDDM orType 2), and Gestational Diabetes Mellitus (GDM). It can also be seen to be related to other disorders suchas hypertension, cerebrovascular and ischaemic heart disease. It is recognised that ‘the two populationcharacteristics which most strongly influence the numbers of people with diabetes are the age and sexstructure of the population and the ethnic mix of the population’ (Stevens and Raftery 1994 :33). Recentestimates of the burden of cost suggest that diabetic treatment represented some 8.7% of inpatient revenueexpenditure (Currie et al 1997), much due to the cost of treating vascular complications.
Epidemiological evidence: Evidence from an English study sheds some light upon the prevalence ofdiabetes amongst South Asian communities in Coventry. Screening for diabetes in an electoral ward inCoventry between December 1986 and April 1989 indicated (Simmons et al 1992) that the risk of Type 2diabetes amongst Asians is greater than amongst ‘Europeans’, and that the likelihood of having diabetesvaries by ethnic group. Findings demonstrated that that Gujerati Moslems had the highest age-adjustedprevalence per 1000 population of Type 2 diabetes (males: 160, females: 204) and that there was raisedprevalence in Punjabi Hindus (males: 113, females: 116).This compares with lower figures for otherPunjabi Sikhs (males: 89, females: 75); Pakistani Moslems (males: 91, females: 103); Gujerati Hindus(males: 84, females 88). (All of these prevalence rates fell within confidence intervals at the 95% level ofsignificance). This led Simmons to conclude that the higher prevalence of diabetes in these Asians groups(in spite of their dietary, cultural, and socio-economic diversity) suggests that predisposition to Type 2diabetes is inherited, although environmental factors may play a part.
Calculations based on the Simmonds (Coventry) study and other data produce the following prevalencesand risk ratios for Asian, African-Caribbean and ‘Europid’ (White) populations for combined Type 1 andType 2:
Prevalence of clinically diagnosed diabetes (Types 1 & 2) (Williams 1990 :48)
Age Group South Asian African-Caribbean
White RR (Asian) RR (A/C)
Male:20-39 15.5 6.2 1:2.540-59 82.0 26.7 1:3.160-79 172.7 46.3 1:3.745-74 245.3 18.5 1:13.3
Female:20-39 11.5 3.2 1:3.640-59 59.0 37.8 1:1.660-79 142.9 42.7 1:3.345-74 129.6 17.2 1:7.5

17
Some research (Burden et al 1992) identifies an increased incidence of End-Stage Renal Failure (ESRF)secondary to diabetes mellitus in Asian ethnic groups in the United Kingdom. The authors calculated theincidence of treated ESRF within the county of Leicestershire between 1979 and 1988, using a measure ofincidence known as person time at risk incidence. Patients of ‘ethnic’ (minority - i.e. Asian) origin had anincidence of ESRF of 486.6 (95% CI, 185.1 to 788.1) cases per million person years per year, comparedwith 35.6 (17 to 54.2) for White Caucasians. All the Asian patients had NIDDM. The authors point out thatthese findings indicate that ESRD in Asians “imparts significant public health implications for resourceplanning and allocation, and the need to initiate strategies to ameliorate renal disease in this ethnic group.”The issue of renal disease is discussed further below.
In another paper Simmonds (1992), assesses the prevalence of type 2 diabetes and its relationship to parity(childbearing). It is pointed out that Asians have a high prevalence of type 2 diabetes, which commences atan earlier age. Amongst ‘European’ women in the 30-64 years age group the prevalence of type 2 diabeteswas lower in women with 1-2 deliveries than amongst grand multiparous (parity 5) women, or nulliparouswomen. Amongst Asian women in the same age group (30-64 years) the prevalence of type 2 diabetes wasmuch higher, and especially high in women who had had 5 or more children. This would tend to suggestthat the burden upon the NHS due to type 2 diabetes might be especially high in Asian women who havehad a large number of children compared to European women. However as the paper gave no indication ofhow this might impact upon future treatment requirements we currently lack the information required toenable us to assess the excess costs to the NHS arising in Asian women having several children incomparison with ‘European’ women.
Other evidence (Koukkou et al 1995) suggests that within the catchment area of one Central Londonhospital (based upon a retrospective study of 703 women selected for screening for gestational diabetesmellitus (GDM)) the prevalence of GDM was around 2% overall, but Asians and Africans / Afro-Caribbeans had between 4 and 2 times more risk of having GDM relative to Caucasians (p<0.01). Theincreased incidence of GDM influenced the mode of delivery. GDM has also been associated with anincreased risk of perinatal and maternal morbidity (e.g. macrosomia) and an increased risk of developingdiabetes in the future. More detailed projections for specific ethnic groups are few, but Balarajan andRaleigh (1997) provide an estimate of mortality from Diabetes among Bangladeshi men at a very high level- SMR 685.
Treatment requirements: Gujral (1993) estimated the incidence of lower extremity amputation in Asians(patients were defined as of ethnic origin if they or their forefathers originated from the Indiansubcontinent) and compared it with the incidence of amputation amongst white Caucasians inLeicestershire during the period 1980-1985. After adjusting for age and sex the estimated population ofpatients requiring lower extremity amputation who were Asian with diabetes was estimated at 3.4 per10,000 population, compared with a much higher figure of 14.2 per 10,000 population amongst Caucasianwhites. Burden et al (1992) estimated that diabetes in patients of Asian origin is nearly fourteen times morelikely to lead to treatment for end stage renal failure (ESRF) than for white Caucasians (486.6:35.6cases).Clark et al (1993) also suggest that diabetes mellitus is more often a cause of end stage renal failurein Blacks than in Caucasians, although the relationship was not statistically significant (0.1> P> 0.05).
Koukkou et al (1995) clearly indicate that ethnic minorities have an increased likelihood of suffering fromGDM, which implies that alternative delivery methods will have to be deployed for some of this group ofethnic patients. The data presented do not state precisely what size effect might be expected.
Calculating the Cost of illness: Based on the above evidence, it is not unreasonable to assume that theincreased prevalence of diabetes amongst ethnic minorities will result in some additional costs to the NHS.However it is far from clear, based upon the evidence at our disposal, that this is necessarily the case at thegeneral population level. Whilst it may be true to say that ethnic minorities have a higher prevalence of type2 diabetes, there is some evidence to suggest that they may be less likely to suffer from certain types ofdiabetic complications. For example the findings of Gujral (1993) would seem to imply that the cost to theNHS arising because of amputation amongst ethnic minorities is likely to be lower than amongst themainstream population. That said there is evidence (reviewed in the Renal Failure section) to suggest thatethnic minorities do suffer from more end stage renal failure which is related to ethnicity. Evidence fromoverseas (Gulliford et al 1995) also indicates that diabetes may result in increased in-patient admissions to

18
the health care system due to a variety of other diabetic complications including admission forhyperglycaemia, cardiac problems, myocardial infarction, angina, stroke, and cataracts. Additional out-patient consultations may arise for a variety of other reasons including the need to monitor insulin levels,and to check for diabetic complications including diabetic retinopathy, diabetic nephropathy, diabeticneuropathy, and cardiovascular disease.
Attempts to track down cost literature in order to ascertain the additional costs to the NHS arising fromthese treatments have been largely unfruitful. The only recent United Kingdom information indicates thatthe cost per patient of visiting the outpatient department for screening for diabetic retinopathy is in theregion of £15.71 (Gillam et al 1995) per outpatient visit. It is, however, suggested that this condition isfound slightly less commonly among Asians than whites (Leicester and Nottingham grey literature).Another study (Koperski 1992) has costed the running of out-patient ‘Diabetes days’ at a General Practicein London (£58 per patient/year to the NHS). Given the specific needs and problems of compliance amongsome Asian populations, it may be that a similar approach (which has been suggested) would be appropriatein reaching ethnic minority patients, and so this cost data could also be relevant.
ii) Renal failure
Relatively good data are available on the costs and management of renal failure. Currently however, mostevidence is based on ‘predominantly white’ populations. Costs associated with end stage renal failure(ESRF) will depend on the modality (treatment method - CAPD, transplant, hospital haemodialysis etc)used - transplants being the most cost-effective in the long term. Among transplant co-ordinators, there isconsiderable concern because of low rates of organ donation from minority ethnic groups, which tend tohave distinctive patterns of tissue type - this may be another source of cost to the NHS, but has as yet notbeen properly explored.
NHSE Renal Purchasing Guidelines (1996), while at present still indicative, include (p31) allowance for theimpact of an ethnic minority presence: calculating the ‘expected acceptance rate’ for a transplant at around80/million population for an ‘entirely white population’ and 240/million for the proportion of thepopulation made up of Black and Asian minority ethnic groups. This adjustment is calculated in much thesame way as for age structure, and there is no suggestion made that there are any other costs specificallyassociated with ethnicity. It is recognised that ‘acceptance rates’ for treatment will rise further among Blackand Asian populations as their demographic profile ages (Beech et al 1994).
Epidemiological evidence: It has been reported that in the United States ethnic minority populations havehigher rates of ESRF for each of the 3 most important causes of ESRF including hypertension, diabetes,and glomerulonephritis (Feldman et al 1992). Findings relating to the Thames regions (Anon 1994) suggestthat take up of renal replacement therapy is higher amongst ethnic minorities in London than amongst thewhite population. The relative risk of ESRF in both the Black and Asian population compared to the whitepopulation was 2.8; furthermore age-sex specific ratios rose with age, to 4.0 for the black population and4.6 for the Asian population in older groups. It was concluded that “Whilst these findings could be partlyexplained by access factors (ethnic populations tend to live closer to renal units), to numerator anddenominator inaccuracies (including selective under enumeration), or to the method of ascription ofethnicity, it is probably mainly due to higher incidence of ESRF in these populations. Separate work isongoing to separate the effect of access from ethnicity.”
Other findings presented by Clark et al (1993) for the United Kingdom suggest that there is an increasedprevalence of dialysis-dependent renal failure in ethnic minority populations within the West Midlands.Using a sample of 1,038 adult patients with dialysis dependent renal failure treated between 1981 and 1991the authors reached the conclusion that in comparison with Caucasians a greater proportion of Asians(p<0.001) and Blacks (p<0.001) had ESRF. The relative risk of ESRF in Asians in comparison withCaucasians was 1.76 (95% CI 1.46 - 2.10), and for Blacks it was 1.76 (95% CI 1.39 - 2.20). AmongstAsians hypertension / vascular disease or tuberculosis were more frequent causes of end stage renal failurethan amongst Caucasians, whereas diabetes mellitus appeared to be a more common cause of end stagerenal failure amongst Blacks than amongst Asians or Caucasians, although this finding did not prove to bestatistically significant (0.1 > P > 0.05). Hypertension and Lupus (SLE) were also more common causes ofESRF among ‘Blacks’. The authors qualify their findings by suggesting that if “these data are confirmed by

19
prospective study they have implications for service provision”. Other UK evidence also suggests there is ahigher incidence of ESRF amongst minority groups. Evidence relating to Leicester (cited by Higgins et al1995) suggests that age adjusted annual incidences of end stage renal failure amongst UK Indo-Asians perannum were 123 and 115 per million population respectively, which compares with 43 and 21.5respectively for the White population.
Burden et al (1992) also cite UK evidence that implies that there is a higher incidence of ESRF secondaryto diabetes mellitus in ethnic groups in Leicestershire. The incidence of ESRF in Asian patients withdiabetes mellitus was 486.6 (95% Confidence Interval, 185.1 to 788.1) cases per million person years,which compares with 35.6 (17 to 54.2) in White Caucasians. Another (Thames region) study gave similarestimates of ethnic differentials amongst diabetics: - ESRF rates in the South Asian diabetic population1974-1988 were estimated at 420 per million compared to 53 in the white diabetic population, a factor of8:1, and demand for ESRF services was also higher in the non-diabetic Asian population (cited in greyliterature).
Treatment requirements: Roderick et al (1994) tried to determine the use of renal replacement therapy byethnic origin, and ascertain how provision of therapy varied with the distribution of ethnic minoritypopulations. To this end they analysed retrospective and cross sectional data from 19 renal units within theboundaries of the four old Thames Regional Health Authorities. Rates of acceptance for renal replacementtherapy (per million population) in 1991-2 were 61 for white people, 175 for black people, and 178 forAsians. The prevalence of renal replacement therapy per million were 351, 918, and 957 respectively. Itwas concluded that Black and Asian populations have a greater need for renal replacement therapy, and thatthe need for therapy increases with age. The authors claim that this has implications for the provision ofrenal services, and also for the management of diabetes mellitus and hypertension. Whilst this isundoubtedly true, it is less easy to establish the extent to which differences are related to a greater geneticsusceptibility to disease, or to other factors for example social and health care situations which lead topoorer compliance or poorer accessibility of adequate treatment for diabetes and hypertension (Pugh et al1995). In either case, the costs can be argued to be unavoidable and ethnic specific.
Boyle et al (1996) used a Poisson regression model in order to analyse the spatial distribution of all 539adult patients resident in South-West Wales (Dyfed and West Glamorgan) who started chronic renalreplacement therapy between April 1985 and March 1994. Findings suggested that there was a significantnegative relationship between referral rates and distance from the renal unit for patients aged over 60 butnot for younger patients even after controlling for other factors (patient age, population, distribution, socio-economic variables and ethnic group). The prevalence of renal replacement therapy rose from 128 to 454per million in Dyfed, and from 188 to 647 per million population in West Glamorgan, between 1985 and1995. This would indicate that the take up of renal replacement therapy amongst ethnic minorities mightwell be related to geographical proximity to a renal unit. This inevitably complicates any assessment ofresource needs for ethnic minorities.
Finally, there may be other treatment costs associated with the higher prevalence and treatment of end stagerenal disease amongst ethnic minorities. For example, Moran et al (1992) point out that Erythropoetintherapy has been demonstrated to be effective in treating anaemia in patients with ESRF but it wasassociated with higher costs of therapy. If this or other drug therapies are used in the UK they will entail anadditional treatment cost (between £35 and £70 weekly per patient on current BNF data).
Calculating the Cost of illness: Wight et al (1996) calculated that the cost of running a renal dialysisprogramme in Sheffield during 1999-2000 for 266 patients was £2.78 million. On this basis the cost perpatient for treatment of end stage renal failure are equivalent to £10,451; most sources consulted operatedon an estimate of around £10,000 per patient.
iii) Hepatitis C
There is some evidence that the prevalence of both hepatitis B and hepatitis C varies between ethnicgroups: in this review we have chosen to focus upon the latter.

20
Epidemiological evidence: Whilst there is some evidence that Hepatitis C Virus (HCV) infection may berelated to ethnic origin (Olynyk and Bacon 1995) our literature searches have failed to identify any goodepidemiological information which relates the incidence of hepatitis C to ethnic origin in England. Thatsaid, we have discovered that within South Africa the prevalence of Anti-HCV infection rates does appearto vary by ethnic group (Adewuyi 1996), which suggests that this may well also be the case in England.Moreover genotypes of Hepatitis C are ethnically related, indeed Olynyk and Bacon (1995) have identified6 important HCV genotypes. Genotypes 1a, 1b, 2, and 3 are broadly distributed genotypes most often foundin blood donors from the United States, Western Europe and Australia. Type 4 is widespread in Africa andhas been found in India, whilst type 5 is prevalent in South Africa and has been detected in the Netherlands.
Differences in the prevalence of hepatitis C and differences in the genotypes of hepatitis C amongst UnitedKingdom ethnic minorities may go some way towards explaining an observation that has been made(Mutimer 1995) that in England hepatitis C “is a rare cause of liver failure” whilst hepatitis C is a commoncause of liver failure for United Kingdom patients from the Indian subcontinent. It is unfortunate that welack sound English epidemiological evidence to verify this claim.
However one possible explanation for Mutimer’s observation is that ethnic minority hepatitis C patientswith cirrhosis may have a high degree of co-morbidity, because such patients have a high likelihood of alsohaving diabetes mellitus. An English survey (Allison et al 1994) compared patients with non-hepatitis Crelated liver cirrhosis with patients with hepatitis C related liver cirrhosis in a sample of livertransplantation patients. The analysis established a statistically significant link (p<0.0001) between hepatitisC virus infection and diabetes mellitus. Furthermore multiple regression analysis also demonstrated that aregressor relating to ethnic origin (Mediterranean or otherwise) had a statistically significant impact uponthe likelihood of an individual having hepatitis C. This implies that hepatitis C is more likely among ethnicminority populations and also more prevalent amongst patients with diabetes.
Treatment requirements: Evidence compiled in the United States suggests that once acquired, hepatitis C ispersistent and likely to induce chronic liver disease, leading to high treatment costs. Sharara et al (1996)suggest that as many as 80% of patients show evidence of chronic hepatitis, and between 20% and 35%develop cirrhosis. Unfortunately however it is unclear how much reliance could be placed upon theseestimates because as Olynyk and Bacon (1995) point out whilst it is known that hepatitis C can lead tocirrhosis, end-stage liver failure, and hepatocellular carcinoma, it is unclear just how frequently theseconditions arise, and there is controversy surrounding “which patients they can be expected to affect.” Ifthis is true of the mainstream population, it is even more likely to be true of ethnic minority populations.This means that determining the treatment requirements of minority populations based solely uponinformation from the literature is not possible at present.
We do know that, as Sharara et al (1996) point out, “currently no known drug can reproducibly eradicateHCV early in the stage of disease to prevent progression to end-stage liver disease.” Conventional drugtherapy involves the use of antiviral agents and immunomodulatory agents which are used in an attempt toalter viral replication and immune response. There is some evidence that different genotypes are associatedwith different degrees of responsiveness to treatment Olynyk and Bacon (1995). Furthermore in order totreat chronic hepatitis C, interferon alpha 2b (cost per dose £50 - £150) is sometimes used. Around 50% ofpatients initially respond to treatment (Sharara et al 1996), although relapse occurs in around 70% ofpatients. Despite these limitations some evidence (Dusheiko and Roberts 1995) suggests that treatment ofchronic hepatitis C using Interferon therapy is cost-effective from a societal perspective, in the UnitedStates. In the light of the relatively low cost per life year saved in the United States these findings are likelyto be generalisable to England. At present, however the drug is not licensed for this use in Britain.
Calculating the Cost of illness: Our examination of the available literature suggests that modelling the costof illness associated with increased prevalence of Hepatitis C amongst United Kingdom ethnic populationsis likely to prove difficult for a variety of reasons:
The paucity of good information relating to the incidence / prevalence of hepatitis C in England.
A lack of information on the probability of different ethnic groups advancing to chronic hepatitis C, andthen of advancing to end stage renal failure.

21
A lack of English cost information in the literature, relating to the costs associated with treatment forhepatitis C at these various different stages.
iv) Tuberculosis (TB)
There is a widely held assumption among health professionals that tuberculosis is a disease associated withminority ethnic groups - most specifically with those of South Asian origin. In practical terms, this resultsin the more-or-less automatic application of BCG vaccination to children born in this ethnic group(Pharoah, Watson & Sen 1996). A few reports were identified which stated this explicitly, and one of theDPH reports reviewed noted that:
‘Over 50% of cases of TB in Nottingham (1990-1995) were found among individuals with anethnic minority background’
Bakhshi, Hawker and Ali, further, conclude that ‘from about the second decade of the next century TB inthe UK will almost be entirely a problem of ethnic minorities ... even if new infection was eliminated nowin Asian people’. We were unable to locate any studies which explicitly costed the implications of thepolicy of vaccination, or any other associated costs, but this conclusion suggests that it might be cost-effective in terms of prevention.
Epidemiological evidence: MRCCEG (1992) surveyed all cases of TB notified to environmental healthmedical officers for a 6 month period beginning in January 1988. The notification rate in the whitepopulation was 4.7 / 100,000 per year (a decline of 7.2% per annum since 1978). In contrast the rate in thepopulation of Indian ethnic origin was 134.6 / 100,000 per year, whilst in the Pakistani or Bangladeshipopulation the figure was 100.5 /100,000 per year. In both the Pakistani and Bangladeshi populations therewas a decline of around 6% a year (since 1978) in the annual rate of notified disease. This epidemiologicalevidence suggests that there are major differences in the prevalence of disease between the white populationand certain ethnic groups. However in the light of the other major finding of this paper, namely that in 1988notification of TB infections in England and Wales had been falling for over a decade, we simply cannotextrapolate from such dated epidemiological evidence in order to provide up to date epidemiological datafor a cost of illness study. This is especially the case because it has been suggested (Houston and Fanning1994) that there has recently been a resurgence of TB infection in industrialised countries, which has beenassociated with the global epidemic of HIV infection. Some evidence based upon a national survey relatingto England and Wales confirms this. Bhatti et al (1995) found that between 1988 and 1992 notifications ofTB increased by 12%. Their evidence suggested that the national rise in TB affected only the poorest areas.Moreover the authors argue that local data pertaining to the London Borough of Hackney suggests thatsocio-economic factors are largely responsible for the increase in TB, and that recent immigration from anendemic area accounts for only a small proportion of the increase. This seems to be likely because ananalysis using data from London (Mangtani et al 1995) found that a variable reflecting the influence ofchanges in the proportion of migrants from New Commonwealth countries was not significantly related tothe rate of change in tuberculosis infection in London. Rates of unemployment were, however, significantlyrelated to changes in the level of TB infection. We would argue however that we need to careful how weinterpret this evidence because although changes in the level of TB may not be significantly related toethnicity, a good proportion of the underlying year on year levels of TB infection may be strongly related toethnicity. Some evidence which may be taken to support this proposition is presented by Harding et al(1995) who surveyed TB in Croydon between 1988 and 1991. Findings suggested that TB occurred morefrequently in those of Indian Sub-Continent (ISC) ethnic origin; of 222 cases presenting at a chest clinicover the period, 65% were of ISC origin, 22% were Caucasian, and 11% were Afro-Caribbean. ForBangladeshi men, Balarajan & Raleigh (1997) present an SMR (age-adjusted death rate) from TB of 422. InBirmingham, Bakhshi and colleagues (1997) present notification rates showing rates between 8.9/100,000(Caucasian) and 149.9 per hundred thousand, with some effect of ‘birthplace outside UK’ but a degree ofconfusion over the definitions of ethnic group in use.
Finally, a major national review of TB notifications was located which gives additional support to the‘ethnic patterning’ of this disease. Closer reading suggests that the key issue may not be ethnic origin butcountry of origin, since although South Asian (or ISC) patients made up over 40% of notifications, the rate

22
in this ethnic group has actually declined and ‘Forty nine per cent of patients had been born abroad and thehighest rates were seen in those who had recently arrived in this country’ (Kumar et al 1997). It isunderstood that contributory factors to the prevalence of the disease include poverty, the ‘HIV epidemic’and homelessness. Cases in the black Caribbean (formerly ‘West Indian’) ethnic group showed aconsiderable decline. Rates in South Asian people aged under 15 were not different to those of white orother ethnic groups, which may of course reflect the success of the vaccination programme. A significantincrease was noted in the Black African group, particularly those who had recently come to Britain.
Minority ethnic patients were about twice as likely to have non-respiratory forms of the disease. A slightlyhigher rate of resistance to drug treatment (isoniazid) was noted in minority ethnic cases, but those of southAsian origin were very much less likely to be HIV positive. Overall, the implications of this study are that‘ethnic origin’ data provide a poor estimate of the likely need for TB-related services, while ‘born outsideUK’ data may have some relevance.
Treatment requirements: Aber et al (1992) in addition to pointing out that some ethnic groups in Englandand Wales had a higher rate of TB infection, also pointed out that the type of TB varied by ethnic group.Amongst white patients 80% of patients had only respiratory disease, 16% of patients had only non-respiratory disease, and 4% had both, whereas amongst those of Indian subcontinent ethnic origin 53% hadonly respiratory disease, 36% had only non-respiratory disease, and 11% had both. A larger proportion ofpatients of Indian subcontinent origin had TB lymph nodes (both extrathoracic and intrathoracic) with 16%of those with respiratory disease, and 52% of those with non-respiratory TB having lymph node disease.Amongst white patients the figures were 2%, and 37% respectively. These figures imply that the treatmentcosts of patients with TB are often likely to be greater than amongst white patients.
Calculating the Cost of illness: Based upon the information currently at our disposal it appears thatmodelling the cost of illness associated with increased prevalence of TB amongst UK minority ethnicpopulations is likely to prove difficult for a variety of reasons:
A lack of up to date information on the likelihood of different types of tuberculosis in ethnic groups, andrelating to progression of the disease.
Little English cost information in the literature.
v) Stroke and Cardiovascular disease
Stroke is another condition which has major consequences for NHS resources, both in terms of immediatetreatment and in the use of subsequent services to support victims with resultant disability. It has beenestimated that, like diabetes, this condition also consumes about 5% of a District’s resources (Wade, inStevens & Raftery 1994). While there is some evidence of ethnic differences in circulatory disease, there isless clarity on the precise nature or direction of these. There is rather more information available on thebroader area of Coronary Heart Disease (CHD) than on Cardiovascular Disease (CVD) issues.
Epidemiological evidence: Knight et al (1992) assessed and compared the prevalence of established riskmarkers for ischaemic heart disease in a sample of Asian and non-Asian men (using a sample of 288 malemanual workers aged 20-65 in Bradford). Unfortunately the authors did not examine ethnic differences inthe actual prevalence of Cardiovascular disease so these findings are of little practical use for the purposesof the scoping exercise. Evidence from the United States however (Zweifler et al 1995) would seem tosuggest that ethnicity may be a risk factor for Stroke, and that ethnic minority populations are less prone tostroke than whites. The authors (Zweifler et al 1995) prospectively evaluated 542 consecutive patients (416whites, 77 Mexican Americans, and 55 Blacks). The findings suggested that whites had a higher proportionof transient ischaemic attacks (32% versus 18% and 17% for Blacks and Mexican Americans, respectively);there were no statistically significant differences between the groups in terms of prior stroke, hypertension,myocardial infarction, smoking, initial systolic blood pressure, serum cholesterol levels, and functionaldeficit. However, another paper emanating from the United States (Alter 1994) makes the observation thatfor the United States population as a whole a national survey suggests that “Blacks carry a disproportionateburden of strokes relative to the number of blacks in the population.” The author also suggests that whitesare more likely to suffer from large vessel and embolic strokes whereas blacks suffer a higher frequency of

23
small vessel and haemorrhagic stroke. The extent to which these findings are generalisable to the UnitedKingdom is unclear.
Evidence relating to the incidence or prevalence of circulatory system disease in the United Kingdomamongst ethnic populations has proved difficult to obtain, or has proved contradictory. Cruickshank, whohas researched the area extensively, suggests that while there is a ‘clear excess of stroke deaths’ for peopleof West Indian birth, (at 2-2.5 times the white rate: PMR 214), this is effectively cancelled-out by thedeficit in deaths from Ischaemic Heart Disease, when taking into account the raised levels of death fromhypertensive (PMR 627) and renal disease (PMR 233) (Cruickshank 1990). This is not however, as hepoints out, a reason for failing to tackle raised CVD morbidity, and so any additional cost of that activitymust be retained in the model. Among Asian populations, however, the mortality risk appears to be greatestfrom CHD (Ischaemic causes), which has been tied to the so-called ‘insulin-resistance’ effect - linked,therefore to action relating to diabetes. On the other hand, Balarajan and Raleigh (1997) have recentlyshown mortality rates among Bangladeshi men to be significantly raised in both CHD (SMR 148) and CVD(SMR 267), as well as from cirrhosis (SMR 254).
Treatment requirements: The treatment requirements of ethnic groups who have a stroke or cardiovasculardisease are difficult to define because of a lack of evidence on the prevalence of different types of strokeand cardiovascular disease in ethnic groups in England.
Calculating the Cost of illness: In the light of current information about the prevalence of various types ofstroke and cardiovascular disease in ethnic populations in England it is not possible at present to accuratelyassess any additional NHS costs that may arise because of higher prevalence in ethnic minorities.
The Haemoglobinopathies
Finally, in this section, we consider two conditions which are generally regarded as being effectively‘ethnic-specific’ diseases, in that they are ‘rare’ among the native White population of Britain, and havegenerally been discussed in the literature only in the context of ‘ethnic medicine’. Both labels cover anumber of forms of the diseases, and both are hereditary, genetically determined (recessive), so that a ‘trait’(carrier) state can be identified but the need for treatment is confined to the rarer homozygotic state. One,Thallassaemia, is most commonly associated with populations of South Asian and Mediterranean origin,while the other, Sickle Cell, is regarded as effectively a marker of the African diaspora, being found athigher rates among people of West African origin, and somewhat lower rates among those of West Indiandescent. It is important to note that cases of both have been observed in ‘white’ patients, and that with theincreasing patterns of inter-marriage, the association with phenotypical appearance and known familyhistory will be come more problematic.
The evidence for these two conditions is presented very briefly, having been extensively reviewed by theStanding Medical Advisory Committee and others. We would however note that in the grey literaturesurvey, we have found some suggestions that the estimates given may be lower than are found in practice(Streetly et al 1997).
vi) Thallassaemia
Epidemiological evidence: A report by the Centre for Reviews and Dissemination at the University of Yorksuggests that in England there are a projected 44 Thalassaemia affected births per year. Brent and HarrowHA estimated that they were responsible for the treatment of about 35 Thalassaemia Major cases.
Treatment requirements: Modell and Kuliev (1991) outlined what they then considered to be a fairlyaverage range of annual treatment / care required by a patient with Thalassaemia who presents to the UKNHS. They claim that such a patient is likely to require somewhere in the region of 12 transfusions, and 12out-patient visits, they will require drug therapy (mainly desferrioxamine + accessories), and annualinvestigations. In addition the costs of screening ethnic groups for Thalassaemia need to be assessed. Thereport by the University of York assumes that there are 500 people per year requiring treatment due toThalassaemia.

24
Calculating the Cost of illness: An assessment was made of approximate treatment costs associated withThalassaemia in the University of York report. Based upon an assumption of treatment costs per annum of£8,150, and a minimum life expectancy of 35 years, lifetime treatment costs per patient were £285,250.Based upon an assumption of there being 500 living patients the total annual treatment costs in 1995 wouldbe in the region of £4.1 million.
vii) Sickle cell
Epidemiological evidence: A report by the Centre for Reviews and Dissemination at the University of Yorksuggests that in England there are a projected 129 potential sickle cell affected births per year. Brent andHarrow estimated that there were about 350 people with the disease in their area, and eight births annuallywith the disease (150 with ‘trait’ - i.e. carrier status).
Treatment requirements: It was assumed that 5000 living patients per annum required treatment. Tables inthe reports cited indicate the distribution of these.
Calculating the Cost of illness: An assessment was made of the approximate treatment costs associatedwith sickle cell in the University of York report. Based upon an assumption of treatment costs per annum of£5,000, and a minimum life expectancy of 45 years, lifetime treatment costs per patient were £225,000.With 5000 patients requiring treatment, overall treatment costs in 1995 were in the region of £25 million.
OTHER SERVICE DELIVERY ISSUES
Culture and religion
Ethnic diversity creates a number of challenges to service providers. The Patient’s Charter set up a numberof expectations in respect of quality of care, and in ‘Standard 1’ made explicit reference to the need torespect cultural and religious beliefs. This has been used as a lever for change in a number of healthauthorities and trusts (cf Imtiaz and Johnson 1994) and clearly has cost implications. In the survey elementof this study, reference was made to the need to provide suitable religious support, and there has been somecorrespondence relating to the need for quiet rooms, mortuary or prayer space which is not dominated bythe symbols of the majority (Christian) religion and is suited to religious observance (and/or preparation ofthe dead) by other faiths. A major study of chaplaincy provision notes that there is considerable variation,and that the formally constituted Hospital Chaplaincy Commission has reviewed multi-faith provision, butapart from remarking on the lack of salaried or fee-supported staff, provides no useful cost data (Beckford& Gilliat 1996). Insofar as additional space may be required, there is the possibility of this having directresource implications, but in other senses, it may be that an increase in demand for ‘other faith’ chaplaincyservices will be counterbalanced by less work for those currently in post.
Diet
It is well established in ‘good practice’ literature that a variety of ethnic dietary patterns exist, and manyhealth districts and trusts reported making arrangements to provide these, having tested caterers productsfor acceptability, and also to translate or otherwise adapt menus. In one case, a pictorial menu was in use,although this might also have been useful for illiterate members of the majority community. Discussionswith relevant management staff did not lead to any conclusion as to the real costs of such changes. Whilecost has been given in the past as a reason for not making changes, none could provide precise details ofwhat these cost might be. We were advised that ‘UK patients have very varied dietary requirements’, andthat the ingredient or ‘food’ cost of the meal was probably the smallest element in terms of the overallcatering budget, compared to heat, transport, staff and indeed wastage. That said, there clearly is a notionalelement of variance involved in the provision of food to meet vegetarian, halal, and other dietarypreferences, although it may also be the case that some of these are cheaper to provide than the ‘standard’hospital menu. None of the sites contacted could indicate the proportion of meals served that came from the‘ethnic’ or ‘alternative’ menu.

25
Lifestyle
In addition to the ‘additional’ costs arising in the meeting of cultural requirements, it may be that there arelonger-term savings to the Health Service, at least in certain ethnic groups, arising from religio-culturalfactors in lifestyle. The prohibition on alcohol among Muslims (ignored by a few) is well known, as is theSikh avoidance of tobacco. Other aspects of minority diet such as traditionally higher intakes of fruit andvegetables, high fibre content, and possibly attitudes toward sexual intercourse, may prove to persist in UK-born descendants, and be ‘health-protective’. Therefore, it should not be assumed that ‘different’necessarily means either ‘more expensive’ or ‘worse’ in terms of Health Service resource use.
Refugees
The field of ‘refugee medicine’ is less developed in Britain than in some other areas of Europe, but there isincreasing awareness that this element of work requires special attention and provision (Johnson &Akinwolere 1997). Some health authorities contain very significant numbers of refugees, whose presence isnot recorded in the Census or any other formal datasets. It is clear that special additional services, such asthe use of bi-lingual counsellors trained in helping victims of torture and post-traumatic shock may berequired, as well as additional advice and information services, many of which may be available through‘third sector’ organisations such as the Refugee Council (and local groups). Camden and Islington HAestimates that there are 20,000 refugees in its area, and has recently provided such a counselling service.Such needs may also arise in non-metropolitan areas, such as Brighton where a research study wasidentified regarding the needs of refugee Copts (Elyas 1997 - grey literature).
Gender
A number of replies to the survey element of the study, as well as references in the research literature,indicate the additional demand for gender matching (mainly, but not exclusively, of female medical staff forfemale Asian patients - some males also indicated a preference for male nursing and personal care), arisingfrom the presence of minority ethnic groups. Insofar as this was frequently backed by reference to religiousrequirements, this could be regarded as an ‘unavoidable additional cost’. Costing of such additionalprovision is problematic.
Staffing
A more general issue is the question of the degree to which staff should represent or be drawn from, theminority ethnic makeup of the district in question. Good practice and the legislation would indicate thatoverall, there should be a measure of proportional representation, which could not be strictly seen as‘additional’ in cost terms. That said, there may be cost implications to recruitment and training, or theprovision of ‘supernumerary’ posts in order to ensure that there are staff with the necessary linguistic,cultural and other backgrounds or knowledge to ensure that service planning and provision is informed byethnic specific concerns and empathy. There are also clear implications for the provision of training in thesematters, for all staff and management.
Tissue Types
There is a growing literature on the differences in tissue type found in a society formed by migration.Chances of successful matching across ethnic groups are significantly reduced - but there have beenconsiderable difficulties in recruiting donors from minority groups - so that (grey literature) while 25% ofBirmingham waiting lists for kidney transplants are Asian, only 12% of matches, and 1% of donors, arefrom this group. Similar problems are reported by the Anthony Nolan Trust (bonemarrow) which has fewerthan 1,500 African-Caribbean and 4,000 Asian donors on its register of over 280,000 names. Costs areincreased for these services by the need to search for extra donors, to carry out complex matching, and tostore and cross-index additional types. Delays in matching may also place additional demands on otherservices (such as CAPD and hospital dialysis), which may over time be more costly. Cord blood and T-cells may also be used in treatment of haemoglobinopathy, and there may be other conditions with similarimplications (Mancheta 1997).

26
Population Demography
As is demonstrated in the data presented in Appendix H, the current demography of most minoritypopulations is significantly different from that of the white majority. In particular, they tend to be younger,with more children and fewer people in older age groups. Total population fertility (the numbers ofchildren in a family) has also historically been greater, although this is now changing to resemble moreclosely the UK average. While some of these factors may be accounted for by existing weightings in theHCHS formula, there may be scope to consider the effect of age, gender and fertility on costs if their effectsare different between ethnic groups. In particular, it has been argued that elders of minority ethnic groups‘age faster’ and may require greater intervention or additional services in future (Atkin & Rollings 1993).An alternative view may be that as people age and seek to retire, some of those who are migrants mayreturn to their countries of origin, thereby effectively ‘exporting’ the cost to the NHS.
REPORTS FROM DISTRICTS
Letters were sent to the Directors of Public Health in each of the English health districts, with a request thatthey send any data that might be relevant to this study, including if possible a copy of their annual report,and pass the enquiry to any specialist officers (see appendix C). Those failing to reply were sent a reminderletter. Of the 100 contacted, sixty replied, as did five of the regional offices of the NHS Executive. It wasnot necessarily those with the highest proportions of minority ethnic population that did reply, and severalwhich were known to have specific policy developments and activities did not respond. Information onthese was drawn from our own resource collection, when possible.
Most responding districts sent us a letter or replied by telephone and/or supplied copies of (extracts from)DPH reports. Significant numbers also submitted their ethnic minority health development policies, detailsof expenditure on specific projects or issues, and copies of locally conducted research. The most commonelement of replies was a Health Needs Assessment, frequently based on Balarajan & Soni Raleigh’sguidelines and applied to local (Census-based) population estimates. Many also gave lists of ethnicminority projects, frequently those supported by NHS EHU or other project funding, although few werefully costed in the material that we were sent. Details of the formal ‘grey literature’ reports, and someexamples of other information, are given in appendixes E and F.
Key issues highlighted in these documents and correspondence included:
Specific illnesses such as Sickle Cell Diseases, Diabetes etc (see elsewhere in this report for moredetailed discussion of these);
Ability to speak and read English, and various proposals to develop interpreter, language line or similarservices - sometimes related to other forms of disability;
Needs for specialist officers and access workers along with research and health needs assessment,including development of consultation and inputs to commissioning processes;
The need for staff training and the provision of local directories of resources and ethnic specificinformation;
The growing availability of ethnic monitoring data.
In addition, a selection of other matters were raised rather less frequently, but deserve consideration, orprovide additional insight into local needs and issues that should be incorporated in future service planningand costing:
Experience of racist incidents as a particular source of stress
The problems of disassociating ethnicity and deprivation using existing data
Over-representation in Maternity and mental health services

27
The costs of developing ethnic monitoring
Ethnic-specific health promotion work
Diet-specific provision (and the problem of getting data on its uptake)
The implication of S20 of the 1976 Race Relations Act (to avoid discrimination in service provision)
Prayer facilities
Single sex facilities
Equal Opportunity Quality Standards
Continuity of funding for ethnic health projects and staff
Port Health issues and follow-up of notification of refugee arrivals
Possible cultural variations in use of health services
Workload implications for GPs and facilities offering ‘culturally sensitive’ services
Rurality or the problem of reaching and serving small, dispersed groups.
Dental health
Administrative and management costs
Problems of registering (minority) donors (kidneys, bone marrow etc)
Finally, by no means the least significant of the comments we received was the need to take into account avariety of different ethnic groups, many of which cannot be identified from census or other routine data.Even when groups were named in the Census, it was often suggested that these estimates were inaccurate,usually underestimating current population numbers because of migration, population growth, or exclusionof locally significant groups which may have been subsumed under ‘other’ categories. Some aredifferentiated by religion, nationality or status, and some may not fall within the ‘conventional’ definitionsof ethnic minority. Others were ‘new’ groups. All, however, had been found locally to have specific needsand/or require particular attention in service development. Those listed included:
Irish Somali Yemeni Sudanese Copts Arabs Travellers/Gypsies/Romani Armenians ‘Muslim lifestyles’.
It was generally apparent that there was a consensus over the need to develop and fund specific health-related activity to meet the needs of minority ethnic groups, although it was accepted by some respondentsthat changes might not necessarily require additional funding, provided that effort and will was available tobring about reallocation of resources and change. However, only one reply appeared to directly contradictthe view that there were unavoidable additional issues, commenting that
the Jarman index ‘gives particular weight to the proportion of people from ethnic minorities. It iswidely felt that this is given too much weight’.

28
It appears from the context that it was felt that social deprivation as represented in locally available datawas not concentrated in the same areas as minority settlement. Another contribution also commented thatuse of Jarman weighting scores over-benefited London districts, and failed to take into account theadditional costs of developing and providing services in areas of relatively low minority concentration.
Sixteen (one in four) of the districts replying provided us with some financial data which was readilydistinguishable as related specifically to ethnic health care costs. There was very little consistency in this,and none covered all the issues mentioned. Frequently, data related to proposed extensions of existingservices (e.g. £200,000 for extension of translation and advocacy services: another district had an annualbudget of £7,000 which had been exceeded that year because of growing demand following publicity forthe service). East London and City HA had reviewed their costs in particular detail and were able to statethat provision for bilingual advocacy and interpretation exceeded £2,000,000. Other specific costs includedpost-traumatic stress counselling for refugees (KCW - £50,000 over two years), GP and communityinterpreting services (KCW £60,000 pa; Coventry £48,000 for community services; West Herts £125,000over five years; Bromley £5,500), and African-Caribbean mental health facilities (Birmingham £305,000;KCW £110,000 pa). Various projects were also mentioned, many part-funded by City Challenge, otherurban funds and NHS EHU grants. Many authorities set aside a small grants budget to support developmentprojects and health promotion activity (Birmingham £56,000; Bromley £12,000; Coventry £36,000 DiabeticHP work; KCW £168,000; Tees £24,000). It is not possible to link these data with service levels or the sizeof minority populations, or even to be sure that they cover all the costs of the services mentioned. Equally,not all of these amounts were charged to NHS budgets but ‘matching’ funding would only be releasedagainst NHS contributions.
DATA AVAILABILITY
It will be clear from the above discussion that analysis of the prime question of this study is severelyhandicapped by the absence of suitable data. We remain convinced that there are possibilities to overcomethis problem, through the analysis of routinely collected health service data, special datasets used formonitoring particular conditions, and other national data sources which have, or are in the process ofadopting, ethnic group categorisation as part of their scope. Frequently, reference is made to theexpectation that since April 1995, this has been a part of the cmds (contract minimum dataset) available toall ‘purchaser’ authorities from provider trusts on ‘inpatient’ episodes. It is equally clear that the standardsof recording of these data are poor, and that their reporting is virtually unknown. Several authorities,however, indicate their intention to move on this front, so that they believe they are now in a position tobegin analysis. In general, however, until or unless the NHSE and Department of Health make explicitdemands for reports based on the data, and implement sanctions for non-compliance, it is unlikely that thiswill be solved at a national level. That said, we have identified several sources which are sufficiently welldeveloped and may cover a large enough population to form a reliable basis for generalisation in future.
As part of the pre-feasibility element of our study, we requested a colleague to explore the degree to whichroutinely collected data in the (anonymised) HES dataset might be used to provide more concrete answersto some of our questions. Evaluation of more than one million consultant episodes (fces) recorded in theOxford Region for 1994/5, 95/6 and 96/97 demonstrated that there is no obstacle in principle to such ananalysis, although certain practical difficulties were encountered. It was, for example, possible to prepareanalyses which identified numbers of patients with long lengths of stay (‘bed-blockers’) or ‘frequentattenders’ (more than an average number of episodes) by age, gender and ethnicity; and to compare the agedistributions and length of stay by speciality, gender and ethnicity. A further exploratory analysisconsidered the proportions of patients in the nine different ethnic group categories recorded (essentially the‘OPCS 10’, except that ‘other’ groups were merged), by broad diagnostic groups, looking in particular atthe clinical conditions suggested by Modood et al (1997) as being particularly relevant to ‘ethnic health’.These are given in that volume as including Heart Disease, Hypertension, and Non-insulin dependentdiabetes. The authors also point out that data relating to mortality and morbidity are sometimescontradictory, perhaps due to poor data recording and non-equivalence of what is measured by proxyvariables such as place of birth and ‘ethnic group’, migration etc.
While it was possible to conduct these analyses, no particularly significant variations could be identified,and in any case findings would have been suspect due to deficiencies in the data. While there were data on

29
diagnosis and ethnic group, both of these contained very large amounts of ‘not known’ or ‘not recorded’codes, as many as 50% for ‘ethnic group’ and 30% for diagnoses. It was not possible to establish to extentto which such non-recording introduced bias into the analysis, but clearly it reduced the sample available toa large extent (e.g. to 35% if both ethnic group and diagnoses were required). It is possible that higherlevels of recording would be found in areas where the ethnic minority (and its needs) represent a moresignificant element of the service planning population, especially at a district level. District level data insuch cases should also contain a larger number of relevant variables, such as religion and use of interpreter.Furthermore. we were unable in the time available to obtain the requested information on health relatedgroups and costs from the National Case Mix Office at Winchester, to establish the relationship withresource utilisation. Any future study would need to use these, and obtain data from carefully selectedhealth districts which had a high level of quality in their ethnic group data recording. We understand thatseveral have achieved rates over 90%.
Several of the Districts and Trusts contacted in the survey responded in very positive terms. EalingHammersmith and Hounslow have begun work to address the issue of quality of coding, and are alsoplanning to include data on ethnic group and treatment in their coronary heart disease risk register, whichcovers around 120,000 people, and a newly established diabetes risk register covering 50 GP practices.Elsewhere in London, the St Mary’s information system has a reliable set of data incorporating ethnicmonitoring. The West Midlands Congenital Abnormality register and Perinatal Mortality datasets havegood recording of diagnostic data and code ethnic origin in terms of the 1991 census; some analyses haveproduced useful findings (e.g. in relation to neural tube defects and folic acid) but there have been someproblems in establishing a suitable denominator for the data. These problems could probably be overcomein the context of a research project with access to suitable demographic and statistical expertise. We alsounderstand that the Cancer Registry has some data which may be of value, and that the ConfidentialEnquiry into Stillbirths in infancy has routinely recorded ethnic origin of mothers since 1994. Some ethnicorigin denominator data would also be available from the regular national Labour Force Survey (albeit on asample basis), which also has some limited information on health status and use of services.
The overall result of our enquiries is that we believe that there do exist sufficient data to commence thecosting of service provision for minority ethnic groups, but that this will have to be pursued within selecteddistricts where the use of monitoring, and availability of disaggregated cost data, are best developed. It maynot be possible to explore all elements of our conceptual model, but by selecting key conditions, includingthose for which there may be evidence of lower costs associated with a large ethnic minority population,(such as the cancers), a robust estimate should be feasable. Many districts are clearly concerned about thesematters, and have begun their own internal consideration of them. Similarly, we have seen commissioningplans and other internal documents that could not be made publicly available because of confidentiality andcommercial sensitivity, but which indicate the existence of internal data which would be helpful to such ananalysis. This could be made available to a smaller-scale investigation based on district-level analyses,provided due safeguards were observed.
We finish by referring to the outcome of our scoping and modelling exercise, presented in Appendixes Aand B. This should perhaps be read in conjunction with the data in Appendix H and the schema inAppendix G, which spells out the information which would be needed in an ideal model, with a start madeon identification of its availability. In these, we have attempted to summarise the findings of the literaturereview regarding our ‘index conditions’, and to build these into a formula which takes account of thepositive and negative cost pressures created by ethnic diversity. The formula can be adapted to suit a varietyof additional conditions, including ‘social’ needs (e.g. including in ‘treatment’ cost staffing by specialist orbilingual workers such as trans-cultural psychiatric nurses). It also allows for the fact that generic ormajority services also have costs, and that these should be replaced (subtracted) rather than simply addedto. Further, approximations can be expected and allowed for, in terms of the variety of ‘ethnic terms’ in use,so that it may be necessary to use a single term for ‘South Asian’ groups, or to insert more specificweightings as they become available.
CONCLUSIONS AND RECOMMENDATIONS
It is clear that there are certain specific health service costs which are associated with the presence ofpopulations of minority ethnic origin. These range from the particular needs of groups for treatment of

30
medical conditions which are not generally found within the majority population, through the provision ofadditional services (e.g. interpreters) to enable or facilitate access to generic services, to more indirectinfluences on costs such as the ‘case mix’ related to ethnic specific patterns of disease morbidity, andperhaps even more indirectly, through the different demographies of minority communities (including theirmobility and the arrival of new groups in the form of refugee populations).
We were advised in one health authority that there was a perception that the high proportion of people fromethnic minority origins was reflected in a relatively high cost for provision of mental health services.Others referred to the significantly higher incidence of diabetes and diabetic-related complications, leadingto higher needs for such services as community chiropody. These latter two examples can be shown to fallwithin the ambit of elements of the cost-budget formula which does contain at least a notional weightingfor ‘ethnic minority’ presence, however flawed. We would therefore argue that there is a good case forconsidering the broader degree to which this principle might be extended or revised to take account of thefindings of this literature review, and the formula updated to utilise more appropriate and/or more sensitiveindicators of the population(s) ‘at risk’. We have appended tables and maps using 1991 Census data, toillustrate the way in which these data can be used for this.
In saying this, however, we do not wish to imply that ethnic minority populations are necessarily ‘morecostly’ to the NHS than the ‘white majority’ - or that any calculation should solely advantage health areasserving ‘inner city’ or ‘urban’ populations. While the greatest proportion of ethnic minority populations arelocated within the metropolitan areas, to a much greater extent than the population at large, there are clearlyparticular problems associated with responding to the specific needs of small minorities where there are no‘economies of scale’ to be gained. A case might be argued for a ‘flat-rate’ payment to cover the costs ofsetting up (and/or maintaining) a mechanism to identify and meet such needs. The following pointssummarise the key issues which appear to emerge from our study.
The presence of minorities is associated in general with a need for interpreter services which requirestaff additional to generic clinical and administrative provision. Some estimates of the scale of this needare available.
The use of interpreters has other implications, including not only office accommodation and translatedmaterials, but also training (including the training of medical personnel to use the service) and in termsof the length of the consultation. The precise nature of this needs to be established through UK-basedresearch.
In addition to interpreter services, access and subsequent compliance with treatment or clinicalrecommendations, including illness-preventive behaviours, may need to be enhanced by the provision ofadvocacy services with similar cost implications.
At a broader level there are budget implications arising from the need for additional mechanisms forconsultation with minority populations, to ensure suitable inputs to commissioning procedures. Thesemay include a need for additional local research projects and employment of liaison officers withspecialised skills or knowledge.
Minority populations do make demands for certain additional specific services not used by the bulk ofthe majority population: it is unclear to what extent the reverse can be stated. Examples of specialisedservices include those (clinical, scientific and social - e.g. counselling) required in respect of thehaemoglobinopathies. Cost estimates of these have been produced for SMAC and the NHS already.
There are very clear variations in the levels of need for certain other services - notably those relating todiabetes and renal care - which are closely and unavoidably linked to the ethnic make-up of thepopulation. Some of these have been established and are ‘allowed for’ in costing formulae; others arestill to be confirmed or relate to services over which there is some controversy (notably mental health).
Costs are not necessarily directly linked to the numbers of a minority present: there are certain ‘basic’ or‘set-up’ costs required irrespective of the total number of people ‘at risk’ - in a sense, there may be‘economies of scale’ for some of these.

31
Availability of specific (targeted) funds has led in many areas to the development of services which arerequired but were not previously available - once provided, they have become ‘unavoidable’ but couldnot have been made available without initial pump-priming.
A significant proportion of the above development, and other ‘ethnic specific’ services, have beenfunded out of ‘Joint Finance’ (local authority SSD-led), ‘section 11’ (Home Office) and/or SRB (urbanregeneration grant) monies, as well as the ethnic specific grants of the NHSE and Department of Health.
A number of recommendations can be seen to arise from the findings of the research reviewed in this study.Decisions regarding resource allocation are outside the scope of our remit, but we believe that we havedemonstrated the feasibility of developing a structured approach to the question, and that the informationrequired for informed decision making could be elicited, if required, through at least case study approaches.
There is a consensus that more research could and should be undertaken to establish the actual use ofservices by minority groups. Data are improving in quality, and such studies should be undertaken at anumber of districts to provide a comparative perspective and to incorporate the needs of a variety ofethnic minority groups.
Some attention should be given to the effects of ‘rurality’ and the cost of providing services to otherminority groups or groups for whom provision is problematic because of their dispersal and infrequency.
There is clearly scope for a modelling approach using such tools as decision analysis, which wouldallow consideration of the implications of variation in parameter estimates (e.g. prevalences) on theoverall additional costs.
The NHS R & D strategy, through the specialist responsibilities of the regional directorates, shouldexplicitly take on board the implications of ethnic diversity in planning future research priorities andprogrammes.
This review has shown that there are costs which can be seen to be unavoidable and additional, as well asothers which are desirable or alternative (such as, for example, provision of vegetarian meals oremployment of female consultants). The process of drawing attention to minority ethnic needs, and ofoffering resources, has itself led to developments of service, and it may also be shown that a significantnumber of these improvements are relevant and desirable to, the majority (‘generic’ or ‘white’) population.At the same time, our investigation suggests that there are elements of data collection and budgeting whichare absent. This not only hinders the answering of the research question posed here, but also implies aninability to justify some of the mainstream activity and thus meet the needs of the population at large.

32
Bibliography
Abel Smith B et al 1995 Choices in Health Policy - an agenda for the European Union Luxembourg: Office of theEuropean Union, & Aldershot: Dartmouth Publishing
Adewuyi JO 1996 ‘Prevalence of antibodies to hepatitis C virus among normal blood donors and multi-transfusedsickle-cell anaemia patients in Nigeria’ Trop-Doc.; 26: 29-30.
Ahmad WIU 1993 ‘Race’ and Health in Contemporary Britain Open UP
Ahmad WIU, Sheldon T, Stuart O 1996 Reviews of ethnicity and health York: NHS Centre for Reviews andDissemination
Allison MED, Wregitt T, Palmer CR, et al. 1994 ‘Evidence for a link between hepatitis C virus infection and diabetesmellitus in a cirrhotic population’ Journal of Hepatology.; 21: 1135-1139.
Alter M 1994 ‘Black-White differences in Stroke Frequency: Challenges for Research’ Neuroepidemiology. 13: 301-307.
Atkin K, Rollings J 1993 Community Care in Multi-Racial Britain - a critical review of the literature London:HMSO/SPRU
Audit Commission 1993 What Seems to be the Matter: Communication with non-English speaking patients London:HMSO
Azeem Majeed F, Cook DG, Hilton S 1995 ‘Annual night visiting rates in 129 general practices in one family healthservices authority: association with patient and general practice characteristics’ B J General Practice 45 :531-535
Bakhsi SS, Ali S 1995 ‘Knowledge, attitude and behaviour of TB patients’ Journal of Public Health Medicine 17(3):343-348.
Bakhshi SS, Hawker J, Ali S 1997 ‘The Epidemiology of Tuberculosis by Ethnic Group in Birmingham’ Ethnicity andHealth 2,3 :147-153
Balarajan R 1995 ‘Ethnicity and variations in the nation’s health’ Health Trends 27,4 :114-119
Balarajan R, Bulusu L, Adelstein AM, Shukla V 1984 ‘Patterns of mortality among migrants ... from the Indiansubcontinent’ BMJ 289 :1185-1187
Balarajan R, Soni Raleigh V, Yuen P 1991 ‘Hospital care among ethnic minorities in Britain’ Health Trends 23 :90-93
Balarajan R, Soni Raleigh V 1997 ‘Patterns of mortality among Bangladeshis in England and Wales’ Ethnicity andHealth 2,1-2 :5-12
Balarajan R, Soni Raleigh, V 1992 ‘The ethnic populations of England and Wales: the 1991 Census’ Health Trends24,4 :113-116
Balarajan R, Soni Raleigh, V 1993 Ethnicity and health: A Guide for the NHS London: Department of Health
Balarajan R, Yuen P, Soni Raleigh V 1989 ‘Ethnic differences in general practitioner consultations’ BMJ 299 :958-960
Baraka A, Haddock G, Roussis X, Leventis J, Fyfe AH 1994 ‘An audit of sickle cell screening in a paediatric hospitalpopulation’ Scottish Medical Journal 39,3 :84-84
Barker-Cummings, Mc Clellan W, Soucie M, et al. 1995 ‘Ethnic differences in the use of peritoneal dialysis as initialtreatment for end-stage renal disease’ JAMA. 274(23): 1858-1862.
Beckford J, Gilliat S 1996 The Church of England and other faiths in a multi-faith society Coventry: University ofWarwick Department of Sociology for Leverhulme Foundation and the National Synod of the Church of England
Bedi R 1989 ‘Ethnic indicators of dental health for young Asian schoolchildren resident in areas of multipledeprivation’ British Dental Journal 166 :331-334

33
Bedi R, McEwen M 1990 ‘Ethnic Minorities, health provision and the 1976 Race Relations Act’ Postgraduate MedicalJournal 66 (782) :1043-1046
Beech R, Gulliford M, Mays N, Melia J, Roderick P 1994 ‘Renal disease’ in Stevens & Raftery (Eds) :58-110
Berthoud R 1998 ‘Defining ethnic groups: origin or identity’ Patterns of Prejudice (in press)
Bhatt, C 1992 Aids and the Black Communities London: Black HIV/AIDS Network
Bhatti N, Law MR, Morris JK, et al. 1995 ‘Increasing incidence of tuberculosis in England and Wales: a study of likelycauses’. BMJ. 310: 967-969.
Bhopal R 1997 ‘Is research into ethnicity and health racist, unsound, or important science?’ BMJ 314 :1751-1756
Bhopal, R. S., Donaldson, L. J. 1988 'Health Education for Ethnic Minorities - current provision and future directions'Health Education Journal 47,4 :137-140
Bhopal RS, Kohli H, Rankin J 1997 ‘Editors Practice and Views on terminology in Ethnicity and Health research’Ethnicity and Health 2,3 :223-227
Bhopal RS, Phillimore P, Kohli HS 1991 ‘Inappropriate use of the term Asian - an obstacle to ethnicity and healthresearch’ Journal of Public Health Medicine 13,4 :244-246
Blinkhorn A S 1994 ‘The effect of changes in caries prevalence on oral health promotion - the United Kingdomexperience’ International Dental Journal 44,4 Supp 1 :439-443
Booth JCL, Brown JL, Thomas HC. 1995 The management of chronic hepatitis C virus infection Gut. 37: 449-454.
Borch-Johnsen K, Wenzel H, Viberti GC, Mogensen CE. 1993 ‘Is screening and intervention for microalbuminuriaworthwhile in patients with insulin dependent diabetes?’ BMJ 306: 1722-1725.
Bowen J, Yaste C 1994 ‘Effect of a stroke protocol on hospital costs of stroke patients’ Neurology 44: 1961-1964.
Boyle PJ, Kudlac H, Williams AJ. ‘Geographical variation in the referral of patients with chronic end stage renal failurefor renal replacement therapy’ Q-J-Med. 89: 151-157.
British Medical Journal 1996 ‘Ethnicity, race and culture: Guidelines for research, audit and publication’ BMJ 312:1094
Burden AC, Mc Nally PG, Feehally J, Walls J. ‘Increased incidence of end-stage renal failure secondary to diabetesmellitus in Asian ethnic groups in the United Kingdom’
Busch-Sorensen, Elphick AJ, Home PD, Thorsteinsson B 1195 ‘Diabetes Care: a guideline to the facilities needed tosupport Internationally endorsed standards’ Diabetic Medicine 12: 833-838.
Calman K 1992 On the State of the Public Health for the Year 1991 (Report of the Chief Medical Officer) London:Department of Health / HMSO
Carr Hill R, Passingham S, Wolf A, Kent N 1996 Lost Opportunities London: Basic Skills Aency
Chaturvedi N, Fuller JH 1996 ‘Ethnic differences in mortality from cardio-vascular disease in the UK: do they persistin people with diabetes’ Journal of Epidemiology and Community Health 50,2 :137-139
Chisholm D, Knapp M et al 1997 ‘Mental Health residential care study - predicting costs from resident characteristics’British Journal of Psychiatry 170 :37-42
Clark TJ, Richards NT, Adu D, Michael J 1993 ‘Increased prevalence of dialysis-dependent renal failure in ethnicminorities in the West Midlands’ Nephrology Dialysis Transplantion 8,2 :146-148
Connolly VM, Kesson CM 1996 ‘Socio-economic status and clustering of Cardio-vascular disease risk factors inDiabetic patients’ Diabetes-Care 19(5): 419-422.

34
Cowie CC 1993 ‘Diabetic renal disease: Racial and Ethnic differences from an Epidemiologic Perspective’Transplantation-Procs. 25(4): 2426-2430.
Cruickshank JK 1990 ‘Diabetes: contrasts between peoples of black (West African), Indian and white Europeanorigins’ in Ethnic factors in Health and Disease (Eds) Cruickshank JK and Beevers DG, London: Wright
Cruickshank JK, Beevers DG 1990 Ethnic factors in Health and Disease London: Wright
Currie CJ et al 1997 ‘NHS Acute sector expenditure for diabetes: the present, future and excess inpatient cost of care’Diabetic Medicine 14,8 :686-692
Davey PJ, Leeder SR 1993 ‘The cost of cost of illness studies’ Med-J-Australia 158: 583-584.
Diderichsen F, Varde E, Whitehead M 1997 ‘Resource allocation to health authorities: The quest for an equitableformula in Britain and Sweden’ BMJ 315 :875-878
Disney APS 1990 ‘Prescription and practice dialysis in Australia 1988’ Am-J-Kid-Dis. XV(5): 494-499.
Dornhorst A, Chan SP, Gelding SV, et al. 1992 ‘Ethnic differences in Insulin Secretion in women at risk of futureDiabetes’ Diabetic Medicine 9: 258-262.
Dornhurst A, Nicholls JSD, Welch A, et al. 1996 ‘Correcting for ethnicity when defining large for gestational ageinfants in diabetic pregnancies’ Diabetic Medicine 13: 226-231.
Drummond M, Davies L. 1994 ‘Economic evaluation of drugs in Peripheral Vascular Disease and Stroke. J-Cardiovascular Pharmacology’ 23(Suppl): S4-7.
Dugmore J 1991 ‘Language lessons’ Community Care 850 (7 Feb) :24-26
Dusheiko GM, Roberts JA. 1995 ‘Treatment of Chronic Type B and C Hepatitis with Interferon Alfa: An EconomicAppraisal’ Hepatology. 22(6): 1863-1873.
Facing up to Difference: A review of existing services from a black and minority groups perspective. 1996 CVSConsultants for Kensington & Chelsea and Westminster Health Authority.
Fassil, J. 1996 Primary health care for black and minority ethnic people: a consumer perspective Leeds: NHS EthnicHealth Unit.
Feder, G.S., Vaclavik, T. and Streetly, A. 1993 'Traveller Gypsies and Childhood Immunization: a study in EastLondon', British Journal of General Practice, 43(372): 281-84.
Feldman HI, Klag MJ, Chiapella AP. 1992 ‘End-stage renal disease in US minority groups’ Am-J-Kidney-Dis. XIX(5): 397-410.
Fenton K, Johnson AM, Nicoll A 1997 ‘Race ethnicity and sexual health’ BMJ 314 :1703-4
George S, Berth-Jones J, Graham-Brown RAC 1997 ‘A possible explanation for the increased referral of atopicdermatitis from the Asian community in Leicester’ British Journal of Dermatology 135,4 :494-497
Gillam SJ, Dunne H, Ball A, et al., 1995, Investigation of benefits and costs of an ophthalmic outreach clinic in generalpractice. British Journal of General Practice. Dec. 1995; 45; 649-652.
Gorelick PB. 1994 ‘Stroke Prevention: An opportunity for Efficient Utilisation of Health Care Resources During theComing Decade’ Stroke. 25(1): 220-224.
Graham B, McGregor K 1997 ‘What does a GP consultation cost?’ British Journal of General Practice 47 :170-172
Gray A, Fenn P, Mc Guire A 1995 ‘The cost of Insulin-dependent Diabetes Mellitus (IDDM) in England and Wales’Diabetic Medicine 12: 1068-1076.
Grimshaw, G 1996 ‘Diabetic services: the cost effectiveness of different models of provision’ INFACT report 6,CHESS

35
Gujral JS, Mc Nally BP, O’Mailey BP, Burden AC 1993 ’Ethnic differences in the incidence of lower extremityamputation secondary to Diabetes Mellitus’ Diabetic Medicine 10: 271-274.
Gulliford MC, Ariyanayagam-Baksh SM, Bickram L, et al. 1995 ‘Counting the cost of diabetic hospital admissionsfrom a Multi-ethnic population in Trinidad’ Diabetic Medicine 12: 1077-1085.
Gunaratnam Y 1993 Checklist: Health and Race London: King’s Fund
Hahn RA, Stroup DF 1994 ‘Race and Ethnicity in Public Health Surveillance - Criteria for the Scientific Use of SocialCategories’ Public Health Reports 109, 1 :7-15
Halpern D 1993 ‘Minorities and Mental health’ Social Science and Medicine 36,5 :597-607
Harding MJ, Pilkington P, Thomas J. 1995 Tuberculosis epidemiology in Croydon. Public Health 109: 251-257.
Harland JO, White M, Bhopal RS, Raybould S, Unwin NC, Alberti KGMM ‘Identifying Chinese populations in the UKfor epidemiological research: experience of a name analysis of the FHSA register’ Public Health 111 :331-337
Harris DT 1996 ‘Experience with autologous and allogenic cord blood banking’ Jnl Hematotherapy 5,2 :123-8
Hawthorne K. 1994 Accessibility and use of health care services in the British Asian Community. Family-Practice.11(4): 453-459.
HEA (Rudat K) 1994 Black and Minority Ethnic Groups in England: Health & Lifestyles London: Health EducationAuthority
Health Education Authority 1995 Locating the goalposts: health promotion and purchasing for black and minorityethnic health, Conference on improving health provision for black and minority ethnic communities, Health EducationAuthority.
Henthorn J, Anionwu E, Brozovic M 1984 ‘Screening cord blood for sickle haemoglobinopathies’ BMJ 289 (644) :479-480
Higgins RM, Dukes DC 1995 ‘End-stage renal failure in Indo-Asians’ Q-J-Med. 88: S23-524.
Hoare T 1996 ‘Breast Screening and minorities’ British Journal of Cancer Suppl. 29 S38-41
Holt RD 1990 ‘Caries in the pre-school child: British Trends’ Journal of Dentistry 18 :296-299
Hopkins A, Bahl V 1993 Access to health care for people from black and ethnic minorities London: Royal College ofPhysicians (Eds)
Houston S, Fanning A. 1994 Current and potential treatment of Tuberculosis. Drugs 48(5); 689-708.
Huth EJ 1995 ‘Identifying ethnicity in medical papers’ Ann. Int. Med. 122 :619-621
Imtiaz S, Johnson MRD 1993 Health Care provision and the Kashmiri population of Peterborough Peterborough RaceEquality Council and North West Anglia Health Authority
INFACT (Grimshaw J) 1996 Diabetic services: The cost effectiveness of different models of provision Coventry:Centre for Health Services Studies for NHSE
Jacobs J, Sena M, Fox N 1991 The Cost of hospitalisation for the late complications of Diabetes in the United States.Diabetic Medicine 8 Symposium: S23-29.
Jamdagni, L 1996 Purchasing for black populations King's Fund.
Jamerson K, De Quattro V 1996 ‘The impact of ethnicity on response to antihypertensive therapy’. Amer-J-Med. 101(suppl 3A): S22-S32.
Jesson J, Sadler S, Pocock R, Jepson M 1995 ‘Ethnic minority consumers of community pharmaceutical services’International Journal of Pharmacy Practice 3,3 :129-132

36
Johannesson M. 1996 ‘The cost-effectiveness of hypertension treatment in Sweden: an analysis of the criteria forintervention and the choice of drug treatment’. J-Hum-Hypertension. 10 (Suppl 2): S23-S26.
Johnson MRD 1996 Ethnic Minorities, Health & Communication Research Paper in Ethnic Relations 24, Centre forResearch in Ethnic Relations, Warwick University (for NHS Executive & West Midlands Regional Health Authority).
Johnson MRD 1996 Good Practice and Quality Indicators in Primary Health Care: Health Care for Black and MinorityEthnic People Leeds: NHS Ethnic Health Unit
Johnson MRD 1994 ‘Culture, Race and Discrimination’ in (eds) D Tantam, M Birchwood Psychology and SocialScience in Psychiatry London: Gaskell Press & Royal College of Psychiatrists :300-314
Johnson, MRD 1993 'Equal Opportunities in Service Delivery: Responses to a changing population?' in (ed) W I UAhmad :183-198
Johnson MRD 1986 ‘Inner city residents, Ethnic minorities and primary health care in the West Midlands’ in HealthRace and Ethnicity (Eds Rathwell T, Phillips D) Croom Helm, Beckenham, (pp192-211)
Johnson MRD 1984 ‘Ethnic minorities and health’ Journal of Royal College of Physicians, London 18 :228-230
Johnson MRD, Akinwolere A. 1997 Refugees and Access to Primary Health Care in the Midlands,- A Review ofEvidence from Literature and Professional Opinions Midlands Refugee Council & Sandwell Health, Coventry: CRERResearch Paper 25, 1997
Johnson MRD, Cross M, Cox B 1988 Black Welfare and Local Government: Section 11 and Social ServicesDepartments Policy Paper 12, Centre for Research in Ethnic Relations, Warwick University
Johnson MRD et al 1996 'Local Authority Occupational Therapy Services and Ethnic Minority Clients' British Journalof Occupational Therapy 59,3 :109-114
Jones, K & Smith, J 1971 Economic Costs of Commonwealth Immigration Cambridge NIESR.
Kahn KL. 1992 ‘How well does the patients burden of illness explain differences in outcome?’ Mayo-Clin-Proc. 67:1203-1205.
Kapasi, R. 1996 'Regional Black Health Commissioning Project', Share Newsletter, (13): 7-9.
Karmi G 1993 ‘Equity and health of ethnic minorities’ Quality in Health Care 2 :100-103
Kelleher D, Hillier S 1996 Researching cultural differences in health London: Routledge
Kellerman S, Tokars JI, Jarvis WR. 1997 ‘The cost of selected Tuberculosis control measures at hospitals with ahistory of Mycobacterium Tuberculosis outbreaks’ Infect-Cont-Hosp-Epidem 18: 542-547.
Kernohan E, 1996 ‘Evaluation of a pilot study for breast and cervical cancer screening with Bradford minority ethnicwomen - a community development approach 1991-1993’ B J Cancer 74 (Supp 29) :542-6
Knight T, Smith Z, Lockton JA, et al. 1993 ‘Ethnic differences in risk markers for heart disease in Bradford andimplications for preventive strategies’ J-Epidem-Comm-Health 47: 89-95.
Koperski M 1992 ‘Systematic care of diabetes patients in one general practice: how much does it cost?’ British Journalof General Practice 42 :370-372.
Koukkou E, Taub N, Jackson P, et al. 1995 ‘Difference in prevalence of gestational diabetes and perinatal outcome inan inner city multiethnic London population’ Eur-J-Obstet-Gynecol 59: 153-157.
Kumar D et al 1997 ‘Tuberculosis in England and Wales in 1993: results of a national survey’ Thorax 52 :1060-1087
Laing W, Williams DDR. Diabtetes: A Model for Health Care Management. Office of Health Economics, 1989;London, UK
Langham S, Normand C, Piercy J, Rose 1994 ‘Coronary Heart Disease’ in Stevens & Raftery (Eds) :341-378

37
Lee G, Wrench J 1980 ‘Accident-prone Immigrants: An assumption challenged’ Sociology 14,4
Leigh JP, Markowitz SB, Fahs M, et al. 1997 ‘Occupational Injury and Illness in the United States. Estimates of Costs,Morbidity, and Mortality’ Arch-Intern-Med 157: 1557-1568.
Linden SVD, Boers M. 1995 ‘A framework to classify burden of illness measures’ The-J-Rheumatol 22(6): 1185-1187.
Madhok R, Bhopal RS, Ramaiah RS 1992 ‘Quality of hospital service: a study comparing ‘Asian’ and ‘non-Asian’patients in Middlesborough’ Journal of Public Health Medicine 14,3 :271-279
Mancheta MP, Minford AMB, Parapia LA 1997 ‘Incidence of hereditary bleeding in Bradford UK: variation withethnic group’ Haemophilia 3,4 :292-294
Mangtani P, Jolley DJ, Watson JM, Rodrigues LC. 1995 Socio-economic deprivation and notification rates fortuberculosis in London during 1982-91. BMJ. 310: 963-966.
Marchant, C. 1994 'Heart to Heart', Community Care, (1005): 18.
Marmot, MG, Adselstein AM, Bulusu L., 1984 Immigrant Mortatlity in England and Wales 1970-1978 Studies onMedical and Population Subjects 47, London: OPCS/HMSO
McCormick A, Rosenbaum M 1990 Morbidity Statistics from General Practice - Third National study: Socio-economicanalysis London HMSO
McCormick A, Fleming D, Charlton J 1995 Morbidity Statistics from General Practice - Fourth national study 1991-1992 Series MB5, No. 3 London: Office of Population Censuses and Surveys
McGuire A., 1996 Economic analysis of diabetes. Journal of Diabetic Complications. May-June 1996; 10(3): 149-50.
McIver S, 1994 Obtaining the Views of Black Users of Health Services London: Kings Fund 1994.
McKee M 1997 ‘The health of Gypsies’ BMJ 315 :1172-1173
McKenzie K, Crowcroft NS 1996 ‘Describing race, ethnicity and culture in medical research’ BMJ 312 :1054
McKenzie K, Crowcroft NS 1994 ‘Race ethnicity culture and science’ BMJ 309 :286
Meadows P. 1995 ‘Variation of Diabetes Mellitus Prevalence in General Practice and its relation to deprivation’Diabetic Medicine 12: 696-700.
Mercey D et al 1996 ‘Voluntary universal antenatal HIV testing’ (Comment) B J Obst Gynae: 103,11 1129-1133.
Meredith SK, Nunn AJ, Byfield SP et al. 1992 ‘National survey of notifications of tuberculosis in England and Walesin 1988’ Thorax 47: 770-775.
Modell B, Kuliev AM 1991 ‘Services for Thalassaemia as a Model for Cost-Benefit Analysis of Genetic Services’ J-Inher-Metab-Dis. 14: 640-651.
Modood T et al 1997 Ethnic Minorities in Britain: Diversity and Disadvantage London: Policy Studies Institute
Mohammed S 1993 User Sensitive Purchasing London: Kings Fund.
Moran LJ, Carey P, Johnson CA. 1992 ‘Cost-effectiveness of epoetin alfa therapy for anaemia of end-stage renaldisease’ AJHP 49: 1451-1454.
Morgan M 1995 ‘The significance of ethnicity for Health Promotion: Patients use of anti-hypertensive drugs in InnerLondon’ International Journal of Epidemiology 24, S1 :79-S - 84
MRCCEG 1992 ‘National Survey of notifications of tuberculosis in England and Wales in 1998’ Thorax; 47: 770-775
Mutimer D. 1995 ‘Developments in hepatitis epidemiology: hepatitis C virus’ Brit-J-Hosp-Med. 54(10): 484-485.

38
NAHA 1988 Action Not Words Birmingham: National Association of Health Authorities
Nazroo JY 1997 The Health of Britain’s Ethnic Minorities London: Policy Studies Institute
Nazroo JY 1997 Ethnicity and Mental Health London: Policy Studies Institute
NHS Ethnic Health Unit (1996) Beyond the boundary: an action guide for health service purchasers - consultation andinvolvement. Health care for black and minority ethnic people NHS Ethnic Health Unit.
NHS Executive and Kings Fund (1995) 'Improving the health of ethnic minority communities', Purchasing Innovations(4): 1-4.
NHSE 1994 Report of the Health Care Strategy Unit review of Renal Services
NHSE 1996 Renal Purchasing Guidelines
NHSE 1997 HCHS Revenue Resource Allocation to Health Authorities: Weighted Capitation Formulas Leeds: NHSExecutive
NHS Executive (West Midlands) 1997 Commissioning Black Health NHSE(WM) and Public Management Associates
Office for Public Management (Rodrigues J) (1996) Responding to diversity: a study of commissioning issues and goodpractice in purchasing minority ethnic health,. London: OPM for Department of Health
Old J 1997 ‘Haemoglobinopathies’ Prenatal Diagnosis 16,13 :1181-1186
Olsson J, Nilsson S, Persson U, et al. 1994 ‘Comparison of excess costs of care and production losses because ofmorbidity in Diabetic patients’ Diabetes-Care 17(11): 1257-1263.
Olynyk JK, and Bacon BR. 1995 ‘Hepatitis C: Recent advances in understanding and management’ Postgrad-Med.98(1): 79-92.
Ostrowsky JT, Lippman A, Scriver CR 1985 ‘Cost Benefit of a Thalassaemia Disease Prevention Program’ AmericanJournal of Public Health 75,7 :732-736
Pearson M 1991 ‘Ethnic differences in infant health’ Archives of Disease in Childhood 661,1 :88-90
Petrou M, Brugiatella M, Ward RHT, Modell B. 1992 ‘Factors affecting the uptake of prenatal diagnosis for sickle celldisease’. J-Med-Genet. 29: 820-823.
Pharoah PD, Watson JM, Sen S 1996 ‘Selective or universal neonatal BCG immunisation - what policy for a districtwith high incidence of TB’ Public Health 110,3 :179-183
Pizarro, R 1992 'Contracting Health Interpreting Services: the experience in South East London', Kings Fund ShareNewsletter, (4): 5-6, 8.
Polednak AP 1989 Racial and ethnic differences in disease Oxford UP
Pringle M, Rothera I 1996 ‘Comment on practicality of general practice based ethnic monitoring’ BMJ 312 :1054
Pugh JA, Medina R, Ramirez M. 1993 ‘Comparison of the course to end-stage renal disease of Type 1 (insulin-dependent) and type 2 (non-insulin dependent) diabetic nephropathy’. Diabetologia. 36: 1094-1098.
Pugh JA, Medina RA, Cornell JC, and Basu S. 1995 ‘NIDDM Is the Major cause of diabetic end-stage renal disease’.Diabetes. 44: 1375-1380.
Pugh JA, Tuley MR, Basu S. 1994 ‘Survival among Mexican-Americans, Non-Hispanic whites, and African-Americans with end-stage renal disease: The emergence of a minority pattern of increased incidence and prolongedsurvival’. Am-J-Kid-Dis. 23(6): 803-807
Rasell E, Bernstein J 1995 ‘An assessment of health care expenditures within and across racial and ethnic groups’American Economic Review 85,2 :127-131 (ILL)

39
Rashid A, Jagger C, Goodyear L 1996 ‘Views of Asians and non-Asians on sources of drug information and thedesirability for medication to be made available over the counter’ British Journal of General Practice 46,411 :609-610
Rathwell T 1984 ‘General Practice, Ethnicity and Health Services Delivery’ Social Science and Medicine 19,2 :123-130
Rettig RA. 1996 ‘The Social Contracts and the Treatment of Permanent Kidney Failure’ JAMA. 275: 1123-1126.
Rice DP 1994 Cost-of-illness studies: fact or fiction? Lancet 344: 1519-1520.
Ritch AES, Ehtisham M, Guthrie S, Talbot JM, Luck M, Tinsley RN 1996 ‘Ethnic Influence on Health and dependencyof elderly inner city residents’ Journal of the Royal College of Physicians of London 30,3 :215-220
Roderick PJ, Jones I, Mc Geown M, Mallick N 1994 ‘Population need for renal replacement therapy in Thamesregions: ethnic dimension’ BMJ. 309: 1111-1114.
Sacco RL, Kargman DE, Gu Q, et al. 1995 ‘Race-Ethnicity and Determinants of Intracranial Atherosclerotic CerebralInfarction’ Stroke 26(1): 14-20.
Sarasin FP, Bounameaux H 1998 ‘Decision analysis model of prolonged oral anticoaculant treatment in factor VLeiden carriers with first episode of deep vein thrombosis’ BMJ 316 :95-99
Scally G 1997 ‘The Use or uselessness of annual public health reports’ BMJ 315 :1173-1174
Senior P, Bhopal RS 1994 ‘Ethnicity as a variable in epidemiological research’ BMJ 309 :327-329
Seymour CA. 1994 ‘Asymptomatic infection with hepatitis C virus’ BMJ. 308; 670-671.
Sharara AI, Hunt CM, Hamiliton JD. 1996 ‘Hepatitis C’. Ann-Intern-Med. 125: 658-668.
Sheldon TA, Parker H 1992 ‘For Debate- Race and Ethnicity in health research’ Journal of Public Health Medicine14,2 :104-110
Sherr L, Barnes J, Elford J, Olaitan A, Miller R, Johnson M 1997 ‘Women with HIV disease attending a London clinic’Genito-Urinary Medicine 73, 4 :274-279
Simmons D, Williams DRR, Powell MJ. 1992 ‘Prevalence of Diabetes in different Regional and Religious South AsianCommunities in Coventry’. Diabetic Medicine 9: 428-431.
Simmons D. 1992 ‘Parity, Ethnic group, and the Prevalence of Type 2 Diabetes: The Coventry Diabetes Study’Diabetic Medicine 9: 706-709.
Smaje C 1995 Race ethnicity and health London: King’s Fund Inst.
Smaje C 1995 ‘Ethnic residential concentration and health: evidence for a positive effect?’ Policy and Politics 23, 3:251-269
Spencer N 1996 ‘Race and ethnicity as determinants of child health: a personal view’ Child: care, health anddevelopment 22,5 :327-345
Standing Medical Advisory Committee 1994 Report of Working Party on Sickle Cell, Thalassaemia and otherHaemoglobinopahies London: Department of Health
Stevens A, Raftery J 1994 Health Care Needs Assessment (Vols 1 & 2) Oxford: Radcliffe (Eds)
Stewart P, Bartram M 1996 Now We’re Talking London: Consumer Congress Trust
Streetly A, Grant C, Bickler G, et al. 1994 ‘Variation in coverage by ethnic group of neonatal (Guthrie) screeningprogramme in South London’. BMJ. 309: 372-374.
Streetly A, Maxwell K, Mejia A 1997 The Fair Shares for London Report: Sickle Cell Disorders in Greater London - ANeeds Assessment of Screening and Care Services London: Dept of Public Health Medicine, UMDS/ OSCAR Trust/Greenwich & Bexley HA

40
Sundquist J, Johansson SE 1997 ‘The influence of country of birth on mortality from all causes and cardio-vasculardisease in Sweden 1979-1993’ International Journal of Epidemiology 26,2 :279-287
Taub NA, Wolfe CDA, Richardson E, Burney PGJ. 1994 ‘Predicting the disability of first-time Stroke sufferers at 1year’. Stroke. 25(2): 352-307.
Thomas, C.S. et al. 1993 'Psychiatric morbidity and Compulsory Admissions among UK-born Europeans, Afro-Caribbeans and Asians in Central Manchester', British Journal of Psychiatry, 163: 91-9.
Thornicroft, G. and Strathdee, G. 1996 Commissioning Mental Health Services, HMSO.
Tomlin Z 1994 ‘Lost for Words’ Health Service Journal 25 August :12
Tsevat J, Wong JB, Pauker SG, et al. 1991 ‘Neonatal screening for sickle cell disease: A cost-effectiveness analysis’The-J-Paediatrics. 118: 546-54.
West Midlands Regional Office (NHSE) 1997 Commissioning black health: a report on the West Midlands RegionalOffice project on purchasing healthcare for black and minority ethnic communities, Public Management Associates.
Wight J, Olliver A, and Payne N. 1996 ‘A computer model for predicting the demand for end-stage renal failure(ESRF) treatment, contract setting and monitoring’. Nephrol-Dial-Transplant. 11: 1286-1291.
Wild SH, Fortmann SP, Varady AA, et al. 1995 ‘Mortality from Coronary Heart Disease and Stroke for Six EthnicGroups in California, 1985 to 1990’ AEP. 5(6): 432-439.
Williams DR 1996 ‘Race/ethnicity and socio-economic status: Measurement and methodological issues’ InternationalJournal of Health Services 26,3 :483-506
Williams R 1994 ‘Diabetes’ in Stevens & Raftery (Eds) :31-57
Williams R, Eley S, Hunt K, Bhatt S 1997 ‘Has psychological distress among UK South Asians been underestimated?’Ethnicity and Health 2,1-2 :21-29
Wilson N, Baker M 1996 ‘Acute Hepatitis B resulting in Hospitalisation in NZ’ New Zealand Med Jnl 109 :150-151
Wolfe CD, Taub NA et al 1995 ‘Variations in the incidence, management and outcome of stroke in residents under theage of 75 in two health districts of southern England’ J Pub H Med 17,4 :411-418
Wrench J 1995 ‘Racism and occupational health and safety’ Labour Studies Working Paper 7 Coventry: Centre forComparative Labour studies, University of Warwick
Yang Y, Shah AK, Watson M, Mankad VN. 1995 ‘Comparison of costs to the health sector of comprehensive andepisodic health care for Sickle cell disease patients’. Pub-Health-Reports. 110(1): 80-86.
Yee L 1997 Breaking Barriers: Towards culturally competent clinical practice London: Royal College of GeneralPractitioners
Young C 1994 ‘Health and Welfare of immigrants and access to services in Australia’ Scandinavian Journal of SocialWelfare 3,3 :121-132
Zweifler RM, Lyden PD, Taft B, et al. 1995 ‘Impact of Race and Ethnicity on Ischaemic Stroke’. Stroke. 26(2): 245-248.

41
Useful WWW sites:
http://www.ens.gu.edu.au/eberhard/vl/top/top~ethn.htm
Australian multicultural mental health development activity
http://hna.ffh.vic.gov.au/ceh/Welcome.html
Australian multicultural health development activity
http://www.fwfs.com/healthda.htm
American site listing estimates of ethnic groups and health-related data

42
Selected (Cited) Research Projects and similar Grey Material
Accounting for Diversity: The case for recognising Cultural diversity in the resource allocation process (G Leahy,ELCHA 1997)
Cruickshank J 1993 ‘The challenge for the AfroCaribbean Community of Controlling Stroke and Hypertension’ Paperfor HEA Meeting and NTRHA Health & Ethnicity programme
Doncaster (nd) The Health of Doncaster’s Black and Minority Ethnic Communities Doncaster Health (Singh P,O’Farrell P, Harkins D: ~1996)
ELCHA 1997 Review of Health Advocacy and Interpretation Services 1997/8 East London & The City HealthAuthority
HCSU 1994 Report of the Health Care Strategy Unit Review of Renal Services: Part II: Evidence for the Review.
Kensington and Chelsea and Westminster Commissioning Agency, (1994) Health Commissioning Intentions 1995/96:consultation document, KCWHCA.
NHSE North Thames - project funding application: The costs and consequences of bilingual healthadvocacy/interpretation services (no date or origin: ELCHA)
NHSE South Thames - project funding application: Prevalence and correlates of cardiovascular risk factors in SouthLondon (F Cappuccio, SGHMS)
NHSE South Thames - project funding application: Study of non-steroidal and anti-inflammatory drug related gastro-internal side effects in the African-Caribbean population (T Mahmud, KCH)
NHSE South Thames - project funding application: Prmary health care services for children from minority ethnicgroups (S Arber, U Surrey)
NHSE South Thames - project funding application: Care in the last year of life: A comparison of Black Afro-Caribbeanand White populations of South London (I Higginson, KCH/ St Christopher’s Hospice)
NHSE South Thames - project funding application: Oral health needs, attitudes, barriers to care and provision ofservices to people of ethnic minority groups resident in South Thames region (S Gilbert, KCH Dental Dept)
Rankin J, Bhopal R, Wallace B - Factors influencing heart disease and diabetes in South Asians: The South Tynesideheart study. Gateshead/South Tyne HA & University of Newcastle
Western Health Care Network (Australia) 1997 A Proposed Budget Strategy for Funding Ethnic Mental HealthServices Melbourne: Victorian Transcultural Psychiatry Unit
(see also Appendix F)

43
Appendix A: Summary of main findings regarding ‘Index’ conditions
Disease area Epidemiologicalinformation
Treatment Cost
Diabetes Some: Limitedinformation is availablealthough there isevidence that there is ahigher prevalence ofType 2 diabetes(NIDDM) (Simmons etal 1992) and GestationalDiabetes Mellitus(Koukkou et al 1995) inSouth Asian ethnicgroups
Lack of information: Treatmentrequirements may include:Hyperglycaemia, Amputation,Cardiac problems, (MyocardialInfarction, Angina), Stroke andCataracts, for Type 1 or Type 2diabetes The increased /decreased risk of theseconditions in ethnic minoritiesneeds to be established for both(Type 1) and NIDDM (Type 2)(End Stage Renal failure isconsidered in the formulaseparately). Limitedinformation on the treatment ofGDM is however available(Koukou et al 1995)
Lack of information: There isa general lack of recent UKcost information
Hepatitis C Lack of information:There is only anecdotalor overseas evidence(Multimer 1995)although there is everyreason to assume thatrates of Hepatitis Cinfection are higheramongst ethnicminorities (Adewuyi1996)
Lack of information: Treatmentrequirements may includetreatment for Cirrhosis, EndStage Renal Failure, andHepatocellular Carcinoma,amongst others. There is a lackof robust UK information onthe requirements of variousforms of treatment followingHepatitis C infection
Lack of information: There isa lack of UK cost information
Renal Failure Some: There is UKevidence of increasedrenal failure in ethnicminority population(Clark et al 1993;Higgins et al 1995;Burden et al 1992)
Some: Evidence suggests thatthere is a higher rate ofacceptance for renalreplacement therapy amongstethnic minorities (Roderick etal 1994)
Some: For end stage renalfailure. The cost per patient in1999-2000 who is treated forend stage renal failure isequivalent to £10,451 perannum. Information on lifeexpectancy andepidemiological data requiredfor full costing.(Wight et al 1996)
Tuberculosis Some: Information isavailable (Aber et al1992) and Bhatti et al(1995). However, theinformation is a bitdated, or not stated in asuitable form to be usedto calculate the Cost ofIllness
Some: Aber et al (1992) pointout that amongst White patients80% had respiratory disease,16% had only non-respiratorydisease, and 4% had both,whereas amongst those ofIndian subcontinent origin 53%had only respiratory disease,36% had only non-respiratorydisease, and 11% had both. Theprobabilities of requiringvarious forms of treatmenthowever need to be assessed
Lack of good information:There is a lack of good costinformation
Stroke orCardiovascularDisease
Lack of information:There is no adequate UKevidence. Moreoveroverseas evidence isconflicting in relation tothe burden of Strokes inethnic minoritypopulations (Zweifler et
Lack of information: There isan absence of informationrelating to the probability ofethnic minorities requiringtreatment
Lack of information: There isa lack of good costinformation

44
al 1995; Alter 1994).There is a general lackof epidemiologicalevidence relating toCardiovascular Disease.
Thalassaemia Yes: A report by theUniversity of York’sCentre for Reviews andDissemination points outthat there are on average44 Thalassaemiaaffected births per yearor 500 people requiringtreatment at any onetime.
Some: It is estimated that 500patients per annum will requiretreatment due to Thalassaemia
Yes: The overall costsassociated with treatingThalassaemia patients areoutlined. Based upon anassumption of treatment costsof £8,150 per annum and aminimum life expectancy of35 years lifetime treatmentcosts per patient were£285,250. Assuming thatthere are 500 living patientstotal annual treatment costswould be in the region of £4.1million
Sickle Cell Yes: A report by theUniversity of York’sCentre for Reviews andDissemination points outthat there are on average129 potential affectedSickle cell births perannum, or 5000 peoplerequiring treatment atany one time
Some: It is estimated that 5000patients per annum will requiretreatment due to Sickle cell
Yes: The overall costsassociated with treatingThalassaemia patients areoutlined. Based upon anassumption of treatment costsof £5,000 per annum and aminimum life expectancy of45 years lifetime treatmentcosts per patient were£225,000.Assuming that there are 5000living patients total annualtreatment costs would be inthe region of £25 million
Summary of main findings regarding provision of basic servicesInterpretation &Translation
Yes: Various estimatesby the Adult Basic SkillsUnit, and local researchstudies
Some: Consensus that use offamily or untrained interpretersis not satisfactory, but noreputable research on ‘effects’for health work.
Some: Estimates of need,translation, interpreter andadvocacy services are basedon current provision ratherthan needs assessment and‘unit cost’ approaches

45
Appendix B: Modelling the Unavoidable Costs of Ethnicity
A: The unavoidable treatment costs due to ethnicity for a specific condition.
The unavoidable treatment cost associated with ethnicity for a district health authority, arising because of a specifichealth condition is given by:
Equation 1
9 9
tcx = (Nn x P xn
x T xn
) - (Nn)x P x0
x T x0
....................................n=0 n=0
Term 1 - Term 2
Where:
tcx = Total net costs associated with ethnicity for a district health authority, arising because of a given healthcondition ‘x’.
Term 1: represents the actual cost of illness associated with all ethnic population groups in the district for condition‘x’.
(i) Nn
= The District Health Authority district population for ethnic group ‘n’.
N0
= White population within the Health Authority
N1
= Black Caribbean population within the Health Authority
N2
= Black African population within the Health Authority
N3
= Black Other population within the Health Authority
N4
= Asian Indian population within the Health Authority
N5
= Asian Pakistani population within the Health Authority
N6
= Asian Bangladeshi population within the Health Authority
N7
= Chinese population within the Health Authority
N8
= Other Asian population within the Health Authority
N9
= Other Other population within the Health Authority
(See Appendix H for a Census estimate of the population structure of a typical HA)
(ii) P xn
= Probability of ethnic group ‘n’ having a given condition ‘x’, for example Diabetes
(iii) T xn
= Average annual treatment costs associated with people in ethnic group ‘n’ having condition ‘x’ e.g.
average annual treatment cost for Black Caribbeans with Diabetes.
T xn
= P yn
x Cy
Where:
P yn
= The probability of a given ethnic population group ‘n’ requiring treatment ‘y’, where ‘y’ covers a
range of associated health complications e.g. amputation for Diabetes.Cy = The average annual cost of treatment ‘y’.
Term 2: represents the predicted cost of illness for condition ‘x’ in a white population of the same size as the totalethnic population in the district.
The difference between Terms 1 and 2 (tcx in Equation 1) represents the overall unavoidable treatment costs due toethnic minorities in a district population arising from condition ‘x’.

46
B: The overall unavoidable costs of ethnicity.
The overall unavoidable costs associated with ethnicity for a district health authority (C) is given by the sum ofunavoidable treatment costs for a range of key conditions plus the costs of provision of certain basic services (Cs):
vii
C = tcx + Cs ............................................................................................ Equation 2x=i
Where:
(i) C = Total unavoidable net costs associated with ethnicity for a district health authority.
(ii) tcx = Total net costs associated with ethnicity for a district health authority, arising because of a givenhealth condition ‘x’. (e.g. index conditions i-vii)
tci = Total net costs associated with ethnicity for diabetes.tcii = Total net costs associated with ethnicity for renal failure.tciii = Total net costs associated with ethnicity for hepatitis C.tciv = Total net costs associated with ethnicity for tuberculosis.tcv = Total net costs associated with ethnicity for stroke/ cardiovascular disease.tcvi = Total net costs associated with ethnicity for thalassaemia.tcvii = Total net costs associated with ethnicity for sickle cell.
(iii) Cs = Other costs: for example, costs of provision of certain basic services which are not directlylinked to population size, such as:interpreters, linkworkers, health information, or ethnic monitoring.
C: Treatment Information required to feed into the model.
As part of the scoping exercise, the information required for feeding into Equation 1 for the index conditions (i) - (vii)was identified and the availability of relevant data assessed. Prevalence data is discussed in the text above, andsummarised in the tables: an indication of the areas of data needed (and some estimates of availability) is given inappendix G. Here we attempt an outline of sources of variation in treatment costs.
i) Diabetes
Type 1 (Insulin Dependent Diabetes Mellitus) - IDDM:
Treatment requirements may include:
monitoring blood glucose levels and patient weight amputation chiropody services orthotic footwear dietician services insulin (and monitoring insulin) treating hyperglycaemia hypertension treating diabetic retinopathy / cataracts, and screening for diabetic retinopathy treating other Type 1 diabetic complications (but not end stage renal failure which is accounted for separately) additional GP / Specialist consultations (excluding interpreter costs, which are dealt with separately to avoid double
counting) other treatment/ screening requirements
Type 2 (Non-Insulin-dependent-Diabetes-Mellitus) - NIDDM:
Treatment requirements may include:
monitoring blood glucose levels and patient weight amputation chiropody services orthotic footwear dietician services treating hyperglycaemia hypertension

47
treating diabetic retinopathy / cataracts, and screening for diabetic retinopathy treating other Type 2 diabetic complications (but not End stage renal failure which is accounted for separately) treating other Type 2 diabetic complications, and the associated costs (but not end stage renal failure which is
accounted for separately) additional GP / Specialist consultations (excluding interpreter costs, which are dealt with separately to avoid double
counting) other treatment / screening requirements
Gestational Diabetes Mellitus (GDM).
The prevalence of GDM was around 2% for the population overall, but Africans / AfroCaribbeans has between 4 and 2times the risk of having GDM relative to Caucasians (p<0.01) (Koukkou et al. 1995)
Treatment requirements may include
induced labour elective Caesarean section other treatment / screening requirements
ii) Renal Failure
The rate of acceptance per million population for renal replacement therapy per annum (175 for Blacks, and 178 forAsians, compared with 63 for Whites).
Treatment requirements may include:
renal replacement therapy drug therapy additional GP / Specialist consultations (excluding interpreter costs, which are dealt with separately to avoid double
counting) other treatment requirements.
iii) Hepatitis C
Treatment requirements may include:
treatment for cirrhosis treatment for hepatocellular carcinoma treating other hepatitis C complications, and the associated costs (but not end stage renal failure which is accounted
for separately) additional GP / Specialist consultations (excluding interpreter costs, which are dealt with separately to avoid double
counting) other treatment / screening requirements
iv) Tuberculosis (TB).
Treatment requirements may include:
drug therapy may involve the use of:IsoniazidRifampicinPyrazinamide
and more rarely, Ethambutal and streptomycin (if resistance is suspected). Some new anti-tuberculosis drugs are in usein America but not in the UK.
therapies other than antimicrobial therapy:
emergency admissions and hospital stays additional GP / Specialist consultations (excluding interpreter costs, which are dealt with separately to avoid double
counting) other treatment / screening requirements

48
The latter, in the interests of public health and to ensure good compliance, may include visits by specialist nurses andinformation giving (notably for ‘new migrants’).
v) Stroke or cardiovascular disease
Stroke
Treatment requirements may include:
hospital stay intensive care drug therapy additional GP / Specialist consultations (excluding interpreter costs, which are dealt with separately to avoid double
counting) other treatment / screening requirements
Cardiovascular Disease
Treatment requirements may include:
hospital stay intensive care drug therapy additional GP / Specialist consultations (excluding interpreter costs, which are dealt with separately to avoid double
counting) other treatment / screening requirements
vi) Thalassaemia
The number of people in England and Wales with Thalassaemia (500) x The average annual cost of treatment perThalassaemia sufferer: £8,150) = c. £4.1 million per annum.
vii) Sickle Cell
The number of people in England and Wales with Sickle Cell (5000) x The average annual cost of treatment per sicklecell sufferer : £5,000) = c.£25 million per annum.

49
Appendix C:
A letter (on University of Warwick letterhead) was sent to all health districts in England, as part of our strategy toobtain locally produced studies and information on practice which had not been described in the formal research andacademic literature: this letter is reproduced below:
For the attention of the Director of Public Health
Dear Colleague
The NHS Executive has commissioned CRER and the Centre for Health Services Studies at the University of Warwickto undertake an investigation into the ‘unavoidable costs of ethnicity’. The conclusions of this report are intended toinform the discussions of the resource allocation process, if cultural and ethnic diversity prove to have significanteffects on the costing of service provision. As part of our strategy to understand the responses of health authorities tothe existence of ethnic and cultural diversity within their areas, we are seeking to obtain copies of current or recentannual reports of the Directors of Public Health, and any other reports or commissioning documents you may havewhich could shed light on the issue.
We are aware that many health authorities have conducted their own local studies into the needs and concerns ofminority ethnic groups in their areas, and have set up liaison groups and other projects to meet the specific needsidentified. Others have obtained supplementary funding from the NHSE Ethnic Health Unit and Department of Healthto run such projects. While we can identify many of those funded by central agencies, and will be contacting themdirectly if necessary, we should be very grateful if you could advise us of any schemes, research or other relevantactivity which you feel would be helpful in compiling this report.
If you wish to speak to the researchers personally, or have any questions to ask about the project, please contact me onthe (voice-mail equipped) direct telephone number given above: all (unpublished) information supplied will be treatedin confidence, and conclusions of the study shared with those who have supported us with information. We should alsobe happy to visit you and other relevant officers in your area, if you feel that this would be helpful.
If your authority has a specialist advisor or officer responsible for ‘ethnic health issues’, please would you also pass acopy of this letter for their attention. Similarly, if you know of relevant activities or officers in Trusts with whom youdeal, we should be grateful to hear of them.
Please note that as we shall be meeting the NHSE to review progress in the week of November 24th, it would behelpful if you could reply within the next two weeks.
Thanking you in advance for your assistance, and hoping that you will appreciate the potential benefits to be gainedfrom participation in this research,
Yours sincerely,
(Dr) Mark R D Johnson

50
Appendix D: Conceptual Model of Sources of Cost Variation
A Model of Sources of Cost Variation
Clinical Support Services(e.g. Blood bank, TB/
HIV/ Haemo, Diagnostic& Tissue Type testing)
Chronic Care(e.g. Diabetes)
Support Services(e.g. translation,
leaflets, interpreter/advocacy work,diet & religion)
Alternative provision(e.g. Non-NHS services,
Complementary medicineOverseas treatment
‘Ethnic’ SpecificPatient Care
(e.g reduced risk & costs?/haemoglobinopathies)
Acute Care(e.g. Maternity,Cardiovascular,Mental, Stroke)
Patient/Carer(e.g. compliance,
non-attendance, carer burden)
UnavoidableAdditional
Costs

51
Appendix E: Ethnic Health Initiatives - Examples
One District supplied a comprehensive list of ethnic health-related initiatives undertaken since the setting up of amanagement and ethnic health strategy group: no costs were supplied with this list, but it is indicative of the range ofpossible activities and demands on resourcing that can be identified: some of these were jointly funded by non-NHSsources (indicated below). Maternity service linkworkers Joint translation unit Bangladeshi and Pakistani commissioning officers Locality HP officers with community development projects Family Planning & sexual health services for Asian communities Family Planning and sexual health services for African-Caribbean communities Cervical Screening initiative with African-Caribbean communities Community Dental health service improvements Additional consultant haematologist sessions to support: Haemoglobinopathy service (SCD & Thalassaemia) Haemoglobinopathy specialist nurse Service agreement with OSCAR (Sickle Cell VO) Neonatal screening service (African-Caribbean) Haemoglobinopathy training programme for community nursing staff Mental health Day Centre in African-Caribbean community base Respite Care service for African-Caribbean elders (with SSD) Asian alcohol counselling service (SSD/DoH specific grant) Asian communities (ethnic and gender specific) alcohol support networks Mental health information project Support for refugee health project Drug service co-worker Bilingual speech therapy service AKASH project (Asian women’s health and exercise project: SRB led) Bangladeshi access project Asian stroke clubs Asian dietician Asian Diabetes strategy including specialist nursing, dietician and locality based service support Provision of service for religious circumcision Asian Discharge Planner Interpreters Various translation activities Racial harassment policies and awareness training for managers Various needs assessment activities (currently Yemeni group) Development of ethnic monitoring in Trusts, staffing and Primary Care
SRB: Single Regeneration Budget grant: SSD - Social services (Local authority department)
A similar list was supplied by another District:Programme of specialist provision:
Written information, signage and audiotapes, Asian Hospital Radio - 3 Trusts providing ‘within existing contractprovision’:Interpreting agency provision supported by Urban Programme Grant (no actual cost supplied)Catering, list of religious contacts and quiet room and multi-faith support worker (bereavement) also within existingcontract:Development of staff training programme for cultural awareness (NCH) funded by ‘non-recurrent transfer’ from NHASome SCD/T provision within existing contract; other supported by Urban Programme - similarly with mental healthworkDrug prevention, Asian Child development nurse, Asian and African-Caribbean elders, Stroke support and Disabilities(OT) work funded by joint finance.Asian Alcohol project supported by NHA (HIP) fundsAsian diabetic worker - within existing contract provisionDevelopment workers to give advice on purchasing - also within existing.
In total - 28 initiatives - 3 UP; 6 Joint; 15 ‘existing contract’ 2 special payment.

52
Appendix F: Health Districts replying to the Survey, and key Grey Literature
Note: Annual reports of the Directors of Public Health, although supplied by the majority of responding districts, arenot listed separately in this list, unless focusing specifically on health inequality and ethnic health matters. Internalinformal documents are not generally listed. This is not a complete list of grey literature supplied or consulted, butincludes the main research reports supplied and other documents likely to be more widely available.
Avon
Improving the health of black and other minority ethnic people in Avon - a framework for action Avon HA 1997
Barnsley
‘Some are more equal than others’ : Health, Inequality & Barnsley - Annual Report of the DPH 1993
Berkshire
Bexley & Greenwich
Sickle Cell Disorders in Greater London A Streetly, K Maxwell, A Mejia (Fair Shares for London Report) 1997
Birmingham
Action Plan for Black and Minority Ethnic Health 1996-98
Karim J 1996 Access to Accident and Emergency Services for Minority Ethnic residents Birmingham Heartlands andSolihull NHS Trust
Brent and Harrow
Irish health profile - An investigation into the Health Needs of the Irish Communities in Brent and Harrow (BHHAwith BIAS) nd ? 1996/7
Wiles R, Gordon G 1995 Health in Harlesden: Report of a community survey London: College of health
Bromley
Ethnic Health Strategy (BHA 1997)
Buckinghamshire
Access across services: Making it Happen (Report of Conference on improving access to services for minority ethniccommunities) BHA 1997
Bury & Rochdale
Cambridge/Huntingdon
Cambridgeshire Interpreting and Translation Agency (leaflet)
Wells C, Foster R 1993 Community Interpreting in Huntingdonshire: A survey of community needs (no cost data)
Camden & Islington
Black and Minority ethnic children in C&I; health services and needs
Homelessness and health
Health needs assessment of Black and Minority ethnic people in C&I
CoventryPrimary Health Care Provision for and with Asian Communities in Coventry: Report to Coventry Health & MuslimResource Centre, 1995

53
Implementing Ethnic Monitoring: report of the Pilot study 1992
Croydon
The health of Mothers and babies in Croydon: 1997 annual report of the DPH
Doncaster
Ethnic Minorities Development (Health) Officer’s Update and progress report 1997
Dudley
Changing Health Needs in Dudley - Annual report of the DPH 1997
Ealing, Hammersmith and Hounslow
Better health for West London - Annual Public Health report and updated five year strategy (EHHHA) 1996
Ethnicity and health report
Programme budgeting for diabetes in localities
East and North Hertfordshire
Change Growth and Challenge - Annual report of the DPH 1997
East London & The City
Review of Health advocacy and Interpretation Services 1997/8
East Norfolk
East Riding
East Sussex, Brighton & Hove
Elyas S M 1997 Psychological Consequences of seeking Asylum: A survey conducted on the Sudanese Coptic refugeesin East Sussex East Sussex, Brighton & Hove Health Authority
Exeter & North Devon
Gateshead & South Tyneside
Gateshead & South Tyneside HA : Rankin J, Bhopal R, Wallace B Factors influencing Heart Disease and Diabetes inSouth Asians: The South Tyneside Heart Study
Herefordshire
Isle of Wight
Kensington, Chelsea and Westminster
Facing up to difference 1997 and 1995 (Consolidation & Review documents)
Lambeth, Southwark and Lewisham
Leicestershire
Health of People in Different Ethnic Groups in Leicestershire: Technical document appended to the 1993 Annual reportof the Directorate of Public Health Medicine, Leicestershire Health.

54
Liverpool
Liverpool HA Health & Race Information Pack 1997 (& Equality Standards)
Manchester
Newcastle & North Tyneside
Taking Heart: Reducing Diabetes and Cardiovascular disease among Newcastle’s South Asian and ChineseCommunities 1996 (Newcastle Strategy Group)
Mughal S 1995 Better services for black and minority ethnic people NNTHA
Don’t let me be misunderstood (Save the Children project) User views of interpreting services 1995
Mental health, counselling and Racism: Community views on needs and services 1996
Mapping Exercise of mental health provision for Black people in Newcastle & N Tyneside P Crowley 1996
North and Mid Hampshire
North Cheshire
North Derbyshire
A Five Year Strategy for North Derbyshire Health to meet the needs of Ethnic Minority Communities 1997 NDHAEthnic Minorities Health Needs Working Group
North West Anglia
A Measure of Equity: Health Needs of African Caribbean People in the City of Peterborough North West AngliaHealth, 1995 (MRD Johnson with D Sangster)
Health Care provision and the Kashmiri population of Peterborough Peterborough Race Equality Council and NWAHA(MRD Johnson with S Imtiaz); 1993
North West Lancashire
North Yorkshire
Nottingham
Health Needs Assessment of the Black Ethnic Minority Population of Nottingham 1997 (H Nerwal)
(Draft) Report of a study into the health needs of the Mirpuri Punjabi speaking Population of Nottingham
HEA 1997 HIPP: The HEA’s Integrated Purchasing Programme
Portsmouth & South East Hampshire
A Health authority perspective on progress and action planning for black and minority ethnic groups (S A Clark 1997)
Salford and Trafford
Profile of Black Communities in Salford 1993 (Salford DHA, CHC & FHSA)
Baxter C 1993 The Communication needs of Black and Ethnic Minority Pregnant Women in Salford (Needsassessment exercise)
Williams G 1993 To tell you the truth, we are completely lost: The Health and Social needs of the Yemeni communityin Eccles and Salford SHA

55
Sandwell
Smethwick Heart Action Research Project
Action for Community Health in Tipton
Refugee health research project (Johnson & Akinwolere - published)
Sefton
Solihull
South and West Devon
South Humber
South Lancashire
Black and Minority Ethnic Groups in South Lancashire (briefing)
Southampton & South West Hampshire
Tees Health
Wakefield
Ashrafi KH, Brian AJ 1996 Report of Ethnic Minority Women’s Health Project Wakefield HA & CHC
Walsall
Howell J 1996 ‘Ethnicity and Complementary Medicine in Walsall’ (dissertation for Membership of the Faculty ofPublic Health Medicine) -
Wallis DE 1997 ‘Travel health: Attitudes, beliefs and Knowledge of Asian people, Primary Care professionals andtravel agents’ (dissertation for Membership of the Faculty of Public Health Medicine) -
The Health and Lifestyle of Walsall’s Asian Community aged 16-65: Results of the 1995 Lifestyle Survey WHA (DoHfunded research)
Warwickshire
Services to Black and Minority Ethnic groups: Ethnicity and health strategy - WHA - (nd but 1996 and reviewedperiodically) (also Equality Policy 1995)
Better Care Initiatives for Ethnic Minority Groups Uma Sharma - 1994 - FHSA/ RHA funded research projects maderecommendations for £7,500-worth of initiatives to develop service provision.
reports include also: Access to Primary Health Care by Ethnic Minority Patients - South Warwickshire/Nuneaton &Bedworth/Rugby districts.
West Hertfordshire
Ethnic communities in West Herts: Core standards
Watford Ethnic Profiling Project
West Herts Annual Health report 1997
Invisible Minorities: Ethnic Minority Community Needs in Dacorum Hemel Hempstead: Dacorum Multi-CulturalAssociation (Johnson MRD with N Shaheen, R Sanghera) 1995
West Kent
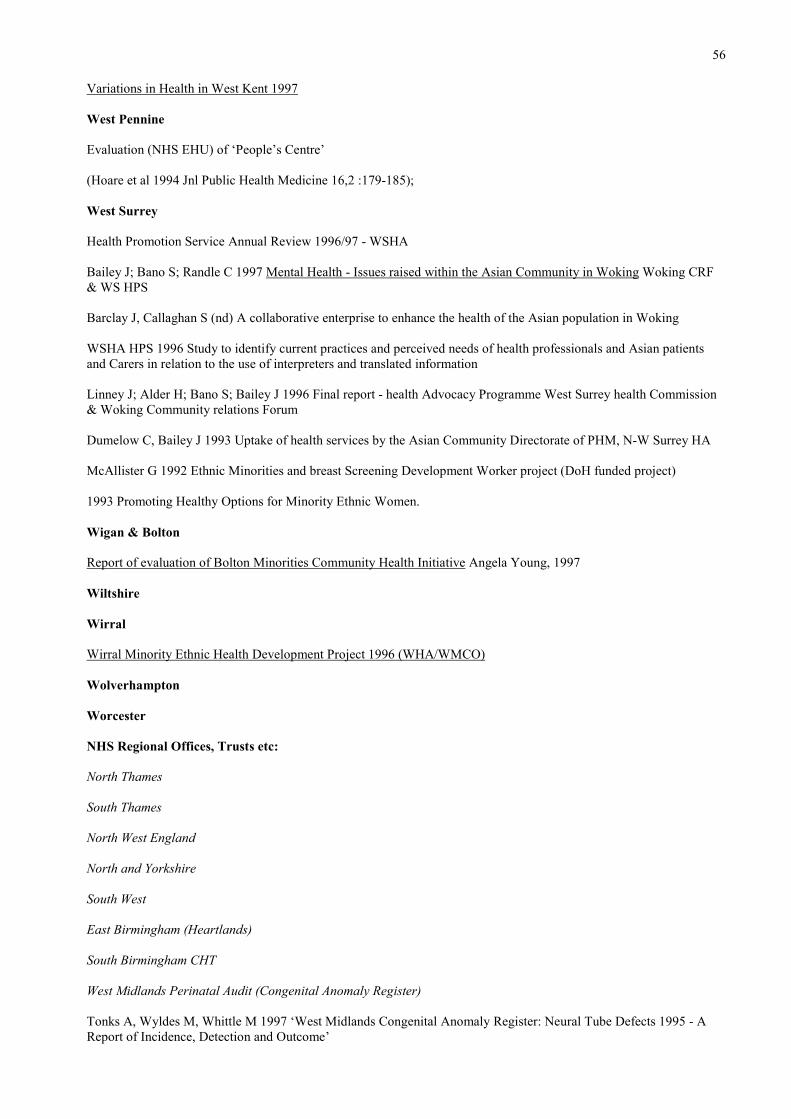
56
Variations in Health in West Kent 1997
West Pennine
Evaluation (NHS EHU) of ‘People’s Centre’
(Hoare et al 1994 Jnl Public Health Medicine 16,2 :179-185);
West Surrey
Health Promotion Service Annual Review 1996/97 - WSHA
Bailey J; Bano S; Randle C 1997 Mental Health - Issues raised within the Asian Community in Woking Woking CRF& WS HPS
Barclay J, Callaghan S (nd) A collaborative enterprise to enhance the health of the Asian population in Woking
WSHA HPS 1996 Study to identify current practices and perceived needs of health professionals and Asian patientsand Carers in relation to the use of interpreters and translated information
Linney J; Alder H; Bano S; Bailey J 1996 Final report - health Advocacy Programme West Surrey health Commission& Woking Community relations Forum
Dumelow C, Bailey J 1993 Uptake of health services by the Asian Community Directorate of PHM, N-W Surrey HA
McAllister G 1992 Ethnic Minorities and breast Screening Development Worker project (DoH funded project)
1993 Promoting Healthy Options for Minority Ethnic Women.
Wigan & Bolton
Report of evaluation of Bolton Minorities Community Health Initiative Angela Young, 1997
Wiltshire
Wirral
Wirral Minority Ethnic Health Development Project 1996 (WHA/WMCO)
Wolverhampton
Worcester
NHS Regional Offices, Trusts etc:
North Thames
South Thames
North West England
North and Yorkshire
South West
East Birmingham (Heartlands)
South Birmingham CHT
West Midlands Perinatal Audit (Congenital Anomaly Register)
Tonks A, Wyldes M, Whittle M 1997 ‘West Midlands Congenital Anomaly Register: Neural Tube Defects 1995 - AReport of Incidence, Detection and Outcome’
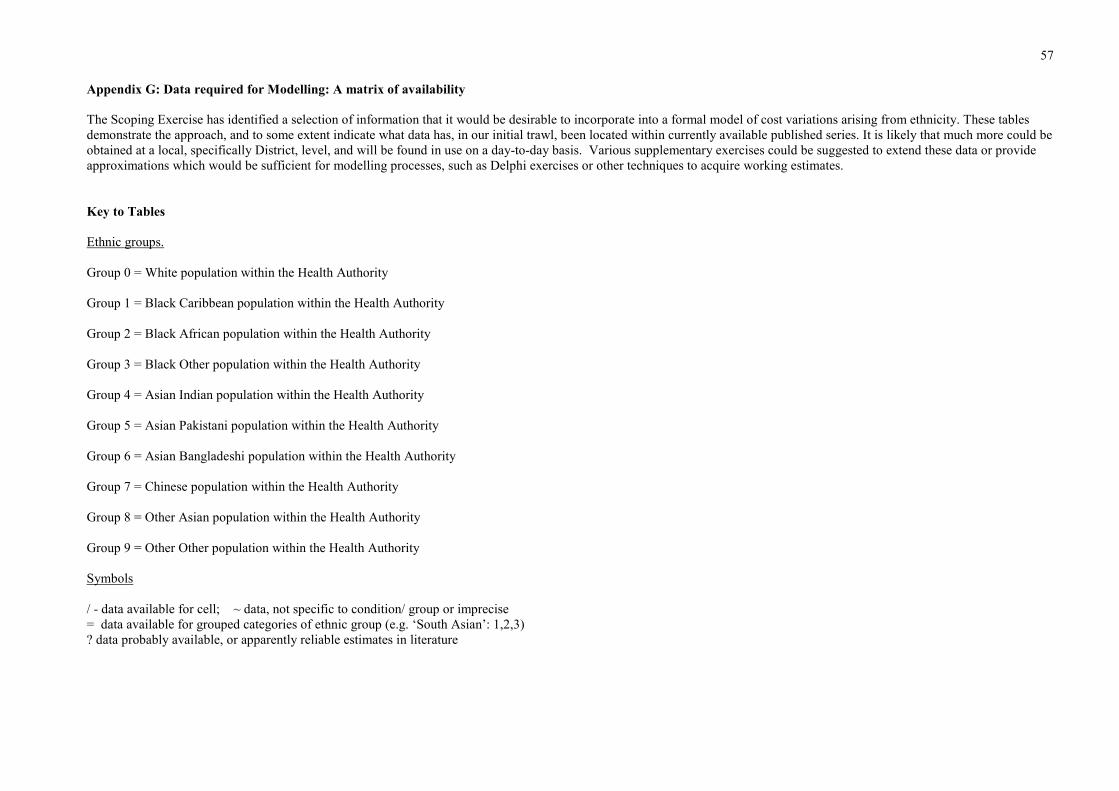
57
Appendix G: Data required for Modelling: A matrix of availability
The Scoping Exercise has identified a selection of information that it would be desirable to incorporate into a formal model of cost variations arising from ethnicity. These tablesdemonstrate the approach, and to some extent indicate what data has, in our initial trawl, been located within currently available published series. It is likely that much more could beobtained at a local, specifically District, level, and will be found in use on a day-to-day basis. Various supplementary exercises could be suggested to extend these data or provideapproximations which would be sufficient for modelling processes, such as Delphi exercises or other techniques to acquire working estimates.
Key to Tables
Ethnic groups.
Group 0 = White population within the Health Authority
Group 1 = Black Caribbean population within the Health Authority
Group 2 = Black African population within the Health Authority
Group 3 = Black Other population within the Health Authority
Group 4 = Asian Indian population within the Health Authority
Group 5 = Asian Pakistani population within the Health Authority
Group 6 = Asian Bangladeshi population within the Health Authority
Group 7 = Chinese population within the Health Authority
Group 8 = Other Asian population within the Health Authority
Group 9 = Other Other population within the Health Authority
Symbols
/ - data available for cell; ~ data, not specific to condition/ group or imprecise= data available for grouped categories of ethnic group (e.g. ‘South Asian’: 1,2,3)? data probably available, or apparently reliable estimates in literature

58
Current data Availability for Modelling
a) Diabetes: Type I Diabetes - Insulin Dependent Diabetes Mellitus (IDDM)
Population group
Probability of having the condition0 1 2 3 4 5 6 7 8 9/ ? ? ? = = =
Details of treatment needs possibly arising due to healthproblem
Probability of a given group requiringtreatment for a range of associatedhealth problems.
Annual average cost arisingbecause of the range ofconditions
Monitoring blood glucose levels and patient weightAmputationChiropody servicesOrthotic footwearDietician servicesInsulinMonitoring InsulinTreating HyperglycaemiaHypertensionTreating diabetic retinopathy / cataractsScreening for diabetic retinopathyAdditional GP / Specialist ConsultationsOther treatment / screening requirements
0
~
/
1
/
2
/
3
/
4
~
/
5
~
/
6
~
/
7
/
8
/
9
/
0 1 2 3 4 5 6 7 8 9

59
b) Diabetes: Type II Diabetes - NonInsulin Dependent Diabetes Mellitus (NIDDM)
Population group
Probability of having the condition0 1 2 3 4 5 6 7 8 9/ = = = ? ? ?
Details of treatment needs possibly arising due to healthproblem
Probability of a given group requiringtreatment for a range of associatedhealth problems.
Annual average cost arisingbecause of the range ofconditions
Monitoring blood glucose levels and patient weightAmputationChiropody servicesOrthotic footwearDietician servicesInsulinMonitoring InsulinTreating HyperglycaemiaHypertensionTreating diabetic retinopathy / cataractsScreening for diabetic retinopathyAdditional GP / Specialist ConsultationsOther treatment / screening requirements
0
/
1
/
2
/
3
/
4
/
5
/
6
/
7
/
8
/
9
/
0 1 2 3 4 5 6 7 8 9

60
c) Diabetes: Gestational (GDM)
Population group
Probability of having the condition0 1 2 3 4 5 6 7 8 9
Details of treatment needs possibly arising due to healthproblem
Probability of a given group requiringtreatment for a range of associatedhealth problems.
Annual average cost arisingbecause of the range ofconditions
Induced labourElective CaesareanOther treatmentScreening
0~
1 2 3 4 5 6 7 8 9 0 1 2 3 4 5 6 7 8 9
d) Renal Failure
Population group
Probability of having the condition0 1 2 3 4 5 6 7 8 9/ = = =
Details of treatment needs possibly arising due to healthproblem
Probability of a given group requiringtreatment for a range of associatedhealth problems.
Annual average cost arisingbecause of the range ofconditions
Renal replacement therapyDrug therapyAdditional GP / Specialist Consultations for other reasonsOther treatment requirements?
0/
1=
2=
3=
4=
5=
6=
7 8 9 0/
1/
2/
3/
4/
5/
6/
7 8 9

61
e) Hepatitis (C)
Population group
Probability of having the condition0 1 2 3 4 5 6 7 8 9
Details of treatment needs possibly arising due to healthproblem
Probability of a given group requiringtreatment for a range of associatedhealth problems.
Annual average cost arisingbecause of the range ofconditions
CirrhosisHepatocellular CarcinomaTreating other hepatitis C complicationsAdditional GP / Specialist Consultations requiredOther treatment / Screening requirements
0 1 2 3 4 5 6 7 8 9 0 1 2 3 4 5 6 7 8 9
f) Tuberculosis
Population group
Probability of having the condition0 1 2 3 4 5 6 7 8 9
=
Details of treatment needs possibly arising due to healthproblem
Probability of a given group requiringtreatment for a range of associatedhealth problems.
Annual average cost arisingbecause of the range ofconditions
Drug therapies usedEmergency admissions and hospital staysAdditional GP / Specialist Consultations required other thanfor the aforementioned reasonsOther treatment / Screening requirements
0 1 2 3 4 5 6 7 8 9 0 1 2 3 4 5 6 7 8 9

62
g) Stroke
Population group
Probability of having the condition0 1 2 3 4 5 6 7 8 9
Details of treatment needs possibly arising due to healthproblem
Probability of a given group requiringtreatment for a range of associatedhealth problems.
Annual average cost arisingbecause of the range ofconditions
Intensive CareHospital stayDrug therapyAdditional GP / Specialist Consultations requiredOther treatment / Screening requirements
0 1 2 3 4 5 6 7 8 9 0 1 2 3 4 5 6 7 8 9
h) Cardiovascular Disease (other)
Population group
Probability of having the condition0 1 2 3 4 5 6 7 8 9
=
Details of treatment needs possibly arising due to healthproblem
Probability of a given group requiringtreatment for a range of associatedhealth problems.
Annual average cost arisingbecause of the range ofconditions
Intensive CareHospital stayDrug therapyAdditional GP / Specialist Consultations requiredOther treatment / Screening requirements
0 1 2 3 4 5 6 7 8 9 0 1 2 3 4 5 6 7 8 9

63
i) Thalassaemia
Population group Probability ofhaving thecondition
Details of treatment needs possibly arising due to healthproblem
Not detailed here: See SMAC 1994 report
Probability of agiven grouprequiring treatmentfor a range ofassociated healthproblems
The annual averagecost arising becauseof the range ofconditions
Group 0 Group 1 / Group 2 Group 3 Group 4 Group 5 Group 6 Group 7 Group 8 Group 9
j) Sickle cell
Population group Probability ofhaving thecondition
Details of treatment needs possibly arising due to healthproblem
Not detailed here: See SMAC 1994 report
Probability of agiven grouprequiring treatmentfor a range ofassociated healthproblems
The annual averagecost arising becauseof the range ofconditions
Group 0 Group 1 Group 2 Group 3 Group 4 Group 5 Group 6 Group 7 Group 8 Group 9

64
Appendix H: Census data and proportions modelling a ‘typical’ health District.
The following data tables show the ‘average’ ethnic composition of an English Health District. They could be used toassess the degree to which a district has more or less representation of a specific ethnic group (controlling for sex andage-group), and the expected proportion of the overall population represented by any specific ethnic group, by age andsex. Maps illustrate the national variation in distribution of minority groups.
Table 1 (Sheet 1) shows the mean population structure - i.e. the ‘expected actual numbers’ of a typical district with apopulation of 470,555 in 1991, broken down by the 10-fold Census ethnic category groups, gender and five-year agegroups.
The typical district will contain 16,005 males aged 0-4, of which 14,367 will be White, and 357 belong to the‘Chinese and other’ group.
Table 2 (Sheet 2) represents the proportion of each age group (broken down by gender) falling in each of the 10 ethnicgroup categories.
93.6% of all males in the district are white; of those aged 0-4, 89.8% are white, and 2.2% are ‘Chinese and other’.
Table 3 (Sheet 3) represents the proportion of each ethnic group category (broken down by gender) falling in each agegroup.
Of males, 7.0% are aged 0-4; 6.7% of white males are aged 0-4; 11.9% of Chinese and other males fall in this agegroup.
Table 4 (Sheet 4) shows the relative proportion of the whole population represented by any specific combination ofage, gender and ethnic group category.
3.401% of the District population are males aged 0-4: 3.053% are white males aged 0-4 and 0.075% are Chinese orother ethnic origin males aged 0-4. The largest single group is white females aged 25-29 (3.73%).
Maps of the ethnic composition of Health Authorities in England
The maps present the ethnic breakdown of the population in 1991, using data from the 1991 Census of Population.The data has been aggregated to the 100 Health Authority Areas as defined in 1996. The ethnic groups used are thosedefined by the 1991 Census and the variable mapped for each is the percentage of the resident population of the HealthAuthority area from that ethnic group.
Ethnic minorities from the largest share of the population in London, the West Midlands and the conurbations if NorthWest England and Yorkshire. The minority share of the population is somewhat smaller in HAs falling within themain ‘axis of urbanisation’ running from London to Manchester, and minorities represents a very small percentage ofthe population of more peripheral and rural HAs. The maps illustrate the different geographical distributions of theminority ethnic groups.
Black people have a more concentrated geographical distribution, focuses upon Greater London and the WestMidlands, with a smaller level of concentration in the major Northern cities. South Asians are much more stronglyrepresented in the Pennine area and the West Midlands, in addition to London and the West Midlands. The “Chineseand Other” grouping has a more widespread distribution, but forms a much smaller percentage of the residentpopulation than the other broad minority groupings.
These broad categories conceal variations between individual ethnic groups; for example, within the South Asiancategory, Pakistani people are much more likely to live in the North and Midlands than in London while Indian peopleare also strongly represented in London and the East Midlands.

65

66

67

68

69

70

71