Embed Size (px)
Citation preview

SoftwareProduct
Research
SQLMonitoringFacility
User’s Guide

SQL/Monitoring FacilityRelease 1
© Copyright Software Product Research 2000
“SQL/Command Analysis” is a product name owned by Software Product Research
All other product names, mentioned in this manual, are trademarks owned by InternationalBusiness Machines Corporation, Armonk, NY.

1 Functional description . . . . . . . . . . . . . . . . . . . . . . . . . . . . . . . . . . . . . . . . . . . . . . . . . . . . . . . 11.1 System Monitoring . . . . . . . . . . . . . . . . . . . . . . . . . . . . . . . . . . . . . . . . . . . . . . . . . . . 31.2 Statement Monitoring . . . . . . . . . . . . . . . . . . . . . . . . . . . . . . . . . . . . . . . . . . . . . . . . 51.3 Statement Statistics . . . . . . . . . . . . . . . . . . . . . . . . . . . . . . . . . . . . . . . . . . . . . . . . . . 71.4 Package statistics . . . . . . . . . . . . . . . . . . . . . . . . . . . . . . . . . . . . . . . . . . . . . . . . . . . . 91.5 Additional Monitor Services . . . . . . . . . . . . . . . . . . . . . . . . . . . . . . . . . . . . . . . . . . . 11
1.5.1 Statement Logging . . . . . . . . . . . . . . . . . . . . . . . . . . . . . . . . . . . . . . . . . . . 111.5.2 Benchmarking . . . . . . . . . . . . . . . . . . . . . . . . . . . . . . . . . . . . . . . . . . . . . . . 111.5.3 Application Statement Recording . . . . . . . . . . . . . . . . . . . . . . . . . . . . . . . . 111.5.4 Lockwait Recording . . . . . . . . . . . . . . . . . . . . . . . . . . . . . . . . . . . . . . . . . . . 121.5.5 Notification . . . . . . . . . . . . . . . . . . . . . . . . . . . . . . . . . . . . . . . . . . . . . . . . . . 121.5.6 Governor . . . . . . . . . . . . . . . . . . . . . . . . . . . . . . . . . . . . . . . . . . . . . . . . . . 121.5.7 AutoRebind Facility . . . . . . . . . . . . . . . . . . . . . . . . . . . . . . . . . . . . . . . . . . . 121.5.8 AutoPrep Facility . . . . . . . . . . . . . . . . . . . . . . . . . . . . . . . . . . . . . . . . . . . . . 141.5.9 Dynamic alias . . . . . . . . . . . . . . . . . . . . . . . . . . . . . . . . . . . . . . . . . . . . . . . 141.5.10 CONNECT Screening . . . . . . . . . . . . . . . . . . . . . . . . . . . . . . . . . . . . . . . . . 14
1.6 User Interface . . . . . . . . . . . . . . . . . . . . . . . . . . . . . . . . . . . . . . . . . . . . . . . . . . . . . . 151.6.1 User Interface to the Statement Monitor . . . . . . . . . . . . . . . . . . . . . . . . . . 161.6.2 Graphical User Interface to the Statement Monitor . . . . . . . . . . . . . . . . . . 171.6.3 The RunStats Interface . . . . . . . . . . . . . . . . . . . . . . . . . . . . . . . . . . . . . . . . 181.6.4 Saving the RunStats . . . . . . . . . . . . . . . . . . . . . . . . . . . . . . . . . . . . . . . . . . 191.6.5 User Interface to the Statement Monitor Tables . . . . . . . . . . . . . . . . . . . . . 191.6.6 User Interface to the System Monitor Tables . . . . . . . . . . . . . . . . . . . . . . . 201.6.7 Graphical User Interface to the System Monitor . . . . . . . . . . . . . . . . . . . . . 211.6.8 Printing the Monitor tables . . . . . . . . . . . . . . . . . . . . . . . . . . . . . . . . . . . . . 21
1.7 Customizing . . . . . . . . . . . . . . . . . . . . . . . . . . . . . . . . . . . . . . . . . . . . . . . . . . . . . . . 22
2 SQL/MF Component Description . . . . . . . . . . . . . . . . . . . . . . . . . . . . . . . . . . . . . . . . . . . . . 232.1 Statement Monitor Components . . . . . . . . . . . . . . . . . . . . . . . . . . . . . . . . . . . . . . . . 23
2.1.1 SQLMFINI . . . . . . . . . . . . . . . . . . . . . . . . . . . . . . . . . . . . . . . . . . . . . . . . . . 232.1.2 SQLCSI . . . . . . . . . . . . . . . . . . . . . . . . . . . . . . . . . . . . . . . . . . . . . . . . . . . . 232.1.3 SQLMFSRV . . . . . . . . . . . . . . . . . . . . . . . . . . . . . . . . . . . . . . . . . . . . . . . . . 232.1.4 SQLCS . . . . . . . . . . . . . . . . . . . . . . . . . . . . . . . . . . . . . . . . . . . . . . . . . . . . 242.1.5 SQLCSCRW . . . . . . . . . . . . . . . . . . . . . . . . . . . . . . . . . . . . . . . . . . . . . . . . 242.1.6 SQLCSAPS . . . . . . . . . . . . . . . . . . . . . . . . . . . . . . . . . . . . . . . . . . . . . . . . . 242.1.7 SSPLIBR . . . . . . . . . . . . . . . . . . . . . . . . . . . . . . . . . . . . . . . . . . . . . . . . . . . 24
2.2 System Monitor Component . . . . . . . . . . . . . . . . . . . . . . . . . . . . . . . . . . . . . . . . . . . 242.3 User Interface Component $DBM . . . . . . . . . . . . . . . . . . . . . . . . . . . . . . . . . . . . . . 25
3 Installing SQL/MF . . . . . . . . . . . . . . . . . . . . . . . . . . . . . . . . . . . . . . . . . . . . . . . . . . . . . . . . . 273.1 Software Prerequisites . . . . . . . . . . . . . . . . . . . . . . . . . . . . . . . . . . . . . . . . . . . . . . . 273.2 Pre-installation tasks . . . . . . . . . . . . . . . . . . . . . . . . . . . . . . . . . . . . . . . . . . . . . . . . 27
3.2.1 Create the SQL/MF library . . . . . . . . . . . . . . . . . . . . . . . . . . . . . . . . . . . . . 273.2.2 Update LIBDEF and Standard Labels . . . . . . . . . . . . . . . . . . . . . . . . . . . . . 273.2.3 Determine the SQL/MF database . . . . . . . . . . . . . . . . . . . . . . . . . . . . . . . . 273.2.4 Determine the SQL/MF service partition . . . . . . . . . . . . . . . . . . . . . . . . . . . 283.2.5 DB2 agent structures for SQL/MF . . . . . . . . . . . . . . . . . . . . . . . . . . . . . . . . 283.2.6 Plan the DBspaces needed for SQL/MF . . . . . . . . . . . . . . . . . . . . . . . . . . . 293.2.7 Security Considerations . . . . . . . . . . . . . . . . . . . . . . . . . . . . . . . . . . . . . . . 30
3.3 Install the required components . . . . . . . . . . . . . . . . . . . . . . . . . . . . . . . . . . . . . . . . 313.3.1 Preliminary Note . . . . . . . . . . . . . . . . . . . . . . . . . . . . . . . . . . . . . . . 323.3.2 Define the SQL/MF library . . . . . . . . . . . . . . . . . . . . . . . . . . . . . . . . . . . . . . 323.3.3 Upload the SQL/MF software . . . . . . . . . . . . . . . . . . . . . . . . . . . . . . . . . . . 323.3.4 Link the SQL/MF phases . . . . . . . . . . . . . . . . . . . . . . . . . . . . . . . . . . . . . . . 323.3.5 Define the SQL/MF PDS . . . . . . . . . . . . . . . . . . . . . . . . . . . . . . . . . . . . . . . 333.3.6 Define the SQL/MF components to CICS . . . . . . . . . . . . . . . . . . . . . . . . . . 333.3.7 Update SQLMF CONFIG . . . . . . . . . . . . . . . . . . . . . . . . . . . . . . . . . . . . . . 343.3.8 DB2 userid’s for SQL/MF . . . . . . . . . . . . . . . . . . . . . . . . . . . . . . . . . . . . . . 34

3.3.9 Perform installation in the SQL/MF database . . . . . . . . . . . . . . . . . . . . . . . 353.3.10 Perform installation in the monitored database(s) . . . . . . . . . . . . . . . . . . . . 363.3.11 Load the service partition startup job . . . . . . . . . . . . . . . . . . . . . . . . . . . . . 37
3.4 Install the optional SQL/MF components . . . . . . . . . . . . . . . . . . . . . . . . . . . . . . . . . 383.4.1 Install the Recorder facility . . . . . . . . . . . . . . . . . . . . . . . . . . . . . . . . . . . . . 383.4.2 Install the AutoPrep facility . . . . . . . . . . . . . . . . . . . . . . . . . . . . . . . . . . . . . 393.4.3 Install the Saved Runstats facility . . . . . . . . . . . . . . . . . . . . . . . . . . . . . . . . 40
3.5 Perform VSE IPL . . . . . . . . . . . . . . . . . . . . . . . . . . . . . . . . . . . . . . . . . . . . . . . . . . . 41
4 Initiating SQL/MF . . . . . . . . . . . . . . . . . . . . . . . . . . . . . . . . . . . . . . . . . . . . . . . . . . . . . . . . . . 434.1 Initiating Monitoring in a Database Server . . . . . . . . . . . . . . . . . . . . . . . . . . . . . . . 43
4.1.1 Prequisites . . . . . . . . . . . . . . . . . . . . . . . . . . . . . . . . . . . . . . . . . . . . . . . . . . 434.1.2 Activating the SQL/MF bootstrap . . . . . . . . . . . . . . . . . . . . . . . . . . . . . . . . 444.1.3 Updating the standard labels . . . . . . . . . . . . . . . . . . . . . . . . . . . . . . . . . . . . 454.1.4 Preparing DB2/VSE startup for monitoring . . . . . . . . . . . . . . . . . . . . . . . . . 45
4.2 Starting the SQL/MF service partition . . . . . . . . . . . . . . . . . . . . . . . . . . . . . . . . . . . 464.3 Stopping the SQL/MF service partition . . . . . . . . . . . . . . . . . . . . . . . . . . . . . . . . . . . 464.4 CICS considerations . . . . . . . . . . . . . . . . . . . . . . . . . . . . . . . . . . . . . . . . . . . . . . . . . 464.5 Summary of changes to your VSE system . . . . . . . . . . . . . . . . . . . . . . . . . . . . . . . . 47
5 Configuring SQL/MF . . . . . . . . . . . . . . . . . . . . . . . . . . . . . . . . . . . . . . . . . . . . . . . . . . . . . . . 495.1 Configuring the Statement Monitor . . . . . . . . . . . . . . . . . . . . . . . . . . . . . . . . . . . . . . 49
5.1.1 List of configuration statements . . . . . . . . . . . . . . . . . . . . . . . . . . . . . . . . . . 505.1.2 AUTO_REBIND statement . . . . . . . . . . . . . . . . . . . . . . . . . . . . . . . . . . . . . 515.1.3 BENCHMARK statement . . . . . . . . . . . . . . . . . . . . . . . . . . . . . . . . . . . . . . 525.1.4 EXCLUDE and INCLUDE statements . . . . . . . . . . . . . . . . . . . . . . . . . . . . . 535.1.5 IBUFLOOK statement . . . . . . . . . . . . . . . . . . . . . . . . . . . . . . . . . . . . . . . . . 555.1.6 INITIAL statement . . . . . . . . . . . . . . . . . . . . . . . . . . . . . . . . . . . . . . . . . . . . 565.1.7 LOG statement . . . . . . . . . . . . . . . . . . . . . . . . . . . . . . . . . . . . . . . . . . . . . . 575.1.8 MAX_PAGES statement . . . . . . . . . . . . . . . . . . . . . . . . . . . . . . . . . . . . . . . 625.1.9 NOTIFY statement . . . . . . . . . . . . . . . . . . . . . . . . . . . . . . . . . . . . . . . . . . . 635.1.10 PERIOD statement . . . . . . . . . . . . . . . . . . . . . . . . . . . . . . . . . . . . . . . . . . . 645.1.11 RETAIN_RUNSTATS statement . . . . . . . . . . . . . . . . . . . . . . . . . . . . . . . . . 655.1.12 SECTION statement . . . . . . . . . . . . . . . . . . . . . . . . . . . . . . . . . . . . . . . . . . 665.1.13 SECTION_STATS statement . . . . . . . . . . . . . . . . . . . . . . . . . . . . . . . . . . . 675.1.14 SET ISOLATION statement . . . . . . . . . . . . . . . . . . . . . . . . . . . . . . . . . . . . 685.1.15 Sample configuration file . . . . . . . . . . . . . . . . . . . . . . . . . . . . . . . . . . . . . . . 69
5.2 Configuring the Governor Facility . . . . . . . . . . . . . . . . . . . . . . . . . . . . . . . . . . . . . . . 715.3 Configuring the System Monitor . . . . . . . . . . . . . . . . . . . . . . . . . . . . . . . . . . . . . . . . 755.4 Configuring the Recorder . . . . . . . . . . . . . . . . . . . . . . . . . . . . . . . . . . . . . . . . . . . . . 775.5 Configuring the User Interface . . . . . . . . . . . . . . . . . . . . . . . . . . . . . . . . . . . . . . . . . 795.6 Defining dynamic user aliases . . . . . . . . . . . . . . . . . . . . . . . . . . . . . . . . . . . . . . . . . 80
6 Using SQL/MF: Monitor Data Items . . . . . . . . . . . . . . . . . . . . . . . . . . . . . . . . . . . . . . . . . . . 816.1 Description . . . . . . . . . . . . . . . . . . . . . . . . . . . . . . . . . . . . . . . . . . . . . . . . . . . . . . . . 816.2 Agent status description . . . . . . . . . . . . . . . . . . . . . . . . . . . . . . . . . . . . . . . . . . . . . . 866.3 SQL statement types description . . . . . . . . . . . . . . . . . . . . . . . . . . . . . . . . . . . . . . . 87
7 Using SQL/MF: General considerations . . . . . . . . . . . . . . . . . . . . . . . . . . . . . . . . . . . . . . . . 897.1 Authorizing access to the User Interface . . . . . . . . . . . . . . . . . . . . . . . . . . . . . . . . . 89
7.1.1 Authorization scheme . . . . . . . . . . . . . . . . . . . . . . . . . . . . . . . . . . . . . . . . . 897.1.2 Defined SQL/MF Applications . . . . . . . . . . . . . . . . . . . . . . . . . . . . . . . . . . . 907.1.3 Authorization commands . . . . . . . . . . . . . . . . . . . . . . . . . . . . . . . . . . . . . . . 917.1.3.1 GRANT command . . . . . . . . . . . . . . . . . . . . . . . . . . . . . . . . . . . . . . . . . . . . 917.1.3.2 CONNECT command . . . . . . . . . . . . . . . . . . . . . . . . . . . . . . . . . . . . . . . . . 917.1.3.3 Comment . . . . . . . . . . . . . . . . . . . . . . . . . . . . . . . . . . . . . . . . . . . . . . . . . . . 917.1.3.4 Names . . . . . . . . . . . . . . . . . . . . . . . . . . . . . . . . . . . . . . . . . . . . . . . . . . . . . 917.1.4 Distributed authorization file . . . . . . . . . . . . . . . . . . . . . . . . . . . . . . . . . . . . 927.1.5 Sample authorization file . . . . . . . . . . . . . . . . . . . . . . . . . . . . . . . . . . . . . . . 92
7.2 Task-oriented Description . . . . . . . . . . . . . . . . . . . . . . . . . . . . . . . . . . . . . . . . . . . . 93

7.2.1 Examining running SQL statements . . . . . . . . . . . . . . . . . . . . . . . . . . . . . . 937.2.2 Examining running SQL statements graphically . . . . . . . . . . . . . . . . . . . . . 937.2.3 Examining the Run Statistics for a DB2/VSE server . . . . . . . . . . . . . . . . . . 947.2.4 Examining the System Statistics for a DB2/VSE server . . . . . . . . . . . . . . . 947.2.5 Examining the status of a DB2/VSE server graphically . . . . . . . . . . . . . . . 947.2.6 Examining statement usage statistics . . . . . . . . . . . . . . . . . . . . . . . . . . . . . 957.2.7 Examining package usage statistics . . . . . . . . . . . . . . . . . . . . . . . . . . . . . . 957.2.8 Examining the statement exception Log . . . . . . . . . . . . . . . . . . . . . . . . . . . 967.2.9 Monitoring DB2 Internal DBspace usage . . . . . . . . . . . . . . . . . . . . . . . . . . 967.2.10 Examining the benchmark Log . . . . . . . . . . . . . . . . . . . . . . . . . . . . . . . . . . 967.2.11 Printing monitor reports . . . . . . . . . . . . . . . . . . . . . . . . . . . . . . . . . . . . . . . . 977.2.12 Executing Host Commands . . . . . . . . . . . . . . . . . . . . . . . . . . . . . . . . . . . . . 97
8 Using SQL/MF: Inspecting runtime data . . . . . . . . . . . . . . . . . . . . . . . . . . . . . . . . . . . . . . . . 998.1 Inspecting running SQL statements using $DBM . . . . . . . . . . . . . . . . . . . . . . . . . . . 99
8.1.1 Statement List . . . . . . . . . . . . . . . . . . . . . . . . . . . . . . . . . . . . . . . . . . . . . . . 998.1.2 List Statements . . . . . . . . . . . . . . . . . . . . . . . . . . . . . . . . . . . . . . . . . . . . . 1008.1.3 Statement Detail . . . . . . . . . . . . . . . . . . . . . . . . . . . . . . . . . . . . . . . . . . . . 1018.1.4 Statement Detail functions . . . . . . . . . . . . . . . . . . . . . . . . . . . . . . . . . . . . 1028.1.5 Host Commands . . . . . . . . . . . . . . . . . . . . . . . . . . . . . . . . . . . . . . . . . . . . 104
8.2 Using SQLGRAPH . . . . . . . . . . . . . . . . . . . . . . . . . . . . . . . . . . . . . . . . . . . . . . . . . 1058.2.1 Invocation . . . . . . . . . . . . . . . . . . . . . . . . . . . . . . . . . . . . . . . . . . . . . . . . . 1058.2.2 SQLGRAPH Functions . . . . . . . . . . . . . . . . . . . . . . . . . . . . . . . . . . . . . . . 1058.2.3 Buffer Pool usage graph . . . . . . . . . . . . . . . . . . . . . . . . . . . . . . . . . . . . . . 107
8.3 Invoking the RunStats Function . . . . . . . . . . . . . . . . . . . . . . . . . . . . . . . . . . . . . . . 1088.4 Using SQLPULSE . . . . . . . . . . . . . . . . . . . . . . . . . . . . . . . . . . . . . . . . . . . . . . . . . 111
8.4.1 Invocation . . . . . . . . . . . . . . . . . . . . . . . . . . . . . . . . . . . . . . . . . . . . . . . . . 1118.4.2 SQLPULSE Functions . . . . . . . . . . . . . . . . . . . . . . . . . . . . . . . . . . . . . . . . 1118.4.3 SQLPULSE Detail . . . . . . . . . . . . . . . . . . . . . . . . . . . . . . . . . . . . . . . . . . . 112
9 Using SQL/MF: The Table Editor . . . . . . . . . . . . . . . . . . . . . . . . . . . . . . . . . . . . . . . . . . . . 1159.1 Report Display . . . . . . . . . . . . . . . . . . . . . . . . . . . . . . . . . . . . . . . . . . . . . . . . . . . . 1179.2 Acting upon the report . . . . . . . . . . . . . . . . . . . . . . . . . . . . . . . . . . . . . . . . . . . . . . 1189.3 Object Editor Function . . . . . . . . . . . . . . . . . . . . . . . . . . . . . . . . . . . . . . . . . . . . . . 1199.4 Formatting the report . . . . . . . . . . . . . . . . . . . . . . . . . . . . . . . . . . . . . . . . . . . . . . . 1209.5 Searching the report . . . . . . . . . . . . . . . . . . . . . . . . . . . . . . . . . . . . . . . . . . . . . . . . 122
10 Using SQL/MF: Inspecting the monitor tables . . . . . . . . . . . . . . . . . . . . . . . . . . . . . . . . . . . 12310.1 Examining the Exception Log table . . . . . . . . . . . . . . . . . . . . . . . . . . . . . . . . . . . . 12310.2 Exception Log Reports available . . . . . . . . . . . . . . . . . . . . . . . . . . . . . . . . . . . . . . 12410.3 Examining the Benchmark table . . . . . . . . . . . . . . . . . . . . . . . . . . . . . . . . . . . . . . . 12510.4 Benchmark Reports available . . . . . . . . . . . . . . . . . . . . . . . . . . . . . . . . . . . . . . . . 12610.5 Examining the Package Statistics . . . . . . . . . . . . . . . . . . . . . . . . . . . . . . . . . . . . . 12710.6 Package Statistic Reports available . . . . . . . . . . . . . . . . . . . . . . . . . . . . . . . . . . . . 12810.7 Examining the Statement Statistics . . . . . . . . . . . . . . . . . . . . . . . . . . . . . . . . . . . . 12910.8 Statement Statistic Reports available . . . . . . . . . . . . . . . . . . . . . . . . . . . . . . . . . . . 13010.9 System Monitor Reports . . . . . . . . . . . . . . . . . . . . . . . . . . . . . . . . . . . . . . . . . . . . . 132
10.9.1 Session Summary Report . . . . . . . . . . . . . . . . . . . . . . . . . . . . . . . . . . . . . 13210.9.2 LUW COUNTER Reports . . . . . . . . . . . . . . . . . . . . . . . . . . . . . . . . . . . . . 13310.9.3 IO COUNTER Report . . . . . . . . . . . . . . . . . . . . . . . . . . . . . . . . . . . . . . . . 13410.9.4 Lock Request Block COUNTER Report . . . . . . . . . . . . . . . . . . . . . . . . . . 13510.9.5 COUNTER Summary Report . . . . . . . . . . . . . . . . . . . . . . . . . . . . . . . . . . 13610.9.6 Extended Counter Report . . . . . . . . . . . . . . . . . . . . . . . . . . . . . . . . . . . . . 13710.9.7 Dbspace Buffer Usage Report . . . . . . . . . . . . . . . . . . . . . . . . . . . . . . . . . 13810.9.8 Storage Pool Buffer Usage Report . . . . . . . . . . . . . . . . . . . . . . . . . . . . . . 13910.9.9 DBSPACE Usage Report . . . . . . . . . . . . . . . . . . . . . . . . . . . . . . . . . . . . . 14010.9.10 DBEXTENT Usage Report . . . . . . . . . . . . . . . . . . . . . . . . . . . . . . 14110.9.11 DB2/VSE Log Usage Report . . . . . . . . . . . . . . . . . . . . . . . . . . . . 14210.9.12 User Status Report . . . . . . . . . . . . . . . . . . . . . . . . . . . . . . . . . . . . 14310.9.13 Lock Contention Report . . . . . . . . . . . . . . . . . . . . . . . . . . . . . . . . 144

10.9.14 Checkpoint Delay Report . . . . . . . . . . . . . . . . . . . . . . . . . . . . . . . 14510.9.15 Connections Report . . . . . . . . . . . . . . . . . . . . . . . . . . . . . . . . . . . 146
11 Using SQL/MF: Printing the monitor tables . . . . . . . . . . . . . . . . . . . . . . . . . . . . . . . . . . . . . 14711.1 Printing from the User Interface . . . . . . . . . . . . . . . . . . . . . . . . . . . . . . . . . . . . . . . 14711.2 Printing the Statement Monitor Tables using SQLCSPRT . . . . . . . . . . . . . . . . . . 14711.3 SQLCSPRT Example . . . . . . . . . . . . . . . . . . . . . . . . . . . . . . . . . . . . . . . . . . . . . . . 149
12 The Catalog Navigator . . . . . . . . . . . . . . . . . . . . . . . . . . . . . . . . . . . . . . . . . . . . . . . . . . . . 15112.1 Catalog Lists . . . . . . . . . . . . . . . . . . . . . . . . . . . . . . . . . . . . . . . . . . . . . . . 15112.2 Related Catalog Lists . . . . . . . . . . . . . . . . . . . . . . . . . . . . . . . . . . . . . . . . 15212.3 Processing the catalog list . . . . . . . . . . . . . . . . . . . . . . . . . . . . . . . . . . . . . 154
13 Using SQL/MF: Host Command Interface . . . . . . . . . . . . . . . . . . . . . . . . . . . . . . . . . . . . . . 15513.1 Issuing Host Commands . . . . . . . . . . . . . . . . . . . . . . . . . . . . . . . . . . . . . . . . . . . . 15513.2 DB2/VSE Operator Commands . . . . . . . . . . . . . . . . . . . . . . . . . . . . . . . . . . . . . . . 15513.3 MONITOR Commands . . . . . . . . . . . . . . . . . . . . . . . . . . . . . . . . . . . . . . . . . . . . . . 156
13.3.1 AUTOPREP . . . . . . . . . . . . . . . . . . . . . . . . . . . . . . . . . . . . . . . . . . . . . . . . 15613.3.2 BENCH . . . . . . . . . . . . . . . . . . . . . . . . . . . . . . . . . . . . . . . . . . . . . . . . . . . 15613.3.3 CONFIGURE . . . . . . . . . . . . . . . . . . . . . . . . . . . . . . . . . . . . . . . . . . . . . . . 15713.3.4 CQCOUNT . . . . . . . . . . . . . . . . . . . . . . . . . . . . . . . . . . . . . . . . . . . . . . . . 15713.3.5 DISABLE | ENABLE DBSPACE . . . . . . . . . . . . . . . . . . . . . . . . . . . . . . . . 15813.3.6 DISABLE | ENABLE PACKAGE . . . . . . . . . . . . . . . . . . . . . . . . . . . . . . . . 15913.3.7 DISABLE ? . . . . . . . . . . . . . . . . . . . . . . . . . . . . . . . . . . . . . . . . . . . . . . . . 15913.3.8 FREE . . . . . . . . . . . . . . . . . . . . . . . . . . . . . . . . . . . . . . . . . . . . . . . . . . . . . 16013.3.9 FORCE ALL . . . . . . . . . . . . . . . . . . . . . . . . . . . . . . . . . . . . . . . . . . . . . . . 16013.3.10 HOLD . . . . . . . . . . . . . . . . . . . . . . . . . . . . . . . . . . . . . . . . . . . . . . 16013.3.11 RESET_RUNSTATS . . . . . . . . . . . . . . . . . . . . . . . . . . . . . . . . . . 16013.3.12 RESUME . . . . . . . . . . . . . . . . . . . . . . . . . . . . . . . . . . . . . . . . . . . 16013.3.13 SHOW AGENT . . . . . . . . . . . . . . . . . . . . . . . . . . . . . . . . . . . . . . . 16013.3.14 SHOW IDBSPUSE . . . . . . . . . . . . . . . . . . . . . . . . . . . . . . . . . . . . 16113.3.15 STATS . . . . . . . . . . . . . . . . . . . . . . . . . . . . . . . . . . . . . . . . . . . . . 16113.3.16 SUSPEND . . . . . . . . . . . . . . . . . . . . . . . . . . . . . . . . . . . . . . . . . . 16113.3.17 RECORDER commands . . . . . . . . . . . . . . . . . . . . . . . . . . . . . . . 16213.3.18 RECORDER on-demand commands . . . . . . . . . . . . . . . . . . . . . . 163
13.4 Using SQLMFCMD . . . . . . . . . . . . . . . . . . . . . . . . . . . . . . . . . . . . . . . . . . . . . . . . 164
14 Statement Recording Facility . . . . . . . . . . . . . . . . . . . . . . . . . . . . . . . . . . . . . . . . . . . . . . . 16514.1 Description . . . . . . . . . . . . . . . . . . . . . . . . . . . . . . . . . . . . . . . . . . . . . . . . . . . . . . . 16514.2 Space estimates . . . . . . . . . . . . . . . . . . . . . . . . . . . . . . . . . . . . . . . . . . . . . . . . . . . 169
14.2.1 Data space Space estimates . . . . . . . . . . . . . . . . . . . . . . . . . . . . . . . . . . . 16914.2.2 File Space estimates . . . . . . . . . . . . . . . . . . . . . . . . . . . . . . . . . . . . . . . . . 169
14.3 Using the Recorder Extract function . . . . . . . . . . . . . . . . . . . . . . . . . . . . . . . . . . . . 17014.4 Printing a Recorder Extract . . . . . . . . . . . . . . . . . . . . . . . . . . . . . . . . . . . . . . . . . . 17314.5 Recorder Commands . . . . . . . . . . . . . . . . . . . . . . . . . . . . . . . . . . . . . . . . . . . . . . . 17514.6 Recording: Operational notes . . . . . . . . . . . . . . . . . . . . . . . . . . . . . . . . . . . . . . . . . 175
15 Lockwait Recording Facility . . . . . . . . . . . . . . . . . . . . . . . . . . . . . . . . . . . . . . . . . . . . . . . . . 17715.1 Description . . . . . . . . . . . . . . . . . . . . . . . . . . . . . . . . . . . . . . . . . . . . . . . . . . . . . . . 17715.2 Lockwait Recorder Setup . . . . . . . . . . . . . . . . . . . . . . . . . . . . . . . . . . . . . . . . . . . . 17815.3 Configuring the Lockwait Recorder . . . . . . . . . . . . . . . . . . . . . . . . . . . . . . . . . . . . 17815.4 Inspecting Recorded Lockwaits . . . . . . . . . . . . . . . . . . . . . . . . . . . . . . . . . . . . . . . 17815.5 Recorded Lockwait space estimates . . . . . . . . . . . . . . . . . . . . . . . . . . . . . . . . . . . 178
16 AutoPrep Facility . . . . . . . . . . . . . . . . . . . . . . . . . . . . . . . . . . . . . . . . . . . . . . . . . . . . . . . . . 17916.1 Functional description . . . . . . . . . . . . . . . . . . . . . . . . . . . . . . . . . . . . . . . . . . . . . . 17916.2 Operation . . . . . . . . . . . . . . . . . . . . . . . . . . . . . . . . . . . . . . . . . . . . . . . . . . . . . . . . 18016.3 Installation . . . . . . . . . . . . . . . . . . . . . . . . . . . . . . . . . . . . . . . . . . . . . . . . . . . . . . . 18116.4 Configuring the AutoPrep facility . . . . . . . . . . . . . . . . . . . . . . . . . . . . . . . . . . . . . . 18216.5 Security Considerations . . . . . . . . . . . . . . . . . . . . . . . . . . . . . . . . . . . . . . . . . . . . . 183

16.6 Restrictions . . . . . . . . . . . . . . . . . . . . . . . . . . . . . . . . . . . . . . . . . . . . . . . . . . . . . . . 183
17 Monitor Tables . . . . . . . . . . . . . . . . . . . . . . . . . . . . . . . . . . . . . . . . . . . . . . . . . . . . . . . . . . . 18517.1 SQL Statements . . . . . . . . . . . . . . . . . . . . . . . . . . . . . . . . . . . . . . . . . . . . . . . . . . . 18517.2 Statement Monitor Log Table . . . . . . . . . . . . . . . . . . . . . . . . . . . . . . . . . . . . . . . . . 18717.3 System Monitor Tables . . . . . . . . . . . . . . . . . . . . . . . . . . . . . . . . . . . . . . . . . . . . . . 189
18 Customizing SQL/MF . . . . . . . . . . . . . . . . . . . . . . . . . . . . . . . . . . . . . . . . . . . . . . . . . . . . . 19918.1 Writing log report files . . . . . . . . . . . . . . . . . . . . . . . . . . . . . . . . . . . . . . . . . . . . . . . 19918.2 Writing print report files . . . . . . . . . . . . . . . . . . . . . . . . . . . . . . . . . . . . . . . . . . . . . 20218.3 Writing a CONNECT exit for the Statement Monitor . . . . . . . . . . . . . . . . . . . . . . . 203
19 User Attached Process Facility . . . . . . . . . . . . . . . . . . . . . . . . . . . . . . . . . . . . . . . . . . . . . . 20519.1 Purpose . . . . . . . . . . . . . . . . . . . . . . . . . . . . . . . . . . . . . . . . . . . . . . . . . . . . . . . . . 20519.2 UAPs called by the System Monitor . . . . . . . . . . . . . . . . . . . . . . . . . . . . . . . . . . . . 20619.3 UAPs called by the Statement Monitor . . . . . . . . . . . . . . . . . . . . . . . . . . . . . . . . . . 20719.4 Description of UAP input variables . . . . . . . . . . . . . . . . . . . . . . . . . . . . . . . . . . . . . 208
19.4.1 SQLMUAP1: DB2/VSE performance counters . . . . . . . . . . . . . . . . . . . . . 20819.4.2 SQLMUAP2: Storage pool counters . . . . . . . . . . . . . . . . . . . . . . . . . . . . . 20919.4.3 SQLMUAP3: Active agent status . . . . . . . . . . . . . . . . . . . . . . . . . . . . . . . 21019.4.4 SQLMUAP4: Locked agent status . . . . . . . . . . . . . . . . . . . . . . . . . . . . . . . 21419.4.5 SQLMUAP5: DB2/VSE Log usage . . . . . . . . . . . . . . . . . . . . . . . . . . . . . . 21519.4.6 SQLMUAP6: DB2/VSE Connections . . . . . . . . . . . . . . . . . . . . . . . . . . . . 21619.4.7 SQLMUAP7: Checkpoint delays . . . . . . . . . . . . . . . . . . . . . . . . . . . . . . . . 21719.4.8 SQLMUAPX: Agent restricting . . . . . . . . . . . . . . . . . . . . . . . . . . . . . . . . . 218
20 Utility Programs . . . . . . . . . . . . . . . . . . . . . . . . . . . . . . . . . . . . . . . . . . . . . . . . . . . . . . . . . . 21920.1 Printing the agents active at a DB2 abend . . . . . . . . . . . . . . . . . . . . . . . . . . . . . . . 219
21 Application Program Interfaces . . . . . . . . . . . . . . . . . . . . . . . . . . . . . . . . . . . . . . . . . . . . . . 22121.1 Issuing an operator command from an application . . . . . . . . . . . . . . . . . . . . . . . . 221
22 Operational Notes . . . . . . . . . . . . . . . . . . . . . . . . . . . . . . . . . . . . . . . . . . . . . . . . . . . . . . . . 22322.1 SQLCSI . . . . . . . . . . . . . . . . . . . . . . . . . . . . . . . . . . . . . . . . . . . . . . . . . . . . . . . . . 22322.2 Shutdown considerations . . . . . . . . . . . . . . . . . . . . . . . . . . . . . . . . . . . . . . . . . . . . 22322.3 DRDA considerations . . . . . . . . . . . . . . . . . . . . . . . . . . . . . . . . . . . . . . . . . . . . . . . 22322.4 Starting a DB2/VSE trace . . . . . . . . . . . . . . . . . . . . . . . . . . . . . . . . . . . . . . . . . . . . 22422.5 DB2/VSE Release Migrations . . . . . . . . . . . . . . . . . . . . . . . . . . . . . . . . . . . . . . . . 224
23 SQL/MF Messages . . . . . . . . . . . . . . . . . . . . . . . . . . . . . . . . . . . . . . . . . . . . . . . . . . . . . . . 22523.1 SQLCSI Messages . . . . . . . . . . . . . . . . . . . . . . . . . . . . . . . . . . . . . . . . . . . . . . . . 22523.2 SQLMFSRV Messages . . . . . . . . . . . . . . . . . . . . . . . . . . . . . . . . . . . . . . . . . . . . . 22923.3 SQLCS Messages . . . . . . . . . . . . . . . . . . . . . . . . . . . . . . . . . . . . . . . . . . . . . . . . . 23023.4 SQLCSLST Messages . . . . . . . . . . . . . . . . . . . . . . . . . . . . . . . . . . . . . . . . . . . . . 23423.5 SQLMFM Messages . . . . . . . . . . . . . . . . . . . . . . . . . . . . . . . . . . . . . . . . . . . . . . . 23523.6 SQLCSCRW Messages . . . . . . . . . . . . . . . . . . . . . . . . . . . . . . . . . . . . . . . . . . . . 23623.7 Various Messages . . . . . . . . . . . . . . . . . . . . . . . . . . . . . . . . . . . . . . . . . . . . . . . . . 237
23.7.1 Messages issued by the SQLCSTMT installation program . . . . . . . . . . . . 23723.7.2 Messages issued by the Access Control Facility . . . . . . . . . . . . . . . . . . . 23723.7.3 Messages issued by Connect Control . . . . . . . . . . . . . . . . . . . . . . . . . . . 23723.7.4 Messages issued by the SQL/MF Initiator . . . . . . . . . . . . . . . . . . . . . . . . . 238
24 Glossary . . . . . . . . . . . . . . . . . . . . . . . . . . . . . . . . . . . . . . . . . . . . . . . . . . . . . . . . . . . . . . . 239


SQL/Monitoring Facility Page 1
1 Functional descriptionSQL Monitoring Facility (“SQL/MF”) is a real-time SQL execution monitor for DB2/VSE.
It provides database administrators with a window into running DB2/VSE systems. The facilitypermanently records the global execution status of the database systems and maintains execution-time information on all active SQL statements, users and packages.
SQL/MF provides following classes of monitoring:
System Monitoring
The System Monitor records the global system status of all monitored databases.
Statement Monitoring
The Statement Monitor maintains the execution characteristics for each SQL statementrunning in the monitored databases.
Statement Statistics
For each statement in each executed DB2/VSE package, the Statement Monitor records itsresource usage and access path in a DB2/VSE table.
Package statistics
For each executed DB2/VSE package, the Statement Monitor records its resource usage in aDB2/VSE table.
Statement Logging
An SQL statement is stored in the Monitor Log table, when it exceeds the resource consumptionlimits, defined by the installation in the Monitor configuration member.
Statement Benchmarking
When a package has been designated for benchmarking, all its SQL statements with theirresource usage and access path, are stored in the Monitor Benchmark Log table.
Statement Recording
When recording has been enabled, all SQL statements executed during the recording period arestored, along with their execution characteristics into a recorder file, which is a VSAM cluster.
Page 2 SQL/Monitoring Facility

SQL/Monitoring Facility Page 3
1.1 System Monitoring
The SQL/MF System Monitor runs in the SQL/MF service partition. The facility continuallymonitors the DB2/VSE environment at an installation defined sampling interval and saves theresulting data into the System Monitor tables.
The monitor has two monitoring processes: the main monitoring process monitors the entireDB2/VSE environment; the buffer monitoring process monitors activity within the DB2/VSEbuffer pool and maintains buffer access distribution information. A separate sampling interval canbe provided for each process. A sampling is also performed when DB2/VSE initiates a databasecheckpoint.
The facility is able to monitor up to 32 databases, 255 storage pools per database and anunlimited number of DBspaces concurrently.
At each monitor sample and for each database monitored, data is obtained and saved. Thecumulative counters obtained from DB2/VSE are stored as interval related values, that is, asindicators of DB2/VSE resource consumption during the monitoring interval. Following data areobtained:
General DB2/VSE Performance Data
SQL/MF obtains the DB2/VSE "COUNTER" data from the DB2 control blocks and computes theresource usage during the interval. Following items are added to the regular DB2/VSE statistics:
- the page and directory buffer hit ratios- the average duration of I/O requests- the average agent dispatch delay (monitors the effect of changes to the DB2 initialization
parameter DISPBIAS)- the VSE performance indicators: CPU utilization and paging load
Buffer Pool Monitoring
SQL/MF records the usage that individual DBSPACES and DBextents are making of the DB2/VSEbuffer pool and provides information on the distribution of database accesses among individualDBspaces and storage pools. These data are obtained at the "buffer monitoring" interval andwritten to the monitor tables when the "main monitoring" interval expires. Since monitoring verylarge buffer pools may induce additional overhead when inspecting the DB2/VSE buffer controltables, the facility must be specifically enabled.
DB2 Package Cache Monitoring
For each monitor interval, following data are recorded:
- the number of entries defined in the package cache- the number of package cache entries in use- the number of package cache entries in use for active agents- the total number of packages monitored thus far

Page 4 SQL/Monitoring Facility
Dbspace Usage Monitoring
If requested in the configuration file, each DBSPACE in each database is monitored for physicalDASD space usage within its header, data and index pages. The related SHOW DBSPACEcommands are performed at the day and the time specified in the same configuration file.
Storage Pool Monitoring
At each interval, physical DASD space usage is monitored for each pool and eventual short onstorage conditions are recorded.
DB2/VSE LOG Usage
At each interval, SQL/MF saves the Logfile space consumption during that interval.
User Activity
At each interval, SQL/MF logs the names and the wait state of all active users.
DB2/VSE Lock Monitoring
At each interval, SQL/MF obtains detailed information about users in LOCK wait state andprovides information about the locks being held.
Connection Monitoring
At each interval, data is obtained about the state of the DB2/VSE connections and agents.
Checkpoint Monitoring
For each monitor interval, following data are recorded, if appropriate:
- the number of checkpoints- the number of checkpoint delays- the average duration of a checkpoint- the average duration of a checkpoint delay
Checkpoint Delay Monitoring
At each interval, SQL/MF checks whether the checkpoint agent waits on termination of long-running DBSS calls and inhibits new LUW in order to initiate the checkpoint. The list of usersactive at this time is included in the report.
DB2/VSE Session Performance
The DB2/VSE performance statistics are kept on an daily basis and retained for a specifiednumber of days. The System Monitor also keeps a Session table containing the DB2 counters,summarized per database and per day. This table is never purged. It allows to perform systemmonitoring on a long-term basis.

SQL/Monitoring Facility Page 5
1.2 Statement Monitoring
The Statement Monitor runs partly in the DB2/VSE database server and partly in the SQL/MFservice partition. These components continuously record the execution characteristics of eachSQL statement, both dynamic and static (compiled). For each statement in execution, theStatement Monitor maintains following data:
- the DB2/VSE agent and userid executing the statement- the VSE jobname - the originating location i.e. the CICS terminal name of the batch partition ID- the name of the DB2/VSE package containing the statement- the section number of the statement within the package- the statement type (prepare, open, fetch ...)- the text of the statement (also for compiled statements)- the contents of the host variables used by the statement- the isolation level (repeatable read, uncommitted read or cursor stability)- the package’s blocking attribute- the statement start date and start time- the statement end date and end time- the statement elapsed time- the name of the DBspace(s) and table(s) being accessed by the statement- the name of the index(es) being used, if any- the selectivity of index access- the CPUtime used by the statement- the total time spent by the statement in lock wait- the total time spent in I/O wait- the total time spent in communications wait- the number of RDS calls executed by the statement- the number of DBSS calls executed- the number of lock escalations during the statement- the number of lock requests resulting in wait- the number of deadlocks during the statement- the number of rows processed by the statement- the number of buffer lookups performed by the statement- the number of data pages read and written- the number of directory buffer lookups- the number of directory blocks read and written- the number of log pages read and written- the total number of I/O requests issued- the number of buffer lookups in internal DBspaces- the number of calls to the DB2/VSE dispatcher
The above statistics are kept at the statement level, the section level (for cursor-basedstatements) and the package level.
The monitor keeps these data in a VSE common monitor data space which is shared with theSQL/MF components that exploit the monitor’s data. The data space can accommodate 32databases on a single VSE system. At termination of the statement, the monitor data in the dataspace are transferred to the statements statistics array.

Page 6 SQL/Monitoring Facility

SQL/Monitoring Facility Page 7
1The text of the package statements is initially inserted during installation of the Monitor. Subsequentpackage prepping is sensed by the Monitor and the modified statement text is inserted at the first executionof the modified package. The same applies to new packages.
2Depending on the SECTION_STATS statement in the SQLMF CONFIG file.
1.3 Statement Statistics
For each section in each DB2/VSE package, the monitor automatically maintains the followingdata in the SQLCS_SQL_STMNTS table:
- the name of the database- the name of the DB2/VSE package containing the statement- the section number of the statement- the plan number of the access within a section, if the section accesses more than one table or
if the statement participates in a referential constraint- the text of the statement1- the name of all DBspaces, tables and indexes accessed by the statement- the selectivity of the indexes used- the statement’s execution frequency (times sampled)- the package’s isolation level- the package’s blocking attribute- the last or total2 resource usage of the statement:
- the CPUtime used- the total time spent in lock wait- the total time spent in I/O wait- the total time spent in communications wait- the number of RDS calls executed- the number of DBSS calls executed- the number of lock escalations during the statement- the number of lock requests resulting in wait- the number of deadlocks during the statement- the number of rows processed by the statement- the number of buffer lookups by the statement- the number of data pages read- the number of data pages written- the number of directory buffer lookups- the number of directory blocks read- the number of directory blocks written- the number of log pages read- the number of log pages written- the total number of I/O requests issued- the number of buffer lookups in internal DBspaces- the number of calls to the DB2/VSE dispatcher

Page 8 SQL/Monitoring Facility
Notes
(1) The initial SQL/MF product installation process creates the SQL_STMNTS table andpopulates it with the text of all existing packages, by unloading them into the table.
(2) The SQL statement text in the SQL_STMNTS table will be automatically updated duringDB2/VSE functions that modify the statement text, that is, during package prepping andreload.
(3) A “section” represents a single SQL statement, or a group of related cursor-based statements.Moreover, SQL/MF provides a package initialization section (numbered -1) to record theprocessing cost associated with package loading, run privilege checking and eventual auto-reprepping.
(4) If requested, the monitor will maintain the above data for each modification level of thepackage. A new modification level is automatically built when the package is prepped orreloaded. The latest modification level is numbered 0, levels -1, -2 etc. indicate the previousmodification levels. The monitor configuration file allows to specify the number of packagemodification levels to keep. Using the package modification levels, it is possible to monitor thechanges in access path and resource usage that result from package modifications.
(5) For performance reasons, the statement statistics are accumulated in memory and stored inthe DB2/VSE table at regular time intervals, as defined in the STAT_FREQ parameter of themonitor configuration file.

SQL/Monitoring Facility Page 9
3Package termination is sensed when a COMMIT or ROLLBACK statement is issued or when theapplication is terminated by DB2/VSE.
1.4 Package statistics
When a package terminates3, the Statement Monitor performs end-of-package logging. Thisconsists in storing the accumulated statistics for all statements in the package into the CommandMonitor Log table. The end-of-package statistics are maintained in the Log table as one row perday, per user and per package. The package statistics include following data:
- the package execution frequency- the CPUtime used by the package- the total time spent in lock wait- the total time spent in I/O wait- the total time spent in communications wait- the number of RDS calls executed- the number of DBSS calls executed- the number of lock escalations during the package- the number of lock requests resulting in wait- the number of deadlocks during the package- the number of buffer lookups by the package- the number of data pages read- the number of data pages written- the number of directory buffer lookups- the number of directory blocks read- the number of directory blocks written- the number of log pages read- the number of log pages written- the total number of I/O requests issued- the number of buffer lookups in internal DBspaces- the number of calls to the DB2/VSE dispatcher
For performance reasons, the statement statistics are accumulated in memory and stored in theDB2/VSE table at regular time intervals, as defined in the STAT_FREQ parameter of the monitorconfiguration file. The package statistics provide extensive information that can be used foraccounting purposes.

Page 10 SQL/Monitoring Facility

SQL/Monitoring Facility Page 11
1.5 Additional Monitor Services
In addition to its basic monitoring function, the Statement Monitor provides a number ofmonitoring services, which must be requested by coding appropriate control statements in theMonitor configuration file.
1.5.1 Statement Logging
If requested, the Monitor records SQL statements in its exception Log table under thefollowing conditions:
- the statement exceeds a resource consumption limit defined as- a maximum number of DB2/VSE buffer lookups- a maximum number of I/O requests- a maximum response (wall-clock) time- a maximum lock wait time
- the statement executes using DBSPACE scan- the statement executes with the repeatable read isolation level- the statement is in lockwait during a specified period of time- the agent is idle during a specified period of time- the agent causes one or more log escalates during its execution- the agent has been in checkpoint wait during its execution- the statement ends with an SQLCODE- the statement executes without blocking- the statement executes in dynamic mode (QMF, ISQL or DBSU statements for example)
This type of logging is called exception logging. Within a single execution, a statement maybe logged multiple times, for each exception caused.
1.5.2 Benchmarking
DB2/VSE users or packages can be defined as subject to benchmarking. All SQL statementsexecuted by these users or packages are automatically stored into the Monitor Log table. Thelog then provides a detailed description of the ‘behaviour’ of these packages. This type oflogging is called benchmark logging. The monitor distinguishes between specific (BENCHPROGRAM XYZ) and generic benchmarking (BENCH PROGRAM *). For a description of theBENCH command, see page 156.
NoteApplication benchmarking is also possible, with less overhead, using the recording facility,more specifically using the RECORDER START command (see page 163).
1.5.3 Application Statement Recording
Application Statement Recording is a sophisticated tracing facility that notes the executioncharacteristics of all executing SQL statements into a recorder file. In order to achieveacceptable performance, recording in the database server is done into a VSE data space. Anasynchronous component executing in the SQL/MF service partition, stores the recorded datafrom the data space into the recorder file. The Statement Recording facility is described onpage 165.
Recording can be enabled on a chronological basis using the RECORDER FROM - TOstatement or “on demand” using the RECORDER START command (see page 163).

Page 12 SQL/Monitoring Facility
1.5.4 Lockwait Recording
Lockwait Recording is part of the Recording facility. If requested, it registers all lockwait eventsin the recorder file. The lockwait record stores the name of the locked and locking user andpackage, the name of the wanted DBSPACE and the characteristics of the lock.
As the facility registers all lockwaits in chronological order, it may help in understanding andcorrecting locking problems.
1.5.5 Notification
The notification facility sends a message to a designated user (the database administrator forexample) when:
- an SQL statement exceeds a resource consumption limit defined as- a maximum number of DB2/VSE buffer lookups- a maximum number of I/O requests- a maximum SQL cost, if a dynamic statement
- an SQL statement executes with the repeatable read isolation level- an SQL statement exceeds a defined response-time- an SQL session (LUW) is idle for a defined period- an SQL statement is in the lockwait state for a defined period- a dynamic statement exceeds a defined SQL cost
Notification does not occur more than once in a given logical unit of work.
1.5.6 Governor
The Governor facility controls the database resource consumption by users and packages.The facility restricts users and packages by issuing a DB2/VSE force command, whenever arestricting condition is encountered. A restricting condition is defined as the maximumamount of system resources, a user or a package section is allowed to consume. Restrictionscan be defined in terms of:
- a maximum number of DB2/VSE buffer lookups- a maximum number of I/O requests- a maximum statement response time- a maximum lockhold time- a maximum idle time, while in LUW- a maximum number of writes to the DB2 log
INCLUDE and EXCLUDE statements define the users and packages, subjected to restricting.The restriction facility can be enabled for all users and all packages, both static and dynamic.
SQL/Monitoring Facility Page 13
1.5.7 AutoRebind Facility
With the AUTO_REBIND option stated in the SQL/MF configuration file, all CREATE INDEXstatements will be recorded and a package rebind will be requested (at the end of the monitorsession) for all packages that depend on the tables for which a new index has been created.The purpose of this facility is to ensure that existing packages benefit from the newly createdindexes.

Page 14 SQL/Monitoring Facility
1.5.8 AutoPrep Facility
The AutoPrep facility reduces the cost of dynamic SQL statement execution. An installationshould consider using the facility, when intensive dynamic SQL is performed. PC databaseaccess, e-business or ERP applications usually execute in dynamic SQL mode, thus causinga considerable CPU overhead and catalog contention. The AutoPrep facility is described onpage 179 of this manual.
1.5.9 Dynamic alias
When compiled DB2 applications wish to execute a statement in dynamic mode, tableprivileges are required for all users of the application, which is often undesirable. The dynamicalias facility provides a solution. See page 80.
1.5.10 CONNECT Screening
DB2/VSE calls a user exit (ARIUXIT) whenever a user connects to the database server.However, ARIUXIT must be written in Assembler and be linked with the DB2/VSE codewhenever created or modified. Moreover, since the exit is called by the DB2/VSE ResourceAdapter at the client side of the connection, the exit is not fully available in the DRDAenvironment.
The SQL/Monitoring Facility provides an easier-to-use alternative for ARIUXIT. When apackage issues the DB2/VSE CONNECT statement, SQL/MF invokes the SQLCSUXT PROC,if such member is found in the SQL/MF library. Contrarily to ARIUXIT, SQLCSUXT is written inREXX and does not require a DB2/VSE relink. SQLCSUXT receives the name of the databaseand the CONNECT userids as input arguments. The exit can request to cancel the CONNECTby passing a non-zero returncode. For details on coding a CONNECT exit, see the chapter“Customizing SQL/MF” on page 203.
SQL/Monitoring Facility Page 15
1.6 User Interface
The SQL/MF User Interface component is invoked using the CICS transaction $DBM. Theinterface allows database administrators to examine all data recorded during monitoring.
Using the interface, following data can be obtained:
- The list of running SQL statements with their resource consumption, in textual or graphicalformat. Each running statement can be inspected in detail, and several monitor functions canbe invoked for the statement, such as: - analyzing the statement (if our SQL/CA program product is in the system)- forcing the statement- obtaining lock information- showing the DB2/VSE catalog information for the objects used by the package
- A graphical report of SQL activity in the current DB2/VSE session, summarized per user,per package or per package section and ordered by descending resource consumption.
- Reports of global DB2/VSE system activity, in both textual and graphical format.- Reports of SQL statements logged due to their resource consumption.- Reports of SQL statements benchmarked on user request.- Reports of SQL statements recorded on user request.- Reports of total resource consumption by individual users and packages in the current
DB2/VSE session.- Reports showing the resource consumption, the statement text and the access path for
each SQL statement in each DB2/VSE package.

Page 16 SQL/Monitoring Facility
1.6.1 User Interface to the Statement Monitor
The user interface program allows a database administrator to look into the monitor dataspace for the running SQL statements. The program provides a continuous display of allstatements executing in all monitored databases, with a summary of their characteristics.
The user may interrupt the display, indicate a particular statement with the cursor and requestone of the following functions:
1.6.1.1Statement detail
Provides all the monitor data available for the statement. In addition, the full text of thestatement is shown, with the host variables replaced with their actual contents. Forcompiled SQL statements, the statement text is obtained from the SQLCS_SQL_STMNTStable. The function also shows the name of the primary index used during execution, ifany.
1.6.1.2Statement analysis
The statement can be forwarded to the SQL/Command Analysis program product(provided it has been installed on the system) and the analysis report examinedinteractively.
1.6.1.3Lock analysis
When an agent is in the lock wait state, the function shows all information needed todetermine the nature of the lock and the name of the lock owner (the so-called DB2/VSElock graph). When the agent is not in lockwait, the function shows the locks held by theagent, by issuing the SHOW LOCK USER command. In both cases, the function showsthe names of the DBspaces appearing (by their number) in the DB2/VSE commandoutput.
1.6.1.4Object Information
Object information shows DB2/VSE system catalog information for the DBSPACE, thetable, the index used in the current statement and for all indexes created on the table.
1.6.1.5Statement force
A designated SQL statement (agent) can be terminated (forced) by the user interface.
1.6.1.6Host Commands
Any DB2/VSE command may be executed from the user interface in any of the monitoreddatabases.
The MONITOR command can be used to suspend or resume monitoring, to startapplication tracing, to force DB2/VSE users online / offline and to reconfigure the monitorwithout shutdown. (See page 156 for details).

SQL/Monitoring Facility Page 17
1.6.2 Graphical User Interface to the Statement Monitor
The SQLPULSE function, which is invoked from the $DBM transaction, provides a graphicalrepresentation of DB2/VSE activity by all running statements in all monitored databases. Theprogram shows a bar graph for all running statements with one the following DB2/VSEcounters:
- number of buffer lookups performed by the statement- total number of I/O requests performed by the statement- CPU seconds used by the statement
The SQLPULSE Detail function provides a graphical representation of resource usage by theSQL statement, pointed to by the cursor. The function shows for the current DB2/VSEpackage section:
- the databasename, userid's, package name and package section number- the statement start and elapsed time- the text of the SQL statement being executed (for both static and dynamic statements)- the statement’s access path (name of the index, if any)- a graphical representation of the execution statistics
See page 111 for full details.

Page 18 SQL/Monitoring Facility
1.6.3 The RunStats Interface
In each database server, SQL/MF keeps the total daily consumption for each package section,that is, for each SQL statement executed. Contrarily to the other statement statistics, whichare kept in a table, these statistics always remain in storage for rapid access.
Following counters are kept:
- the total number of buffer lookups performed by the statement- the total number of I/O’s performed by the statement- the total CPU time consumed by the statement
The RunStats function, which is invoked from the user interface program allows to examinethese statistics in an hierarchical manner.
Initially the RunStats utility shows the resource consumption summarized by DB2 userid, butsummarizing by package name can be requested.
On all RunStats reports, the Detail function is used to explore the consumption by a givenuser or package.
- In a user list, detail shows the packages executed by a designated user.- In a package list, detail shows all executed sections (statements) of a designated
package.- In a package section list, detail shows the complete statistics, the statement text and the
index used for the designated section.
All the above lists are ordered by descending resource consumption. As a default, ordering isby buffer-lookups. But ordering by CPU usage or by I/O load can be achieved using the PFkeyinterface.
For a detailed description of the RunStats program, please refer to page 108.

SQL/Monitoring Facility Page 19
1.6.4 Saving the RunStats
By coding the RETAIN_RUNSTATS option in SQLMF CONFIG file and by creating the savedRunstats table, session runstats can be retained for a user specified number of days. TheRunstats user interface is used to display the saved runstats by period. If the facility is notenabled, runstats are kept in storage for the current day and cleared at midnight or atdatabase restart. The Runstats table can be consulted using the regular RunStats program,described on page 108.
1.6.5 User Interface to the Statement Monitor Tables
The Reports function of the $DBM transaction provides access to the Statement Monitortables. The function is used to consult:
- the exception log entries- the benchmark log entries- the statement statistics- the package statistics
When invoked, the program displays a menu of Monitor reports. From the menu, the userselects the report class (exception log, statement statistics ..) and the particular report withinthat class. The individual reports show the selected table data:
- in chronological order- by username- by package name- by index usage- by I/O consumption- by CPU consumption- by lockwait time- by logging reason- ordered by user defined criteria - etc..
All the above reports are generated using a table editor, that comes with the product.
All the reports can be requested for the current day or for a specified chronological range. Theuser may add his own SELECT clauses to the standard search conditions.
Moreover, the reporting interface has been designed in such a manner, that an installation caneasily add its own log reports to the menu.

Page 20 SQL/Monitoring Facility
1.6.6 User Interface to the System Monitor Tables
The System Monitor function of the user interface provides interactive access to the systemmonitor tables. A menu oriented interface provides access to the following online reports:
- Session Summary Report- SQL COUNTER Reports
- Logical Unit of Work counter report- IO counter report- Lock Request Block counter report- Counter Summary report
- DBspace Buffer Usage Report- Storage Pool Buffer Usage Report- DBspace Usage Report- Storage Pool Usage Report- DB2/VSE Log Usage Report- User Status Report- Lock Contention Report- Checkpoint Delay Report- Connections Report
Each of the above reports may be requested as:
- a detail report providing data for each monitoring interval, - a totals report providing summary values for the monitoring session - an averages reports providing average values for the monitoring session
All the reports are displayed using a monitor table editor, that comes with the product.

SQL/Monitoring Facility Page 21
1.6.7 Graphical User Interface to the System Monitor
The SQLGRAPH function of the user interface provides a graphical image of DB2/VSE activityin a given database by showing a bar graph for the resource items LUW, RDScalls,BUFLOOKs and TOTIO. The program can also provide information about the current use ofthe DB2/VSE buffer pool. See page 105 for more details.
1.6.8 Printing the Monitor tables
The SQLCSPRT program is used to print the following Monitor tables:
- the exception log table entries- the benchmark log table entries- the statement statistics
All the reports can be requested for the current day or for another specified chronologicalrange. The user may add his own SELECT clauses to the standard search conditions.
The print interface has been designed in such a manner, that an installation can easilycustomize the reporting functions.
For a detailed description of the SQL/MF printing facilities, please refer to page 147.
Page 22 SQL/Monitoring Facility
1.7 Customizing
- The operation of the individual monitor components can be controlled by an installationthrough the monitor configuration file SQLMF CONFIG.
- The User Attached Process facility allows an installation to execute its own REXX programsin real-time at different points in the monitoring process.
- An installation is able to add its own interactive or printed reports to the monitor’s reportingfacility.
- Because the results of monitoring are stored in DB2/VSE tables, these data are easilyaccessible to the customer for its own processing needs. (The data in the package statisticstable for example, can be used for accounting purposes).

SQL/Monitoring Facility Page 23
2 SQL/MF Component Description
2.1 Statement Monitor Components
2.1.1 SQLMFINI
SQLMFINI installs the SQL/MF vendor exits SQLMFDOC and SQLMFSVC which dynamicallyinstall SQLCSI in the DB2 partition at the end of DB2/VSE initialization.
2.1.2 SQLCSI
The SQLCSI program contains the SQL/MF statement monitoring logic. The programexecutes in the DB2/VSE database server and dynamically installs itself as an extension ofthe DB2/VSE software. SQLCSI screens all executing SQL statements and maintains theircharacteristics in the monitor data space. SQLCSI maintains execution statistics for allpackages and package statements executed. If requested in the SQLMF CONFIGconfiguration file, following services are provided:
- statement logging- statement benchmarking- statement notification- statement recording
The logging, benchmarking and statistic functions are not executed within SQLCSI itself(because they imply an SQL INSERT to the Log tables). Instead, the logging request ispassed to SQLCS (described in the next paragraph), by means of a communications dataspace. The recording request is passed to SQLCSCRW via the recorder data space.
2.1.3 SQLMFSRV
This program manages the SQL/MF “service partition”. It starts the SQL/MF componentsSQLCS, SQLMFM, SSPLIBR, SQLCSCRW and SQLCSAPS as VSE subtasks. SQLCSCRWand SQLCSAPS are attached only when the recording resp. the autoprep facility have beenenabled in the SQLMF configuration file.

Page 24 SQL/Monitoring Facility
2.1.4 SQLCS
The SQLCS program runs in the SQL/MF service partition. It provides the following functions:
- Write to the Monitor tables on behalf of an SQLCSI request to log or benchmark a givenSQL statement, or to store the statement and package statistics.
- Perform the notification and governor functions.- Call User Attached Processes, if defined.- Perform the package unload function. For existing packages, package unload retrieves
the statement text from the SQL_STMNTS table. For new packages the statement text isobtained by issuing a package UNLOAD request to the database server. The unloaded package is then stored in the SQL_STMNTS table.
- Provide object names to various components.
2.1.5 SQLCSCRW
The Recorder Writer SQLCSCRW is an optional component and runs in the SQL/MF servicepartition. It is active when the SQL/MF recording facility has been enabled. While SQLCSIwrites the recorded data to the recorder data space, the recorder writer transfers these datafrom the data space to the recorder file (a VSAM cluster).
2.1.6 SQLCSAPS
The AutoPrep server SQLCSAPS is an optional component and runs in the SQL/MF servicepartition. It is activated when the AutoPrep facility has been enabled. The component performsDB2 prep for the dynamic statements sent by SQLCSI.
2.1.7 SSPLIBR
The component provides access to the VSE library where SQL/MF has been installed. Theinteractive SQL/MF components need access to various SQL/MF members, such as theSQLMF CONFIG or the HELP files. To avoid reading VSE libraries under CICS, SSPLIBRacts as a library access server for CICS transactions. Moreover, SSPLIBR provides a cachingmechanism for frequently accessed library members.
2.2 System Monitor Component
The SQLMFM program runs in the SQL/MF service partition and periodically samples theglobal DB2/VSE system status by inspecting the data, collected by SQLCSI in the monitordata space. SQLMFM saves these data into the system monitor tables.

SQL/Monitoring Facility Page 25
2.3 User Interface Component $DBM
$DBM is the main user interface program. It is invoked from CICS and displays the list ofexecuting SQL statements. It also acts as a starting point for invoking following components ofthe user interface.
SQLCSLSTis the SQL/MF table editor. It accesses the SQL/MF SQLCS_LOG and SQL_STMNTS tables,using a log report menu. It provides browsing of the benchmark log, the exception log, thestatement statistics, the package statistics and the recorder files.
SQLGRAPHprovides a graphical representation of global DB2/VSE activity within a designated databaseserver.
SQLPULSEprovides a graphical representation of all SQL statements running in the monitored databases.
SQLCSCRXextracts selected data from the statement recorder file
SQLCSCRLextracts selected data from the lockwait recorder file

Page 26 SQL/Monitoring Facility

SQL/Monitoring Facility Page 27
3 Installing SQL/MF
3.1 Software Prerequisites
- DB2 Server for VSE Version 3 Release 5 or higher- VSE/ESA Version 2 Release 2.0 or later
3.2 Pre-installation tasks
3.2.1 Create the SQL/MF library
Create the library where the SQL/MF components will be catalogued, by submitting followingjob stream:
// EXEC LIBR DEFINE SUBLIB=xxxxx.xxxx/*
Notes
- The SQL/MF material requires approximately 50000 library blocks.- If you have other SPR products installed, install SQL/MF in that library. All SPR products
must reside in the same library.- If CA-TopSecret is in use, SQL/MF must be installed in an APF library.
3.2.2 Update LIBDEF and Standard Labels
- Add the SQL/MF library to the PHASE and OBJ SEARCH LIBDEF in your LIBDEF.PROC.- Submit the updated LIBDEFs to the system before continuing installation. The installation
procedures expect that the SQL/MF library is in the current chain.- Ensure that the standard labels have a DLBL for the DB2 files SQLBIND, SQLGLOB and
BINDWKF, as suggested by the DB2 installation guide. Submit the updated labeldefinitions before continuing installation.
3.2.3 Determine the SQL/MF database
The SQL/MF database is the database where the SQL/MF tables will be created. The SQL/MFdatabase should be a dedicated or a lightly loaded database.
If the monitored databases are in different LPAR’s, the SQL/MF tables can be created in eachLPAR. Alternatively, a single SQL/MF database can serve all the VSE systems, provided thatdatabase can be reached via DRDA connect. In the first case, each VSE system will have itsown SQL/MF tables. In the second case, all VSE systems will share the same SQL/MF tables.
RESTRICTION for DB2/VSE releases prior to 5.1
In such systems, the online CICS resource manager (CIRB) does not have the multipleserver support introduced with DB2 5.1. The SQL/MF user interface however will need thissupport to connect to multiple databases, that is, to the monitored database(s) and to theSQL/MF database. Therefore, pre-5.1 installations should define the SQL/MF tables in amonitored database and define that database as the SQL/MF LOG database.

Page 28 SQL/Monitoring Facility
4For example: the SQL/MF table editor reads all the table rows selected by the user into a storagelist and releases the DB2 link. The user browses the table rows from the storage list.
3.2.4 Determine the SQL/MF service partition
Several SQL/MF components run in a service partition which is managed by the SQLMFSRVprogram. The program and all its subtasks run in a static or a dynamic partition. The partitionsize should be 16 MB at least and 32 MB for busy database systems.
The SQLMFSRV components run with RMODE 24 but make extensive use of dynamicGETVIS storage, which is always allocated above the 16 Mb line.
The partition provides services to several SQL/MF components, including the User Interface.Therefore, the partition should be considered as a server. Its VSE priority should be definedaccordingly.
3.2.5 DB2 agent structures for SQL/MF
- The SQL/MF service partition may need up to 3 DB2 agents simultaneously in a givendatabase. In most cases, the SQL/MF database is accessed. Occasionally, otherdatabases are also accessed (e.g. during package unload). Update your NCUSERSparameter accordingly.
- For each user of the interactive SQL/MF services, an additional DB2 link may be neededin CICS. These links are usually to the SQL/MF database but links are done to otherdatabases as well (e.g. to access catalog objects). The online SQL/MF components holdthe database link for a short period only.4

SQL/Monitoring Facility Page 29
3.2.6 Plan the DBspaces needed for SQL/MF
SQL/MF always requires following Dbspaces:
SQLCS_LOG
- The Dbspace contains the exception log table. The table is automatically purged bySQL/MF using the RETAIN parameter in SQLMF CONFIG. The RETAIN parameterspecifies the number of days to keep in the exception log.
- The space needed for the table depends on the exception logging criteria defined inSQLMF CONFIG and on the number of exceptions that actually occur.
- 1024 pages seems an appropriate allocation. - The exception table will need regular reorganization, as rows are inserted and deleted by
timestamp.
SQLCS_SQL_STMNTS
- The Dbspace contains the statement statistics table. The table keeps the monitorstatistics, the statement text and the access path for every static statement ever executed.
- The table has statistics for all databases monitored (the databasename is part of the key).- The space needed for the table depends on the number of packages in use.- The table is never purged (except by DROP PACKAGE).- 8192 pages seems an appropriate allocation. - The table is static and frequent reorganization should not be needed.
SQLMF
- The Dbspace has several system monitoring tables.- A row is inserted in each table at every system monitor interval (which defaults to 5
minutes).- The table is automatically purged by SQL/MF using the SYSMON RETAIN parameter in
SQLMF CONFIG.- The table has statistics for all databases monitored.- 2048 pages seems an appropriate space allocation. - The system monitor Dbspace will need regular reorganization, as rows are inserted and
deleted by timestamp.
Page 30 SQL/Monitoring Facility
Following Dbspaces are optional and required only if the corresponding SQL/MF facility hasbeen installed and enabled.
- The Recorder facility needs the Dbspaces SQLCS_CRX_EXTRACT andSQLCS_CRL_EXTRACT. These extract tables are accessed from the SQL/MF UserInterface, if the user requests to extract recorder data into a table. (The default is toextract into a storage list). The required space depends on the number of recorder entriesextracted. 128 pages should be sufficient.
- The SQLMF_AUTOPREP Dbspace is needed for every database where the AutoPrepfacility has been enabled. The Autoprep table contains a row for each dynamic statementthat has been autoprepped and for each user of an autoprepped statement. Table rowscontain the statement text in a LONG VARCHAR. 1024 pages should be a good startingpoint. Table rows are deleted only if the corresponding statement has not been executedfor 2 months.
- The SQLMF_RUNSTATS Dbspace is needed for the Saved Runstats facility to keep therunstats for the number of days defined in the SQLMF CONFIG RETAIN_RUNSTATSparameter. Statistics for all the monitored databases are kept in the same table and thereis a row for each package section (SQL statement). The table rows are small. Spaceneeded depends on the total number of sections and the RETAIN parameter. 512 pagesseems an appropriate value.
3.2.7 Security Considerations
If an external resource manager is in use, the SQL/MF User Interface should be allowed toissue the CICS system programmer commands INQUIRE PROGRAM and SET PROGRAM.
SQL/Monitoring Facility Page 31
3.3 Install the required components
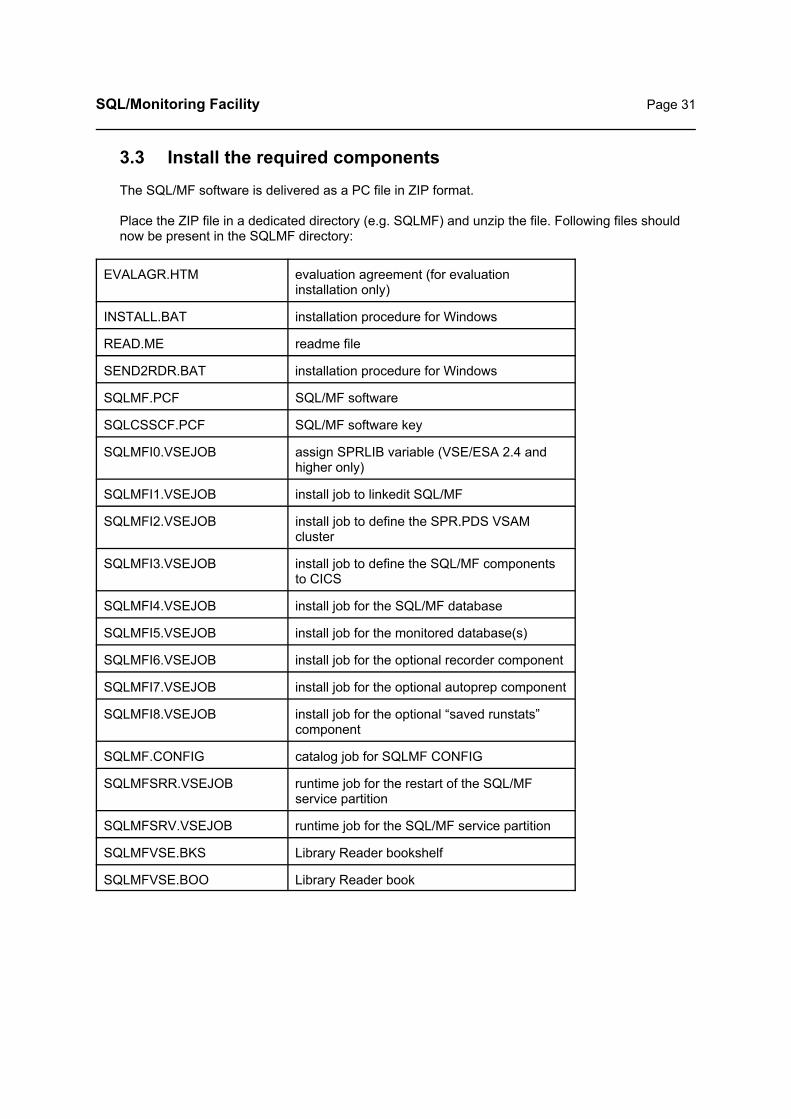
The SQL/MF software is delivered as a PC file in ZIP format.
Place the ZIP file in a dedicated directory (e.g. SQLMF) and unzip the file. Following files shouldnow be present in the SQLMF directory:
EVALAGR.HTM evaluation agreement (for evaluationinstallation only)
INSTALL.BAT installation procedure for Windows
READ.ME readme file
SEND2RDR.BAT installation procedure for Windows
SQLMF.PCF SQL/MF software
SQLCSSCF.PCF SQL/MF software key
SQLMFI0.VSEJOB assign SPRLIB variable (VSE/ESA 2.4 andhigher only)
SQLMFI1.VSEJOB install job to linkedit SQL/MF
SQLMFI2.VSEJOB install job to define the SPR.PDS VSAMcluster
SQLMFI3.VSEJOB install job to define the SQL/MF componentsto CICS
SQLMFI4.VSEJOB install job for the SQL/MF database
SQLMFI5.VSEJOB install job for the monitored database(s)
SQLMFI6.VSEJOB install job for the optional recorder component
SQLMFI7.VSEJOB install job for the optional autoprep component
SQLMFI8.VSEJOB install job for the optional “saved runstats”component
SQLMF.CONFIG catalog job for SQLMF CONFIG
SQLMFSRR.VSEJOB runtime job for the restart of the SQL/MFservice partition
SQLMFSRV.VSEJOB runtime job for the SQL/MF service partition
SQLMFVSE.BKS Library Reader bookshelf
SQLMFVSE.BOO Library Reader book

Page 32 SQL/Monitoring Facility
3.3.1 Preliminary Note
The INSTALL.BAT and SEND2RDR.BAT installation procedures use the “SEND.EXE” toupload the PC files to the POWER reader queue. Ensure that your 3270 emulator supportsSEND (some emulators don’t) and that the EXE is on your active path.
If you cannot use the SEND.EXE, use the upload facilities of your emulator to perform theequivalent of the SEND commands contained in the BAT files, that is:
for the INSTALL.BAT:
SEND SQLCSSCF.PCF (FILE=RDR BINARY LRECL=80 NOUCSEND SQLMF.PCF (FILE=RDR BINARY LRECL=80 NOUC
for the SEND2RDR.BAT:
SEND <filename> (FILE=RDR
3.3.2 Define the SQL/MF library
Skip this step when running a VSE/ESA version lower than 2.4. The job submits a SETPARMSYSTEM statement that is not accepted in older VSE versions.
- Start ICCF PC file transfer (fast path 386) in 3270 emulator session A.- Edit the file SQLMFI0.VSEJOB and complete the SETPARM statement with the appropriate
library name.- Drag and drop the file SQLMFI0.VSEJOB on the SEND2RDR.BAT. This will send and start
the job in class 0 and DISP D. The output listing is in DISP H. - After job completion, check the DISP=H listing for any errors.
3.3.3 Upload the SQL/MF software
- Start ICCF PC file transfer (fast path 386) in 3270 emulator session A.- Execute the INSTALL.BAT by clicking. This will upload 2 jobs to the POWER/VSE reader
queue with DISP D and class 0. The jobs catalog all SQL/MF components into the VSE librarychosen as SQL/MF residence.
- Both jobs contain a // PAUSE statement. This allows to enter a // SETPARM SPRLIB=’...’. Ifrunning VSE/ESA 2.4 or higher, ignore the PAUSE statement, as the SETPARM has beensubmitted by the SQLMFI0.VSEJOB, described above. If running a version older than 2.4,issue the SETPARM statement.
- After job completion, check the DISP=H listing for any errors.
3.3.4 Link the SQL/MF phases
- Start ICCF PC file transfer (fast path 386) in 3270 emulator session A.- In the file SQLMFI1.VSEJOB, assign the SETPARM symbol SPRLIB, specifying the library
where SQL/MF has been uploaded. This is required for VSE versions lower than 2.4. Ifrunning 2.4 or higher, you can delete the SETPARM statement, as it has been submitted bythe SQLMFI0.VSEJOB, described above.
- Drag and drop the file SQLMFI1.VSEJOB on the SEND2RDR.BAT. This will send and startthe job in class 0 and DISP D. The output listing is in DISP H.
- Check the output listing for errors.

SQL/Monitoring Facility Page 33
3.3.5 Define the SQL/MF PDS
- Edit the SQLMFI2.VSEJOB and assign the SETPARM symbols for the job that will create theSPR.PDS. This VSAM cluster is used by several SQL/MF components to maintain operationalparameters. The cluster is relatively small and an allocation of (1000,500) records should beappropriate. Assign following parameters:- CAT: the user catalog for the SPR.PDS cluster- VOLUME: the volume-ID for the CLUSTER DEFINE command- PALLOC: the primary space allocation as a number of records (each record is a 16K
block)- SALLOC: the secondary space allocation as a number of records (each record is a 16K
block)- Start ICCF PC file transfer (fast path 386) in 3270 emulator session A.- Drag and drop the file SQLMFI2.VSEJOB on the SEND2RDR.BAT. This will send and start
the job in class 0 and DISP D. The output listing is in DISP H. - Check the output listing for errors.
Insert following DLBL in the STDLABUP.PROC
// DLBL SPRPDS,’SPR.PDS’,,VSAM,CAT=xxxxxx,DISP=(OLD,KEEP)
3.3.6 Define the SQL/MF components to CICS
- Depending on your CICS level, you may need to update the DFHCSDUP DEFINE statementsin the SQLMFI3.VSEJOB, for example to add TRANSEC specifications for pre-TS CICSsystems. Following transactions of the SQL/MF User Interface are defined:- $DBM : running statement list- $DBC : running statement list with Pfkey actions enabled- $DBP : SQLpulse- $DBR : SQLpulse with Pfkey actions enabled- $DCN : Catalog Navigator- $TR0, $TR1 : trace transactions for software support only
- The SQLMFI3.VSEJOB assumes that the CICS.CSD cluster is in the VSESPUC user catalog.If this not not the case, re-assign the CAT symbol in the SQLMFI3.VSEJOB file.
- Start ICCF PC file transfer (fast path 386) in 3270 emulator session A.- Drag and drop the file SQLMFI3.VSEJOB on the SEND2RDR.BAT. This will send and start
the job in class 0 and DISP D. The output listing is in DISP H. - SQLMFI3 calls DFHCSDUP to define the interactive components to CICS, using the group
SQLMF. - Check the output listing for errors.
Page 34 SQL/Monitoring Facility
3.3.7 Update SQLMF CONFIG
Before continuing install, you should modify the configuration file SQLMF CONFIG and update theLOG DATABASE statement with the name of the database you have chosen as SQL/MFresidence. You may also want to update the default configuration statements provided in thedistributed member with the options of your choice. CONFIG statements that are disabled in thedefault CONFIG have been commented (* in column 1). Removing the * will activate them.
If you enable the NOTIFY statements, you should also update the NOTIFY NAME statement. Fordetails, see page 63.
The default CONFIG contains a global section only. Database specific configuration parametersshould be added using SECTION statements, as described on page 49.
The default SQLMF CONFIG is in the SQL/MF library and in the PC directory with filenameSQLMF.CONFIG.
To update SQLMF CONFIG, you can use your own facilities to directly update SQLMF.CONFIG in the SQL/MF library or you can use the following procedure:
- Modify the PC file SQLMF.CONFIG - Start ICCF PC file transfer (fast path 386) in 3270 emulator session A- Catalog the CONFIG file to the SQL/MF library by dropping SQLMF.CONFIG on the
SEND2RDR.BAT
3.3.8 DB2 userid’s for SQL/MF
The installation steps described below will define the DB2 userid’s SQLMF and SQLMFUSR.
The userid SQLMFUSR has connect privilege only and is used by the interactive SQL/MF components. The SQLMF userid is used by the batch SQL/MF components governor, autoprepand system monitor. The SQLMF userid has DBA authority.
You must define the DB2 passwords for these userid’s as described below. These passwordsmust be the same in all monitored databases. The passwords are recorded in the memberSQLMF.PASSWORD in the SQL/MF library, for later use by SQL/MF. For security reasons, themember keeps the passwords in encrypted format.
SQL/Monitoring Facility Page 35
3.3.9 Perform installation in the SQL/MF database
This installation step will perform the following functions in that database:
- Define the DB2 userid’s SQLMF and SQLMFUSR- Load the SQL/MF packages- Create the SQL/MF tables SQLCS_LOG and SQL_STMNTS- Create the system monitor tables- Unload all user packages, if any, into the SQL_STMNTS table
Edit the PC file SQLMFI4.VSEJOB and assign the following SETPARM symbols
CAT the VSAM catalog for a SAM ESDS workfile (default is VSESPUC)
DB the name of the SQL/MF database
DBAPASS the password of user SQLDBA in this database
MFPASS the password for user SQLMF in this database
USRPASS the password for user SQLMFUSR in this database
LOGPOOL the storage pool number for the log dbspace
LOGPAGEthe number of pages in the log dbspace
STMPOOLthe storage pool number for the SQL_statements dbspace
STMPAGEthe number of pages in the SQL_statements dbspace
SYSPOOLthe storage pool number for the system monitor dbspace
SYSPAGEthe number of pages in the system monitor dbspace
During package reload, a reference is made to the VSESPUC user catalog to define a SAMworkfile in VSAM managed space. Verify that the model cluster is in VSESPUC.
Submit the SQLMFI4.VSEJOB as follows:
- Start ICCF PC file transfer (fast path 386) in 3270 emulator session A.- Drag and drop the file SQLMFI4.VSEJOB on the SEND2RDR.BAT. This will send and start
the job in class 0 and DISP D. The output listing is in DISP H. - The job step that unloads the user packages into the SQL/MF statements table may take
some time, depending on the number of packages in SYSACCESS. Unload progressmessages will be issued on the console.
- Check the output listing for errors.
NoteWhen unloading all user packages into SQL_STMNTS, the SYSACCESS catalog is accessedintensively. To avoid deadlocks with other agents, it is advisable to run SQLMFI4 when DB2activity is low.

Page 36 SQL/Monitoring Facility
3.3.10 Perform installation in the monitored database(s)
This installation step must be executed for every database that will be monitored by SQL/MF. Donot perform this step for the SQL/MF database, installed in the previous step.
Following functions will be performed:
- Define the DB2 userid’s SQLMF and SQLMFUSR- Load the SQL/MF packages- Unload all user packages for the database into the SQL_STMNTS table
Edit the PC file SQLMFI5.VSEJOB and assign the following SETPARM symbols
CAT the VSAM catalog for a SAM ESDS workfile (default is VSESPUC)
DB the name of the monitored database
DBAPASS the password of user SQLDBA in this database
MFPASS the password for user SQLMF in this database
USRPASS the password for user SQLMFUSR in this database
Note
The values for the variables MFPASS and USRPASS should be the same as the values specifiedin the previous step “Perform installation in the SQL/MF database”.
Submit the SQLMFI5.VSEJOB as follows:
- Start ICCF PC file transfer (fast path 386) in 3270 emulator session A.- Drag and drop the file SQLMFI5.VSEJOB on the SEND2RDR.BAT. This will send and start
the job in class 0 and DISP D. The output listing is in DISP H. - The job step that unloads the user packages into the SQL/MF statements table may take
some time, depending on the number of packages in SYSACCESS. Unload progressmessages will be issued on the console.
- Check the output listing for errors.
NoteWhen unloading all user packages into SQL_STMNTS, the SYSACCESS catalog is accessedintensively. To avoid deadlocks with other agents, it is advisable to run SQLMFI5 when DB2activity is low.

SQL/Monitoring Facility Page 37
3.3.11 Load the service partition startup job
- Modify the POWER class in the VSEJOBs SQLMFSRR and SQLMFSRV to the class of thestatic or dynamic partition where you will run the SQL/MF service components.
- Do not modify the POWER or VSE jobname in the service partition jobs. SQL/MF expects thatthe jobnames are SQLMFSRR and SQLMFSRV.
- Upload these DISP=L POWER jobs by dropping them on the SEND2RDR.BAT icon.

Page 38 SQL/Monitoring Facility
3.4 Install the optional SQL/MF components
The optional components can be installed any time after installing the required components.
3.4.1 Install the Recorder facility
This installation step will perform the following functions:
- Create the VSAM cluster SQLMF.RECORDER.PDS.- Create 2 recorder extract tables (one for the statement recorder and one for the lockwait
recorder). The extract tables are used in the CICS user interface, if the user does not extractto a storage list (the default) but to a DB2 table.
Edit the PC file SQLMFI6.VSEJOB and assign the following SETPARM symbols
CAT the name of the VSAM user catalog where the recorder cluster must be defined
VOLUME the volume-ID for the define cluster IDCAMS command
PALLOC the primary space allocation value for the cluster as a number of records (each record is a 16Kblock)
SALLOC the secondary space allocation value for the cluster as a number of records (each record is a16K block)
POOL the storage pool number for the recorder extract tables
PAGESthe number of pages for the recorder extract tables
Submit the SQLMFI6.VSEJOB as follows:
- Start ICCF PC file transfer (fast path 386) in 3270 emulator session A.- Drag and drop the file SQLMFI6.VSEJOB on the SEND2RDR.BAT. This will send and start
the job in class 0 and DISP D. The output listing is in DISP H. - Check the output listing for errors.
To activate the recorder facility, following actions must also be taken:
- Insert RECORDER control statements in the SQLMF CONFIG file.- Update the CICS FCT by inserting COPY SQLMFFCT in DFHFCT and assembling it.
SQLMFFCT.A is in the SQL/MF library. The CICS definition is needed to access the recorderduring interactive recorder extract.
- Insert following DLBL in the STDLABUP.PROC
// DLBL SQLMREC,’SQLMF.RECORDER.PDS’,,VSAM,CAT=xxxxxx,DISP=(OLD,KEEP)
(where CAT specified the same value as the CAT parameter submitted above)
SQL/Monitoring Facility Page 39
3.4.2 Install the AutoPrep facility
This installation step will create the AutoPrep control table in the designated database. The jobmust be submitted for every database where the AutoPrep facility will be used.
Edit the PC file SQLMFI7.VSEJOB and assign the following SETPARM symbols
DB the name of the target database
POOL the storage pool number for the autoprep table
PAGESthe number of pages for the autoprep table
Submit the SQLMFI7.VSEJOB as follows:
- Start ICCF PC file transfer (fast path 386) in 3270 emulator session A.- Drag and drop the file SQLMFI7.VSEJOB on the SEND2RDR.BAT. This will send and start
the job in class 0 and DISP D. The output listing is in DISP H. - Check the output listing for errors.- Update the SQLMF CONFIG file and code the RECORDER statements.
To activate the AutoPrep facility, insert the necessary AUTOPREP control statements in theSQLMF CONFIG file.

Page 40 SQL/Monitoring Facility
3.4.3 Install the Saved Runstats facility
This installation step will create the Saved Runstats table in the SQL/MF database.
Edit the PC file SQLMFI8.VSEJOB and assign the following SETPARM symbols
POOL the storage pool number for the Saved Runstats table
PAGESthe number of pages for the Saved Runstats table
Submit the SQLMFI8.VSEJOB as follows:
- Start ICCF PC file transfer (fast path 386) in 3270 emulator session A.- Drag and drop the file SQLMFI8.VSEJOB on the SEND2RDR.BAT. This will send and start
the job in class 0 and DISP D. The output listing is in DISP H. - Check the output listing for errors.- Update the SQLMF CONFIG file and code the RECORDER statements.
To activate the AutoPrep facility, insert the necessary RETAIN_RUNSTATS control statement inthe SQLMF CONFIG file.

SQL/Monitoring Facility Page 41
3.5 Perform VSE IPL
After an initial SQL/MF installation, it is necessary to IPL the VSE system, before starting themonitored DB2/VSE databases. IPL is required to activate the SQL/MF vendor exits.
Page 42 SQL/Monitoring Facility

SQL/Monitoring Facility Page 43
4 Initiating SQL/MF
4.1 Initiating Monitoring in a Database Server
4.1.1 Prequisites
Data space requirements
SQL/MF makes intensive use of VSE data spaces. Since these data spaces are intended forcommunication with the SQL/MF service components, common (shared) VSE data spaces arecreated.
For every monitored database, SQL/MF creates following data spaces:
- the monitor data space with a size equal to: (NCUSERS + 8) x 16K- the communications data space with the size specified in the LOG COMQ_SIZE
statement in SQLMF CONFIG (default is 4 MB)- the recorder data space (if the recording facility has been enabled)
The size of the data space is defined, as a number of 4K pages, in the RECORDERDSPSIZE statement; the default is 1024 pages (4 MB)
- the autoprep data space, if autoprep facility has been installed; this data space has a fixedsize of 1 MB
The SYSDEF DSPACE specifications in $0JCL.PROC must provide for these data spaces.
- the DSIZE parameter must provide for the total space of all SQL/MF data spaces in theVSE system
- the MAX, PARTMAX and COMMAX parameters must include the total number of allSQL/MF data spaces in the VSE system; usually it will be necessary to modify COMMAX
Virtual storage used by SQLCSI
SQLCSI uses approximately 4 Mb of dynamic storage, which is all allocated above the 16 Mbline.

Page 44 SQL/Monitoring Facility
4.1.2 Activating the SQL/MF bootstrap
- If you are running VSE/ESA 2.4 or higher, insert a // SETPARM SYSTEM,SPRLIB=’library_name’ in the $0JCL or USERBG procedure, where ‘library_name’ is the library where SQL/MFhas been catalogued. The SPRLIB variable is needed by several SQL/MF componentsduring execution. VSE versions lower than 2.4 do not provide the SETPARM SYSTEMstatement and the SPR library name will be obtained using a component provided bySQL/MF. The SETPARM SYSTEM statement will ensure better performance, as it allowsto determine the library name without accessing the library.
- In the $0JCL procedure, update your SET SDL sequence by including the statement LIST=$SVASQLM. The named SQL/MF components must be SVA resident. The$SVASQLM list will load following components into the SVA:
Module name Size SVAPFIXed
In 31-bitSVA
SQLMFCSA 4K No Yes
SQLMFDOC 26K Yes Yes
SQLMFGLB 16K Yes Yes
SQLMFSVC 0.5K Yes Yes
SQLMFTRI 3K No Yes
SQLMFXPT 24K Yes Yes
SSPLIBC 5K No No
- The SQL/MF bootstrap program SQLMFINI should be invoked in the startup JCL of eachDB2 partition, including the database designated as the LOG database in SQLMFCONFIG. The total number of databases declared to SQLMFINI in a single VSE system,should not exceed 32.
- Activating the bootstrap at DB2 startup
In the DB2 startup JCL insert:
// LIBDEF PHASE,SEARCH=<SPR libraryname>.......// EXEC SQLMFINI,PARM=’DB=databasename[,INITMSG=NO]’// EXEC ARISQLDS,.....
In the DB PARM field, specify the name of the database to be monitored.
Specify INITMSG=NO to suppress the informational messages issued by SQL/MF in theDB2 server partition during its initialization and termination.

SQL/Monitoring Facility Page 45
4.1.3 Updating the standard labels
In your standard labels insert following DLBL:// DLBL SPRPDS,’SPR.PDS’,,VSAM,CAT=<catalog>,DISP=(OLD,KEEP)
If the SQL/MF recorder facility has been installed, insert following DLBL:// DLBL SQLMREC,’SQLMF.RECORDER.PDS’,,VSAM,CAT=<catalog>,DISP=(OLD,KEEP)
4.1.4 Preparing DB2/VSE startup for monitoring
In the DB2 startup stream, specify DSPLYDEV=C or DSPLYDEV=B. This is required becauseSQL/MF monitors the VSE console (via its SQLMFDOC vendor exit) for messages issued byDB2.
Page 46 SQL/Monitoring Facility
5This requires DB2 version 5.1 or higher. In older DB2 releases, the CIRB transaction allows onlyone servername.
4.2 Starting the SQL/MF service partition
The SQL/MF service partition runs the following SQL/MF service components:
- SQLCS- SQLMFM- SSPLIBR- SQLCSCRW- SQLCSAPS
All these components run as VSE subtasks in the service partition.
The SQLMFSRV DISP=L POWER job is used to start the service partition.
The SQLMFSRR DISP=L POWER job is used to automatically restart the service partition atmidnight or if an abend occurs in SQLMFSRV.
The partition must be auto-started during VSE IPL by inserting a // PWR PRELEASERDR,SQLMFSRV statement e.g. in the USERBG.PROC.
SQLMFSRV should be started after the SQL/MF LOG database.
4.3 Stopping the SQL/MF service partition
The partition is stopped via MSG followed by a SHUTDOWN command. SQLMFSRV supports theDATA option of the MSG command. Shutdown can be requested using the command MSG SQLMFSRV,DATA=SHUTDOWN.
4.4 CICS considerations
- In the CICS partition where the SQL/MF user interface (the $DBM transaction) is executed,the CIRB transaction must start a link to the SQL/MF database and to all databases that willbe accessed by the Object or the Catalog Navigator functions of the user interface.5
- The interactive components of SQL/MF run in both TS and pre-TS CICS systems.- All components run in RMODE=ANY and allocate dynamic storage above the 16 MB line
whenever possible. - Dynamic CICS storage is used intensively, especially if large reports are being generated by
the SQL/MF table editor. To limit the impact on the CICS DSA, the number of rows processedby the editor in storage, will never exceed 999.
- Changes to your CICS setup are usually not required, except for the FCT definition necessaryfor SQL/MF.

SQL/Monitoring Facility Page 47
4.5 Summary of changes to your VSE system
- Add the SQL/MF library to your standard LIBDEF PHASE chains.- Check the SYSDEF DSPACE specifications in $0JCL.PROC.- Check the size of the DB2 partitions for additional storage requirements by SQL/MF.- Insert the SVA loadlist $SVASQLM in the SET SDL sequence.- Insert a SETPARM SYSTEM,SPRLIB=’...’ in the $0JCL or USERBG PROC. (VSE 2.4 and higher
only).- Insert an EXEC SQLMFINI in the DB2 startup JCL of the LOG database and the monitored
databases.- Ensure DSPLYDEV=C is present in the DB2 initialization parameters.- Start the database that contains the SQL/MF tables (the LOG database).- Establish a link to the SQL/MF LOG database when starting the DB2 online support (CIRB).- Define a sufficiently large partition for the SQLMFSRV component.- Perform a PWR RELEASE RDR,SQLMFSRV during IPL (e.g. in the USERBG.PROC).- In your standard labels insert:
// DLBL SPRPDS,’SPR.PDS’,,VSAM,CAT=<catalog>,DISP=(OLD,KEEP)- If the SQL/MF recorder facility has been installed:
- in your standard labels insert: // DLBL SQLMREC,’SQLMF.RECORDER.PDS’,, VSAM,CAT=<catalog>,DISP=(OLD,KEEP)
- update your CICS FCT.

Page 48 SQL/Monitoring Facility

SQL/Monitoring Facility Page 49
5 Configuring SQL/MF
5.1 Configuring the Statement Monitor
In addition to its basic monitoring function, the monitor can be requested to perform logging,benchmarking, recording and notification by coding the corresponding control statements in aconfiguration file, which is a member named SQLMF CONFIG in the SQL/MF library. The productcomes with a basic configuration file.
- The configuration file should start with a global (unnamed) section that contains theparameters applicable to all monitored databases. The parameters that must be coded in theglobal section are LOG DATABASE and LOG COMQ_SIZE. The global section can alsocontain the configuration parameters identical for all databases.
- Configuration parameters applicable for a single database only should be placed in adatabase section of the configuration file. Begin the section with a SECTION statement. Thesection ends when a new section is started or at end of member.
With the exception of LOG DATABASE and COMQ_SIZE, all configuration commands can appearin both the global and the database sections. When a given parameter appears in both the globaland the database section, the database related parameter prevails.
The configuration statements are coded in a free format : the first word of the statement isconsidered as the function name. All following words are function arguments. They are separatedfrom the function name by one or more blanks. The entire function statement should be coded ona single file line. If a statement is not coded, the corresponding function is not implemented. A linestarting with an asterisk, is considered to be a comment line.
Note
Usually, one SQLMF CONFIG file, resident in the SQL/MF library, is sufficient. However, a PHASElibrary chain may be supplied to define multiple SQLMF CONFIG files in different libraries, for useby different DB2 partitions.
For example: the statement LIBDEF PHASE,SEARCH=(SQLMFCFG,SQLMFLIB) will search thelibrary SQLMFCFG for an SQLMF CONFIG, before searching SQLMFLIB (which contains theSQL/MF software and the default SQLMF CONFIG).

Page 50 SQL/Monitoring Facility
5.1.1 List of configuration statements
The following basic configuration statements can be coded in the configuration file.
AUTO_REBINDBENCHMARK USER {username | *}
PACKAGE {packagecreator | *}.packagenameEXCLUDE {DB2USER|VSEUSER|PACKAGE} nnnnINCLUDE {DB2USER|VSEUSER|PACKAGE} nnnnINITIAL SUSPENDLOG DATABASE databasename
BUFLOOK nCCSID_TRANSCHKPT_WAIT nCOMQ_SIZE n [MB]DEADLOCKSDYNCOMESCALATEEXCLUDE { DB2USER | VSEUSER | PACKAGE } nnnnHIGHEST { ON | OFF }IDLETIME nISOLATION RRLOCKTIME nLUW_RESPONSE hhmmssMODLEVEL nNOBLOCKPERIOD FROM hhmm TO hhmmRESPONSE hhmmssRETAIN n mSCAN DBSP nSQLCODE n mSTAT_FREQ nTOTIO n
IBUFLOOK nNOTIFY NAME name
BUFLOOK nESCALATEIDBSPUSE nIDLETIME nISOLATION RRLOCKTIME nLOGUSAGE nRESPTIME nTOTIO n
PERIOD FROM hhmm TO hhmmRETAIN_RUNSTATS nSECTION DatabasenameSECTION_STATS SECTION | SESSION | DAILY }SET ISOLATION { CS | RR | UR } FOR <packagename>

SQL/Monitoring Facility Page 51
5.1.2 AUTO_REBIND statement
Purpose
The AUTO_REBIND causes all CREATE INDEX commands to be recorded. A package rebindwill be requested for all packages that depend on tables for which a new index has beencreated. This ensures that existing packages benefit from the newly created indexes. Therebind is actually performed by the Command Monitor machine at the end of its session, thatis, at midnight.
Syntax:
AUTO_REBIND
Page 52 SQL/Monitoring Facility
5.1.3 BENCHMARK statement
Purpose
Benchmarking automatically logs all the SQL statements in the designated packages,executed by the designated user. These statements are stored in the log table with thebenchmark log type, to distinguish them from statements logged by exception, as describedbelow.
Multiple BENCHMARK commands can be stated in the configuration file.
Syntax:
BENCHMARK USER {username | *} PACKAGE {packagecreator | *}.packagename
Arguments:
USER {username | *} Specify the DB2/VSE userid subject to benchmarking when it executes the named package. Specify USER * if the package name alone should be used as a criterion for benchmarking.
PACKAGE {packagecreator | *}.packagenameSpecify the creator and name of the package subject to benchmarking.
Note
Both username and packagename can be made generic by appending an * sign, in whichcase the non-generic part of the name should not exceed 7 characters. Be aware of thesignificant overhead that generic benchmarking may generate. If your intention is to monitormultiple packages or users, the same results can be obtained with much less overhead, usingthe Recorder facility.
Example:
BENCHMARK USER USR1 PACKAGE X.PACK1
Logs all SQL statements in the package X.PACK1 when executed by user USR1.
BENCHMARK USER * PACKAGE *.PACK2
Logs all SQL statements in the package PACK2, whatever the executing userid and thepackage creator.

SQL/Monitoring Facility Page 53
5.1.4 EXCLUDE and INCLUDE statements
Purpose
To limit the scope of a LOG criterium, INCLUDE and INCLUDE statements can be specifiedfor the following LOG exception criteria:
- BUFLOOK - CCSID_TRANS- CHKPT_WAIT - DEADLOCKS- DYNCOM- ESCALATE- IDLETIME - ISOLATION RR- LOCKTIME - LUW_RESPONSE - NOBLOCK- RESPONSE - SCAN DBSP- SQLCODE - TOTIO
The INCLUDE and EXCLUDE statements must immediately follow the defined criterium.
Syntax:
{EXCLUDE | INCLUDE} {DB2USER | PACKAGE | VSEUSER} n
- The DB2USER specification includes or excludes the named DB2 userid(s).- The PACKAGE specification includes or excludes the named DB2 package(s).- The VSEUSER specification includes or excludes the named VSE userid(s). For batch
jobs, the VSE userid is the VSE jobname. For CICS applications, the VSE userid is theCICS userid.
The name of the included or excluded user or package can be made generic by ending it withan * sign.
If multiple INCLUDE and EXCLUDE statements are present for a given LOG criterium, theirevaluation proceeds until an INCLUDE request is satisfied. If no such request is found, theuser or package is excluded if it has matched a previous EXCLUDE request.
If no INCLUDE or EXCLUDE statements are present, all users and packages are included bydefault.

Page 54 SQL/Monitoring Facility
Examples
LOG DYNCOMEXCLUDE PACKAGE *INCLUDE PACKAGE ARI*
LOG TOTIOEXCLUDE PACKAGE XYZ
The first example limits DYNCOM logging to the packages whose name starts with ARI.The second example excludes package XYZ from TOTIO logging.
Note The INCLUDE / EXCLUDE facilities described above provide for a more granular exclude thanthe LOG EXCLUDE { DB2USER | VSEUSER | PACKAGE } statement which disables alllogging criteria for the defined users or packages.

SQL/Monitoring Facility Page 55
5.1.5 IBUFLOOK statement
Purpose
Enable the measuring of agent dispatch delays. Dispatch delay measuring shows the effect ofthe DB2/VSE DISPBIAS startup parameter.
A dispatch delay is the time, in microseconds, between the clearing of a wait condition(posting) and the actual dispatching of the agent by DB2/VSE. Dispatch delays are measuredfor short wait conditions only, that is, for I/O waits. The average dispatch delay during thesystem monitor interval is stored in the System Monitor COUNTER table. A separate delaycounter is provided for interactive and for non-interactive agents. An agent is considered non-interactive by SQL/MF, when it performs more than (IBUFLOOK) buffer lookups during itsLUW.
For example, the statement IBUFLOOK 1000, causes agents doing more than 1000 bufferlookups to be considered as non-interactive.
Syntax
IBUFLOOK n

Page 56 SQL/Monitoring Facility
5.1.6 INITIAL statement
Purpose
Start the monitor in suspended mode. To activate monitoring, the MONITOR RESUMEcommand must be executed.
Syntax
INITIAL SUSPEND

SQL/Monitoring Facility Page 57
5.1.7 LOG statement
Purpose
- Designate the database where the monitor log table has been created.- Specify the number of days that log table rows should be kept. - Define the criteria for statement logging. Logging is performed when a DB2/VSE user
exceeds the resource consumption limits defined by the LOG statement. This type oflogging is called exception logging, to distinguish it from benchmark logging describedabove. If a given statement violates several logging limits during a single execution, it islogged on behalf of each exception caused.
- Exception logging can be limited using the LOG EXCLUDE or the INCLUDE andEXCLUDE statements after each exception criterion. For a description of the latter facility,see page 53.
Syntax
LOG DATABASE databasenameBUFLOOK nCCSID_TRANSCHKPT_WAIT nCOMQ_SIZE n [MB]DEADLOCKSDYNCOMESCALATEEXCLUDE { DB2USER | VSEUSER | PACKAGE } nnnnHIGHEST [ON | OFF]IDLETIME nISOLATION RRLOCKTIME nLUW_RESPONSE hhmmssMODLEVEL nNOBLOCKPERIOD FROM hhmm TO hhmmRESPONSE hhmmssRETAIN n mSCAN DBSPSQLCODE n mSTAT_FREQ nTOTIO n
Arguments:
DATABASE databasename
Designates the database containing the SQL/MF tables. Several SQL/MF components willautomatically connect to this database.
BUFLOOK n
Logs statements that perform more than n buffer lookups.
Page 58 SQL/Monitoring Facility
6Note the blank between n and MB.
7If less than 256 pages are requested, the size is automatically and without error message adjustedto 1 MB.
CCSID_TRANS
Logs SQL statements for which DB2 performs CCSID translation (with a considerable performance penalty as a result). SQL/MF logs such statements with log reason CCSIDTRN.
Since detection of CCSID translation may significantly increase monitor overhead, theCCSID_TRANS option should be requested with discretion. Note that INCLUDE andEXCLUDE statements can be used to limit the monitor overhead to designated users orpackages.
CHKPT_WAIT n
Logs statements that had to wait more than n seconds for a checkpoint completion. If n is setto zero, all checkpoint waits will be logged. The exception log row for a checkpoint_wait eventshows the number of milliseconds, the agent has been in checkpoint wait, in the column“comm_wait”.
COMQ_SIZE n [MB]
COMQ_SIZE defines the size of the communications data space used to transmit packageexecution statistics, logging and benchmarking requests from the database to the monitorcomponent running in the SQL/MF service partition.
The size of the communications data space can be expressed in 4K pages (COMQ_SIZE n)or in megabytes (COMQ_SIZE n MB).6 The minimum allocation is 1 MB (or 256 4K-pages7),the maximum 2048 MB (or 524288 4K-pages).
A data space of 4 megabytes is usually adequate, unless intensive logging or benchmarking isperformed. All entries in the data space are 512 bytes long. For logging, benchmarking andprep monitoring, the monitor agent block and the dynamic statement text are also stored. Inthe average, most log records will fit in one 4K block.
Use the MONITOR CQCOUNT command (page 157) to monitor space usage in the dataspace. If there is no room in the data space to forward a request, a message is given and therequest is ignored.
DEADLOCKS
Logs statements during which a deadlock has occurred.
DYNCOM
Logs all SQL statements executed in dynamic mode. Please note that the first data transferstatement (fetch, put..) following the prepare and open will be logged. A given dynamicstatement is logged only once per session, that is, the text of the dynamic statement is used todetermine whether previous logging has occurred.

SQL/Monitoring Facility Page 59
ESCALATE
Logs all statements during which one or more lock escalations have occurred.
EXCLUDE { DB2USER | VSEUSER | PACKAGE } nnnn
Excludes the name DB2 user, VSE user or package from exception logging. For batch jobs,the VSE userid is the VSE jobname. For CICS applications, the VSE userid is the CICSuserid. Up to 999 EXCLUDE requests can be specified.
HIGHEST [ON | OFF]
With LOG HIGHEST ON, the RESPTIME, LOCKTIME, TOTIO and BUFLOOK exceptionloggings store the highest values encountered thus far for the package section affected. If apackage section causes multiple LOCKTIME log events in the database session, the highestLOCKTIME is retained. With LOG HIGHEST OFF (the default), all exceptions are loggedchronologically.
IDLETIME n
Logs the users that are in logical unit of work for the specified number of seconds, withoutissuing SQL statements. Idletime is computed as the difference between the current time andthe endtime of the last statement executed.
ISOLATION RR
Logs all statements executing with an isolation level of repeatable read.
LOCKTIME n
Logs users that are in the lockwait state for the specified number of seconds.
LUW_RESPONSE hhmmss
Logs DB2/VSE sessions not closing their LUW before hhmmss time has elapsed. Leadingzeroes in the time specification may be omitted. The specification 100 (1 minute) is equivalentto 000100. The LUW_RESPONSE time is calculated as: (time_of_commit) - (start_time of firststatement in the LUW).
MODLEVEL n
This parameter specifies the number of package modification levels (including the currentlevel) to keep in the SQLCS_SQL_STMNTS table. A package modification level is createdeach time a package is prepped or reloaded. For instance: to keep the current and oneprevious modification level, specify MODLEVEL 2. If the parameter is omitted, no levels otherthan the current one are kept.

Page 60 SQL/Monitoring Facility
NOBLOCK
Logs the cursor-based statements that execute without blocking. Packages retrieving a largenumber of rows should normally execute with the blocking option.
PERIOD FROM hhmm TO hhmm
Defines the exception logging period. By default, exception logging is not limitedchronologically.
RESPONSE hhmmss
hhmmss represents the statement response time (“elapsed time”) that will trigger logging.Leading zeroes may be omitted. The specification 100 (1 minute) is equivalent to 000100.
The response time is calculated as the sum of: CPUtime, lock waittime, I/O wait_time andcommunications waittime. Response times are computed for the package section. For cursorstatements for instance, “response time” represents the time elapsed between the openingand the closing of the cursor.
For example : LOG RESPONSE 0130 will log all statements with a response time of 1½minute and higher.
RETAIN n m
Specify n as the number of days the exception and benchmarking log table rows should bekept. Rows in excess of this argument are automatically deleted by SQL/MF.
Specify m as the number of days the package statistics should be kept. If m is omitted, thepackage statistics are not automatically purged.
If the parameter is omitted, the log table is not automatically purged.
SCAN DBSP [n]
Specify if DBspace scans should be logged. If n is specified, only Dbspace scans performingmore than n I/O’s will be logged. This allows to bypass intended Dbspace scans on very smalltables.

SQL/Monitoring Facility Page 61
SQLCODE n m
If specified, statements terminating with a negative SQLCODE in the range N M (meaning:from N up to and including M), will be stored in the Monitor Log table. If M is omitted, thesingle SQLCODE N will be logged. An unlimited number of SQLCODE ranges may bespecified. However, each range must be coded an a new line.
For example:
To log all SQLCODEs specify:LOG SQLCODE 1 999
To log all privilege related SQLCODEs and all deadlocks, specify:LOG SQLCODE 551 564LOG SQLCODE 911
Please note that only SQLCODEs generated by the database server can be detected bySQL/MF. SQLCODEs generated by the Resource Adapter at the client side (for example -521)are not logged.
STAT_FREQ n
Specifies the frequency of statement and package statistics, that is, the interval after which theStatement Monitor component executing in the database server should transmit its statistics tothe SQL/MF service partition.
Specify the value as:
1 to perform logging every hour2 to perform logging every 10 minutes3 to perform logging every minute
The higher the frequency, the sooner the statement and package statistics can be consultedusing the statistical reports, but the higher the performance impact of statistics processing.The package statistics are also sent when a package is prepped, because the prep monitorevent clears the statistics. If STAT_FREQ is not specified, the default value is set to 1.
TOTIO n
Logs statements that perform more than n page I/O’s.
Page 62 SQL/Monitoring Facility
5.1.8 MAX_PAGES statement
Purpose
Avoid dispatching delays experienced by short (interactive) LUW while long-running LUW arein progress.
These delays are due to the fact that DB2 allows a long-running LUW to consecutivelyprocess 64 DBspace pages when no wait conditions arise during the retrieval. After 64 pages,the DB2 page retrieval module ARIYI19 forces an exit to the dispatcher. However, whileprocessing the 64 pages, the agent is in the DBSS and effectively monopolizes the database.
The purpose of the MAX_PAGES operand is to reduce the number of pages that can beretrieved without exiting to the dispatcher. Decreasing MAX_PAGES will improve concurrentagent processing.
Syntax
MAX_PAGES n
where n specifies the maximum number of consecutive page retrievals allowed for any agent
Note
Reducing MAX_PAGES will somewhat increase the database CPU usage, as more calls aremade to the DB2 dispatcher. You should experiment with different values of MAX_PAGES tofind the best balance between CPU overhead and processing concurrency.

SQL/Monitoring Facility Page 63
5.1.9 NOTIFY statement
The Notify facility sends a message to a designated console when one of the specifiedexceptional conditions occur.
SyntaxNOTIFY NAME consolename
BUFLOOK nDYN_COST nESCALATEIDBSPUSE nIDLETIME nISOLATION RRLOCKTIME nLOGUSAGE nRESPTIME nTOTIO n
NAME usernameSpecify the ICCF userid whose console should receive the notification messages. If the useridhas user type 3, only the notification messages will appear on its console. If NAME is omitted,notification messages are sent to the system console.
BUFLOOK nGenerates a notification message when a package section performs more than n bufferlookups.
DYN_COST nGenerates a notification message when a dynamic SQL statement is executing, with aPREPARE cost greater than n.
ESCALATEGenerates a notification message whenever an agent causes DB2 lock escalation.
IDBSPUSE nGenerates a notification the total number of internal DBspaces in use by all agents exceeds npercent of the number of internal DBspaces defined..
IDLETIME nGenerates a notification when a logical unit of work is idle (not executing SQL statements) formore than n seconds.
ISOLATION RRGenerates a notification when a package section executes with the repeatable read isolationlevel.
LOCKTIME nGenerates a notification when a statement is in the lockwait state for more than n seconds.
LOGUSAGE nGenerates a notification when the DB2 log is n% full.
RESPTIME nGenerates a notification when a statement has a response-time of more than n seconds.
TOTIO nGenerates a notification when a package section has issued more than n I/O requests.

Page 64 SQL/Monitoring Facility
5.1.10 PERIOD statement
Purpose
Defines the monitoring period, that is, the chronological window during which monitoring willoccur. If not specified, monitoring is done around the clock.
Syntax
PERIOD FROM hhmm TO hhmm
Specify the start and end time for monitoring in hours and minutes. The TO time should begreater than the FROM time.

SQL/Monitoring Facility Page 65
5.1.11 RETAIN_RUNSTATS statement
Purpose
Defines the number of days that should be kept in the saved Runstats table. Data in excess ofRETAIN_RUNSTATS are automatically dropped by the SQLCS component.
Syntax
RETAIN_RUNSTATS n
where n specified the number of days to be retained

Page 66 SQL/Monitoring Facility
5.1.12 SECTION statement
Purpose
Indicates the start of “private” configuration parameters for the named database. Theseparameters complement or overwrite the parameters specified in the global configurationsection. A database-specific section ends at the SECTION statement for the next database orat the end of the configuration file.
Syntax
SECTION databasename

SQL/Monitoring Facility Page 67
5.1.13 SECTION_STATS statement
Purpose
Controls the contents of the statement statistics columns in the SQL_STMNTS table (e.g.RDSCALL, TOTIO etc).
Syntax
SECTION_STATS { SECTION | SESSION | DAILY }
- SECTION the columns contain the statistics for the last execution of the section- SESSION the columns contain the total statistics for all executions of the section during
the database session- DAILY the columns contain the total statistics for all executions of the section during
the day
If the statement is omitted, SECTION_STATS SECTION will be in effect.
Note
The meaning of the data in the column SAMPLED of the SQL_STMNTS table also dependson the SECTION_STATS statement.
- With SECTION_STATS SECTION, the column records the number of times the packagesection has been executed since it was last prepped (or since it was loaded in theSQL_STMNTS table at SQL/MF install).
- With SECTION_STATS SESSION, the column shows the number of times the packagesection has been executed during the corresponding database session.
- With SECTION_STATS DAILY, the column shows the number of times the packagesection has been executed during the day, it was last recorded.

Page 68 SQL/Monitoring Facility
5.1.14 SET ISOLATION statement
Purpose
Force a defined isolation level for specified packages. The isolation level is modified by themonitor in the RDIIN mailbox at execution time. The package then runs as if it had beenprepped with the specified isolation level.
Syntax
SET ISOLATION { CS | RR | UR } FOR <packagename>
Notes
- a generic packagename is specified by appending an * sign- package name * means “all packages”- the SET ISOLATION command may appear in the global or in a database section- up to 256 SET commands may be specified per database- multiple SET commands are processed in the order of specification
Example
SET ISOLATION UR FOR ARI*SET ISOLATION UR FOR SQL*SET ISOLATION CS FOR *
The above statements will force isolation UR for all packagenames beginning with ARI or SQLand isolation level CS for all other packages.

SQL/Monitoring Facility Page 69
5.1.15 Sample configuration file
* Global configuration parameters
LOG DATABASE database_nameLOG COMQ_SIZE 4 MBLOG SCAN DBSP
* Configuration parameters for database DBPRD1
SECTION DBPRD1LOG BUFLOOK 5000 LOG TOTIO 100 LOG RESPONSE 30LOG SQLCODE 1 999NOTIFY NAME DBADMNOTIFY LOCKTIME 30
* Configuration parameters for database DBTEST1
SECTION DBTEST1LOG BUFLOOK 10000 LOG TOTIO 500

Page 70 SQL/Monitoring Facility

SQL/Monitoring Facility Page 71
5.2 Configuring the Governor Facility
The Governor function is performed by the SQLCS program running in the SQL/MF servicepartition. The Governor operates using configuration commands that define the restrictingconditions and the users to be restricted. Restricting a user consists in defining a maximumresource usage limit. When a user exceeds the limit during execution, the governor forces the useroff the database. If the governor finds the user provided SQLMUAPX PROC in the SQL/MFlibrary, it will invoke SQLMUAPX before restricting. The user exit may request that restricting andforcing be bypassed. The SQLMUAPX interface is described on page 218.
Restrictions are defined for a given database in the SQLMF CONFIG member. The definitionsmay be coded in the global configuration section or in a database-specific section.
The restrictions are applied at the time interval specified by the GOVERNOR INTERVALcommand. A statement that completes before this interval expires will not be restricted, even if ithas violated a restricting rule.
The following section describes the restricting commands. They can be specified in any order. TheINCLUDE and EXCLUDE statements however must follow the condition to which they apply.A line starting with an asterisk, is considered to be a comment line.
GOVERNOR RESTRICT FROM hhmm TO hhmm [WEEKDAYS]
Defines the period during which restriction should be enabled. If the optional WEEKDAYSkeyword is specified, restricting will not be attempted on Saturdays and Sundays.
GOVERNOR INTERVAL n
Defines the interval in seconds, at which the Governor should inspect active users forrestriction violations. If not specified, the interval defaults to 15 seconds.
GOVERNOR MAX_BUFLOOK n
Requests that an agent be forced when it performs more than n buffer lookups.
GOVERNOR MAX_CHKP_DELAY n [ FORCE_RO | FORCE_RW ]
Requests that agents responsible for a system checkpoint delay be forced after n seconds. FORCE_RO requests that only read agents should be forced. FORCE_RW requests that onlyread-write agents should be forced. When the operand is not specified, all agents responsiblefor the delay will be forced. Please note that in most cases, checkpoint delay is caused byread-write agents.
GOVERNOR MAX_DYN_COST n
Requests that dynamic SQL statements be forced when their cost exceeds n. The cost isdetermined by DB2 during statement PREPARE. The statement will be allowed to start but willbe forced at the next governor interval.
Page 72 SQL/Monitoring Facility
GOVERNOR MAX_IDLETIME n
Requests that an agent be forced when it is idle for more than n seconds. An agent isconsidered idle when it is in LUW, when its previous statement has completed and when it isin the communications wait state (waiting for the next SQL statement).
GOVERNOR MAX_IO n
Requests that an agent be forced when it is performs more than n I/O operations. All I/O (datapage I/O, directory I/O and logfile I/O) is taken into account in view of restricting.
GOVERNOR MAX_LOCKHOLD n [IDLE m] [ FORCE_RO | FORCE_RW ]
Requests that an agent be forced when it locks a resource for more than n seconds, whileother agents wait on that resource (are in lockwait). In case of a lock cascade, the first agentnot in lockwait will be forced.
The optional IDLE keyword requests that the locking agent must be in the communicationswait state for at least m seconds, before restricting is considered. If IDLE is not specified, theagent exceeding the hold time is forced, whatever its status. Normally, the IDLE time shouldbe inferior to LOCKHOLD time.
The optional keyword FORCE_RO requests that only read agents should be forced.FORCE_RW requests that only read-write agents should be forced. When the operand is notspecified, forcing is done without examining the R/W status.
GOVERNOR MAX_LOCKTIME n [ FORCE_RO | FORCE_RW ]
Requests that an agent be forced when it is in the lockwait state for more than n seconds.
The optional keyword FORCE_RO requests that only read agents should be forced.FORCE_RW requests that only read-write agents should be forced. When the operand is notspecified, forcing is done without examining the R/W status.
GOVERNOR MAX_LOGPAGES n
Requests that an agent be forced when it writes more than n pages on the DB2 log during agiven LUW. High log space usage may be the result of executing UPDATE or DELETEstatements that affect a large number of rows.
GOVERNOR MAX_LUW_RESPONSE n
Requests that an agent be forced when the duration of its LUW exceeds n seconds. LUWresponse time is computed as (current_time - LUW_begin_time).
GOVERNOR MAX_RESPONSE n
Requests that an agent be forced when the duration of its current statement exceeds nseconds. Statement response time is computed as (current_time - statement_begin_time).

SQL/Monitoring Facility Page 73
GOVERNOR INCLUDE {USER | VSEUSER | PROGRAM} name
The INCLUDE command defines the user and package names subjected to the codedrestriction. A variable number of INCLUDE statements can follow the restriction definition.
An INCLUDE USER statement restricts the named DB2 userid. An INCLUDE VSEUSER statement restricts the named VSE userid. An INCLUDE PROGRAM restricts the named package (the package creator is not specified).The specified name may be generic by coding an * at the end of the name. (PROGRAM ABC*specifies all package names starting with ABC).
If an INCLUDE is coded, the restriction applies to the named users or packages only. If noINCLUDE is provided, all users and packages are included by default. The scope of anINCLUDE may be reduced by EXCLUDE statements that follow.
GOVERNOR EXCLUDE {USER | VSEUSER | PROGRAM} name
The EXCLUDE command defines the user and package names not subjected to the codedrestriction. A variable number of EXCLUDE statements can follow the restriction definition.
An EXCLUDE USER statement unrestricts the named DB2 userid. An EXCLUDE VSEUSER statement unrestricts the named VSE userid. An EXCLUDE PROGRAM unrestricts the named package (the package creator is notspecified). The specified name may be generic by coding an * at the end of the name.
The userid SQLDBA is always excluded by default: it cannot be restricted.
Sample Restriction file
GOVERNOR RESTRICT FROM 0800 TO 1700GOVERNOR INTERVAL 15GOVERNOR MAX_LOCKHOLD 60 (1)GOVERNOR MAX_LOGPAGES 1000 (2)GOVERNOR MAX_BUFLOOK 10000 (3)GOVERNOR INCLUDE PROGRAM ARIISQLGOVERNOR EXCLUDE USER ADMUSR1GOVERNOR EXCLUDE USER ADMUSR2
These sample governor commands will:
(1) Prevent users to lock a resource for more than 1 minute, if other users are waiting on thatresource.
(2) Prevent users from writing more than 1000 pages to the DB2 log, without doing aCOMMIT.
(3) Disallow ISQL users to perform more than 10000 buffer lookups during a single statement.The DB2/VSE userid’s ADMUSR1, ADMUSR2 and SQLDBA (by default) will not berestricted in their usage of ISQL.
Cases 1 and 2 use the default INCLUDE and EXCLUDE lists, that is, all users exceptSQLDBA are included.

Page 74 SQL/Monitoring Facility
SQL/Monitoring Facility Page 75
5.3 Configuring the System Monitor
The SQL/MF system monitor is configured using the following commands. These commands arecoded in the SQLMF CONFIG member. They should be coded as a global section. It is notpossible to define different system monitor parameters for different databases.
SYSMON BUFMON {YES | NO}
Specify NO if buffer monitoring should not be performed. BUFMON YES enables the buffermonitoring interval specified in the INTERVAL operand. Default is NO, as the buffer monitoringfunction implies a non-trivial overhead.
SYSMON INTERVAL mint bint
Specify mint as the main monitoring interval in seconds. Specify bint as the buffer monitoringinterval in seconds. Setting this parameter requires that BUFMON YES has been specified. IfBUFMON NO has been specified, code the same value for mint and bint.
SYSMON MONPERIOD from_hhmm to_hhmm
Specify the system monitoring period as a start and end time in the format HHMM. If a PERIODhas been defined for the statement monitor in SQLMF CONFIG, system statistics will be collectedand made available to the system monitor during this period only.
SYSMON RETAIN n
Specify the number of monitoring sessions (days) to be kept in the monitoring tables. Sessionrows in excess of RETAIN are deleted at the begin of the monitoring session. When the parameteris omitted, no automatic delete occurs.

Page 76 SQL/Monitoring Facility
SYSMON SHOWDBSP hh:mm [dayname]
Specify the time as hh:mm when the system monitor should issue the SHOW DBSPACEcommand for all Dbspaces in the monitored databases. Specify dayname as the day-of-weekwhen SHOW DBSPACE should be performed. If hh:mm is specified alone, the SHOW DBSPACEis done every day. If no SHOWDBSP statement is supplied at all, no SHOW DBSPACEcommands are issued and the resulting information is not available in the system monitor tables.
If SHOWDBSP is specified with a dayname, the rows in the DBSP_USE table will have the datestamp of that day. When consulting DBspace usage via the online interface, you must specify thatdate (or a period including that date).
Designate monitored database
To designate the databases to be inspected by the system monitor, two methods are available:
1. Code the following statement for each database:
SYSMON DATABASE databasename
2. Specify SYSMON DATABASE AUTODETECT to inspect all monitored databases.
Sample System Monitor control commands
SYSMON MONPERIOD 0800 1700SYSMON BUFMON NOSYSMON INTERVAL 300 300SYSMON RETAIN 7SYSMON SHOWDBSP 02:00 SUNDAYSYSMON DATABASE AUTODETECT

SQL/Monitoring Facility Page 77
5.4 Configuring the Recorder
Operation of the Recording facility is controlled using the RECORDER statement in the SQLMFCONFIG file. The recording facility should have been installed previously, as described on page38.
Following statements are available:
RECORDER ALLDAYS
By default, recording is not performed on Saturdays and Sundays. If it should, specify theALLDAYS option.
RECORDER DSPSIZE size
specifies the size of the shared recorder data space in 4K pages. If the statement is omitted, adata space of 1024 pages (4 megabyte) will be created. The maximum DSPSIZE valueallowed is 32767.
RECORDER EXCLUDE creator.packagename
Excluded packages are recorded only once during a DB2/VSE session. This option can beused for packages that are automatically scheduled at regular time intervals and thatotherwise would unnecessarily fill up the recorder file. EXCLUDE’s are processed by theRecorder Writer.
As many EXCLUDE commands as needed may be specified.
RECORDER FROM hhmm TO hhmm
This optional statement defines the recording period. The period applies to statementrecording only. If the period is omitted, no statement recording occurs. Checkpoint andlockwait recording however are always performed as soon as a RECORDER DSPSIZEstatement has been found.
If statement recording “on demand” is desired, you can:
- Use the MONITOR RECORDER START / STOP command, as described on page 163.This is the preferred method.
- Specify a dummy recorder period, such as RECORDER FROM 0000 TO 0001. Whenrecording is actually needed, alter the recording period by command, for example:MONITOR RECORDER CRTO 2359.
RECORDER INTERVAL n
Specifies the writer’s polling interval in seconds. During polling, the Writer scans the dataspace(s) of the database server(s) with statement recording enabled and writes the extractedentries to the recorder VSAM cluster. The statement is mandatory. To reduce the “working set”of the recorder data space, the interval should be low, preferably less than 3 seconds.

Page 78 SQL/Monitoring Facility
RECORDER KEEP n
Optional parameter that specifies the number of days to keep in the recorder file (the VSAMcluster). Default is 3.
RECORDER LEVEL n
Specify LEVEL 1 to record the basic monitor counters. Specify LEVEL 2 to record all statistical section counters. Specify LEVEL 3 to include the contents of the hostvariables in the WHERE clause of theSELECT statements. Specify LEVEL 4 to include the contents of all hostvariables in all SQL statements.
The statement is mandatory.
When using the recorder “on demand” by means of the MONITOR RECORDER command,LEVEL 4 is recommended. In all cases, it is suggested to use recorder level 2 at least.
Notes
- If the recorder control statements are coded in the global section of SQLMF CONFIG, theyenable recording for all databases in the CONFIG file, with identical parameters.
- If recorder definitions are made in a database sections, specify the RECORDER INTERVALand DSPSIZE statements in the global SQLMF CONFIG section
- All other RECORDER statements may be specified in the global or in a database section ofthe CONFIG file (or in both).
Example
* define the recording parameters for all databases[global section]RECORDER INTERVAL 3RECORDER LEVEL 3RECORDER DSPSIZE 2048
SECTION DBN2* redefine RECORDER LEVEL for DBN2RECORDER LEVEL 4

SQL/Monitoring Facility Page 79
5.5 Configuring the User Interface
By providing a $DBM CONFIG member in the SQL/MF VSE library, you can modify thepresentation of the running agent list.
Following statements can be coded in the CONFIG file:
INTERVAL <n>Defines the running agent list refreshment interval, in seconds. Default is 3 seconds.
ORDER BY {SQLID | VSEID | ELAPSED | START | COST | PACKAGE} {ASC | DESC}Modifies the sort order of the agent list. The specified item defines the secondary sort column: theprimary sort column is always the database name. The default order is descending SQL cost.
SQLID sorts on DB2 usernameVSEID sorts on VSE usernameELAPSED sorts on statement elapsed timeSTART sorts on statement start timeCOST sorts on SQL cost, that is, on TOTIO + (DBSSCALL÷ 3)PACKAGE sorts on package name
SHOW_LOCATIONShows the users location (CICS terminalname or VSE partition name) instead of the DB2 userid.
SHOW_LUWTIMEShows the begintime of the LUW, instead of the begintime of the statement.
NoteModifications to $DBM CONFIG take effect when CICS is restarted or when a new copy is loadedof the CICS programs SQLMFDBM and SQLCSU.

Page 80 SQL/Monitoring Facility
8Privileges are checked during PREPARE.
5.6 Defining dynamic user aliases
Compiled DB2 applications sometimes wish to use dynamic SQL. Dynamically building an SQLSELECT during execution may provide end-users with more flexible and sophisticated dataselection capabilities. Also, dynamic SQL is sometimes faster than static SQL, because thedynamic statement predicate specifies actual values rather than host variables.
However, executing dynamic SQL requires that all users of the dynamic package statement haveDB2 privileges on all tables used by the dynamic statement. In many cases this is undesirable, asinstallations grant end-users on DB2 packages, not on DB2 tables.
The dynamic alias facility offers a solution by replacing (during SQL PREPARE8) the executingDB2 userid with a userid that has table privileges (the alias). The alias userid’s and the packageseligible for aliasing are defined in the SQL/MF library member named:<databasename> DYNALIAS.
Each record in the DYNALIAS member has the format:
PACKAGE <packagename> ALIAS <userid>
meaning:
if <packagename> performs a dynamic SQL PREPARE, substitute the current DB2 userid with theuserid specified as the ALIAS. The alias should have table authorities, either because it is thetable creator or has DBA authority.
Alias substitution occurs during the dynamic PREPARE statement only. All static statements andthe dynamic statements other than PREPARE, execute under the normal userid.
Note Generic packagenames cannot be specified in the DYNALIAS member.

SQL/Monitoring Facility Page 81
9For CICS users, the VSE_name is the CICS userid. For batch jobs, the VSE name is the job name.
6 Using SQL/MF: Monitor Data Items
6.1 Description
The monitor reporting functions described in the following chapters, show the following datacolumns:
DatabaseThe name of the database where the statement executes.
VSE_nameThe VSE name of the user executing the statement.9
SQL_nameThe DB2/VSE name of the user executing the statement.
AgentThe number of the DB2/VSE agent.
Agent-statusThe execution status of the DB2/VSE agent. See table on page 86.
LUWidThe DB2/VSE LUW number.
LocationFor CICS applications: the CICS terminal name prefixed with “CICS”. For terminal-independent CICS applications: the CICS taskid prefixed with “TID”. For batch jobs: the partition identification.
CICStidThe CICS task number.
PackageThe name of the package containing the statement
SectionThe section number of the package containing the statement. SQL/MF maintains a dummypackage section -1 to record the cost involved in package initialization (package loading, privilegechecking and eventual automatic reprepping).
Plan1 for the first table accessed by the statement, 2 for the next table and so on. (Access to aninternal DBspace is also considered as a plan).
StatementThe type of SQL statement executed. See table on page 87.

Page 82 SQL/Monitoring Facility
IsolationThe isolation level of the statement as CS (cursor stability), RR (repeatable read) or UR(uncommitted read).
BlockedThe blocking attribute of the statement (Yes or No). For non-cursor statements blocking is alwaysset to Y.
StartdateThe start date of the statement.
StopdateThe stop date of the statement.
StarttimeThe start time of the statement.
StoptimeThe stop time of the statement, that is, the starttime of the next statement..
ElapsedThe response time of the statement or statement section as hh:mm:ss. Note that for cursorrelated statements, starttime is the starttime of the section, that is, the time the cursor wasopened. Elapsed time is the time elapsed since the opening of the cursor.
CPUtimeThe total CPU usage time for executing the statement, in microseconds.
LockwaitThe total time spent in lock wait, in milliseconds.
IowaitThe total time, in milliseconds, spent waiting for database I/O completion.
CommwaitThe total time spent in communication wait, in microseconds.
CHKPtimeThe total time spent in checkpoint wait, in milliseconds.
RDScallThe number of calls to the Relational Subsystem.
DBSScallThe number of calls to the Database Subsystem.

SQL/Monitoring Facility Page 83
10For blocked, cursor-based fetch statements, the statistic shows the number of rows in the blockpassed by the database server to the Resource Adapter in the client’s machine. Although available due to thestatement’s search conditions, all these rows are not necessarily processed by the application package.
DispCallThe number of dispatcher calls during the statement. (A dispatcher call is made whenever aDB2/VSE agent must wait on an event).
NrowsThe number of table rows fetched, inserted, deleted or updated by the statement.10
Tot_rowsThe total number of table rows processed by the entire package.
BuflooksThe number of buffer lookups performed.
WaitlockThe number of times a lock request resulted in wait.
Nr_LocksThe number of locks currently held by the agent.
EscalateThe number of times a lock request resulted in lock escalation.
PagreadThe number of page reads during the statement, that is, the number of times a request for datacould not be satisfied from the buffer pool.
PagwriteThe number of page writes during the statement.
LogreadThe number of reads to the DB2/VSE log during the statement.
LogwriteThe number of writes to the DB2/VSE log during the statement.
DirbuflThe number of directory buffer lookups performed.
DirreadThe number of directory page reads during the statement.
DirwriteThe number of directory page writes during the statement.

Page 84 SQL/Monitoring Facility
IntDBspThe number the number of buffer lookups in internal DBspaces during the statement.
SQL/Monitoring Facility Page 85
Tot_ElapsTotal elapsed time in the package, as the sum of CPU time and all wait times.
Max_ElapsMaximum elapsed time in the package during the STAT_FREQ period.
AccessThe name of the index used to access the first table in the statement or “No index access noted” ifno index is being used. For indexed access, the first 40 characters of the index column definitionare shown.
Selective_IndexA YES/NO flag indicating the selectivity of the index used.
SQL Statement The text of the SQL statement executed with the host variable names replaced with the hostvariable contents.. For static statements, the statement text is obtained from theSQLCS_SQL_STMNTS table or by unloading the package if it is not in the above table.
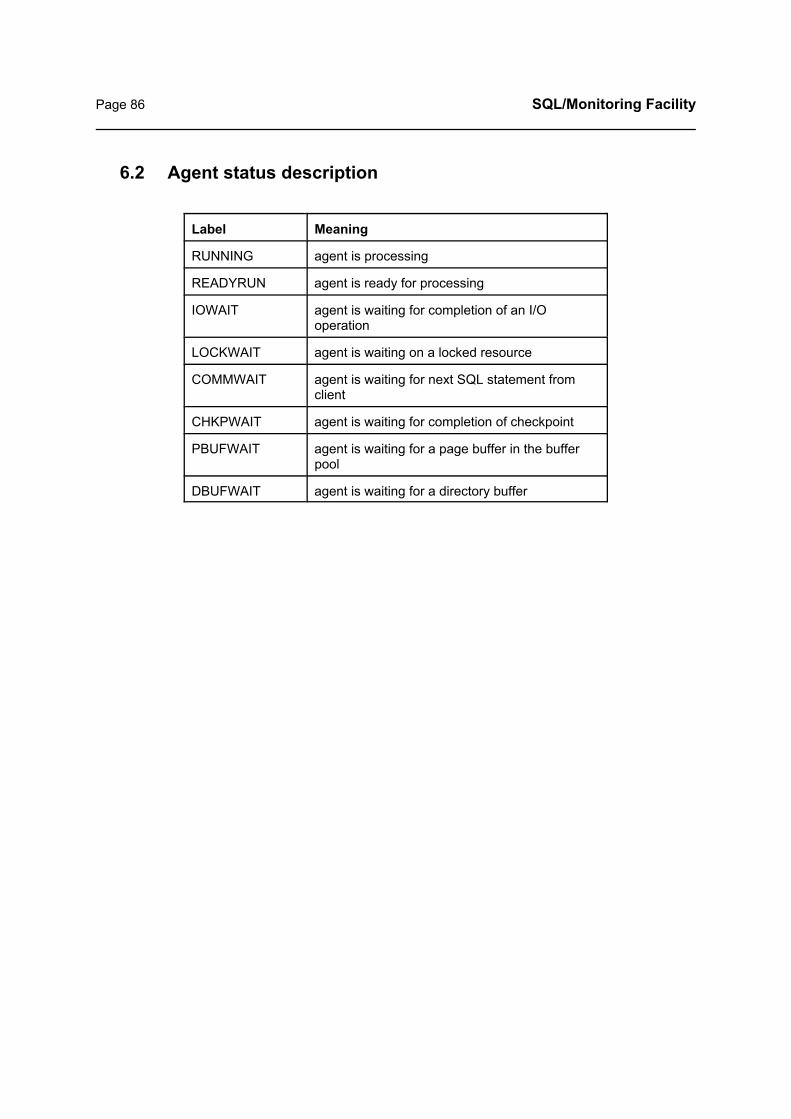
Page 86 SQL/Monitoring Facility
6.2 Agent status description
Label Meaning
RUNNING agent is processing
READYRUN agent is ready for processing
IOWAIT agent is waiting for completion of an I/Ooperation
LOCKWAIT agent is waiting on a locked resource
COMMWAIT agent is waiting for next SQL statement fromclient
CHKPWAIT agent is waiting for completion of checkpoint
PBUFWAIT agent is waiting for a page buffer in the bufferpool
DBUFWAIT agent is waiting for a directory buffer
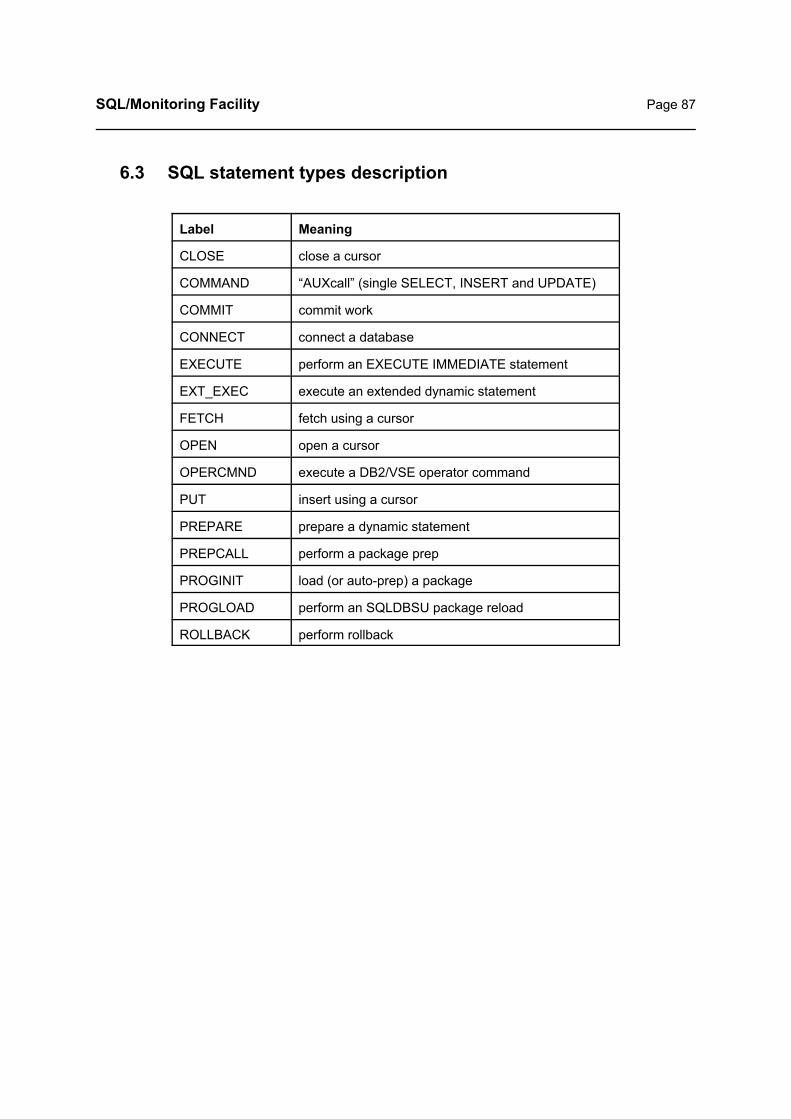
SQL/Monitoring Facility Page 87
6.3 SQL statement types description
Label Meaning
CLOSE close a cursor
COMMAND “AUXcall” (single SELECT, INSERT and UPDATE)
COMMIT commit work
CONNECT connect a database
EXECUTE perform an EXECUTE IMMEDIATE statement
EXT_EXEC execute an extended dynamic statement
FETCH fetch using a cursor
OPEN open a cursor
OPERCMND execute a DB2/VSE operator command
PUT insert using a cursor
PREPARE prepare a dynamic statement
PREPCALL perform a package prep
PROGINIT load (or auto-prep) a package
PROGLOAD perform an SQLDBSU package reload
ROLLBACK perform rollback

Page 88 SQL/Monitoring Facility

SQL/Monitoring Facility Page 89
7 Using SQL/MF: General considerations
7.1 Authorizing access to the User Interface
Access to the SQL/MF user interface is controlled by means of the SQLMF ACF file, whichresides in the SQL/MF library.
The default SQLMF ACF delivered with SQL/MF provides public access to all components of theuser interface. If this is not your intention, modify the file to suit your needs.
7.1.1 Authorization scheme
The authorization component uses following concepts:
ApplicationEach SQL/MF component that can be invoked individually is considered an SQL/MFapplication.
GroupAuthorization to execute a named SQL/MF application is granted to a named group.
UserTo authorize a user on a specific SQL/MF application, the user must be connected to a groupthat has the required authorization.
Private accessAuthorization distinguishes between private and public access. Users with private access (e.g.developers) have access only to the monitor data or table rows that pertain to their userid.Users with public access (e.g. a DBA) have unlimited access to the monitor data.
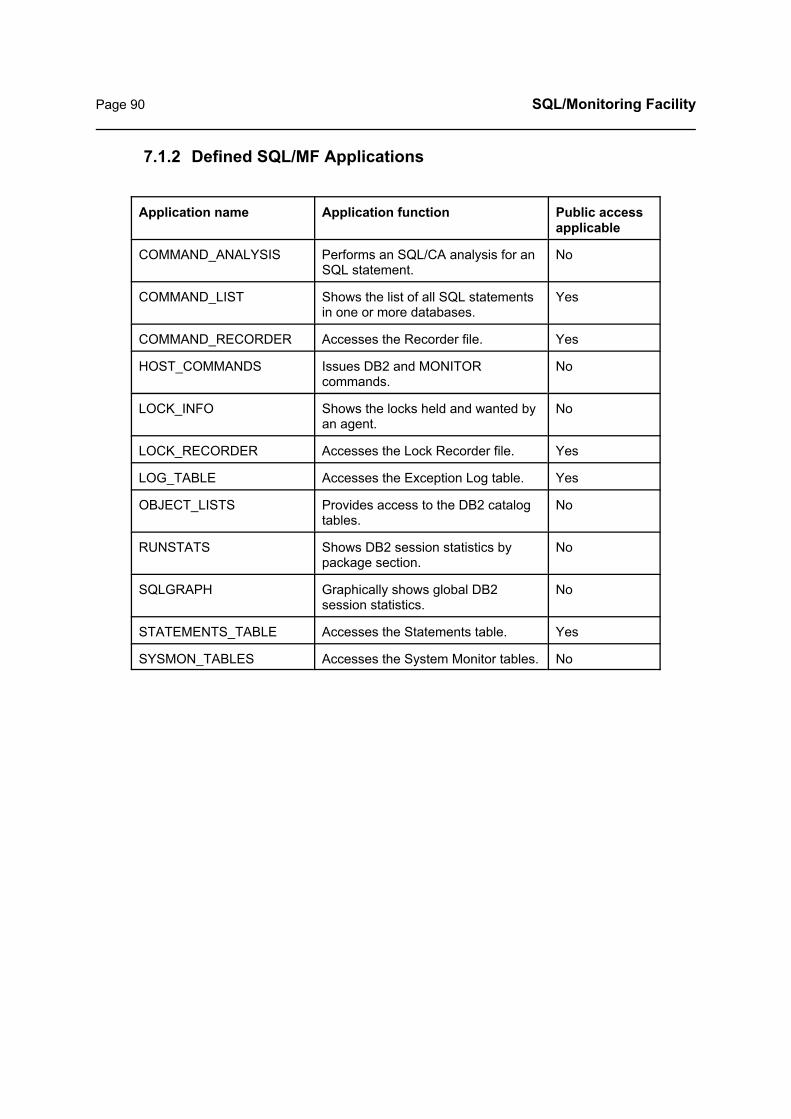
Page 90 SQL/Monitoring Facility
7.1.2 Defined SQL/MF Applications
Application name Application function Public access applicable
COMMAND_ANALYSIS Performs an SQL/CA analysis for anSQL statement.
No
COMMAND_LIST Shows the list of all SQL statementsin one or more databases.
Yes
COMMAND_RECORDER Accesses the Recorder file. Yes
HOST_COMMANDS Issues DB2 and MONITORcommands.
No
LOCK_INFO Shows the locks held and wanted byan agent.
No
LOCK_RECORDER Accesses the Lock Recorder file. Yes
LOG_TABLE Accesses the Exception Log table. Yes
OBJECT_LISTS Provides access to the DB2 catalogtables.
No
RUNSTATS Shows DB2 session statistics bypackage section.
No
SQLGRAPH Graphically shows global DB2session statistics.
No
STATEMENTS_TABLE Accesses the Statements table. Yes
SYSMON_TABLES Accesses the System Monitor tables. No

SQL/Monitoring Facility Page 91
7.1.3 Authorization commands
7.1.3.1 GRANT command
Purpose
Grants access on a named SQL/MF application to a named group.
Syntax
GRANT { PRIVATE | PUBLIC } application TO group
application The name of an SQL/MF application listed in the above table.
group The name of the group that must be granted on the application. The length of thegroupname should not exceed 32 characters. If group is specified as PUBLIC, theapplication is available to all users. A CONNECT statement is not necessary in thiscase.
PRIVATEWhen accessing monitor data, users can inspect only the data produced by their ownSQLID. This is the default option.
PUBLICUsers can inspect all monitor data.
7.1.3.2 CONNECT command
Purpose
Connects a named CICS userid to a named authorization group.
Syntax
CONNECT userid TO group
userid The CICS userid.group An authorization group, previously defined in SQLMF ACF.
7.1.3.3 Comment
A line starting with an asterisk is considered as a comment line.
7.1.3.4 Names
All groupnames and userids should have distinct values. A group cannot have the samename as a connected user.

Page 92 SQL/Monitoring Facility
7.1.4 Distributed authorization file
GRANT COMMAND_ANALYSIS TO PUBLICGRANT PUBLIC COMMAND_LIST TO PUBLICGRANT PUBLIC COMMAND_RECORDER TO PUBLICGRANT HOST_COMMANDS TO PUBLICGRANT LOCK_INFO TO PUBLICGRANT PUBLIC LOCK_RECORDER TO PUBLICGRANT PUBLIC LOG_TABLE TO PUBLICGRANT OBJECT_LISTS TO PUBLICGRANT RUNSTATS TO PUBLICGRANT SQLGRAPH TO PUBLICGRANT PUBLIC STATEMENTS_TABLE TO PUBLICGRANT SYSMON_TABLES TO PUBLIC
7.1.5 Sample authorization file
* The DBA_USER group has unlimited accessGRANT COMMAND_ANALYSIS TO DBA_USERGRANT PUBLIC COMMAND_LIST TO DBA_USERGRANT PUBLIC COMMAND_RECORDER TO DBA_USERGRANT HOST_COMMANDS TO DBA_USERGRANT LOCK_INFO TO DBA_USERGRANT PUBLIC LOCK_RECORDER TO DBA_USERGRANT PUBLIC LOG_TABLE TO DBA_USERGRANT OBJECT_LISTS TO DBA_USERGRANT RUNSTATS TO DBA_USERGRANT SQLGRAPH TO DBA_USERGRANT PUBLIC STATEMENTS_TABLE TO DBA_USERGRANT SYSMON_TABLES TO DBA_USER* The DEVELOPER group has selective accessGRANT COMMAND_ANALYSIS TO DEVELOPERGRANT PUBLIC COMMAND_LIST TO DEVELOPERGRANT PRIVATE COMMAND_RECORDER TO DEVELOPERGRANT PRIVATE LOCK_RECORDER TO DEVELOPERGRANT PRIVATE LOG_TABLE TO DEVELOPERGRANT PRIVATE STATEMENTS_TABLE TO DEVELOPER* Users connected as DBA_USERCONNECT USERA TO DBA_USERCONNECT USERB TO DBA_USER* Users connected as DEVELOPERCONNECT DEV1 TO DEVELOPERCONNECT DEV2 TO DEVELOPERCONNECT DEV3 TO DEVELOPER

SQL/Monitoring Facility Page 93
7.2 Task-oriented Description
7.2.1 Examining running SQL statements
Start the CICS transaction $DBM. This gives you a list of all statements executing in allmonitored databases. By default, the list is refreshed every 3 seconds and ordered bydatabase and statement resource usage. Therefore, the statements at the top of the listusually require your attention. Also note the SQL Cost column in the list. It is computed asTOTIO + (DBSSCALL÷3).
If you want to examine a statement more closely, press ENTER. Position the cursor on thescreen line displaying the statement and press PF4 (the Detail key). On the detail screen, youcan perform a number of functions by PFkey. Press PF3 to return from statement detail to therunning statement list and press the Resume key.
7.2.2 Examining running SQL statements graphically
Start $DBM, press ENTER and PF6 (SQLpulse). This provides a bargraph representing theresource consumption by all packages running in all monitored databases. By default, thebargraph shows the number of DB2/VSE buffer lookups for each package (you can alsorequest a bargraph by CPU or I/O usage). The bargraph is refreshed every 3 seconds bydefault.
If you want to examine a package more closely, press ENTER. Position the cursor on thebargraph line displaying the package and press PF4 (the Detail key). This will continuouslydisplay the monitored data for the statement in bargraph format. Again, press ENTER tointerrupt the display. Use the PFkey interface to perform functions for the statement shown.

Page 94 SQL/Monitoring Facility
7.2.3 Examining the Run Statistics for a DB2/VSE server
Start $DBM, press ENTER and PF9 (RunStats).
The RunStats program will ask the name of the database server to be inspected. After youenter the name, the RunStats utility shows the resource consumption during the DB2/VSEsession summarized by DB2/VSE userid. Use PF5 to summarize the consumption bypackagename.
Using the Detail function you can examine the consumption for a given user or package. Todo so, place the cursor on the user- or packagename and press the PF4 key.
- In a user list, you will receive the list of packages executed by that user.- In a package list, you will receive the list of package sections.- When in a package section list, you can use the Detail key again to obtain the complete
statistics, the statement text (if a prepped statement) and the index used for a givensection.
All the above lists are ordered descending on the current resource consumption counter. Bydefault, this is the number of buffer lookups. But you can also order by CPU usage or by theI/O load, using the PFkey interface.
7.2.4 Examining the System Statistics for a DB2/VSE server
Start $DBM, press ENTER and PF10 (Reports). On the next panel, put the cursor on theSystem Reports line and press ENTER. A number of system monitor reports are nowpresented. To select a report, put the cursor on the report name and press ENTER. On thenext panel you can specify the name of the server and eventually a date/time period you wantto examine.
The System Monitor interface has reports for inspecting the usage of the storage pools, theDB2/VSE log, the DB2/VSE connections and more.
To return to the $DBM screen, press PF3 repeatedly.
7.2.5 Examining the status of a DB2/VSE server graphically
Start $DBM, press ENTER and PF6 (SQLgraph). On the next panel, confirm or modify thename of the database to inspect. SQLGRAPH then shows a bargraph for the resourceconsumption during the last 60 minutes. Press ENTER to enable the PFkey interface. UsePF7 and PF8 to browse the graph backwards and forwards. PFkeys are also available to alterthe format of the bargraph, to switch between numeric/graphic mode etc.

SQL/Monitoring Facility Page 95
7.2.6 Examining statement usage statistics
During execution, the monitor maintains the execution frequency, the access path and thelatest resource consumption for all SQL statements executed in the SQLCS_SQL_STMNTStable. You can inspect this table as follows:
Start $DBM, press ENTER and PF10. This provides the Report Menu. Choose “StatementStatistics”. On the next panel:
- Using PF4, invoke the SC report to show the statement statistics for a package.
- Using PF4, invoke the SCUTIME report to show the statistics for the packages thatexecuted during a specified date and time period. The report is sorted by descendingDB2/VSE buffer lookup, so that the statements with the highest cost appear at the top ofthe list.
- Using PF4, invoke the PCOST report to show the statistics for all packages executed inthe current monitoring session. The report is ordered by descending package cost andwithin each package, by descending statement cost. (The cost value is computed asTOTIO + (DBSSCALL ÷ 3)).
7.2.7 Examining package usage statistics
During execution, the monitor maintains the total resource consumption for all static (prepped)packages. You can inspect this table as follows:
Start $DBM, press ENTER and PF10. This provides the SQL/MF Report Menu. Choose“Package Statistics”. On the next panel:
- Using PF4, invoke the PPROG report to show the total statistics for a package (or forseveral packages if you use a generic package name).
- Using PF4, invoke the PDETAVG report to show the average package statistics i.e.total_statistics ÷ LUWS column
- Using PF4, invoke the PUSER report to show the package statistics summarized byinvoking DB2/VSE Userid.
Note The package execution statistics are suitable for accounting purposes.

Page 96 SQL/Monitoring Facility
7.2.8 Examining the statement exception Log
You can specify a number of exception values in the SQLMF CONFIG file (see page 49), andcause an exception log event for SQL statements exceeding the exception value. Forinstance, you can request to log statements that perform more than N buffer lookups. Toinspect the exception log, proceed as follows:
Start $DBM, press ENTER and PF10. This provides the SQL/MF Report Menu. Choose“Statement Exception Log”. On the next panel:
- Using PF4, invoke the LCHRONO report to show the statement exceptions inchronological order.
- Using PF4, invoke the LREASON report to show the statement exceptions by loggingreason.
- The remaining L reports show the statement exceptions in different order.
7.2.9 Monitoring DB2 Internal DBspace usage
- SQL/MF records the number of pages written to internal DBspaces by an SQL statement.This statistic is stored into the INT_DBSP column of the tables SQLCS_LOG andSQLCS_SQL_STMNTS.
- The LIDBSP report in the Statement Exception Log menu lists all SQL statements thatwrite more than INT_DBSP pages in internal DBspaces. INT_DBSP is a report variableassigned by the user.
- The IDBSP batch report lists all SQL statements that write more than IDBSP pages tointernal DBspaces. More details on page 148.
- The NOTIFY IDBSPUSE configuration statement requests a notification when the use ofinternal DBspaces reaches a defined threshold. More details on page 63.
- The MONITOR SHOW IDBSPUSE command shows internal DBspace usage in realtime.More details on page 161.
7.2.10 Examining the benchmark Log
When requested, the Monitoring Facility benchmarks a package by storing all the statements itexecutes in the LOG table. To inspect the benchmarking results, proceed as follows:
Start $DBM, press ENTER and PF10. This provides the SQL/MF Report Menu. Choose“Benchmark Reports”. On the next panel:
- Using PF4, invoke the BCHRONO report to show the benchmarked statements inchronological order.
- The remaining B reports allow you to inspect the benchmark log in a different order.

SQL/Monitoring Facility Page 97
7.2.11 Printing monitor reports
- When displaying one of the above logging or statement statistic reports, the Hardcopyfunction of the editor can be used to print the entire report or one report page.
- Alternatively, you can use the SQLCSPRT program for printing purposes. For a completedescription of this program, please refer to page 147.
7.2.12 Executing Host Commands
The Monitoring Facility allows you to execute a DB2/VSE or a MONITOR command in one ofthe monitored databases.
To do so, start $DBM, press ENTER and PF12 (HostCmnd). On the next panel, type thename of the target database and the text of the command, prefixed with MONITOR if anSQL/MF command.
For more details, please refer to page 155.

Page 98 SQL/Monitoring Facility

SQL/Monitoring Facility Page 99
8 Using SQL/MF: Inspecting runtime data
8.1 Inspecting running SQL statements using $DBM
8.1.1 Statement List
The $DBM program allows you to inspect all running SQL statements and to take actions onany of them.
The program continuously shows the list of all running SQL statements in all monitoreddatabases on the screen, at the specified display interval. The statement list is ordered bydatabasename and descending SQL cost, so that the statements consuming most resourcesin each database, appear at the top of the list. The list shows all users that are in logical unit ofwork, even if they are not effectively running SQL. The SQL_Cost item shown is computed inthe same way as the DB2/VSE Query Cost Estimate, namely: total I/O requests + (number ofDBSS_calls / 3). Statement lines with a cost greater than 1000 will be highlighted.
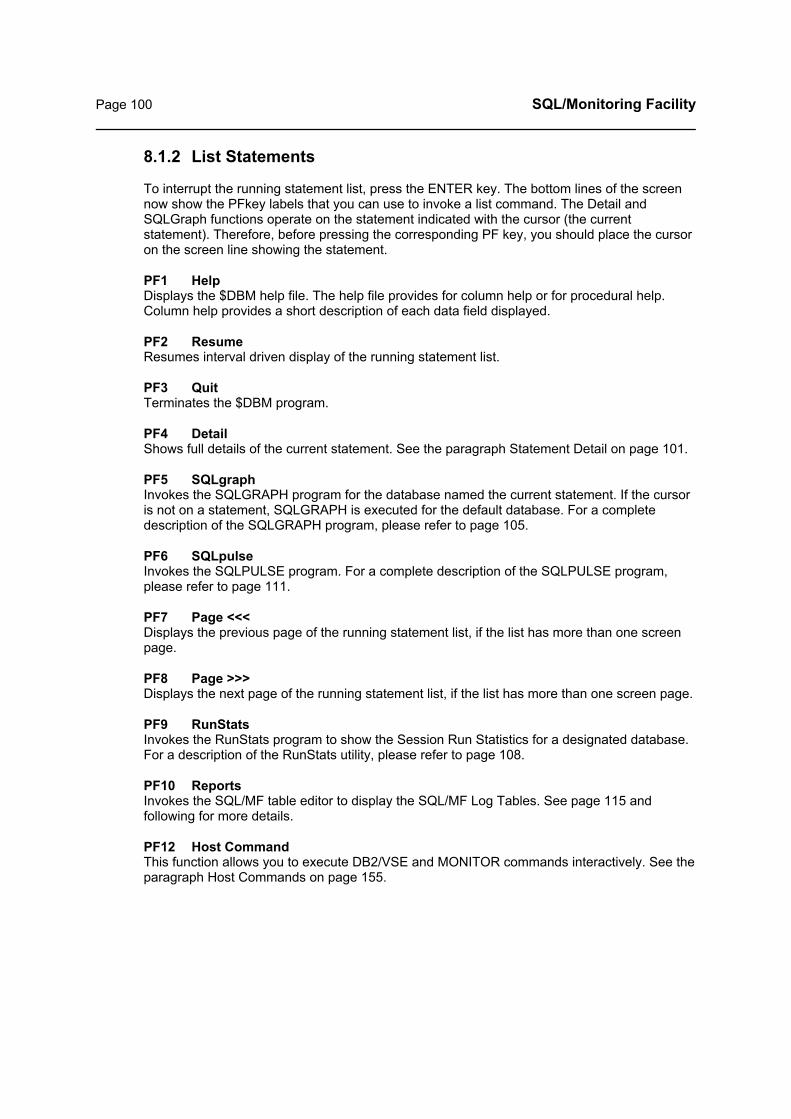
Page 100 SQL/Monitoring Facility
8.1.2 List Statements
To interrupt the running statement list, press the ENTER key. The bottom lines of the screennow show the PFkey labels that you can use to invoke a list command. The Detail andSQLGraph functions operate on the statement indicated with the cursor (the currentstatement). Therefore, before pressing the corresponding PF key, you should place the cursoron the screen line showing the statement.
PF1 HelpDisplays the $DBM help file. The help file provides for column help or for procedural help.Column help provides a short description of each data field displayed.
PF2 ResumeResumes interval driven display of the running statement list.
PF3 QuitTerminates the $DBM program.
PF4 DetailShows full details of the current statement. See the paragraph Statement Detail on page 101.
PF5 SQLgraphInvokes the SQLGRAPH program for the database named the current statement. If the cursoris not on a statement, SQLGRAPH is executed for the default database. For a completedescription of the SQLGRAPH program, please refer to page 105.
PF6 SQLpulseInvokes the SQLPULSE program. For a complete description of the SQLPULSE program,please refer to page 111.
PF7 Page <<<Displays the previous page of the running statement list, if the list has more than one screenpage.
PF8 Page >>>Displays the next page of the running statement list, if the list has more than one screen page.
PF9 RunStatsInvokes the RunStats program to show the Session Run Statistics for a designated database.For a description of the RunStats utility, please refer to page 108.
PF10 ReportsInvokes the SQL/MF table editor to display the SQL/MF Log Tables. See page 115 andfollowing for more details.
PF12 Host CommandThis function allows you to execute DB2/VSE and MONITOR commands interactively. See theparagraph Host Commands on page 155.

SQL/Monitoring Facility Page 101
8.1.3 Statement Detail
The statement detail function shows for a given statement all monitor data columns, describedon page 81.
Note
When a sequence of identical statements is being performed (a sequence of cursor basedfetches for example), the statistics reflect the consumption of all statements in the sequence.Moreover, cursor related fetch and put statements are considered identical for the purpose ofmonitoring.

Page 102 SQL/Monitoring Facility
8.1.4 Statement Detail functions
When the statement detail screen is shown, following actions may be taken on the statement,by pressing the corresponding PFkey.
PF1 Help
Displays the help file for the statement detail function.
PF2 Resume
Resumes display of the running statement list.
PF3 Quit
Terminates the statement detail function and returns to the statement list, without resuming it.
PF4 Analyze
Invokes SQL/Command Analysis for the current statement, if our SQL/CA product has beeninstalled on your system.
PF5 Package Statistics
Shows, for the current statement, the statistics recorded for the entire package in theSQL_STMNTS table. These statistics show:
- the resource consumption for each statement in the package- the primary access path noted for each statement- the SQL statement text for each statement in the package
PF6 Lock Info
When the agent is in the lock wait state, PF6 displays the Lock Graph for the agent. (The lockgraph shows the lock hierarchy between all agents involved in a lock).
When the agent is not in lockwait, PF6 shows the locks currently held by the agent, by issuingthe DB2/VSE command Show Lock User.
In both cases, the function shows the DBspace names for all DBspace numbers appearing inthe command output.
PF7 Previous Page
Shows the detail screen for the previous agent in the running agent list.

SQL/Monitoring Facility Page 103
PF8 Next Page
Shows the detail screen for the next agent in the running agent list.
PF9 Graphic
Shows agent detail in graphical format, by calling the SQLPULSE function described on page111.
PF10 CmndText
Displays the full and formatted SQL statement text. Long statements may take several pagesto display. Use PF7 and PF8 to browse through the pages. Press PF3 to terminate the textdisplay.
PF11 Force
Issues the DB2/VSE FORCE ROLLBACK command for the running agent. Before forcing, thefunction will send the confirmation prompt Continue force? to which you must reply Y toproceed.
When you issue your force request, the agent may actually no longer be active, or may beexecuting another package. Therefore, your force request is rejected:
- when the agent is no longer in work- when another DB2 userid runs on the same agent structure- when the agent executes a package different from the one appearing on the detail screen
PF12 Objects
The function shows the DB2/VSE catalog information for the current Dbspace, table, columnsor index, as described on page 119. The Objects function can also invoke the CatalogNavigator, which is described on page 151.
Page 104 SQL/Monitoring Facility
8.1.5 Host Commands
This function lets you execute a DB2/VSE or a MONITOR command in a designated databaseserver.
On the host command screen specify:
- the name of the desired database - the text of the command, prefixed by the word MONITOR if an SQL/MF MONITOR
command is issued
On completion of the command, its output is displayed on your terminal. If the output showsseveral pages, use PF7 and PF8 for browsing. Press PF3 to quit the Host Command functionand to return to the running statement list.
For a description of the host command interface, read page 155. For a description of theMONITOR command, goto page 156.
SQL/Monitoring Facility Page 105
8.2 Using SQLGRAPH
The SQLGRAPH function provides a graphical representation of activity within a given DB2 server,by showing a bar graph with the following counters:
- number of RDS calls- number of buffer lookups- number of LUWs- total number of I/O requests
When started, SQLGraph continually displays the DB2/VSE activity counters for the last hour, witha display resolution of one minute.
8.2.1 Invocation
The SQLGRAPH function is invoked from $DBM through the SQLgraph function key PF5. Ifthe cursor is on an active statement, the program shows the activity within that Database.Else, the activity in the default Database is shown.
8.2.2 SQLGRAPH Functions
SQLGRAPH provides a PFkey driven interface to perform the following functions:
PF1Displays the SQLGRAPH help file.
PF2Refreshes the output display.
PF3Terminates the SQLGRAPH utility and returns to $DBM.
PF4Toggles between graphical and numeric output mode. The graphical mode shows the DB2/VSE counters as a bar graph. The numeric mode shows the DB2/VSE counters as numbers, with 20 periods on one screen.
PF5Toggles between the Period and the Session display modes. The “period” mode shows the DB2/VSE activity for one hour, with a display resolution of oneminute. The “session” mode shows the DB2/VSE activity for an entire session, from 6 AM to 8 PM,with a resolution of 15 minutes.
PF6Shows the DB2/VSE Buffer Pool usage graph. This function is described on page 107 of thismanual.
PF7Displays the previous period, that is, the previous hour in graphical mode, or the previous 20minutes in numeric mode
PF8Displays the next period, that is, the next hour in graphical mode, or the next 20 minutes innumeric mode
Page 106 SQL/Monitoring Facility
PF9Inspects another database server.
PF10Saves the current graphical counters to a file, with the following default name:
filename = G$yymmdd (Where yymmdd is the current date)filetype = databasename
Before saving, you have the opportunity to modify the default filename and filetype.
PF11Loads and shows the graphical counters from a previously saved file. A panel is displayed toenter the name of the file to be loaded.
PF12Selects the DB2/VSE counters to be shown.By default, all counters (RDSCALL, BUFLOOK, LUW, TOTIO) are displayed.
The PF12 key function displays a panel where one or more counters can be enabled (byentering Y) or disabled (by entering N).
The selections made on this panel are saved in a file and remain in effect for all subsequentSQLGRAPH sessions, until modified by another PF12 request.
Notes:
1. A colour 3270 terminal is required to display the bar graph.
2. The absolute values of the DB2/VSE counters are reduced to fit on the 20 screenpositions that constitute the y-axis. A large reduction factor may cause loss of precisionwhen displaying small sampled values. To view the real counter values, the numeric modecan be toggled.
3. For a given sampling interval, the individual counters are superposed with differentcolours. If different counters are within the same range, one or more counters may beinvisible. To view all counter values, the numeric mode can be toggled.

SQL/Monitoring Facility Page 107
8.2.3 Buffer Pool usage graph
The buffer pool usage function shows how individual DBspaces are making use of theDB2/VSE buffer pool.
The function counts the number of page and directory buffers allocated to each DBspace anddisplays the 19 DBspaces that own the highest number of buffers. The first line in the reportshows the number of unused buffers.
The number of used buffers is expressed as a percentage of the total number of buffers inuse.
The panel shows the page buffer usage to the left and the directory buffer usage to the right ofthe screen.
A special entry is made for the buffers owned by the DB2/VSE log and the internal DBspaces(if it belongs to the high-use entries).
Following functions key are provided on the buffer pool usage panel:
PF2Refreshes the graphical output for the current database.
PF3Quits the function and returns to the main SQLGRAPH panel.
PF4Allows to get the buffer pool usage for another database server.

Page 108 SQL/Monitoring Facility
8.3 Invoking the RunStats Function
In each database server, SQL/MF keeps a number of statistics for each package section, that is,for each SQL statement executed. These statistics are maintained for the duration of the entireDB2 session and can be saved to a DB2 table using the RETAIN_RUNSTATS option in theSQLMF CONFIG file.
Following statistical counts are provided:
- the number of times a section has been executed- the section’s CPU usage expressed in milliseconds- the number of buffer lookups performed by the section- the number of I/O requests performed by the section
The RunStats function lets you examine these statistics in an hierarchical manner. It is invoked bypressing PF9 in the $DBM program.
At entry into the function, specify the name of the database you want to inspect. If theRETAIN_RUNSTATS option has been enabled, the function request screen allows you to enterthe following additional selection arguments:
Show Runstats by period Enter Y if you wish to consult the saved runstats table. Enter N if you wish to consult the currentsession runstats.
PackagenameSpecify a package name to be examined. If left blank, all packages are shown. Package namesare generic by default, that is, all packages beginning with the specified string will be included.
Date_fromEnter the start date for selection as yyyy-mm-dd.
Date_toEnter the end date for selection as yyyy-mm-dd.
Time_fromEnter the start time for selection as hh:mm:ss.
Time_toEnter the end time for selection as hh:mm:ss.
Initially, RunStats graphically shows the resource consumption in all sections summarized by DB2userid. Using PF5, you can request a resource consumption report, summarized bypackagename.
On these reports, use the Detail function to explore the consumption by a given user or package.To do so, place the cursor on the user- or packagename and press the PF4 Detail key.- In a user list, you receive the consumption in the packages executed by that user.- In a package list, you receive the consumption in the package sections, i.e. the individual SQL
statements- In a package section list, you obtain the complete statistics, the statement text (if a prepped
statement) and the access path for a given section. This information is obtained from theSQL/MF "SQL_STMNTS" table. If the package section is dynamic and if the LOG DYNCOMoption has been specified in SQLMF CONFIG, the package section text is obtained from theSQLCS_LOG table.
All the above lists, except the section detail, are ordered by descending resource consumption

SQL/Monitoring Facility Page 109
count. By default, the consumption is shown in terms of buffer lookups. But you can order by CPUusage or by I/O load, using the PFkey interface. By default, the total resource consumption isshown, that is, the consumption during one statement execution. A PFkey allows you to swapbetween the "totals" and "averages" counters.
When inspecting the saved runstats table, the output report will also contain the date and the timeof the selected table rows.
Note All options selected during a RunStats session are saved to file and representedas the default options at the next execution of RunStats.

Page 110 SQL/Monitoring Facility
Pfkey functions
PF1Displays the help file.
PF2Toggles between numeric and graphical output mode.In numeric mode, the report shows the value of the counters and the number of executions. Ingraphical mode, the number of executions is not displayed.
PF3Terminates the RunStats utility program.
PF4Provides detailed information for the report line, pointed to by the cursor.- In the user list, PF4 shows the packages executed by a user.- In the package list, PF4 shows all executed sections (statements) within a designated
package.- In the package-section list, PF4 shows the section information from the SQL/MF "Statements"
or the exception log table.
PF5Swaps between the "Users" and "Packages" consumption reports.
PF6When in the package section list, PF6 will invoke the statement recorder for the section pointed toby the cursor, provided that the statement recorder has been started.
PF7Shows the previous page of the report.
PF8Shows the next page of the report.
PF9Shows the CPU usage counters.
PF10Shows the buffer-lookup counters.
PF11Shows the I/O counters.
PF12Swaps between "Averages" and "Totals" counters. The average counters show the totalconsumption, divided by the number of package executions.

SQL/Monitoring Facility Page 111
8.4 Using SQLPULSE
The SQLPULSE function provides a graphical representation of DB2/VSE activity by all runningstatements in all monitored databases. SQLPulse shows a bar graph for all running statementswith one the following counters:
- number of buffer lookups performed by the statement- total number of I/O requests performed by the statement- CPU used by the statement
Each position in the bar graph represents:
- 1 second of CPU usage- 100 I/O requests- 1000 buffer lookups
When started, the program continually displays the current DB2/VSE activity with a displayresolution of 3 seconds. The output data is ordered by descending resource consumption. Tointerrupt the automatic display, press the ENTER key which displays the PFkey interface.
8.4.1 Invocation
The function is invoked from the $DBM program using the SQLpulse Pfkey (PF6).
8.4.2 SQLPULSE Functions
SQLPulse provides a PFkey driven interface to invoke the following functions:
PF1Displays the help file.
PF2Resumes interval driven display after its interruption by a previous PFkey function.
PF3Terminates SQLPULSE and returns to $DBM.
PF4Provides a detail graph for the statement on the screen line pointed to by the cursor. SeeSQLPULSE Detail below.
PF6Selects the resource item to be shown. By default, the BUFLOOK information is displayed.The PF6 key lets you toggle the selectable columns, in the following order: BUFLOOK,TOTIO, CPUTIME. Your latest selection is saved on file and re-used for subsequentSQLPULSE sessions. PF6 causes an automatic resume.

Page 112 SQL/Monitoring Facility
8.4.3 SQLPULSE Detail
The detail function provides a graphical representation of resource usage by the SQLstatement, pointed to by the cursor. The function shows for the current SQL package section:
- the databasename, userid, package name and package section number- the statement start and elapsed time- the text of the SQL statement being executed (for both static and dynamic statements)- the statement’s access path- a graphical representation of the following counters:
- CPU time used in milliseconds- I/O wait time in milliseconds- Communications wait time in milliseconds- Lock wait time in milliseconds- Number of RDS calls- Number of DBSS calls- Number of DB2/VSE dispatcher calls- Number of locks- Number of lock escalations- Number of page and directory buffer lookups- Number of read IO's- Number of write IO's- Number of accesses to internal DBspaces
The graphics are refreshed every 3 seconds. If the logical unit of work terminates, the globalscreen is automatically re-activated.

SQL/Monitoring Facility Page 113
To stop the automatic refresh, press ENTER. This freezes the bar graph and enables thefollowing PFkeys:
PF1Displays this help file.
PF2Resumes the time-driven display.
PF3Terminates SQLPULSE detail and returns to the global display.
PF4Invokes the SQL/Command Analysis program product for the current statement.
PF5Displays the full and formatted SQL statement text. Long statements may take several pagesto display. Use PF7 and PF8 to browse through the pages. Press PF3 to terminate the textdisplay.

Page 114 SQL/Monitoring Facility

SQL/Monitoring Facility Page 115
9 Using SQL/MF: The Table EditorAll data recorded by SQL/MF in its monitoring tables are accessed using the SQL/MF TableEditor.
To start the table editor, run the $DBM program and the PF10 (Reports) key.
A menu is now displayed, allowing you to choose one of the following report classes:
- the statement exception reports (statements logged due to their resource consumption)- the statement statistics reports (last recorded statistics for all statements in all DB2/VSE
packages)- the package statistics reports (last recorded statistics for all DB2/VSE packages)- the benchmark log reports (statements logged due to a benchmarking request)- the statement recording reports (if the facility has been enabled)- the lockwait recording reports (if the facility has been enabled)- the system monitor reports
Select one of the report classes by placing the cursor on the corresponding screen line. Thenpress the <Enter> key.
All reports available for the selected report class are shown.. Reports are provided to display thelog in a predefined order: in chronological order, by username, by package name, by CPU usage,by I/O usage .., as shown in the report descriptor line on the screen.You can write your own log reports, which will be added to the menu automatically. For details onthis subject, please read page 199.
To select a particular report, place the cursor on the corresponding screen line and press ENTERor PF4 (Execute key).

Page 116 SQL/Monitoring Facility
All reports contain variable symbols, which you can assign on the screen that is displayed next.Most variables have default values, but you may alter the displayed default values. Your inputshould be a syntactically valid SQL expression. Following variable symbols can be assigned:
&SEL_DATE_FROM&SEL_DATE_TO
SEL_DATE_FROM and SEL_DATE_TO specify the date range for the log table rows to bedisplayed. The default value for both variables is CURRENT DATE, which will display today’slog table entries. You may enter any valid SQL duration expression to specify another range,for example:
SEL_DATE_FROM CURRENT DATE - 7 DAYSSEL_DATE_TO CURRENT DATE
to display the log entries of the past week.
&OPT_CLAUSE
If desired, you can specify an expression on one or more columns of the log table. Forexample COMM_TYPE=’OPEN’ to display SQL OPEN statements only. For a description ofthe log table, please read page 187 and following.
&ORDER_BY
Defines the default order of the report, which you may modify or complement.
The Report function keeps the latest values assigned to each report variable in a member ofthe SPR.PDS library. When the same report is subsequently invoked, these values arerepresented as defaults.

SQL/Monitoring Facility Page 117
9.1 Report Display
When you have completed your selection, the selected log table rows are displayed on the screen.For a description of the data columns appearing in the report, refer to page 81.
The report is initially displayed in list mode. The screen then contains as many log rows as fit,each row taking one screen line. Since a log table row cannot be displayed on 80 columns, aviewing window concept is used.
Alternatively, the report may be displayed in page mode. In this mode, a screen contains one tablerow only.
Please note the following:
- all statistic columns in the log table show package section related values: the totalconsumption by the section is shown in the last statement of that section
- all chronological statistics in the log table (CPUtime, IOWAIT time etc.) are expressed inmilliseconds

Page 118 SQL/Monitoring Facility
9.2 Acting upon the report
The report is shown by default in list mode.
The list is manipulated using a PFkey driven interface. Some command keys operate on thecurrent row. (The row that is highlighted on the screen).
PF1Displays the editor help file. The help file provides for column help or for procedural help.Column help provides a short description of each data field displayed in the current list.
PF2Invokes the Objects function. See Object Editor Function on page 119.
PF3Terminates the table editor.
PF4Forwards the current statement to the SQL/Command Analysis tool, if installed on yoursystem.
PF5Performs report formatting functions. See Formatting the report on page 120.
PF6Shows the first page of the log report.
PF7Shows the previous page of the log report.
PF8Shows the next page of the log report.
PF9Shows the last page of the log report.
PF10In list mode, moves the viewing window to the left.In page mode, calls the report search function described on page 122.
PF11In list mode, moves the viewing window to the right.In page mode, hardcopy the current screen. The hardcopy printer file is closed when the tableeditor is terminated.
PF12Swaps between “list” and “page” display mode.
SQL/Monitoring Facility Page 119
9.3 Object Editor Function
The Objects function displays the object selection menu. To select one of the menu items, placethe cursor on the corresponding screen line and press ENTER.
When the Statement Statistics or Log table is edited, all the items shown are available, providedthat the statement is a static one.
When the Log table is edited and an SQLCODE log entry is being processed, the additional itemSQLCA Map is available.
Statement Text Displays the full and formatted SQL statement text. Long statements may take several pages todisplay. Use PF7 and PF8 to browse through the pages. Press PF3 to terminate the text display.
Plan IndexShows the SYSINDEXES row for the primary index used by the statement.
Table IndexesShows the SYSINDEXES rows for all indexes created on the table accessed by the statement.
Table Shows the SYSCATALOG row for the table accessed by the statement.
Table Columns Shows the SYSCOLUMNS rows for the columns of the table accessed by the statement.
DbspaceShows the SYSDBSPACES rows for the DBspace accessed by the statement.
SQLCA MapFor an SQLCODE log event, this object request formats all fields of the SQLCA at the time of theSQLCODE. Moreover, the DB2/VSE help information for this SQLCODE is included from theDB2/VSE Help tables. The SQLCA Map may contain several pages. Therefore, it is presented asa list and browsed using the standard PFkey interface.
Catalog NavigatorBrowses the DB2/VSE catalog tables. See page 151 for details.
The catalog object lists are displayed using the Table Editor. To manipulate the catalog lists, usethe PFkey interface. Exiting the catalog list will return to the Object Menu.
The current table from the current statement is shown and may be modified, thus allowing catalogaccess for other objects in the database.
To exit the Object menu, press PF3.
Page 120 SQL/Monitoring Facility
9.4 Formatting the report
When invoked, the report format function displays a function menu. Select the desired function bycursor positioning or enter the code corresponding to the desired formatting function, as follows:
F to hide, unhide, sort or displace report columnsH to take a hardcopy of the list L to move the viewing window to the left marginR to move the viewing window to the right marginG to enable graphical mode display for numerical columnsN to disable graphical mode display for numerical columns
List reformatting
The F function shows all columns in the report, preceded by a + sign if the column is currentlydisplayed or by a - sign if the column has been hidden previously. You may override the + or -sign in the following manner:
Enter + to unhide a previously hidden column, so that the column is displayed again.
Enter - to hide a column so that it is no longer displayed, although it remains in the report.
Enter < to sort the report on this column in ascending sequence (low to high). Only oneordering column can be designated.
Enter > to sort the report on this column in descending sequence (high to low). Only oneordering column can be designated.
Enter 1-9 to move the column to the corresponding position in the report. The columnpreviously on that position will take the position of the column moved. Placing acolumn on position 1 of the report will freeze it: the editor always leaves the firstcolumn on the screen when moving the viewing window.

SQL/Monitoring Facility Page 121
List hardcopy
The H function prints the entire list. The name of the POWER/VSE queue entry isSQLMFxxxx where xxx stands for the issuing CICS terminal name. The queue entry iscreated with DISP=H.
Skip to left margin
When the display window has been moved, you can return to the first column in the list, byexecuting the L function.
Skip to right margin
When the display window has been moved, you can return to the last column in the list, byexecuting the R function.
Enable graphical mode
With graphical mode enabled, numerical columns are shown in bargraph format when thereport is in pagemode. Moreover, the highest column value in the list is highlighted.
Disable graphical mode
Resets graphical mode.
PF key definitions:
PF1 Requests helpPF3 Terminates reformat.

Page 122 SQL/Monitoring Facility
9.5 Searching the report
The report search function is called by pressing PF10 when the list is displayed in page mode.
The search function requests the following search criteria:
Search columnEnter the name of the list column to be searched. Use the column name that appears as columnheader on the display screen.
Search valueEnter the value to find in the search column.The specified search value can be partial. The search column is examined over the length of thespecified value only.By default, an equal search is performed. By prefixing the search value with one of the logicaloperators < > <= >= ^= you can perform a not-equal, a lower-than or a greater-than search. Blanksmay, but need not, intervene between the operator and the value.You can also specify MIN or MAX as the search value, to find the minimum or maximum value ofthe search column in the list.
Search directionEnter the > sign to search the list in forward direction, which is the default.Enter the < sign to search the list in backward direction.
Notes
(1) Except for a MIN or MAX search, which always scans the entire list, searching startsat the position of the current report line + 1. When the search is productive, the currentline is positioned on the list entry found. This allows to repeatedly apply the samesearch arguments.
(2) The last search criteria entered are redisplayed on the next search panel.
(3) Logical operators and MIN/MAX functions can also be applied to non-numerical listcolumns.
PF key definitions:
PF1 requests helpPF3 exits search

SQL/Monitoring Facility Page 123
10 Using SQL/MF: Inspecting the monitor tables
10.1 Examining the Exception Log table
The exception logs are recorded in the SQLCS_LOG table and the $DBM table editor is used todisplay them. Please refer to page 115 and following for a complete description of the TableEditor.
To start the program, run the $DBM program, press the PF10 key and select the Exception Logmenu entry. On the Log Report menu, choose one of the exception reports by pressing theExecute PFkey.
For a description of the data columns appearing in the report, refer to page 81.

Page 124 SQL/Monitoring Facility
10.2 Exception Log Reports available
LCHRONO Exception log entries in chronological order
LCPU Exception log entries by CPU usage
LDBSCALLException log entries by DBSSCALL/RDSCALL ratio
LDEADLCKException log entries related to deadlocks
LIDBSP Exception log entries by internal dbspace access
LINDX Exception log entries by index name
LLAST Exception log entries in the last hour
LLOCK Exception log entries by locks
LNSIA Exceptions logs for non-selective index access
LPACK Exception log entries by package and section
LREASON Exception log entries by logging reason
LROWCOST Exception log entries by row access cost (BUFLOOK/NROWS)
LTOTIO Exception log entries by number of I/O’s
LUSER Exception log entries by username
LUSERDEFException log entries by user defined criteria
LWAITIO Exception log entries by IO wait time

SQL/Monitoring Facility Page 125
10.3 Examining the Benchmark table
The benchmarking logs are recorded in the SQLCS_LOG table and the $DBM table editor is usedto display them. Please refer to page 115 and following for a complete description of the TableEditor.
To start the program, run the $DBM program, press the PF10 key and select the benchmark logreports menu entry. On the Benchmark Report menu, choose one of the benchmark reports bypressing the Execute PFkey.
For a description of the data columns appearing in the report, refer to page 81.

Page 126 SQL/Monitoring Facility
10.4 Benchmark Reports available
BCHRONO Benchmarked statements in chronological order
BCPU Benchmarked statements by CPU usage
BDBSCALLBenchmarked statements by DBSSCALL/RDSCALL ratio
BIDBSP Benchmarked statements by internal DBspace access
BINDX Benchmarked statements by index name
BLAST Benchmarked statements in the last hour
BLOCK Benchmarked statements by locks
BNSIA Benchmark logs for non-selective index access
BPACK Benchmarked statements by package and section
BTOTIO Benchmarked statements by number of I/O’s
BUSER Benchmarked statements by username
BUSERDEFBenchmarked statements by user defined criteria
BWAITIO Benchmarked statements by IO wait time

SQL/Monitoring Facility Page 127
10.5 Examining the Package Statistics
The package statistics are contained in the Log table and the $DBM table editor is used to displaythem. Please refer to page 115 and following for a complete description of the Table Editor.
To start the program, run the $DBM program, press the PF10 key and select the packagestatistics menu entry. On the Log Report menu, choose one of the package statistic reports bypressing the Execute PFkey.
For a description of the data columns appearing in the report, refer to page 81.
In addition to the package’s resource consumption, the reports provide a column named LUWS,which shows the package execution frequency, that is, the number of times package statisticshave been recorded.

Page 128 SQL/Monitoring Facility
10.6 Package Statistic Reports available
PCOST
Shows for the current session, the packages with the highest resource consumption and, within apackage, the package section with the highest consumption.
PDETAIL
Total package resource consumption by user and package during the requested date range.
PDETAVG
Average package resource consumption by user and package during the requested date range.
PPROG
Total package resource consumption by package during the requested date range.
PUSER
Total package resource consumption by user during the requested date range.
Notes
The PCOST report joins the package statistics from SQLCS_LOG with the statement statisticsfrom SQLCS_SQL_STMNTS. It computes their SQL cost as: (TOTIO+(DBSSCALL/3)). Thepackage cost is not necessarily equal to the summarized cost of all package statements, becausethe package statistics show the actual consumption for the current session, while the statementstatistics show the consumption during the last execution.
The PDETAVG report computes the average consumption as (total_consumption ÷number_of_LUWs_executed)

SQL/Monitoring Facility Page 129
10.7 Examining the Statement Statistics
The statement statistics are kept in the SQL_STMNTS table and the $DBM Table Editor is used todisplay them.
To start the program, run the $DBM program, press the PF10 key and select the statementstatistics menu entry. On the Log Report menu, choose one of the statement statistic reports bypressing the Execute PFkey.
Please refer to page 115 and following for a complete description of the $DBM Table Editor.
For each statement in the selected package(s), the statement statistics allow to view:
- The statement resource usage (for a description of those data columns, please refer to page81).
- The access path of the statement. If a statement accesses multiple tables or participates in areferential constraint, multiple plan rows will be presented, each showing the name of theDBspace, table and index accessed. Moreover, the SEL column will show whether a selectiveor a non-selective index access has been performed. The resource consumption of thestatement section is always contained in the first plan row.
- The text of the statement.

Page 130 SQL/Monitoring Facility
10.8 Statement Statistic Reports available
SCAVGUSEThe average resource consumption of designated package sections. Should be used only whenSECTION_STATS = ‘SESSION’ or ‘DAILY’, in which case SCUSE1 shows the total consumptionper session or day.
SCDBASEThe average, maximum or minimum consumption counts for a designated database.
SCIOPackage sections with a high I/O usage, ordered by descending IO usage.
SCMPATHThe package sections having multiple access plans because they access multiple tables orinternal DBspaces.
SCNBLOCKThe access path information and resource usage for all package sections that execute withoutblocking.
SCNROWSThe access path information and resource usage for all selected package sections, ordered bydescending “number of rows processed”.
SCNSIA The statement statistics for all sections executing by non-selective index scan.
SCPATH1The access path information for the last modification level of the selected statements.
SCPATH2The access path information for all modification levels of the selected statements.
SCPATHNIThe package name and statement text for those statements that execute without index access.
SCRDBSPThe access path information and resource usage for all package sections that refer to tables in thedesignated DBspace.
SCRINDEXThe access path information and resource usage for all package sections that execute using thedesignated index (or indexes if a generic indexname is used).
SCRTABLEThe access path information and resource usage for all package sections that refer to thedesignated table (or tables if a generic tablename is used).
SCTEXTThe SQL statement text for all sections of the selected package(s).
SCUSE1The resource usage for the last modification level of the selected statements.

SQL/Monitoring Facility Page 131
SCUSE2The resource usage for all modification levels of the selected statements.
SCUTIMEThe resource usage for selected statements during a specified time period.
SROWCOST Statement statistics by descending row access cost (BUFLOOK/NROWS)

Page 132 SQL/Monitoring Facility
10.9 System Monitor Reports
10.9.1 Session Summary Report
This report displays for the specified database and the specified period, the following sessionstatistics :
- name of the database monitored- monitoring date- RDS calls during the database session- DBSS calls during the database session- LUWs during the database session- Rollbacks during the database session- Checkpoints during the database session- Long locks during the database session- Lock escalations during the database session- Nr of Locks resulting in wait- Deadlocks during the database session- Page buffer lookups during the database session- Page reads during the database session - Page writes during the database session - Directory buffer lookups during the database session- Directory page reads during the database session- Directory page writes during the database session- Log page reads during the database session- Log page writes during the database session- DASD reads during the database session- DASD writes during the database session- DASDR + DASDW during the database session- Read ratio i.e. the percentage of (PAGRD+PAGWR) that is PAGRD.

SQL/Monitoring Facility Page 133
10.9.2 LUW COUNTER Reports
The detail report displays following items for each monitoring interval :
- name of the database monitored- monitoring date- monitoring time- number of calls to the Relational Data System during the interval - number of calls to Database Storage Subsystem during the interval - RDS/DBSS ratio (giving a complexity approximation of the average SQL access during
the interval)- number of LUWs started during the interval- number of LUWs rolled back during the interval - number of checkpoints taken during the interval - number of failing lock escalations during the interval - number of successful lock escalations during the interval - number of lock requests resulting in wait during the interval - number of deadlocks detected during the interval
The totals report provides the sum of the above items per monitoring session for the selectedperiod.
The averages report provides the average value for the above items per monitoring sessionfor the selected period.

Page 134 SQL/Monitoring Facility
10.9.3 IO COUNTER Report
The detail report displays following items for each monitoring interval:
- name of the Database monitored- monitoring date- monitoring time- number of page buffer lookups during the interval- number of data pages read during the interval- number of data pages written during the interval- data page hit ratio during the interval (see page 240)- directory buffer lookups during the interval- directory pages read during the interval- directory pages written during the interval- directory page hit ratio during the interval (see page 240)- number of log pages read during the interval- number of log pages written during the interval- total number of DASD reads as PAGRD+DIRRD+LOGR- total number of DASD writes as PAGWR+DIRWR+LOGW- total number of DASD I/O’s as DASDRD+DASDWRT
The totals report provides the sum of the above items per monitoring session for the selectedperiod.
The averages report provides the average value for the above items per monitoring sessionfor the selected period.

SQL/Monitoring Facility Page 135
10.9.4 Lock Request Block COUNTER Report
The detail report displays following items for each monitoring interval:
- name of the Database monitored- monitoring date- monitoring time- number of calls to RDS during the interval - number of calls to DBSS during the interval - number of LUWs started during the interval - number of lock request blocks (LRBs) defined within DB2- number of lock request blocks in use at monitoring time- maximum number of LRBs used by any application at monitoring time
The totals report provides the sum of the above items per monitoring session for the selectedperiod.
The averages report provides the average value for the above items per monitoring sessionfor the selected period.

Page 136 SQL/Monitoring Facility
10.9.5 COUNTER Summary Report
The detail report displays following items for each monitoring interval :
- name of the Database monitored- monitoring date- monitoring time- number of calls to RDS during the interval - number of calls to DBSS during the interval - number of LUWs started during the interval- total IO count during the interval- page buffer hit ratio during the interval- directory buffer hit ratio during the interval- CPU time (in seconds) used by the Database server during the interval- number of page reads for the Database server during the interval- number of page writes for the Database server during the interval
The totals report provides the sum of the above items per monitoring session for the selectedperiod.
The averages report provides the average value for the above items per monitoring sessionfor the selected period.
SQL/Monitoring Facility Page 137
10.9.6 Extended Counter Report
The detail report displays following items for each monitoring interval :
- name of the Database monitored- monitoring date- monitoring time- average duration of an I/O request in microseconds- number of checkpoints during the interval- average duration of a checkpoint in milliseconds- number of checkpoint delays during the interval- average duration of a checkpoint delay in milliseconds- maximum number of slots in the DB2 package cache- number of packages loaded- number of packages loaded for active agents- total number of packages monitored in the DB2 session- maximum number of agents active during the monitor interval- dispatching delay for interactive agents in microseconds- number of times a dispatching delay for interactive agents was detected- dispatching delay for non inter-active agents in microseconds- number of times a dispatching delay for non-interactive agents was detected
The totals report provides the maximum value the above items per monitoring session for theselected period. The averages report provides the average value for the above items permonitoring session for the selected period.

Page 138 SQL/Monitoring Facility
10.9.7 Dbspace Buffer Usage Report
The detail report displays following items per monitoring interval for each Dbspace in theselected Database :
- name of the Database monitored- monitoring date- monitoring time- dbspace name- number of page buffers used by this dbspace at monitoring time - number of directory buffers used by this dbspace- percentage of page buffers used by this dbspace- percentage of directory buffers used by this dbspace- number of page buffers used by all dbspaces at monitoring time- number of directory buffers used by all dbspaces- the NPAGBUF initialization parameter- the NDIRBUF initialization parameter
The maxima report provides the maximum values per session for the above items in theselected monitoring period.
The averages report provides the average values of these items per monitoring session.

SQL/Monitoring Facility Page 139
10.9.8 Storage Pool Buffer Usage Report
The detail report displays following items per monitoring interval for all storage pools in theselected Database :
- name of the Database monitored- monitoring date- monitoring time- storage pool number- number of page buffers used by this storage pool at monitoring time - number of directory buffers used by this storage pool- percentage of page buffers used by this storage pool - percentage of directory buffers used by this storage pool - number of page buffers used by all storage pools at monitoring time- number of directory buffers used by all storage pools- the NPAGBUF initialization parameter- the NDIRBUF initialization parameter
The maxima report provides the maximum values per session for the above items in theselected monitoring period.
The averages report provides the average values of these items per monitoring session.

Page 140 SQL/Monitoring Facility
10.9.9 DBSPACE Usage Report
The report displays following items per monitoring session :
- database name - monitoring date- dbspace name- number of data pages defined in the dbspace- number of data pages currently in use- percentage of data pages currently in use- current data page freespace percentage- number of index pages defined in the dbspace- number of index pages currently in use- percentage of index pages currently in use- current index page freespace percentage- number of header pages defined in the dbspace- number of header pages currently in use- percentage of header pages currently in use- current header page freespace percentage
SQL/Monitoring Facility Page 141
10.9.10 DBEXTENT Usage Report
The detail report displays following items for each monitoring interval
- Database name - monitoring date- monitoring time- storage pool number- number of pages defined in the storage pool- number of storage pool pages currently in use- number of storage pool pages currently free- percentage of storage pool pages currently in use- if the short on storage condition did occur for this storage pool during the interval
The maxima report provides the maximum values per session for the above items in theselected monitoring period.
The averages report provides the average values of these items per monitoring session.

Page 142 SQL/Monitoring Facility
10.9.11 DB2/VSE Log Usage Report
The detail report displays following items for each monitoring interval
- database name - monitoring date- monitoring time- number of bytes defined for the logfile- number of bytes written on the logfile during the last monitoring interval- percentage of logfile space used at monitoring time- number of logfile pages remaining before log overflow, if archive disabled- number of logfile pages remaining before implicit log archive, if archive enabled- number of logfile pages remaining before a checkpoint will be taken
The maxima report provides the maximum values per session for the above items in theselected monitoring period.
The averages report provides the average values of these items per monitoring session.

SQL/Monitoring Facility Page 143
10.9.12 User Status Report
This report displays following items for each user active during the monitor interval:
- database name - monitoring date- monitoring time- name of the user- DB2/VSE wait state of this user (agent) as:
- CKPT waiting to perform a checkpoint- COMM in communication wait: agent is waiting for an SQL request from the user- I/O waiting for input/output completion- LOCK waiting for a database resource- OUTB waiting for a directory buffer- OUTP waiting for a page buffer
- number of locks held by this user- number of long locks held by this user
The following columns are filled in only when the user is in the lock wait state :
- type of the lock wanted as:- DB database lock wanted- DBSP DBspace lock wanted- IKEY index key lock wanted- IPAG index page lock wanted- PAGE data page lock wanted- ROW table row lock wanted- SYS system lock wanted- TABL table lock wanted
- dbspace name of the wanted lock- name of the user holding the wanted lock- request mode of the lock held as :
- SIX share and intention exclusive lock- IS intention share lock- IX intention exclusive lock- S share lock- X exclusive lock
- duration of the held lock as :- INST state of a lock is being tested- LONG lock held until end of LUW- MED lock held until end of LUW or explicit release- SHORT lock held until end of DBSS call

Page 144 SQL/Monitoring Facility
10.9.13 Lock Contention Report
Selecting the Lock Contention report provides a User Status Report including those users onlythat have been found in lock wait state. The report provides the same data as the User StatusReport, described above.

SQL/Monitoring Facility Page 145
10.9.14 Checkpoint Delay Report
The detail report displays following items for each occurrence of a long (more than 3 second)checkpoint delay. A checkpoint delay is the situation where the DB2/VSE checkpoint systemagent waits for the completion of long-running DBSS calls in order to initiate a checkpoint.
- database name - monitoring date- monitoring time- name of user active at checkpoint delay time and possibly causing it- wait state of the user- users agent number- set to Y when the user runs a read-write application; N when the application is read-only.- name of package executed- package section number executed
The totals report shows the number of checkpoint delays during each monitor session.
Page 146 SQL/Monitoring Facility
10.9.15 Connections Report
The detail report displays following items for each monitoring interval
- database name - monitoring date- monitoring time- number of users currently connected to DB2/VSE - number of users currently in LUW - number of users waiting for a DB2/VSE agent structure - number of users not in LUW but holding a connection- number of agents structures currently available- number of connections currently available
The maxima report provides the maximum values per session for the above items in theselected monitoring period.
The averages report provides the average values of these items per monitoring session.

SQL/Monitoring Facility Page 147
11 Using SQL/MF: Printing the monitor tables
11.1 Printing from the User Interface
To print a displayed report, hit PF5 to invoke the Format menu and select the Hardcopy function.This will create a POWER/VSE queue entry named SQLMxxxx where xxxx stands for theinitiating CICS terminal name. The queue entry is created in DISP=H.
11.2 Printing the Statement Monitor Tables using SQLCSPRT
The SQLCSPRT program provides a printed report facility for the benchmark log, the exceptionlog, the package statistics and statement statistic tables for a given Database. The contents andthe selection criteria for the reports produced by SQLCSPRT are defined in report control fileswhich reside in the SQL/MF library. These files have the reportname as their filename and“SQLCSPRT” as filetype. As for the $DBM table editor, you can easily create your own reportlayouts. How to do so is explained on page 202.
SQLCSPRT produces its report in the POWER/VSE queue.
The invocation syntax of SQLCSPRT is as follows:
// EXEC REXX=SQLCSPRT,PARM=’reportname[DATABASE databasename][DATE_FROM begin_date][DATE_TO end_date][WHERE selection clause][ORDER_BY ordering clause]’
The reportname is the only required argument. If the optional arguments are omitted, defaultvalues are taken from the report definition. The following table shows the distributed reports, theirpurpose and their default argument values.

Page 148 SQL/Monitoring Facility
Reportname
Purpose DefaultDatabase
DefaultDate_from
DefaultDate_to
IDBSP DefaultWhere
DefaultOrder_by
BENCHLOG Print thebenchmarklog
All CURRENTDATE
CURRENTDATE
N/A none Database,Logstamp
EXCPLOG Print theexceptionlog
All CURRENTDATE
CURRENTDATE
N/A none Database,Logstamp
IDBSP Printsusagestatisticsfor internalDBspaces
All CURRENTDATE
CURRENTDATE
Selects logentries foragents thatwrite morethen IDBSPpages tointernalDBspaces
none Database,Logstamp
PRGSTATS Print thepackagestatistics
All CURRENTDATE
CURRENTDATE
N/A none Database,Date,PackageName
CMDSTATS Print thestatementstatisticsperpackage
All CURRENTDATE
CURRENTDATE
N/A none Database,Date,PackageName,Section
CMDUSAGE Print thestatementstatistics byusage
All CURRENTDATE
CURRENTDATE
N/A none Database,Date,BUFLOOKDESC
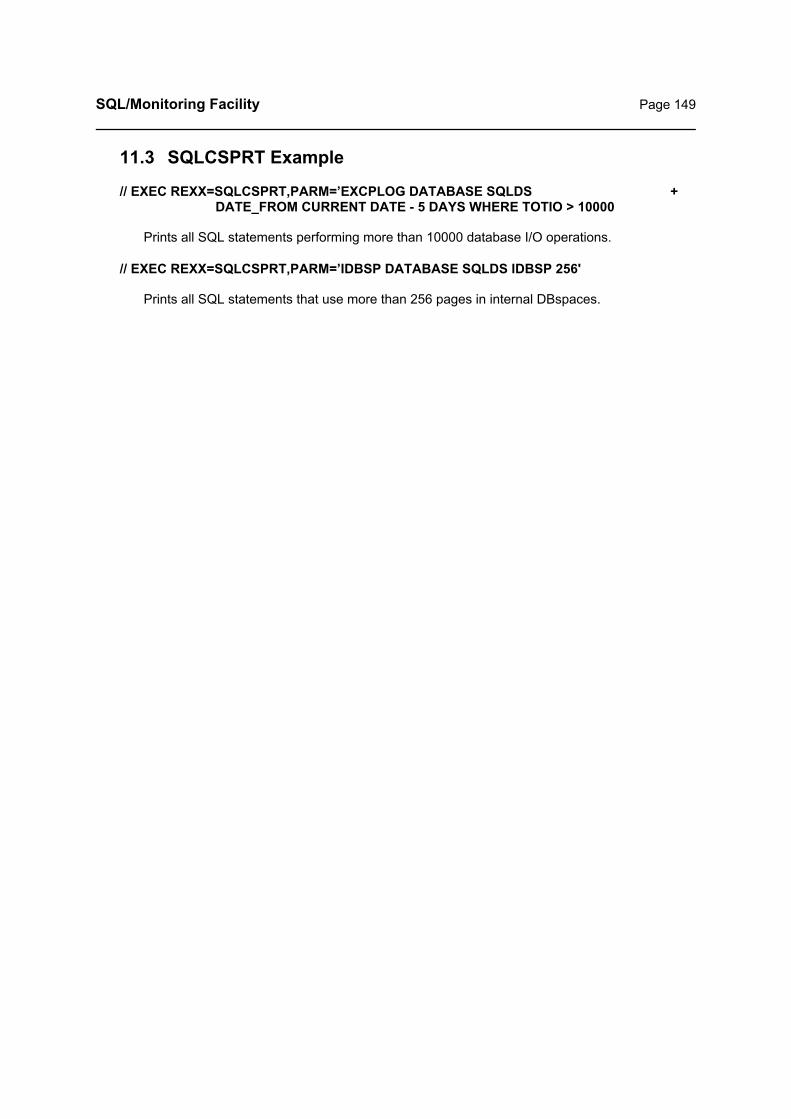
SQL/Monitoring Facility Page 149
11.3 SQLCSPRT Example
// EXEC REXX=SQLCSPRT,PARM=’EXCPLOG DATABASE SQLDS +DATE_FROM CURRENT DATE - 5 DAYS WHERE TOTIO > 10000
Prints all SQL statements performing more than 10000 database I/O operations.
// EXEC REXX=SQLCSPRT,PARM=’IDBSP DATABASE SQLDS IDBSP 256'
Prints all SQL statements that use more than 256 pages in internal DBspaces.

Page 150 SQL/Monitoring Facility

SQL/Monitoring Facility Page 151
12 The Catalog Navigator
12.1 Catalog Lists
The Catalog Navigator provides its users with a comprehensive interface for interactive,fullscreen access to the DB2 catalogs.
The Catalog Navigator can be called from the Objects function of the user interface program$DBM. The Navigator can also be called directly from CICS, using the $DCN transaction.
Within Catalog Navigator the user may select one of the following catalog lists:
- the package list - the DBspace list- the table list- the table column list- the table index list- the table key constraint list- the view list- the synonym list- the user list- the owning user list
The user selects the desired list by entering:
- an object class from the list that appears in the upper right corner of the screen (A forpackage list, T for table list etc.)
- a DB2 userid representing the creator of the object or a privileged userid- an object name designating the name of the table, index etc. Userid and objectname may
be generic. A generic name will obtain information for multiple catalog objects. If userid orobjectname is omitted, % (all entities) is assumed.
- an optional WHERE clause allows to perform additional selection on any column of thetarget catalog table
- an optional ORDER BY option requests a specific list order
Using the PF2 key, any database where SQL/MF has been installed can be connected under thedefault DB2 userid.
When building the catalog list, the Navigator scans the DB2 catalogs for rows satisfying thesupplied search criteria and stores the selected rows in an internal list. When all information hasbeen extracted, the path to DB2 is closed and the internal list is displayed on the screen. The usermay then browse the list or execute a command on an object in the list. Since browsing is donefrom the Navigator, no locks exist on the DB2 catalogs while the data is being examined.

Page 152 SQL/Monitoring Facility
12.2 Related Catalog Lists
The DB2 catalogs contain hierarchically structured information. To obtain complete informationabout a given SQL object, it is usually necessary to examine several catalog tables. For example:DB2 holds the basic characteristics of a table in SYSCATALOG, the description of the tablecolumns in SYSCOLUMNS, the description of the table indexes in SYSINDEXES and so on.
With the related list concept, the user can easily navigate through the catalog hierarchy. Toobtain related information for a given object in a base catalog list:
- point the cursor to the base objectname - press PF4 - on the related object selection screen, enter:
- the class of the desired related object- eventually a userid and or object name- an optional WHERE or ORDER BY clause
Nested related lists are supported: in a related list, you can invoke a new related list for any objectin the current related list. There is no limit on the list nesting depth.
Following related lists that can be obtained for each base class:
Packages- all DBspaces used by the package- all indexes used by the package- all users having run privileges on the package- all tables referenced in the package- all views referenced in the package
Columns- all users having update authority on a given column- the table where the column belongs to- the view where the column belongs to
DBspaces- all packages using tables in the DBspace- all tables residing in the DBspace
Indexes- all indexes used in the package
Owners - all packages created by the user- all DBspaces acquired by the user- all indexes created by the user- all tables created by the user- all views defined by the user
Privileges- the connect privileges of the user- all packages which the user may execute- all columns on which the user has update authority- all table and view privileges of the user
Tables - all packages containing references to the table- the columns in the table

SQL/Monitoring Facility Page 153
- the DBspace where the table resides- the indexes created on the table- the privileges granted on the table- the synonyms defined on the table- the views defined on the table- the parent table in a referential constraint- the dependent table(s) in a referential constraint- the primary and foreign keys in a referential constraint
Views- all packages containing references to the view- the columns in the view- the privileges granted on the view- the synonyms defined for the view- the tables referenced in the view- the views defined on the view

Page 154 SQL/Monitoring Facility
12.3 Processing the catalog list
Following PFkeys are used to process the list:
PF1Displays the Navigator helpfile.
PF2When in a table or view list, invokes the table browse function. On the browse selectionscreen, you may specify a WHERE or ORDER BY clause, used when performing the tableSELECT.The table list is processed as a catalog list.
PF3Exits the Catalog Navigator.
PF4Invokes a related list.
PF5Perform catalog list formatting (see page 120). The Navigator however has no support for thehardcopy and window move functions. If needed, invoke the general hardcopy function usingPA3.
PF6Goes to the top of the list.
PF7Displays the previous list page.
PF8Displays the next list page.
PF9Goes to the bottom of the mist.
PF10Shifts display window to the left, if in listmode.
PF11Shifts display window to the right, if in listmode.
PF12Toggles between page and list mode. Pagemode displays one table row on the screen,listmode displays multiple rows on one screen.
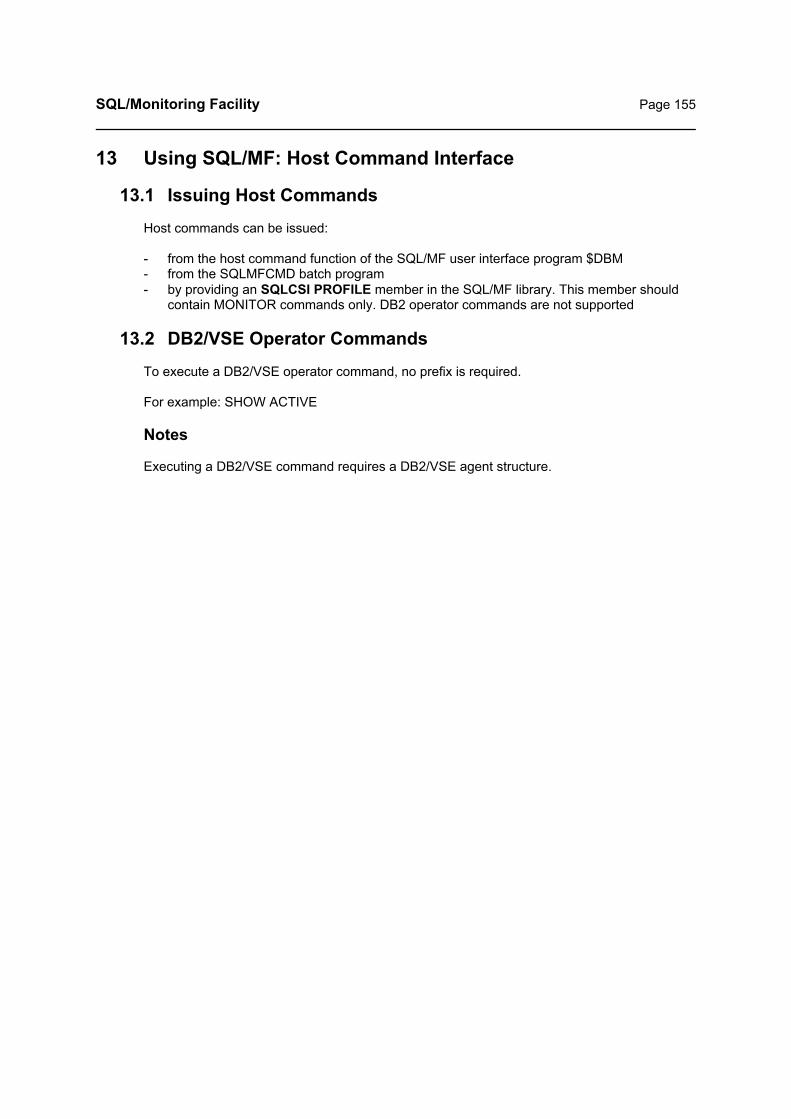
SQL/Monitoring Facility Page 155
13 Using SQL/MF: Host Command Interface
13.1 Issuing Host Commands
Host commands can be issued:
- from the host command function of the SQL/MF user interface program $DBM- from the SQLMFCMD batch program- by providing an SQLCSI PROFILE member in the SQL/MF library. This member should
contain MONITOR commands only. DB2 operator commands are not supported
13.2 DB2/VSE Operator Commands
To execute a DB2/VSE operator command, no prefix is required.
For example: SHOW ACTIVE
Notes
Executing a DB2/VSE command requires a DB2/VSE agent structure.

Page 156 SQL/Monitoring Facility
13.3 MONITOR Commands
A MONITOR command can be issued from the Host Command interface of the $DBM program orby means of the SQLMFCMD program.
To execute an SQL/MF MONITOR command, start the command with the prefix MONITOR.
Following MONITOR commands are provided:
13.3.1 AUTOPREP
Syntax : MONITOR AUTOPREP { ON | OFF | ? }
- If the AutoPrep facility has been enabled, the facility can be set (AUTOPREP ON), reset(AUTOPREP OFF) or queried (AUTOPREP ?). When AutoPrep is off, dynamic SQLstatements are executed unchanged.
- The AUTOPREP status is not maintained across database sessions. If it has to, theAUTOPREP command should be placed in the SQLCSI PROFILE.
13.3.2 BENCH
Syntax : MONITOR BENCH + packagename
Inserts the named package in the benchmark list. The package benchmark request istemporary and effective for the current DB2/VSE session only. When the session is restartedor when a MONITOR CONFIG command is executed, only the benchmark requests from themonitor configuration file will be in effect. The command can also be used to re-enable analready benchmarked package for benchmarking again.
You request specific benchmarking by specifying the exact name of the package. You mayalso use generic package names such as * or N*. These specifications will benchmark allpackages or all package names starting with N.
Syntax : MONITOR BENCH - packagename
Removes the named package(s) from the benchmark list.
Syntax : MONITOR BENCH ?
Lists all packages currently in the benchmarking list. If the package has been effectivelybenchmarked, it is indicated in the command output. The function also displays the currentowner of the benchmarking facility.

SQL/Monitoring Facility Page 157
13.3.3 CONFIGURE
Syntax : MONITOR CONFIG[URE] [{SQLMF CONFIG | configuration_filename}]
Requests the SQLCSI program in the Database server to perform dynamic reconfiguring byre-processing the SQLMF CONFIG (or “configuration_filename”) file. This allows to modify theconfiguration parameters while the Database server is active.
When a configuration filename is specified, that file will be processed, instead of the defaultfilename SQLMF CONFIG. With multiple configuration files, SQL/MF can be reconfiguredautomatically for different periods of the day, for example, by submitting the MONITORCONFIG command from the SQLMFCMD program.
13.3.4 CQCOUNT
Syntax : MONITOR CQCOUNT
Use this command to obtain statistics about the current space usage in the communicationsdata space. The command will show:
- the number of requests stored and processed- the number of times the data space was full - the current number of pages in the free and the request queues- the maximum number of pages ever allocated to the request queue
Please note that “pages” in the command output means logical pages of 32K. Multiply thecounter by 8 to obtain the usage in physical pages. For example: 2 pages in the requestqueue means that 16 physical pages (or 64K) have been allocated.
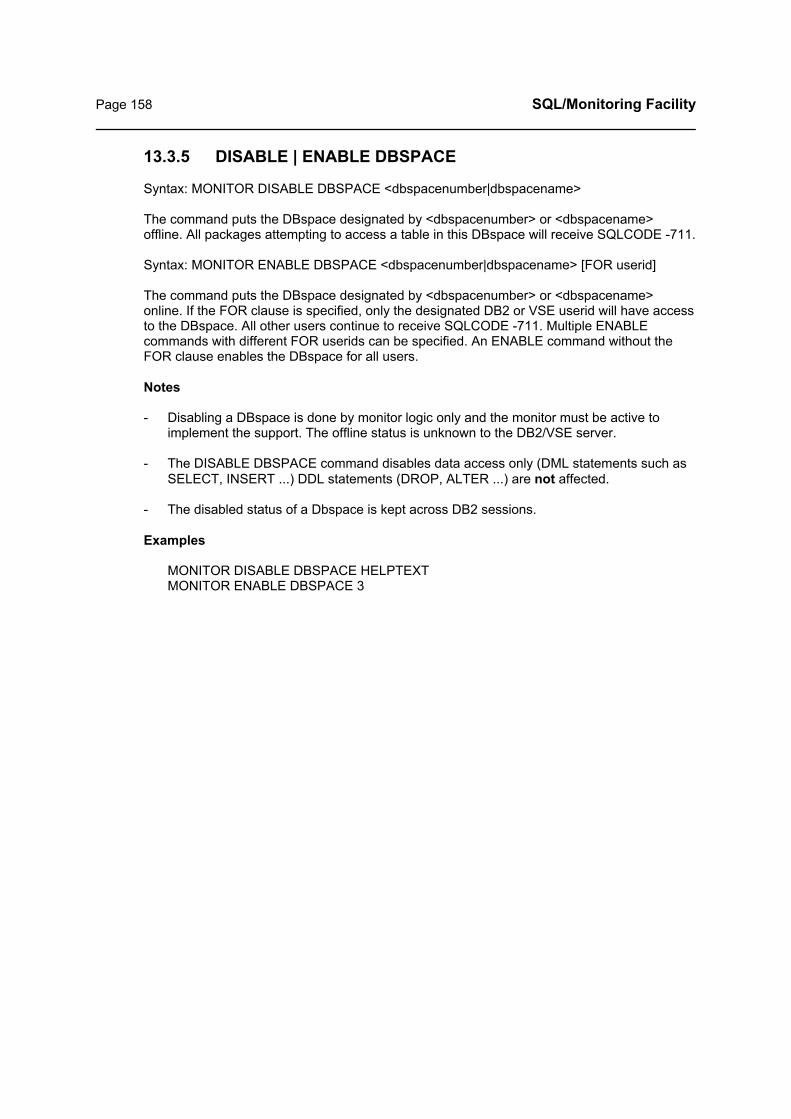
Page 158 SQL/Monitoring Facility
13.3.5 DISABLE | ENABLE DBSPACE
Syntax: MONITOR DISABLE DBSPACE <dbspacenumber|dbspacename>
The command puts the DBspace designated by <dbspacenumber> or <dbspacename>offline. All packages attempting to access a table in this DBspace will receive SQLCODE -711.
Syntax: MONITOR ENABLE DBSPACE <dbspacenumber|dbspacename> [FOR userid]
The command puts the DBspace designated by <dbspacenumber> or <dbspacename>online. If the FOR clause is specified, only the designated DB2 or VSE userid will have accessto the DBspace. All other users continue to receive SQLCODE -711. Multiple ENABLEcommands with different FOR userids can be specified. An ENABLE command without theFOR clause enables the DBspace for all users.
Notes
- Disabling a DBspace is done by monitor logic only and the monitor must be active toimplement the support. The offline status is unknown to the DB2/VSE server.
- The DISABLE DBSPACE command disables data access only (DML statements such asSELECT, INSERT ...) DDL statements (DROP, ALTER ...) are not affected.
- The disabled status of a Dbspace is kept across DB2 sessions.
Examples
MONITOR DISABLE DBSPACE HELPTEXTMONITOR ENABLE DBSPACE 3

SQL/Monitoring Facility Page 159
13.3.6 DISABLE | ENABLE PACKAGE
Syntax: MONITOR DISABLE PACKAGE <packagename>
The command puts the designated package(s) offline. Users attempting to execute an offlinepackage will receive SQLCODE -806. A generic packagename may be used, by terminatingthe name with an * sign.
Syntax: MONITOR ENABLE PACKAGE <packagename> [FOR userid]
The command puts the designated package(s) online. If the FOR clause is specified, only thedesignated DB2 userid will have access to the package. All other users continue to receiveSQLCODE -806. Multiple ENABLE commands with different FOR userids can be specified. AnENABLE command without the FOR clause enables the package for all users. A genericpackagename may be used, by terminating the name with an * sign.
Note:
- If the package must remain offline across DB2 sessions, the corresponding MONITORDISABLE command should be inserted in the SQLCSI PROFILE, so that the command isexecuted at startup of SQL/MF.
- Disabling a package is done by monitor logic only and the monitor must be active toimplement the support.
13.3.7 DISABLE ?
This command shows all disabled DBspaces and packages on the console.

Page 160 SQL/Monitoring Facility
13.3.8 FREE
Syntax : MONITOR FREE { Userid | ALL }
Removes a designated or all DB2/VSE users from the hold state. For example, the commands
MONITOR HOLD ALLMONITOR FREE ADM1
will hold all users except ADM1 and SQLDBA (by default).
13.3.9 FORCE ALL
Syntax : MONITOR FORCE ALL
Issues a DB2 FORCE operator command for all executing agents.This command can be submitted from SQLMFCMD only.
13.3.10 HOLD
Syntax : MONITOR HOLD { Userid | ALL | ? }
HOLD Userid Puts the designated DB2/VSE userid in the hold state.HOLD ALL Puts all users, except SQLDBA, in the hold status.HOLD ? Displays the names of the users current held.
When a user is being held, SQLCODE -561 is forced by the monitor for all SQL statementsexecuted by that user, thus putting that user in an “offline” state.
The MONITOR HOLD ALL command is particularly useful during database maintenance, byensuring that no users except the DBA can access the database.
LUW’s active when the HOLD is issued are not forced. SQLCODE -561 will be returned at thenext statement.
13.3.11 RESET_RUNSTATS
Syntax : MONITOR RESET_RUNSTATS
Clears the run statistic counters for all packages executed thus far.
13.3.12 RESUME
Syntax : MONITOR RESUME
Resumes monitoring after a SUSPEND command.
13.3.13 SHOW AGENT
Syntax : MONITOR SHOW AGENT n
Displays the addresses of several DB2/VSE control blocks for the designated agent. Pleasenote that the first user agent number is 4 (or 5 if TCP/IP is being used in DB2). This allows toissue the command for system agents.

SQL/Monitoring Facility Page 161
13.3.14 SHOW IDBSPUSE
Syntax : MONITOR SHOW IDBSPUSE
Shows the total number of internal DBspaces in use and the number of internal DBspacesused by each agent.
13.3.15 STATS
Syntax : MONITOR STATS
The STATS command causes all pending package and package section statistics to be sentimmediately to the SQL/MF service partition, thus forcing a STAT_FREQ interval.
13.3.16 SUSPEND
Syntax : MONITOR SUSPEND
Immediately stops monitoring and the related facilities, such as logging and benchmarking.
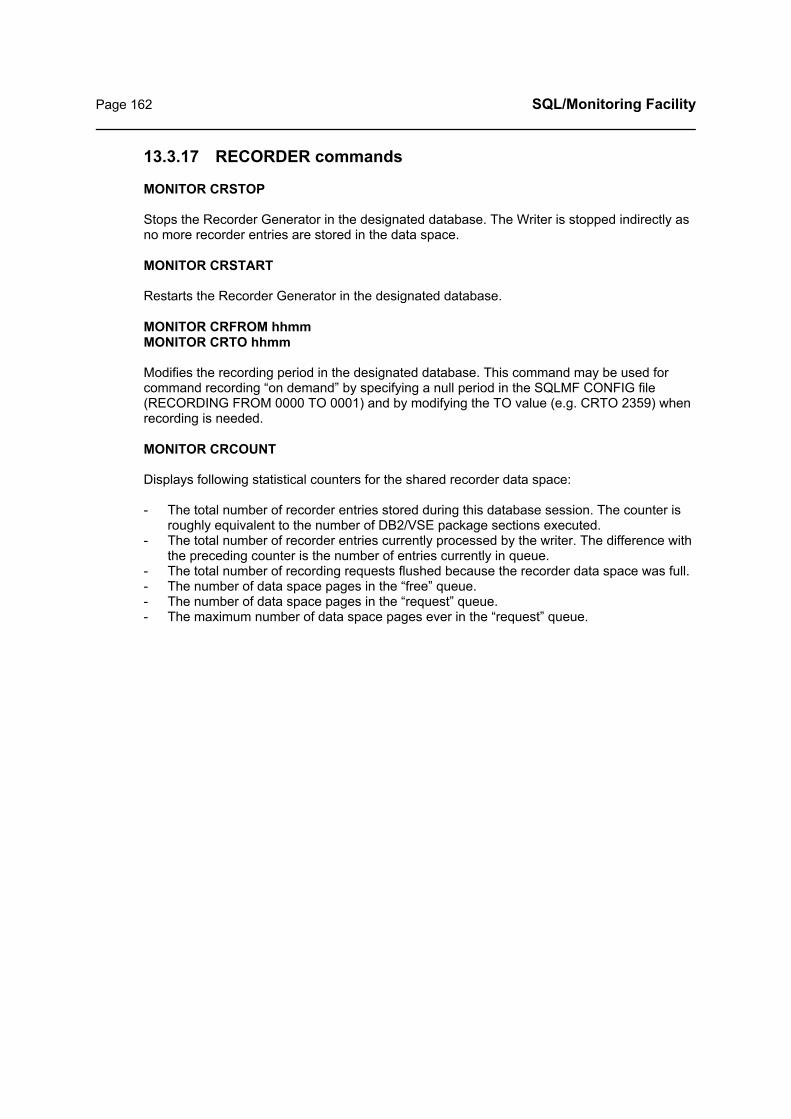
Page 162 SQL/Monitoring Facility
13.3.17 RECORDER commands
MONITOR CRSTOP
Stops the Recorder Generator in the designated database. The Writer is stopped indirectly asno more recorder entries are stored in the data space.
MONITOR CRSTART
Restarts the Recorder Generator in the designated database.
MONITOR CRFROM hhmmMONITOR CRTO hhmm
Modifies the recording period in the designated database. This command may be used forcommand recording “on demand” by specifying a null period in the SQLMF CONFIG file(RECORDING FROM 0000 TO 0001) and by modifying the TO value (e.g. CRTO 2359) whenrecording is needed.
MONITOR CRCOUNT
Displays following statistical counters for the shared recorder data space:
- The total number of recorder entries stored during this database session. The counter isroughly equivalent to the number of DB2/VSE package sections executed.
- The total number of recorder entries currently processed by the writer. The difference withthe preceding counter is the number of entries currently in queue.
- The total number of recording requests flushed because the recorder data space was full.- The number of data space pages in the “free” queue.- The number of data space pages in the “request” queue.- The maximum number of data space pages ever in the “request” queue.

SQL/Monitoring Facility Page 163
13.3.18 RECORDER on-demand commands
MONITOR RECORDER START { PACKAGE|TERMINAL|VSEUSER|DB2USER} n
Starts recording for the named package, terminal, VSE or DB2 userid. Up to 1024 recordingentities may be active simultaneously. Before using this command, ensure that the recorderfacility has been setup, as described on page 77.
MONITOR RECORDER STOP {PACKAGE|TERMINAL|VSEUSER|DB2USER|ALL} n
Stops recording for the named package, terminal, VSE or DB2 userid. STOP ALL willterminate recording for all entities previously started.
MONITOR RECORDER SHOW
Shows the entities (users, packages or terminals) for which recording is active, as a result ofthe RECORDER START command.

Page 164 SQL/Monitoring Facility
13.4 Using SQLMFCMD
SQL/MF provides the SQLMFCMD batch program to execute a DB2/VSE operator command or aMONITOR command from a batch partition. Command output is sent to the list queue. TheSQLMFCMD program does not contain an EOJ macro. Therefore, it can be called from a REXXprocedure, using ADDRESS LINK.
The syntax of SQLMFCMD is as follows:
// EXEC SQLMFCMD,PARM=’database [prefix] host_command’
where:
Database:Name of the database where the command must be executed.
Prefix:Omitted : execute a DB2/VSE commandMONITOR : execute a monitor command
Host_command:The text of the command to execute.
Examples
// EXEC SQLMFCMD,PARM=’DB1 SHOW ACTIVE’
Note
SQLMFCMD can also be invoked without a PARM field (from a DISP=L job, for instance). In thiscase, the program input is prompted on the console and the command output is displayed on theconsole as well.

SQL/Monitoring Facility Page 165
14 Statement Recording Facility
14.1 Description
Statement Recording is a tracing facility that notes the execution characteristics of all executingDB2/VSE package sections (SQL statements) and checkpoint events into a “recorder” file.Recording can be requested on a chronological basis, in which case all SQL during the specifiedperiod is recorded. Recording on demand can be requested for named users, packages orterminals, using the MONITOR RECORDER START command (see page 163).
In order to achieve acceptable performance, the facility has been implemented as follows.
Recorder Generator
The Generator executes in the DB2/VSE server(s). It stores recorder entries for each SQLstatement executed into a common (shared) VSE data space. This data space is handled as aqueue, containing entries for processing by the Recorder Writer.
Recorder Writer
The Writer is an SQL/MF program (SQLCSCRW) executing as a subtask in the SQL/MF servicepartition. At a defined “polling” interval, the writer inspects all recorder data spaces active in themonitored database servers. Queued recorder entries are extracted from the data space andwritten to the recorder file, which is a VSAM cluster with a PDS-like internal structure. A “PDSmember” is maintained for each session (day) of each monitored database. The SQLMF CONFIGfile defines the number of days to be kept on the recorder. If a VSAM no-space condition occurs inthe Recorder Writer, the oldest recorder entries will be deleted automatically.
Recorder File Extract
The Extract function is part of the SQL/MF user interface program $DBM. The extract functionaccesses the Writer’s RECORDER file for a given database, applies the user supplied searchcriteria and stores the selected entries into a storage resident list or into an “Extract” table.
The Recorder Extract is processed using the SQL/MF Editor. The object names referenced andthe statement text of the package sections are inserted during display. All functions of the TableEditor (“Analyze statement”, “List statement objects” etc.) are available during inspection of therecorded data.
Configuring the Recorder
Configuration is done using the RECORDER statements in the SQLMF CONFIG file. See page 75for a description of these statements.

Page 166 SQL/Monitoring Facility
Data recorded
The number of data stored in the data space and on the recorder file depends on the RECORDERLEVEL parameter set in SQLMF CONFIG.
Level 1 recording provides the following data for each executed package section:
- Start date and time (milliseconds)- LUWID- DB2/VSE Userid- VSE Userid- User location- DB2/VSE agent number- Package creator- Package name- Package section number - Database server CPU time in microseconds- I/O wait time in milliseconds- Lock wait time in milliseconds- Communication wait time in microseconds- Number of input/output requests- Number of buffer lookups- Number of locks (LRB’s) currently held by the agent- Execution count (if a statement is executed multiple times consecutively)- Statement type from the RDIIN- Number of rows processed- SQLCODE- Access path (dbspaceno, table and index id)
Level-2 recording adds the following counters for each executed package section:
- Number of RDS and DBSS calls- Number of lock escalations- Number of pages read- Number of pages written- Number of directory buffer lookups- Number of directory block reads- Number of directory block writes- Number of log page reads- Number of log page writes- Number of DB2 dispatcher calls- Statement elapsed time in milliseconds
Level-3 recording adds the contents of the hostvariables in the WHERE clause of the SELECTstatements.
Level-4 recording adds the contents of all hostvariables in the statement, provided that the lengthof the expanded statement text does not exceed 512 characters. If it does, no substitution occurs.

SQL/Monitoring Facility Page 167
Notes
- All execution statistics are obtained and stored at the end of the statement, with the exceptionof comm_wait time, as explained below.
- “Commwait_time” represents the time elapsed between the end of the previous SQLstatement and the begin of the current one.
- If the recorder entry represents multiple statements (fetch statements for instance), it showsthe sum of the statistics produced during the entire statement sequence.
- When a checkpoint event is recorded, 3 entries are produced: a “schedule” entry, a “start” andan “end” entry. The time between checkpoint scheduling and starting is the checkpoint delay,caused by concurrent agent activity.
- The statement text for prepped statements is obtained at extract time from theSQLCS_SQL_STMNTS table. However, this table does not contain the text for dynamicstatements. Therefore, the LOG DYNCOM option will automatically be set while the recorderis active.

Page 168 SQL/Monitoring Facility

SQL/Monitoring Facility Page 169
14.2 Space estimates
14.2.1 Data space Space estimates
Each section recorded in the data space requires 168 bytes. Identical SQL statementsexecuted from the same package section (a series of FETCH statements for instance) requireone recorder entry only. The required size of the data space mainly depends on howfrequently the Writer stores the requests on disk. The queueing algorithm used for the dataspace is such that there is no penalty in over-allocating the data space.
14.2.2 File Space estimates
At the begin of the LUW and when package switching occurs during an LUW, a packagerecord is written. The size of this record is 56 bytes.
For each recorded section a section record is written. Its record length is 77 bytes for level-1recording and 130 bytes for level-2 recording. For level-3 and level-4 recording, the length,datatype and value of the extracted hostvariables add to the recordlength. Identical SQLstatements executed from the same package section require one section record only.

Page 170 SQL/Monitoring Facility
14.3 Using the Recorder Extract function
The extract function is invoked from the Reports (PF10) interface of the $DBM program. When theinterface detects RECORDER statements in the SQLMF CONFIG file, it provides an additionalmenu item “Recorder Reports”.
Select the Recorder Reports by cursor positioning.
The interface then allows you to enter following recorder search arguments.
DatabaseRequired parameter indicating the database whose RECORDER file must be accessed.
DateRequired parameter indicating the date to be extracted in the format yyyymmdd. By default, theparameter is set to the current date.
Time_fromOptional parameter delimiting the file search chronologically. If not specified, searching is frombegin of file. Time_from format is hhmmss.
Time_toOptional parameter delimiting the file search chronologically. If not specified, searching is to endof file. Time_from format is hhmmss. If you specify time_from and time_to, the function usesbinary search to position the recorder close to the requested time. This reduces the recordersearch time significantly.
ProgramOptional parameter to select the recorder entries produced by the named package. If omitted, allpackages are selected. A generic package name can be specified by entering a * or % sign at theend of the name.
SectionOptional parameter to select the recorder entries produced by the named package section. Ifomitted, all sections are selected.
UserOptional parameter to select the recorder entries produced by the named DB2 or VSE userid. Ifomitted, all users are selected. A generic username can be specified by entering a * or % sign atthe end of the name.
LocationOptional parameter to select the recorder entries produced on the named CICS terminal or in thenamed batch partition.
CICS_taskidOptional parameter to select the recorder entries produced by the CICS task taskid.
CostOptional parameter selecting the recorder entries whose cost equals or exceeds the specifiedvalue. If omitted, no selection on cost is performed.
LUW-idOptional parameter to select the recorder entries for the specified LUW id.

SQL/Monitoring Facility Page 171
SUM by sectionOptional parameter. Specify Y to summarize the recorder entries per package section number. Inthis case, the recorder output will be ordered by packagename and section number. If notspecified, the recorder entries are shown in detail for each execution of the section.
If multiple selection arguments are supplied, recorder entries are selected only if they satisfy allyour search criteria.
Dbspace parameters
Dbspace outputSpecifies whether an extract DBspace and table will be used
- N No extract table will be used. The selected recorder data are transferred from therecorder file to the editor’s internal list and processed in storage. This is the defaultoption.
- Y Recorder data will be stored in the Recorder Extract table. This table is created duringSQL/MF product installation.
AppendEntering Append Y allows you to collect the output of multiple recorder searches into a singleextract table. Otherwise, existing recorder table rows are deleted before storing the new rows. Not applicable when DBspace output = N.
Insert_ComTextIf Y is specified, the statement text for static package sections recorded will be retrieved from theSQLCS_SQL_STMNTS table while the extract table is being built. This will significantly increasethe time needed for the extraction process to complete. If N is specified (which is default), the static statement text is obtained only when a given recorderentry is examined in detail (in “Pagemode”) during browsing of the recorder extract.
PF keys
PF1Shows the function help file.
PF3Quits the selection panel.
Note
All parameters entered on the above screen are saved as global variables and represented asdefaults at the next invocation of the extract function.

Page 172 SQL/Monitoring Facility
Direct extract
If no extract DBspace / table is requested (DBspace output = N), the recorder file is accessed andthe selected data are transferred to the editor lists. When selection is completion, the editor list isdisplayed.
Extracting without a table is considerably faster and the size of the selected data is not limited bythe DBspace size, but by virtual storage size only.
However, following restrictions apply during direct extract:
- the selected data can be shown in chronological order only- to limit CICS storage use during extract, the maximum number of recorder entries that can be
stored in the list is 2048
Using an extract table
After accepting the search arguments, the Extract table is built in the monitor database. Then therecorder file is accessed and the selected recorder entries are transferred to the Extract table.Depending on your recorder selection criteria, this may take some time.
When the table has been built, the Table Editor is invoked and the following menu of RecorderReports displayed:
RxCHRONOrecorder entries in chronological order
RxCOSTrecorder entries ordered by descending cost (BUFLOOK)
RxPROGrecorder entries ordered by packagename
RxUSERrecorder entries ordered by username
RxYOURSrecorder entries ordered by your clause
(the letter x in the report names is replaced with the RECORDER LEVEL you defined for thedatabase)
Select a report using the Execute key PF4 and proceed as with another SQL/MF report.
When you leave report browsing, you will be able to execute another report from the menu,without rebuilding the extract table.

SQL/Monitoring Facility Page 173
14.4 Printing a Recorder Extract
The SQLCSPCR is used to print selected entries from the SQL/MF Statement Recorder.
The extract selection parameters are supplied on SYSIPT. Each parameter is specified as akeyword followed by the parameter value.
The SQLCSPCR keywords are:
OUTTABLE [APPEND]DATABASEDATETIME_FROMTIME_TOPROGRAMSECTIONUSERLOCATIONCICSTASKCOSTLUWID
Outtable
Optional parameter. If specified, SQLCSPCR will store the resulting recorder output into theSQLCS_CRX_EXTRACT table. If OUTTABLE is omitted, SQLCSPCR output is to the printer.
If the APPEND option is not specified, all rows from the SQLCS_CRX_EXTRACT table aredeleted before storing the new output. This is not done when APPEND is omitted.
DatabaseRequired parameter indicating the database whose RECORDER file must be accessed.
DateRequired parameter indicating the date to be extracted in the format yyyymmdd. By default, theparameter is set to the current date.
Time_fromOptional parameter delimiting the file search chronologically. If not specified, searching is frombegin of file. Time_from format is hhmmss.
Time_toOptional parameter delimiting the file search chronologically. If not specified, searching is to endof file. Time_from format is hhmmss. If time_from is specified, time_to is required too. If youspecify time_from and time_to, the function uses binary search to position the recorder close tothe requested time. This reduces the recorder search time significantly.
ProgramOptional parameter to select the recorder entries produced by the named package. If omitted, allpackages are selected. A generic package name can be specified by entering a * or % sign at theend of the name.
SectionOptional parameter to select the recorder entries produced by the named package section. Ifomitted, all sections are selected.

Page 174 SQL/Monitoring Facility
UserOptional parameter to select the recorder entries produced by the named DB2 or VSE userid. Ifomitted, all users are selected. A generic username can be specified by entering a * or % sign atthe end of the name.
LocationOptional parameter to select the recorder entries produced on the named CICS terminal or in thenamed batch partition.
CICS_taskidOptional parameter to select the recorder entries produced by the CICS task taskid.
CostOptional parameter selecting the recorder entries whose cost equals or exceeds the specifiedvalue. If omitted, no selection on cost is performed.
LUW-idOptional parameter to select the recorder entries for the specified LUW id.
Sample SQLCSPCR JCL
// JOB SQLCSPCR// EXEC SQLCSPCRDATABASE SQLDSDATE CURRENT DATETIME_FROM 100000 TIME_TO 103000PROGRAM ARIISQL/*/&

SQL/Monitoring Facility Page 175
14.5 Recorder Commands
A number of commands can be used to control the Recording facility during execution. Thesecommands can be issued from the Host Command interface of the $DBM program or from theSQLMFCMD batch program. See page 162 for a description of these commands.
14.6 Recording: Operational notes
When the recorder data space is full, the recording generator issues a message on its console(once per database session only) and disables recording. Recording resumes automatically whenspace becomes available, because the writer has processed queued requests. You can issue theCRCOUNT command, described above, to check for data space full conditions. If “data space full”occurs regularly, you should either enlarge the data space (RECORDER DSPSIZE command) ordecrease the RECORDER WRITER INTERVAL (so that queued data get written out faster).
When DB2/VSE shutdown has been requested and recording data are still present in the dataspace, the Recorder Generator will issue a message and wait until all pending recording requestshave been processed. However, when the recorder notices that the Writer is not functional(because entries do not get processed), the wait sequence is given up after 30 seconds.

Page 176 SQL/Monitoring Facility

SQL/Monitoring Facility Page 177
15 Lockwait Recording Facility
15.1 Description
The facility registers the event where an agent is put in lockwait by DB2/VSE. Following data arestored for each lockwait event:
- the name of the database- the locked DB2 and VSE userid- the locked agent number- the terminal name or the batch partition id of the locked user- the CICS taskid of the locked user, if appropriate- the package name and section number of the locked statement- the type of the locked statement (OPEN, FETCH etc.)- the LUWID of the locked user- the time of the lockwait as hh.mm.ss.mmm- the duration of the lock in milliseconds- the number of locks and long locks already held by the locked user- the mode of the wanted lock as:
- IS intention share lock- IX intention exclusive lock- S share lock- SIX share and intention exclusive lock- X exclusive lock- U update lock
- the duration of the wanted lock as:- INST state of a lock is being tested- SHORT lock held until end of DBSS call- LONG lock held until end of LUW- USER lock held until end of LUW or explicit release
- the type of the wanted lock as:- SYSTEM system lock- DATABASE database lock- DBSPACE DBspace lock- TABLE table lock- INDEX-KEY index key lock- INDEX-PAGE index page lock- TABLE-PAGE table page lock- TABLE-ROW table row lock
- the name of the wanted DBspace- the username and terminal name holding the lock- the package name and section of the statement holding the lock- the text of the locked statement

Page 178 SQL/Monitoring Facility
15.2 Lockwait Recorder Setup
The lockwait recorder is part of the Statement Recording facility, which must be setup asdescribed on page 77. The recorded lockwaits are stored in the data space of the StatementRecorder and stored by the Recorder Writer in a separate lockwait recorder file.
15.3 Configuring the Lockwait Recorder
Lockwait recording is enabled by coding, in the SQLMF CONFIG file, the statement
RECORDER TRACELOCKS
15.4 Inspecting Recorded Lockwaits
The lockwait extract function is invoked from the Reports (PF10) interface of the $DBM program.When the interface detects a RECORDER TRACELOCKS statement in the SQLMF CONFIG file,it provides an additional menu item Lockwait Recorder Report following the Statement RecorderReports item. Select the Lockwait Recorder Report by cursor positioning.
A search criteria panel is then displayed. Specify the criteria and continue processing the report,as described for the Statement Recorder Extract function on page 170.
While the statement recording extract function creates the table SQLCS_CRX_EXTRACT, thename of the lockwait extract table is SQLCS_CRL_EXTRACT.
15.5 Recorded Lockwait space estimates
Each recorded lockwait requires 157 bytes in the recorder data space and on the lockwait recorderfile.
SQL/Monitoring Facility Page 179
11A parameterized statement executes as follows:- EXEC SQL PREPARE ‘SELECT ... FROM <table> WHERE <column> = ?’- EXEC SQL OPEN ... USING <value>
A non-parameterized statement uses the following sequence:- EXEC SQL PREPARE ‘SELECT ... FROM <table> WHERE <column> = value’- EXEC SQL OPEN ...
16 AutoPrep Facility
16.1 Functional description
The AutoPrep facility automatically generates DB2/VSE packages for frequently executed dynamicstatements and replaces the dynamic statement sequence with a static sequence that invokes thegenerated package.
AutoPrep avoids the resource consumption (CPU usage) that results from repeated access pathselection during the SQL PREPARE statement. It also decreases contention on the systemcatalogs accessed during prepare.
AutoPrep is available for packages that use parameter markers and for packages that do not. 11
Because execution frequency cannot be determined adequately for non-parameterizedstatements, such statements are converted to the parameterized format, by replacing the constantvalues with the parameter marker ?.

Page 180 SQL/Monitoring Facility
16.2 Operation
When a dynamic statement is executed by a package that is eligible for AutoPrep (as stated in theAutoPrep control statements), following operations are performed:
- If the statement has not been autoprepped previously, the AutoPrep facility proceeds asfollows:
- a non-parameterized statement is converted to the parameterized format- the statement text is reduced to a 32-byte hash value- the execution frequency for the hash is incremented- if the frequency equals the frequency defined in the AutoPrep control file, an AutoPrep
request is forwarded to the AutoPrep server program SQLCSAPS, which executes in theSQL/MF service partition
- the AutoPrep server assigns a package name, builds a package source and preps thesource, using SQLPREP; the generated package name has the format $xxxxxxx, wherexxxxxxx is a sequence number assigned by the server
- after successful prep, the server updates the SQLMF_AUTOPREP table and stores therelationship between the statement hash and the newly generated package
- If the statement hash occurs in the AUTOPREP table, the statement has been autopreppedpreviously. The SQL statement flow is then modified in such a way, that the autopreppedpackage is executed and not the dynamic statement. The SQL PREPARE statement is nolonger executed for such statements.
- The AUTOPREP table maintains the last access date for all AutoPrep packages. If a packageis not used for 60 days (because the statement text has been modified for instance), it isautomatically dropped.

SQL/Monitoring Facility Page 181
16.3 Installation
The AutoPrep facility must be installed in all databases eligible for AutoPrep and in thedatabase containing the SQL/MF tables (the “monitor database”). Installation in the monitordatabase is a technical requirement. If AutoPrep will not be used effectively in this database,you can acquire a minimal 128-pages Dbspace. The installation procedure is described onpage 39.
Autoprep storage requirements
The AutoPrep facility runs in the database server(s). It uses a data space for internaloperations.
The Autoprep facility keeps control information in the AutoPrep list for each autoprepped SQLstatement and for each grant issued on the autoprepped package to a user other than the userthat initiated autoprep. The Autoprep list resides in main storage. The length of the list entriesdepends on:
- the length of the dynamic statement text- the length of the input and the output SQLDA, that is, the number of columns selected and
the number of predicate values (or parameter markers) in the WHERE clause, eachcolumn descriptor taking 44 bytes
Multiply the average length of the autoprep list entries (which will probably be between 2 and 3KB) with the number of entries in the list. Add the result to the size of the server’s 32-bitGETVIS area.
Page 182 SQL/Monitoring Facility
16.4 Configuring the AutoPrep facility
The AutoPrep facility for a given database is controlled by means of one or more AUTOPREPstatements in the SQLMF CONFIG file.
AUTOPREP statement
- Syntax : AUTOPREP packagename AFTER frequency
- For <packagename>, specify the name of the package that generates dynamicstatements eligible for autoprepping. A generic packagename is indicated by terminatingthe name with a % sign.
- For <frequency>, specify a number between 1 and 255. Automatic statement prep willoccur after a given statement text has been executed <frequency> times a day. OnceAutoPrep has occurred, frequency checking for that statement is no longer performed.
- Multiple AUTOPREP statements may be provided, if needed.
AUTOPREP Example
The AutoPrep server SQLCSAPS should prepare all dynamic statements generated by QMFand by packagenames starting with SQLL, when these statements have been executed 10times on the same day. This is achieved by coding:
AUTOPREP SQLL% AFTER 10AUTOPREP DSQ% AFTER 10

SQL/Monitoring Facility Page 183
16.5 Security Considerations
- When a statement is autoprepped for the first time, the AutoPrep server grants the RUNprivilege on the package to PUBLIC. Since AutoPrep occurs only after a successful SQLPREPARE, it has been established that the user initiating AutoPrep has all necessary tableprivileges.
- When another DB2 user successfully issues an SQL PREPARE for the same statement text,the user has the required table privileges and will be allowed to use the public autopreppackage on subsequent executions of the statement. In its AUTOPREP table, the facilityrecords all users that performed a successful PREPARE of the SQL statement.
- The AutoPrep packages, which have been granted to PUBLIC, can only be invoked undercontrol of the AutoPrep facility.
16.6 Restrictions
- AutoPrep support is limited to SELECT statements. Update, insert, delete statements are nothandled.
- SELECT statements that do not specify a table creator will not be autoprepped.
- When the DB2 cost of a prepped statement exceeds the static cost, autoprep will be used forthe statement. This may occur for statements with range predicates (SELECT WHEREcolumn LIKE ..). In such cases, the access path chosen by DB2 for the dynamic statementmay be better than the static access path, due to the use of default filter factors for the staticstatement.
- Wen a statement has been autoprepped and is executed using the AutoPrep package, a DB2prepare is no longer executed. Hence, the SQL statement cost estimate (returned in theprepare SQLCA) is no longer available. SQL/MF returns a dummy cost of 1.
- Autoprepped statements always execute with "cursor stability" isolation (you can use the SETISOLATION UR FOR $* configuration statement if uncommitted read isolation is desired).

Page 184 SQL/Monitoring Facility

SQL/Monitoring Facility Page 185
17 Monitor Tables
17.1 SQL Statements
SQLCS_SQL_STMNTS Table
DATABASE CHAR(8) Database namePROGCREA CHAR(8) Package creatorPROGNAME CHAR(8) Package nameSECTION SMALLINT Section nr of the statement within the packagePLAN SMALLINT Each table access by the package section receives a
plan number, starting from 1. If multiple tablesare accessed, or if the a table participates in areferential constraint, multiple rows will beprovided, each with its own plan number.
MODLEVEL SMALLINT Modification level of the statement0=last modification level-1=previous modification level -2 etc. (up to CONFIG MODLEVEL parameter)
SAMPLED INTEGER Total number of times the statement has beenexecuted, since the package was prepped.
All following columns show the resource consumption by the statement during its lastexecution.
CPUTIME INTEGER CPU time used by the statement in millisecondsLOCKTIME INTEGER Lock wait time in the statement in millisecondsIOWAIT INTEGER I/O wait time the statement in millisecondsCOMMWAIT INTEGER Communications wait time in the statement in
millisecondsRDSCALL INTEGER RDS calls by the statementDBSSCALL INTEGER DBSS calls by the statementDISPCALL INTEGER DB2/VSE dispatcher calls by the statementESCALATE INTEGER Number of lock escalations in the statementWAITLOCK INTEGER Number of lock waits in the statementDEADLOCK INTEGER Number of deadlocks the statementNROWS INTEGER Number of table rows processed by the statementBUFLOOK INTEGER Number of buffer lookups by the statementPAGREAD INTEGER Number of page reads by the statementPAGWRITE INTEGER Number of page writes by the statementDIRBUFL INTEGER Number of directory buffer lookups by the statementDIRREAD INTEGER Number of directory page reads by the statementDIRWRITE INTEGER Number of directory page writes by the statementLOGREAD INTEGER Number of log reads by the statementLOGWRITE INTEGER Number of log writes by the statementTOTIO INTEGER Number of I/O’s by the statementINT_DBSP INTEGER Number of internal Dbspace accesses by the
statementDOWNER CHAR(8) Dbspace ownerDNAME CHAR(18) Dbspace name accessedTCREATOR CHAR(8) Table creatorTNAME CHAR(18) Table name accessedICREATOR CHAR(8) Index creatorINAME CHAR(18) Index name accessedBLOCKED CHAR(1) Y if the package statement executes with blocking;
N otherwise.ISOL CHAR(2) The statement’s isolation level as RR for
repeatable read isolation, CS for cursor stabilityand UR for uncommitted read.
SEL CHAR(1) Y for selective index access, N for non-selectiveaccess and blank for non-indexed access.
INDEXCOL CHAR(40) Index column definition for INAME

Page 186 SQL/Monitoring Facility
LAST_ACC TIMESTAMP Last time sampledCOMM_TEXT VARCHAR(8192) Text of the statement

SQL/Monitoring Facility Page 187
17.2 Statement Monitor Log Table
SQLCS_LOG Table
DATABASE CHAR(8) Database nameUSERNAME CHAR(8) Name of user AGENT SMALLINT DB2/VSE agent numberPROGCREA CHAR(8) Creator of the packagePROGNAME CHAR(8) Name of the packageSECTION SMALLINT Package section numberPREPFLAG SMALLINT Set to 1 when package preppedCOMM_TYPE CHAR(8) Type of statement (open, fetch etc.)ISOLATION CHAR(2) The statement’s isolation level as: RR for repeatable read isolation CS for cursor stability UR for uncommitted readBLOCKED CHAR(1) Blocking attribute as Y or NSEL CHAR(1) Y for selective index access N for non-selective index access blank for non-indexed accessINDCREA CHAR(8) Creator of the index used in the statement or blankINDNAME CHAR(18) Name of the index or blank (if access without index)BEGDATE DATE Start date of statement executionBEGTIME TIME Start time of statement executionENDDATE DATE Stop date of statement executionENDTIME TIME Stop time of statement executionELAPSED TIME Elapsed statement timeCPUTIME INTEGER CPU time used by the statement in microsecondsLOCKTIME INTEGER Total lockwait time in millisecondsIOWAIT INTEGER Total IOwait time in millisecondsCOMMWAIT INTEGER Total Communication wait time in microsecondsRDSCALL INTEGER Number of RDS callsDBSSCALL INTEGER Number of DBSS callsDISPCALL INTEGER Number of DB2/VSE dispatcher calls ESCALATE INTEGER Number of lock escalations WAITLOCK INTEGER Number of lock requests that resulted in waitDEADLOCK INTEGER Number of deadlocksNROWS INTEGER Number of table rows processedBUFLOOK INTEGER Number of page buffer lookupsPAGREAD INTEGER Number of page readsPAGWRITE INTEGER Number of page writesDIRBUFL INTEGER Number of directory buffer lookups DIRREAD INTEGER Number of directory page readsDIRWRITE INTEGER Number of directory page writesLOGREAD INTEGER Number of log page readsLOGWRITE INTEGER Number of log page writesTOTIO INTEGER PAGREAD+PAGWRITE+DIRREAD+DIRWRITE +LOGREAD+LOGWRITE

Page 188 SQL/Monitoring Facility
INT_DBSP INTEGER the number of buffer lookups in internal DBspacesLOCATION CHAR(8) Terminal_ID where statement executedCICSTID INTEGER CICS taskid of statement executedLUWID INTEGER LUWID of statement executedP_CHKPTIME INTEGER Total checkpoint wait in package (if LOGTYPE P)P_TOT_ELAPS INTEGER Total elapsed time in package (if LOGTYPE P)P_MAX_ELAPS INTEGER Maximum elapsed time in package (if LOGTYPE P)P_TOT_ROWS INTEGER Total nr of rows processed by package (if LOGTYPE P)LOGTYPE CHAR(1) B benchmark log P package statistics log X exception logLOGREASON CHAR(8) For logtype X the reason for logging (Dbspace scan, TOTIO etc.)LOGSTAMP CHAR(13) Value of hardware clock at start of logged statementCOMM_TEXT VCHAR(8K) Text of the statement. For a static statement, the text is retrieved from the SQL_STMNTS table. There is no text for section=0 statements (such as CONNECT).

SQL/Monitoring Facility Page 189
17.3 System Monitor Tables
TABLE SQLMF_SESSION_CTR
SQL Session Counters (one row per day and per database)
DATABASE CHAR(8)MONDATE DATERDSC INTEGER # RDS callsDBSSC INTEGER # DBSS callsLUWS INTEGER # LUW'sROLLB INTEGER # Rollback'sCHKP INTEGER # CheckpointsLOCKL INTEGER # Long locksESCAL INTEGER # Lock escalationsWAITL INTEGER # Locks resulting in wait DEADL INTEGER # Deadlocks PAGBUF INTEGER # Page buffer lookupsPAGRD INTEGER # Page readsPAGWR INTEGER # Page writesDIRBUF INTEGER # Directory buffer lookupsDIRRD INTEGER # Directory page readsDIRWR INTEGER # Directory page writesLOGR INTEGER # Log page readsLOGW INTEGER # Log page writesDASDR INTEGER # ReadsDASDW INTEGER # WritesTOTIO INTEGER DASDR + DASDW

Page 190 SQL/Monitoring Facility
TABLE SQLMF_COUNTS
SQL Counters
DATABASE CHAR(8)MONDATE DATEMONTIME TIMEMMDD CHAR(4)HHMM CHAR(4)RDSC INTEGER # RDS callsDBSSC INTEGER # DBSS callsLUWS INTEGER # LUW'sROLLB INTEGER # Rollback'sCHKP INTEGER # CheckpointsLOCKL INTEGER # Long locksESCAL INTEGER # Lock escalationsWAITL INTEGER # Locks resulting in wait DEADL INTEGER # Deadlocks PAGBUF INTEGER # Page buffer lookupsPAGRD INTEGER # Page readsPAGWR INTEGER # Page writesDIRBUF INTEGER # Directory buffer lookupsDIRRD INTEGER # Directory page readsDIRWR INTEGER # Directory page writesLOGR INTEGER # Log page readsLOGW INTEGER # Log page writesDASDR INTEGER # ReadsDASDW INTEGER # WritesTOTIO INTEGER DASDR + DASDWPHIT DEC(5,2) Page buffer hit ratio (see page 240)DHIT DEC(5,2) Directory buffer hit ratio (see page 240)LRBS SMALLINT # LRB's definedLRBU SMALLINT # LRB's usedMAXLUW SMALLINT Max # of LRB's used in one LUWCP_CPU INTEGER CPU time (in seconds) used by the database serverCP_PAGRD INTEGER Number of page reads for the database serverCP_PAGWRT INTEGER Number of page writes for the database serverDISPDELAY_I INTEGER Interactive dispatch delay in microsecondsN_DELAY_I INTEGER Times interactive dispatch delay computedDISPDELAY_NI INTEGER Non-interactive dispatch delay in microsecondsN_DELAY_NI INTEGER Times non-interactive dispatch delay computedCHKP_DUR INTEGER Average checkpoint duration in millisecondsCHK_DELAY INTEGER Number of checkpoint delaysDELAY_DUR INTEGER Average checkpoint delay duration (milliseconds)MAX_PROGS SMALLINT # Slots in the DB2 package cachePROGS_LOADED SMALLINT Packages loadedPROGS_IN_USE SMALLINT Packages loaded for active agentsTOT_PROGS INTEGER Packages monitored in the DB2 sessionTOT_AGENTS SMALLINT Maximum number of agents activeR_RATIO SMALLINT Percentage of PAGRD within (PAGRD+PAGWR)

SQL/Monitoring Facility Page 191
TABLE SQLMF_DBSP_COUNTS
DBspace Buffer Usage Counts
DATABASE CHAR(8)MONDATE DATEMONTIME TIMEMMDD CHAR(4)HHMM CHAR(4)DBSPACENAME CHAR(18)PBUSE SMALLINT # Page buffers used by this DBspaceDBUSE SMALLINT # Directory buffers used by this DBspaceTPBUSE SMALLINT # Page buffers used by all DBspacesTDBUSE SMALLINT # Directory buffers used by all DBspacesPPBUSE SMALLINT PBUSE / TPBUSE ratioPDBUSE SMALLINT DBUSE / TDBUSE ratioPAGBUF SMALLINT # Page buffers in poolDIRBUF SMALLINT # Directory buffers in pool

Page 192 SQL/Monitoring Facility
TABLE SQLMF_DBXT_COUNTS
Storage Pool Buffer Usage Counts
DATABASE CHAR(8)MONDATE DATEMONTIME TIMEMMDD CHAR(4)HHMM CHAR(4)POOL SMALLINTPBUSE SMALLINT # Page buffers used for this storage poolDBUSE SMALLINT # Directory buffers used for this storage poolTPBUSE SMALLINT # Page buffers used for all storage poolsTDBUSE SMALLINT # Directory buffers for all storage poolsPPBUSE SMALLINT PBUSE / TPBUSE ratioPDBUSE SMALLINT DBUSE / TDBUSE ratioPAGBUF SMALLINT # Page buffers in poolDIRBUF SMALLINT # Directory buffers in pool

SQL/Monitoring Facility Page 193
TABLE SQLMF_DBSP_USE
DBspace Usage Counts
DATABASE CHAR(8)MONDATE DATEMONTIME TIMEMMDD CHAR(4)HHMM CHAR(4)DBSPACENAME CHAR(18)HDRP INTEGER # Header pagesHPU INTEGER # Header pages usedHFS SMALLINT % Header pages freeHPUP SMALLINT % Header pages usedDATAP INTEGER # Data pagesDPU INTEGER # Data pages usedDFS SMALLINT % Data pages freeDPUP SMALLINT % Data pages usedINDEXP INTEGER # Index pagesIPU INTEGER # Index pages usedIFS SMALLINT % Index pages freeIPUP SMALLINT % Index pages used

Page 194 SQL/Monitoring Facility
TABLE SQLMF_DBXT_USE
Storage Pool Usage Counts
DATABASE CHAR(8)MONDATE DATEMONTIME TIMEMMDD CHAR(4)HHMM CHAR(4)POOL SMALLINTNPAGES INTEGER # Pages in poolUSED INTEGER # Pages used FREE INTEGER # Pages freePUSED INTEGER % Pages usedSOS CHAR(1) * If short on storage condition did arise

SQL/Monitoring Facility Page 195
TABLE SQLMF_USER_STATE
User Status Table
DATABASE CHAR(8) MONDATE DATEMONTIME TIMEMMDD CHAR(4) HHMM CHAR(4) USERID CHAR(8) UsernameSTATE CHAR(4) User waitstateLOCKS SMALLINT # Locks held by userLONGL SMALLINT # Long locks held by userWANTL CHAR(4) Type of lock wantedWANTDB SMALLINT DBspaceno wantedWANTDBNAME CHAR(18) DBspacename wantedHOLDUSER CHAR(8) User holding lockREQM CHAR(3) Lock request modeDURAT CHAR(5) Duration of the lock

Page 196 SQL/Monitoring Facility
TABLE SQLMF_LOG_USE
SQL Logfile Usage Counts
DATABASE CHAR(8)MONDATE DATEMONTIME TIMEMMDD CHAR(4)HHMM CHAR(4) LOGSIZE INTEGER Size of logfile in bytesUSED INTEGER Logfile bytes usedPUSED SMALLINT % Logfile usedPOFLOW SMALLINT % remaining before overflowPCHCK SMALLINT # Pages remaining before checkpoint

SQL/Monitoring Facility Page 197
TABLE SQLMF_CHKP_DELAY
Checkpoint Delay Table
DATABASE CHAR(8)MONDATE DATEMONTIME TIMEMMDD CHAR(4)HHMM CHAR(4)USERID CHAR(8) Username activeSTATE CHAR(4) Wait state of userRWAPPL CHAR(1) R/W application indicatorAGENT SMALLINT User’s agent numberPROGNAME CHAR(8) Name of package executedSECTION SMALLINT Package section number

Page 198 SQL/Monitoring Facility
TABLE SQLMF_CONNECTS
Connections Status Table
DATABASE CHAR(8) MONDATE DATEMONTIME TIMEMMDD CHAR(4) HHMM CHAR(4) CONNECTED SMALLINT # Users connectedACTIVE SMALLINT # Users in LUWWAITING SMALLINT # Users waiting for agent structureINACTIVE SMALLINT # Users connected and not in LUWAGENTS_AV SMALLINT # Agent structures availableCONNECT_AV SMALLINT # Connections available

SQL/Monitoring Facility Page 199
18 Customizing SQL/MF
18.1 Writing log report files
A log report file is a member in the SQL/MF library with a filetype of SQLCSMAC. The filename ofthe report file stands for the name of the report. This name is displayed on the log report menu,along with the report descriptor, which is taken from the first record of the file.
The filename of the log reports delivered with SQL/MF starts with the letter B for the benchmarklog reports, with the letter L for the exception log reports, with the letter P for the package statisticsreports, with the letter R for the statement recording reports and with the letter S for the statementstatistics reports. It is recommended that you adhere to these conventions when creating yourreport file.
To create the report, you can use a standard report as a model, such as the BCHRONOSQLCSMAC report.

Page 200 SQL/Monitoring Facility
Benchmark Log in chronological order<DEFAULT> &SEL_DATE_FROM CURRENT DATE<DEFAULT> &SEL_DATE_TO CURRENT DATE<DEFAULT> &ORDER_BY BEGDATE, BEGTIMETSQLDBASQLCS_LOG<ENTER><PF5>SELECT DATABASE, USERNAME, AGENT, --
PROGCREA, PROGNAME, SECTION, COMM_TYPE, --BEGDATE, BEGTIME, ENDDATE, ENDTIME, ELAPSED, --ISOLATION, INDCREA, INDNAME, --CPUTIME, LOCKTIME, IOWAIT, COMMWAIT, --DBSSCALL, DISPCALL, ESCALATE, WAITLOCK, --BUFLOOK, PAGREAD, PAGWRITE, --DIRBUFL, DIRREAD, DIRWRITE, --LOGREAD, LOGWRITE, TOTIO, --COMM_TEXT --FROM SQLDBA.SQLCS_LOG --WHERE BEGDATE BETWEEN &SEL_DATE_FROM --AND &SEL_DATE_TO --AND LOGTYPE = 'B' --AND &OPT_CLAUSE --ORDER BY &ORDER_BY
9999<ENTER>
Coding rules
On the first line of the report file, code a description of the report. The length of the descriptorshould not exceed 62 characters.
Do not modify or omit the lines printed in bold in the above example, unless you want to limit thenumber of rows fetched. If so, replace 9999 with the maximum number of lines in the report.Specify the maximum as a 4-digit value, padded to the left with zeroes.
Code your SELECT statement between the lines containing <PF5> and 9999. A variable numberof blanks may be inserted at any point in the SELECT. These redundant blanks are removedbefore execution. The length of the statement - after compression of blanks - should not exceed960 characters. The length of the uncompressed command should be inferior to 1600 characters.To continue lines, insert the characters -- after the last word of the line. Leave at least one blankbetween that last word and the continuation mark.

SQL/Monitoring Facility Page 201
Command variables
(1) The SELECT command may contain variable symbol names, identified by an & at thebegin of the name. Variable symbols are automatically extracted by the editor and theuser is automatically prompted for a replacement value. The replacement cannot belonger than 56 characters.
(2) You can pre-assign variable symbols using the <DEFAULT> statement. This statementnames the variable symbol and assigns a default value. The default value is shown on thescreen during variable symbol assignment. The user may eventually modify it.
(3) A line that contains an unassigned symbol is not generated. (In the example, the line AND&OPT_CLAUSE). These optional clauses must be coded in such a way, that valid SQLsyntax is maintained when line generation is bypassed.
(4) The system variable named &DATABASE receives the name of the default database,when the report is invoked.
The FORMAT command may be used to modify the name of the column or SELECT expression in theheader of the report list. The syntax of the FORMAT command is as follows:
FORMAT COL x NAME nnnn
where
X Stands for the number of the column or expression in the SELECT column list. X may be specified as *to denote the column number of the previous FORMAT, incremented by 1.
NNNStands for the name of the column or expression in the list header.
If specified, the FORMAT commands should appear at the end of the report file, following the last<ENTER> statement. They should be coded by ascending column (COL) number.
Example:
FORMAT COL 10 NAME Name_10FORMAT COL * NAME Name_11

Page 202 SQL/Monitoring Facility
18.2 Writing print report files
The facilities for customizing the online reports described in the previous section, may also beused for controlling the printing function of SQL/MF, that is, the SQLCSPRT program. SQLCSPRTuses control files with a filetype of SQLCSPRT to generate the reports. All the syntax rules definedabove for coding SQLCSMAC control files also apply to print control files.
By default, SQLCSPRT prints 4 columns on a printline. It expects that the length of the columnname is no longer than 10 characters and that the length of the column data is inferior to 20characters.
The program however provides a facility to control the number of table columns per line. Codingthe constant ‘//’ in the SELECT list of the SQLCSPRT control file will perform a ‘new line’ function.
For example, to obtain the following print page layout
COL1 COL2 COL3 COL4COL5 COL6 COL7COL8 COL9 COL10 COL11
insert the expression ‘//’ between COL7 and COL8 in the SELECT column list.
Also note that you can use the FORMAT command, described above, to give a name to reportcolumns or expressions.

SQL/Monitoring Facility Page 203
18.3 Writing a CONNECT exit for the Statement Monitor
During explicit user connect, the Monitor component in the database server invokes theSQLCSUXT PROC which should be a REXX program.
SQLCSUXT entry arguments:
- databasename- VSE jobname - location (terminal id if CICS, partition ID if batch)- DB2_userid specified on the CONNECT- name of package issuing the connect- pointer to the connect password
SQLCSUXT returncode:
0 Proceed with CONNECT8 Cancel CONNECT : SQL/MF changes the connection parameters to all question marks, which
will result in SQLCODE -561.
SQLCSUXT processing
The exit may perform any processing needed to verify the connect. However, since the exit runs inthe database server, no SQL statements can be executed.
The password argument is passed as a pointer, to allow for eventual modification.
The password value is obtained using the REXX STORAGE function, as follows:password=storage(password_pointer,8)
The password can be modified using the REXX STORAGE function, as follows:x=storage(password_pointer,8,”new_password_value”)
SQLCSUXT example
/* SQL/MF connect exit */
arg database jobname location db2id package password .if substr(jobname,1,4) = ‘CICS’ then user = locationelse user = jobnamerc = 0if db2id = ‘SQLDBA’ then do
/* check if “user” allowed to connect as SQLDBA If not, set rc to 8
*/endexit rc
Page 204 SQL/Monitoring Facility

SQL/Monitoring Facility Page 205
19 User Attached Process Facility
19.1 Purpose
The facility allows installation written REXX procedures to retrieve and process the data itemsavailable within the SQL Monitoring Facility. Such user written extension is called an UAP (UserAttached Process) and is invoked by SQL/MF components at various stages of monitoring. AnUAP is a REXX procedure named SQLMUAPn with n designating the SQL/MF exit point callingthe process. At initialization of the SQL/MF System and Statement Monitors, the existence of theindividual SQLMUAPs is checked. When found, they are invoked during subsequent processing.
The monitor passes data related to the particular process to the UAP as REXX variables, assignedby SQL/MF before calling the UAP. Depending on the contents of these variables, the UAP mayinitiate the necessary processing, including SQL access. SQLMUAP3 and SQLMUAP4 may set areturncode at exit. This returncode is kept by the Monitor in the agents monitor block until end ofLUW. Its value is represented in the variable USERFLAG when these UAPs are subsequentlycalled.

Page 206 SQL/Monitoring Facility
19.2 UAPs called by the System Monitor
SQLMUAP1Global DB2/VSE System Performance Counters
SQLMUAP2Storage Pool Usage Counters
SQLMUAP4Locked Agent Status
SQLMUAP5DB2/VSE Logfile Usage
SQLMUAP6DB2/VSE Connections Status
SQLMUAP7Checkpoint Delay
The above UAP’s are called by the SQL/MF system monitor program SQLMFM, at the systemmonitor interval, defined in the SQLMF CONFIG. At a given interval, the SQLMUAP1 is invokedonce for each monitored database. All other UAP’s may be called multiple times per monitoreddatabase. SQLMUAP4 for instance, will be called for each locked DB2/VSE agent in eachmonitored database.

SQL/Monitoring Facility Page 207
19.3 UAPs called by the Statement Monitor
When found, SQLMUAP3 (Active Agent Status) is called by the SQL/MF program SQLCS for allagents in LUW, at the GOVERNOR interval. SQLMUAP3 is also called by the monitor when astatement has been stored in the SQLCS_LOG table as a result of a LOG parameter defined inSQLMF CONFIG. The variable LOGREASON is provided in this case and indicates the reason forthe logging operation.
When found, SQLMUAPX is called by the SQL/MF governor function before applying a restrictingcondition. Before forcing the agent, the EXEC is invoked with the entry arguments, described laterin this chapter on page 218.

Page 208 SQL/Monitoring Facility
19.4 Description of UAP input variables
19.4.1 SQLMUAP1: DB2/VSE performance counters
The following DB2/VSE performance counters are available to the SQLMUAP1 process asinterval related values, that is, as indicators of resource consumption during the systemmonitor interval.
DATABASE Databasename sampledDATE Monitoring date in SQL formatTIME Monitoring time in SQL formatRDSC RDS calls during the intervalDBSSC DBSS calls during the intervalLUWS LUW's initiated during the intervalROLLB Rollback's during the intervalCHKP Checkpoints during the intervalLOCKL Long locks during the intervalESCAL Lock escalations during the intervalWAITL Locks resulting in wait during the intervalDEADL Deadlocks during the intervalPAGBUF Page buffer lookups during the intervalPAGRD Page reads during the intervalPAGWR Page writes during the intervalDIRBUF Directory buffer lookups during the intervalDIRRD Directory page reads during the intervalDIRWR Directory page writes during the intervalLOGR Log page reads during the intervalLOGW Log page writes during the intervalDASDR DASD Reads during the intervalDASDW DASD Writes during the intervalTOTIO Total I/O operations during the intervalPHIT Page buffer hit ratio (see page 240)DHIT Directory buffer hit ratio (see page 240)LRBS Number of lock request blocks defined
(DB2/VSE initialization parameter NLRBS)LRBSU Number of lock request blocks defined per user
(DB2/VSE initialization parameter NLRBU)LRBU Number of LRB’s currently in useMAXLUW Maximum number of LRB's used in one LUWRRATIO Read ratio as (PAGRD*100)/(PAGRD+PAGWR)CPCPU CPU time (in seconds) used by database
server during intervalCPPAGRD VSE page reads performed for server
during intervalCPPAGWRT VSE page writes performed for server
during interval
Note
Although the hit ratio’s PHIT and DIRHIT have DECIMAL(5,2) format, no decimal point will bepresent in the corresponding REXX variables, presented to SQLMUAP1.

SQL/Monitoring Facility Page 209
19.4.2 SQLMUAP2: Storage pool counters
The following DB2/VSE storage pool counters are available to the SQLMUAP2 process. Theyare presented at each monitoring interval for each storage pool defined.
DATABASE Databasename sampledDATE Monitoring date in SQL formatTIME Monitoring time in SQL formatPOOL Pool numberNPAGES Number of pages in poolUSED Number of pages used FREE Number of pages freePUSED Percentage of pages usedSOS Set to * (asterisk) when the short on storage
condition did arise for the storage pool

Page 210 SQL/Monitoring Facility
19.4.3 SQLMUAP3: Active agent status
The following variables are available to the SQLMUAP3 process. They are presented by theStatement Monitor: at the GOVERNOR interval for each agent in logical unit of work in eachdatabase monitored and when an SQL statement has been written to the exception log table
DATABASE Databasename sampledVSE_NAME The VSE username executing the statement.SQL_NAME The SQL_id of the user executing the statement.AGENT The number of the DB2/VSE agentAGNTSTAT The status of the DB2/VSE agent. See table on page 86.CREATOR The creator of the package.PACKAGE The name of the package.SECTION The section number of the packageLOCATION The terminal where the agent executesCOMMAND The type of the statement. See table on page 87.BLOCKED The statement’s blocking attribute as “Y” or “N”.ISOLAT The isolation level of the statement as:
“C” for cursor stability “R” for repeatable read “W” for uncommitted read
RW_STATE Y for an R/W agent, N for an R/O agent.STRTDATE The start date of the statement in SQL date formatSTRTTIME The start time of the statement in SQL time formatSTOPTIME The stop time of the previous statementELAPSED The time elapsed since STARTTIME as hh:mm:ss.LUWID The LUW identification assigned by DB2/VSE.LUW_STRT The start time of the LUW in SQL time format.LUW_TIME The time elapsed since LUW_START as hh:mm:ss.LOCKTIME If the statement is in the lockwait stateCPUTIME CPU time used during the statement
in microseconds. LOCKWAIT Number of milliseconds the user has been in the
lockwait state during the current statement.IOWAIT The total time spent in input/output wait during the
statement, in milliseconds.COMMWAIT The total time spent in communication wait during the
current statement, in microseconds.IDLEWAIT The time elapsed since the end of the previous SQL
statement, in milliseconds.NROWS The number of rows processed by the statement.RDSCALL The number of calls to the Relational SubsystemDBSSCALL The number of calls to the Database Subsystem.DISPCALL The number of DB2/VSE dispatcher callsBUFLOOKS The number of buffer lookups performed by the statement.LOCKS Number of locks currently held by the agent.WAITLOCK The number of times a lock request resulted in wait.ESCALATE The number of times a lock request resulted in lock
escalation.PAGREAD The number of page reads during the statementPAGWRITE The number of page writes during the statement.LOGREAD The number of reads to the DB2/VSE logLOGWRITE The number of writes to the DB2/VSE logDIRBUFL The number of directory buffer lookups performed.DIRREAD The number of directory page reads DIRWRITE The number of directory page writes TOTIO The sum of PAGREAD, PAGWRITE, DIRREAD, DIRWRITE, LOGREAD,
LOGWRITE and INTDBSP.INTDBSP The number of accesses to internal Dbspaces
during the statement.

SQL/Monitoring Facility Page 211
I_ACCESS “1” if an index is being used “0” if no index is being used.
COMMTYPE “STATIC” or “DYNAMIC”LREASON Describes the reason for logging
(Blank if not called by logging component)USERFLAG Flag reserved for the SQLMUAP3 EXEC. (See note 5 below.)

Page 212 SQL/Monitoring Facility
Following variables are setup for agents in lockwait only (AGNTSTAT=’LOCKWAIT’):
LONGL Number of long locks held by the userWANTL Type of lock wanted:
DB lock on databaseDBSP lock on entire dbspaceIKEY lock on indexkeyIPAG lock on index pagePAGE lock on data pageROW lock on data rowSYS system lockTABL lock on an entire table
WANTDB DBspacenumber wantedWANTDBN DBspacename wantedHOLDUSER Name of user holding the lockHOLDAGNT Number of agent holding the lockREQM Mode of lock held
SIX share and intention exclusive lockIS intention share lockIX intention exclusive lockS share lockX exclusive lock
DURAT Duration of lock held INST lock being testedLONG lock held until end of LUWSHORT lock held until end of DBSS callMED lock held until end of LUW or explicit release

SQL/Monitoring Facility Page 213
Notes:
- The above REXX variables contain the resource consumption for the current SQL statementor section (if a cursor-based statement).
- The USERFLAG is a binary fullword variable in the Monitor block for the agent. The variable isreserved for the UAP. It is set from the exit returncode of SQLMUAP3 and is represented in“USERFLAG” when the UAP is called again. It is reset to zero by the Statement Monitor atend of LUW.

Page 214 SQL/Monitoring Facility
19.4.4 SQLMUAP4: Locked agent status
The following variables are available to the SQLMUAP4 process. They are presented by thesystem monitor at each monitoring interval for each user in the lockwait state.
DATABASE Databasename sampledDATE Monitoring date in SQL formatTIME Monitoring time in SQL formatAGENT Agent number in lockwait stateUSERID Username in lockwait stateLOCKS Number of locks held by the userLONGL Number of long locks held by the userWANTL Type of lock wanted:
DB lock on databaseDBSP lock on entire dbspaceIKEY lock on indexkeyIPAG lock on index pagePAGE lock on data pageROW lock on data rowSYS system lockTABL lock on an entire table
WANTDB DBspacenumber wantedWANTDBN DBspacename wantedHOLDUSER Name of user holding the lockHOLDAGNT Number of agent holding the lockREQM Mode of lock held
SIX share and intention exclusive lockIS intention share lockIX intention exclusive lockS share lockX exclusive lock
DURAT Duration of lock held INST lock being testedLONG lock held until end of LUWSHORT lock held until end of DBSS callMED lock held until end of LUW or explicit release
USERFLAG Flag reserved for the SQLMUAP4 EXEC. (See note 1 below.)

SQL/Monitoring Facility Page 215
19.4.5 SQLMUAP5: DB2/VSE Log usage
The following variables are presented by the System Monitor at each monitor interval for eachmonitored database:
DATABASE Databasename sampledDATE Monitoring date in SQL formatTIME Monitoring time in SQL formatLOGSIZE Size of the logfile in bytesUSED Number of logfile bytes usedPUSED Percentage of logfile bytes usedPOFLOW Percentage of logfile space remaining before overflowPCHCK Number of pages remaining before checkpoint

Page 216 SQL/Monitoring Facility
19.4.6 SQLMUAP6: DB2/VSE Connections
The following DB2/VSE counters are available to the SQLMUAP6 process. They show thestate of the DB2/VSE connections at the monitor sample time.
DATABASE Databasename sampledDATE Monitoring date in SQL formatTIME Monitoring time in SQL formatCONNECTD Number of users connectedACTIVE Number of users in LUWWAITING Number of users waiting for an agent structureINACTIVE Number of users connected and not in LUWA_AGENT Number of agent structures availableA_CONNCT Number of connections available

SQL/Monitoring Facility Page 217
19.4.7 SQLMUAP7: Checkpoint delays
The following variables are available to the SQLMUAP7 process when a checkpoint or logarchive delay occurs in one of the monitored databases.
DATABASE Databasename sampledDATE Monitoring date in SQL formatTIME Monitoring time in SQL formatUSERID DB2 userid active and possibly causing the checkpoint
delayVSEID VSE userid active at checkpoint delaySTATE Wait state of that user
“RUN” executing“COMM” in communication wait:“I/O” waiting for input/output completion“LOCK” waiting for a database resource“DBUF” waiting for a directory buffer“PBUF” waiting for a page buffer“SLD” waiting for save block“CHKP” waiting on checkpoint completion
RWAPPL “Y if application is read-write; N otherwiseAGENT User’s agent numberPACKAGE Name of package executedSECTION Package section number

Page 218 SQL/Monitoring Facility
19.4.8 SQLMUAPX: Agent restricting
The UAP is called from the Governor function when it decides to force an agent because ithas reached a restricting condition.
The following entry arguments are passed to the UAP:
- name of the restricting condition reached with the same value as the keyword that enabledthe condition in the RESTRICT file (e.g. MAX_IDLETIME, MAX_LOCKHOLD etc.)
- database name- VSE userid- DB2 userid- user location (terminal name)- package name- package section
The EXEC should return with one of the following values:
0 Restricting should be bypassed and the user allowed to continue execution.1 Restricting should proceed to force the user.2 When a MAX_LOCKTIME restriction has been presented, returncode 2 requests to force
the lock holder and to allow the waiter(s) to continue. When a MAX_LOCKHOLDrestriction has been presented, returncode 2 requests to force the lock waiter(s) and toallow the holder to continue.
Sample SQLMUAPX Process
/* User attached process for restricting agents */
arg restrict database VSEid DB2id loc package section
/* assume agent should be forced */exit_RC = 1
/* package ABC executed at terminal XYZ is allowed to violate the MAX_RESPONSE restriction */
if (restrict=‘MAX_RESPONSE’)&(package=’ABC’)&(loc=’XYZ’) then exit_RC = 0
Exit exit_RC

SQL/Monitoring Facility Page 219
12To find the statement text for a given package section, use the Reports function of the$DBM interface. Then select the Statements Statistics option and the SCTEXT report.
20 Utility Programs
20.1 Printing the agents active at a DB2 abend
When a DB2 abend occurs, it is sometimes useful to know which packages were active at thattime.
The SQLMFALA utility will print for each active DB2 user agent:
- the DB2 userid- the package name- the package section number12
- the agent state
The agent with state “Running” was active when the DB2 abend occurred. All other agents will bein a wait state or in the “Ready to run” state.
The agent list is kept until the next VSE IPL or the next DB2 abend.
Invocation
// EXEC SQLMFALA

Page 220 SQL/Monitoring Facility
SQL/Monitoring Facility Page 221
21 Application Program Interfaces
21.1 Issuing an operator command from an application
Application programs may call the SQLMOPC module to execute a DB2/VSE operator commandin a database monitored by SQL/MF. A DB2/VSE agent structure is required for commandexecution.
The SQLMOPC module is called with two parameters
- the 8-character name of the database server that must execute the command- the 80-character DB2/VSE command to execute
On return from SQLMOPC, a pointer is returned to the command reply, which is maintained withinthe SQLMOPC module as an array of 512 80-character output lines. The array is set to all blanksbefore issuing the command. After command completion, the array contains the command output,as it would have appeared on the console of the database server. In most cases, the last line ofthe reply starts with the string “ARI”.
The SQLMOPC module has been designed for use by assembler language programs. However,other languages may be able to satisfy the entry requirements described. The module is part of theSQL/MF distribution material and is stored in the SQL/MF library with the name SQLMOPC OBJ.This component should be linked with the application by declaring SQLMOPC as an externalname.
When calling SQLMOPC, following general registers should be setup:
register 1 : address of the parameterlist, which contains 2 pointers, namely (a) the address of an 8-byte areacontaining the databasename (b) the address of an 80-byte area containing the command toexecute
register 13 : address of a 72-byte register savearea
register 14 : return address to the application
register 15 : entry address of SQLMOPC
On return from SQLMOPC, general register 15 points to the command reply area.

Page 222 SQL/Monitoring Facility
Example:
EXTRN SQLMOPCCALL SQLMOPC,(DATABASE,COMMAND)
* REGISTER 15 NOW POINTS TO OUTPUT OF SHOW ACTIVELR R2,R15CLC 0(3,R2),=C’ARI’BE DONE
* PROCESS COMMAND REPLY LINE
DATABASE DC CL8'TESTDBN’COMMAND DC CL80'SHOW ACTIVE’
SQL/Monitoring Facility Page 223
22 Operational Notes
22.1 SQLCSI
SQLCSI is invoked during DB2/VSE startup and terminates itself when a DB2/VSE shutdownrequest is detected. Restarting SQLCSI is done by restarting the database server. SQLCSI isloaded below 16 Mb. Dynamic storage required during monitoring is always allocated above the16 Mb line.
To avoid interference with dynamic storage requests issued by DB2/VSE during operation,SQLCSI obtains a 4 Megabyte storage block from VSE during initialization and allocates its fixed-length storage requests from that block. The internal storage pool and all other dynamic storage isalways acquired above the 16 Mb line. If your DB2/VSE system is already storage constrained,you should allocate an additional 4 megabytes of virtual storage to the DB2/VSE server.
The additional CPU consumption in the database server associated with monitoring depends onthe application command mix: in the average, it will range from 5 to 15 percent. The monitoringoverhead will be higher for packages executing using the DRDA protocol.
The SQLCSI abend exit is active while the monitor is running, to prevent an abend in the DB2/VSEserver. Should an abend condition occur within the monitor code, the abend exit will display anddump abend information. Database operation will continue without monitoring.
22.2 Shutdown considerations
The SQLCSI component in the DB2 server initiates its own shutdown at DB2 shutdown.
The SQLMFSRV service partition and all its subtasks are shutdown as follows:
MSG xxxx SHUTDOWN
SQLMFSRV supports the DATA option of the MSG command. Shutdown can be requested usingthe command MSG SQLMFSRV,DATA=SHUTDOWN.
22.3 DRDA considerations
SQL/MF provides all its monitoring facilities for packages executing within the DB2/VSE serverusing the DRDA protocol.
Due to the differences between the DB2/VSE private protocol and the DRRM data streams usedby DRDA, the following should be noted:
- since a DRRM CONNECT does not provide a package name, the connect command will notappear in the monitor output
- since a DRRM commit or rollback does not provide a package section number, the fictitiouspackage number 9999 will be assigned by the monitor

Page 224 SQL/Monitoring Facility
22.4 Starting a DB2/VSE trace
SQL/MF uses the DB2/VSE tracing facility for its own purposes. Therefore, you cannot startDB2/VSE tracing while SQL/MF is active.
Before starting a DB2 trace, remove the // EXEC SQLMFINI statement and restart the databaseserver.
22.5 DB2/VSE Release Migrations
Installing a new DB2/VSE release, supported by SQL/MF, does not require any special actions, asfar as SQL/MF is concerned. Using the SQL LEVEL information, the monitor automaticallyactivates the appropriate release code at startup of the database server.

SQL/Monitoring Facility Page 225
23 SQL/MF Messages
23.1 SQLCSI Messages
SQLCSI000 Monitoring initiated for DB2/VSE Version N Release M
Informatory message showing the current DB2/VSE version and release number.
SQLCSI005 “xxxx” Notification. User N, package N, section N
The condition “xxxx” specified in the configuration NOTIFY command hasoccurred for the named user and program.
SQLCSI006 Unsupported DB2/VSE version
SQL/MF supports DB2/VSE (SQL/DS) from version 3.5 on.
SQLCSI007 Unable to create monitor data space. RC=n
RC n occurred during creation of the monitor data space. The returncode is thatfrom the DSPSERV CREATE macro.
SQLCSI008 Required data space size is nK
The current SYSDEF DSPACE parameters do not allow the creation of themonitor data space, which needs n K.
SQLCSI009 RC n issuing ALESERV ADD
RC n returned from the ALESERV ADD macro.
SQLCSI010 SQLCSI loadarea is from n to m
Informatory message showing the load address of SQLCSI.
SQLCSI017 No room in SQLMFCSA for database n
Attempt to monitor more than 32 databases on a single VSE system.
SQLCSI018 Processing SQLCSI PROFILE
This informatory message is issued during SQL/MF startup when the file SQLCSIPROFILE was found in the SQL/MF library. All commands contained in thePROFILE are now executed.
SQLCSI080 Following statements read from SQLMF CONFIG file:
The statements read from the SQLMF CONFIG file are printed on the console.
SQLCSI082 ANALYZE statement invalid.
The ANALYZE command specifications in the SQLMF CONFIG file are in error.

Page 226 SQL/Monitoring Facility
SQLCSI083 Invalid CONFIG keyword xxxxx
An unrecognized command keyword has been found in the SQLMF CONFIG file.
SQLCSI085 Monitoring period incorrect.
The PERIOD command in the SQLMF CONFIG file specifies an incorrect time(hhmm) argument.
SQLCSI086 Invalid LOG argument xxxx.
The LOG command in the SQLMF CONFIG file specifies the unrecognizedargument xxxx.
SQLCSI087 xxx statement invalid.
The BENCHMARK command in the SQLMF CONFIG file specifies theunrecognized argument xxxx.
SQLCSI088 Invalid NOTIFY parameter xxx
The NOTIFY command in the SQLMF CONFIG file specifies the unrecognizedparameter xxxx.
SQLCSI091 RC nn reading SQLMF CONFIG.
Reading the SQLMF CONFIG file results in the VSE file system error nn.
SQLCSI094 INITIAL statement in error.
The INITIAL statement in the SQLMF CONFIG file has been coded incorrectly.
SQLCSI095 MONITOR command in error.
The MONITOR command you supplied in the HostCommand section of the $DBMprogram is incorrect.
SQLCSI096 Monitoring has been suspended.
The MONITOR SUSPEND command you supplied in the HostCommand sectionof the $DBM has taken effect.
SQLCSI097 Monitoring has been resumed.
The MONITOR RESUME command you supplied in the HostCommand section ofthe $DBM has taken effect.

SQL/Monitoring Facility Page 227
SQLCSI099 Syntax errors processing SQLMF CONFIG
Syntax errors were found in the configuration file, as indicated in a preceding errormessage.
SQLCSI213 RECORDER INTERVAL argument missing.SQLCSI214 RECORDER LEVEL argument missing.SQLCSI216 RECORDER DSPSIZE argument invalid.SQLCSI217 Invalid RECORDER parameter nnn
These messages are issued only when the Command Recording facility has beenrequested in the SQLMF CONFIG file. The messages indicate that a RECORDERstatement argument is specified incorrectly or that a required argument has beenomitted.
The command recording facility is disabled.Correct the SQLMF CONFIG statement in error.
SQLCSI218 Command Recording has been suspended.
Message confirming the MONITOR CRSTOP command.
SQLCSI219 Command Recording has been resumed.
Message confirming the MONITOR CRSTART command.
SQLCSI220 Command Recording now from hhmm to hhmm
Message showing the actual recording period after the MONITOR CRFROM orCRTO commands.
SQLCSI304 Communications data space full. Communication temporarily suspended.
This message is issued only when data space-based communication has beenrequested in the SQLMF CONFIG file.
The message may indicate that the SQL/MF service partition is not started or thatit is no longer polling the data space (because it is in a DB2/VSE wait state forinstance).
However, the message may also indicate that you should request a larger dataspace (the COMQ_SIZE parameter in the SQLMF CONFIG file).
SQLCSI305 Waiting for communications data space depletion..
DB2/VSE shutdown has been requested and non-processed requests were foundin the communications data space. Shutdown waits until all entries have beenprocessed, or until it is found that SQLCS is not processing, in which casemessage SQLCSI306 is given, after which shutdown proceeds.

Page 228 SQL/Monitoring Facility
SQLCSI306 Command Monitor is not processing. Communications data space dropped.
Message SQLCSI305 has been issued and it is found that SQLCS did notperform data space polling during the last 30 seconds. DB2/VSE shutdown isresumed and the log requests or statistical data in the communications dataspace are lost.
SQLCSI990 Program check during monitoring.SQLCSI992 DUMP is in progress ...
The above messages are issued when a program check occurs in the CommandMonitor. Save the messages and the dump files and call for support.
SQLCSI0999 SQL/Command Monitor is terminating.
Monitor shutdown in progress.
SQLCSAPI001 Autoprep facility has been enabled
AUTOPREP control records were found in SQLMF CONFIG and have beenprocessed.

SQL/Monitoring Facility Page 229
23.2 SQLMFSRV Messages
SQLMFSRV02 Orderly shutdown in progress
An SQLMFSRV shutdown command is being processed.
SQLMFSRV03 Component nnnnnn loaded at mmmmmm
The named SQL/MF component has been loaded at the indicated address. Allcomponents in the SQLMFSRV partition execute as VSE subtasks.
SQLMFSRV05 Auto-restart in progress ..
An automatic restart of SQLMFSRV occurs at midnight or when an abend hasoccurred within a component.
Page 230 SQL/Monitoring Facility
23.3 SQLCS Messages
SQLCS001 SQLCODE xxx CONNECTING TO nn
SQLCODE xxx occurred when SQLCS attempts to connect the databasecontaining the log table. (The database name in the LOG DATABASEconfiguration statement).
Start the database if needed. The connect is retried when the next log request isreceived. The current log request however is not processed.
SQLCS003 Building nnn object lists
The SQLCS component builds a list of all Dbspaces, tables and indexes of thenamed database.
SQLCS007 SQLCODE xxx INSERTING PROGSTATS
SQLCODE xxx was returned when inserting program statistics into theSQLCS_LOG table.
Examine the SQLCODE. Call for software support if you cannot recover from theerror.
SQLCS008 SQLCODE xxx UPDATING PROGSTATS
SQLCODE xxx was returned when updating program statistics on theSQLCS_LOG table.
Examine the SQLCODE. Call for software support if you cannot recover from theerror.
SQLCS010 SQLCODE xxx BUILDING SQL_STMNTS
SQLCODE xxx was returned when inserting command statistics into theSQLCS_SQL_STMNTS table during an end_of_command log.
Examine the SQLCODE. Call for software support if you cannot recover from theerror.
SQLCS011 SQLCODE xxx SELECTING SQL_STMNTS
SQLCODE xxx was returned when retrieving the command text from theSQLCS_SQL_STMNTS table during logging or benchmarking.
SQLCS014 SQLCODE xxx SELECTING SYSDBSPACES
SQLCODE xxx was returned when retrieving the Dbspace name during objectidentification.
SQLCS015 SQLCODE xxx SELECTING SYSCATALOG
SQLCODE xxx was returned when retrieving the tablename during objectidentfication.

SQL/Monitoring Facility Page 231
SQLCS016 SQLCODE xxx SELECTING SYSINDEXES
SQLCODE xxx was returned when retrieving the indexname during objectidentfication.
SQLCS017 SQLCODE xxx CONNECTING yyy
SQLCODE xxx was returned when connecting to database yyy during objectidentification.
SQLCS021 Abend limit exceeded
SQLCS restarts itself after an abend. However, continuous (more than 4) abendrestarts are detected. In this case the above message is issued and SQLCS goesinto a dormant state. Full program functionality is re-attempted at the begin of anew session (which occurs at midnight by default).

Page 232 SQL/Monitoring Facility
SQLCS091 Deleting log entries older than n days
Message issued during SQLCS startup. Indicates that the LOG RETAINparameter is being processed.
SQLCS092 Deleting ProgStats older than n days
Message issued during SQLCS startup. Indicates that the LOG RETAINparameter is being processed.
SQLCS096 Performing session initialization for database N
The first SQL command executed in a database session causes the catalogobject lists to be built.
SQLCS097 Session initialization for database N complete.
SQLCS100 Syntax error in file <databasename RESTRICT> at keyword <keyword>
A command in the restrict file has invalid syntax and is ignored.
SQLCS101 EXCLUDE syntax error in file <databasename RESTRICT> at keyword<keyword>
An EXCLUDE command in the restrict file has invalid syntax and is ignored.
SQLCS102 INCLUDE syntax error in file <databasename RESTRICT> at keyword <keyword>
An INCLUDE command in the restrict file has invalid syntax and is ignored.
SQLCS103 <database><SQLuser> agent <number> forced due to<restriction_condition>
SQLCS103 Program name is <name>. Command started at <starttime>
The governor applied the named restriction to the named user. The namedDB2/VSE userid has been forced.
SQLCS104 No restrictions in effect for database <databasename>
No restrict file was found for the named database.
SQLCS105 Restriction file databasename RESTRICT in effect for database<databasename>
The named restrict file is in effect for the named database.
SQL/Monitoring Facility Page 233

Page 234 SQL/Monitoring Facility
23.4 SQLCSLST Messages
SQLCSL01 PF key unassigned or function not available
You pressed an unsupported PFkey.
SQLCSL03 SQL executor returns errorcode xx
An internal error has occurred. Call for support.
SQLCSL04 SQL executor returns SQLCODE xx
SQLCODE xxx was presented when executing the SELECT on the log table.
If you entered a non-standard command clause for log selection, verify that it hasvalid SQL syntax.
SQLCSL05 SELECT list is empty
The log table contains no rows that satisfy your search criteria.
SQLCSL06 Insufficient storage. Output list is incomplete.
There is not enough virtual storage to contain the entire report. Enlarge yourvirtual storage size or request a more selective report.

SQL/Monitoring Facility Page 235
23.5 SQLMFM Messages
SQLMF000 Monitoring Session started for today <date>
Informatory messages issued at startup of the System Monitor.
SQLMF001 Loading Dbspace table for n
The component builds a list of Dbspace names for all acquired DBspaces.
SQLMF006 CONNECT to <name> returns SQLCODE xxx
When connecting to one of the databases defined in the SQLMFIN CTL file,SQLCODE xxx has been detected. Connect is retried at each monitoring interval.
SQLMF102 SQLCODE nnnn IN ROUTINE routine_name
SQLCODE nnnn occurred when inserting monitor data in the SQL session tables.The routine name specified indicates the table access where the error hasoccurred.
I000 : SQLMF_SESSION_CTRI100 : SQLMF_COUNTSI200 : SQLMF_DBSP_COUNTSI300 : SQLMF_DBXT_COUNTSI400 : SQLMF_DBSP_USEI500 : SQLMF_DBXT_USEI600 : SQLMF_USER_STATEI700 : SQLMF_LOG_USEI800 : SQLMF_CHKP_DELAYI1000 : SQLMF_CONNECTSI1400 : SQLMF_DSP_COUNTSDELETE : applying the “RETAIN” parameter.

Page 236 SQL/Monitoring Facility
23.6 SQLCSCRW Messages
SQLCSCRW01 Recorder file is full
The VSAM cluster SQLMF.RECORDER.PDS is full. Subsequent recording requestsare flushed, until the SQL/MF service partition is restarted.
Possible actions:
- Enlarge the VSAM cluster. See the SQLMFI6 installation job or the SQLMIPDS.PROCfor details. Note that the cluster is open in the SQL/MF service partition and in theCICS partitions where the SQL/MF user interface has been installed.
- Reduce the number of SQL statements recorded.- Specify a lower value for the RECORDER KEEP parameter. (The default KEEP
values is 3).

SQL/Monitoring Facility Page 237
23.7 Various Messages
23.7.1 Messages issued by the SQLCSTMT installation program
SQLCSTMT01 Creating SYSCAT_TABID index
SQLCSTMT is creating an additional index on SYSCATALOG.
SQLCSTMT02 Unloading n packages into the SQL_STMNTS table
SQLCSTMT has started the unload of n packages into the Statements table.
SQLCSTMT03 n packages have been unloaded
Message indicating the progress of the package unload process.
23.7.2 Messages issued by the Access Control Facility
SQLMFACF01 Application n has not been granted to user m
User m has not the authority of executing the SQL/MF application n.If a grant is needed, update the SQLMF ACF control file.
23.7.3 Messages issued by Connect Control
SQLMFCON001: waiting for SQL/MF database to come up
An SQL/MF component requested access to the SQL/MF database and the databaseis down. The component waits until the database is started.
SQLMFCON002: Unable to get SQLMF password
The password for the DB2 userid SQLMF cannot be obtained from the SQL/MFpassword file.
Ensure that SQL/MF has been installed correctly.

Page 238 SQL/Monitoring Facility
23.7.4 Messages issued by the SQL/MF Initiator
SQLMFINI000 SQL/MF bootstrap has been installed
SQL/MF initialization has completed normally.
SQLMFINI001 PRODID DEFINE error nSQLMFINI002 DOC PRODEXIT DEFINE error nSQLMFINI002 SVC PRODEXIT DEFINE error nSQLMFINI003 DOC PRODEXIT ENABLE error nSQLMFINI003 SVC PRODEXIT ENABLE error n
Returncode N received after the PRODID DEFINE macro when attempting to installthe SQL/MF vendor exits.
These returncodes are documented in the IBM manual Preparing a product for VSE.(SC33-6331-01)
SQLMFINI004 Too many databases specified. SQL/MF not installed.
SQL/MF cannot monitor more than 32 databases on a single VSE system.
SQLMFINI005 SQLMFDOC | SQLMFSVC loaded at nnn
Shows the load addresses (in the SVA) of the SQL/MF vendor exits.
SQLMFINI006 Monitoring requested for database nnn
Indicates that the named database will be monitored.
SQLMFINI007 <modulename> not SVA resident. Cannot continue.
Indicates that an SQL/MF component is not in the SVA, as expected.Ensure that the SET SDL / LIST=$SVASQLM statements have been inserted into$0JCL and that VSE has been IPL-ed with the updated $0JCL.
SQLMFON001 DB2/VSE DBSS|RDS component not SVA resident
Informatory message.
SQLMFON002 SQL/MF cannot be initialized
An error occurred during SQL/MF initiation. Another message will precede.

SQL/Monitoring Facility Page 239
24 Glossaryaccess pathTo access a table, DB2/VSE automatically chooses an access strategy. A table can be accessed by aDBspace scan, by a non-selective index scan or by a selective index scan. The access path adoptedis stored in the package. To record the access path for a given SQL statement during its execution,SQL/MF scans the storage-resident DB2 package.
agentA structure allocated by the database manager to enable the processing of requests from a DB2/VSEclient. There are always 3 system agents. A fourth system agent is active in a TCP/IP environment.Each active DB2/VSE user session is represented by a user agent. SQL/MF monitors user agents andthe checkpoint agent.
blockingDuring XPCC communications between a database server and a client, the blocking option causesmultiple table rows to be transmitted in a single transaction. Without blocking, each table row to bepassed requires a transaction. Blocking is a facility to be requested at preprocessing time. It reducesthe communications overhead between client and server. Please note that only cursor-basedstatements are eligible for blocking. Furthermore, even when blocking has been requested, DB2/VSEmay force non-blocking, for example, when the statement uses long fields, during a SELECT FORUPDATE etc.
buffer lookupDB2/VSE holds the most recently accessed data in a storage area called the bufferpool to avoid I/Owhen the same data is accessed repeatedly. Before attempting I/O, the database manager performs abuffer lookup to find the requested data.
command typeThe type of the statement is a character string determined by SQL/MF from the call parameters at thetime of the SQL request (OPEN, FETCH, CLOSE and so on).
communications waitThe time elapsed between the end of the previous statement and the start of the current statement(expressed in milliseconds with microsecond precision). During that time, the agent waits for the arrivalof a new SQL request on the XPCC communications path. Therefore, the communications wait timeincludes application processing time by the client.
CPUtime usedThe processor time used by the database server to process the current statement (expressed inmilliseconds with microsecond precision).
data pages readThe number of pages read from disk.
data pages writtenThe number of pages written to disk. Please note that a statement changing the database does notinitiate an immediate write to disk. Rather, the database manager flags the corresponding bufferpoolpage as modified and writes the page to disk at checkpoint time or when another application steals thebufferpool page.

Page 240 SQL/Monitoring Facility
DBSS callThe user’s SQL request is processed by RDS (the Relational Data System) which calls DBSS (theDatabase Subsystem) to retrieve data from the database. Complex SQL statements may requiremultiple DBSS calls during a single RDS call. The (DBSS_call/RDS_call) ratio is a performanceanalysis parameter.
deadlockThe situation where multiple users lock the database in such a manner that an unending wait situationwould arise. The database manager forces one of the users involved.
directory buffer lookupThe buffering technique described under Buffer Lookup above also applies to the retrieval of directorypages.
directory blocks readThe number of directory pages read from disk.
directory blocks writtenThe number of pages written to disk.
dispatcher callsWhen an agent must wait for an event to complete, it calls the DB2/VSE dispatcher which continueswork for other users. A dispatcher call is made when the agent must wait for I/O completion, forunlocking of a locked resource, for the arrival of the next SQL request from the client and so on.
elapsed timeThe wall-clock time elapsed between the begin and the end of an SQL statement. In case of cursor-based statements, the opening of the cursor is used as begintime.
hit ratio’spage_buffer_hit_ratio:shows the efficiency of page buffer pool access as the percentage of page buffer lookups thatcould be satisfied without needing I/O or data space access.
directory_buffer_hit_ratio:shows the efficiency of directory buffer pool access as the percentage of directory buffer lookupsthat could be satisfied without needing I/O or data space access.
host variablesThose elements of the SQL statement that are unknown when the statement is preprocessed by thedatabase server and that are specified at execution time. When showing monitored statements,SQL/MF substitutes the host variable names with their contents.
internal DbspaceThe database manager uses internal ("temporary") Dbspaces for various purposes, such as sorting,joining and so on. Internal DBspaces are always accessed by relational scan. Therefore, unnecessaryuse of those Dbspaces may have a negative performance impact.
I/O wait timeThe accumulated time (in milliseconds) that an agent has waited for the completion of its I/O requests.

SQL/Monitoring Facility Page 241
isolation levelThe isolation level may take the values RR (repeatable read), CS (cursor stability), RS (read stability)or UR (uncommitted read).
lock escalationThe event where a large number of locks is changed by the database manager into a lock of a higherlevel.
lock waitThe number of times a resource lock request from an agent results in a wait state, because theresource is in use.
lock wait timeThe total time (in milliseconds) that an agent had to wait for locked resources.
log pages readThe number of pages read from the DB2/VSE log.
log pages writtenThe number of pages written to the DB2/VSE log.
packageThe collection of executable SQL statements, produced by the DB2/VSE preprocessor. Previouslycalled access module.
package sectionEach statement in a package is called a section and receives a section number during preprocessing.A single section number is allocated by DB2/VSE to cursor-based statements (open, fetch, close).SQL/MF adds a dummy section, numbered -1, to show the processing cost associated with packageloading, run privilege checking and auto-reprepping (if applicable).
package unloadDuring product installation, all packages are unloaded and stored in the SQL_STMNTS table. Forpackages prepped (or reloaded) while SQLCSI is active, the SQL_STMNTS table is updatedautomatically. For packages prepped while SQLCSI was inactive, a DBSU program unload will beperformed automatically to update the SQL_STMNTS table.
RDS callAn application request is received and processed by the Relational Data System. See also DBSS callabove.