Embed Size (px)
Citation preview

1
FY02 ASA Presentation
Lead and Manage ORS
Presented by: Shirl Eller, Director, Division of Intramural Research Services
Office of Research ServicesNational Institutes of Health
18 November 2002

2
Team Members
Stephen Ficca, Shirl Eller, George Mendez, Robert Ostrowski
DS1: Lead and Manage ORS
DS2: Support ORS Advisory and Executive Committees
DS3: Direct and Support ORS communication and outreach initiatives and activities
DS4: Provide Division Support
Product Leadership Harvest
Leonard Taylor, Pam Dressell
Operational Excellence Growth
ASA Template - 2002
Customer Value Proposition
Team Leaders
Lead and Manage ORS
Discrete Services
Service Group
Customer Intimacy Sustain
Set strategic direction, garner needed resources, and foster organizational climate so ORS can successfully meet NIH's changing need for administrative, research support, and capital project planning and execution services.
x

3
ORS leaders have 3 primary customer segments: ORS program staff
NIH community at large
NIH senior leaders/decision makers
Groups surveyed/response rates:ORS Leadership Group = 66%
ORS Executive Committee = 100%
NIH Senior Leaders = 29%
NIH OD; IC & Scientific Directors, EOs, ORSAC, FARB
Customer Segmentation
4
• ORS program managers’/supervisors’ perception of involvement in decision making and business planning.
• Key external customers perception of the value ORS provides to the NIH.
Unique Customer Measures

5
Perceptions of Decision Making FY02 Mean Ratings
4.34.2 4.2
4.34.2
3.7
3.4
2.82.9
3.9
3.6
2.5
1
2
3
4
5
I have input intoresource
allocation
I Have input intofuture direction of
ORS
I have input intoimproving ORS
I have authorityto make decisions
Programmanagers have
input intoprogram area
Programmanagers haveinput into ORS-wide initiatives
ORSEC
Leadership GroupStrongly Agree
Neither
Strongly Disagree

6
Perceptions of Decision Making ORSEC FY01 and FY02 Mean Ratings
44.2 4.2
4.5
3.23.4
4.34.2 4.2
4.34.2
3.7
1
2
3
4
5
I have input intoresource
allocation
I have input intofuture direction of
ORS
I have input intoimproving ORS
I have authority tomake decisions
Programmanagers have
input intoprogram area
Programmanagers haveinput into ORS-wide initiatives
FY01
FY02Strongly Agree
Neither
Strongly Disagree

7
Perceptions of Decision Making Leadership Group FY01 and FY02 Mean Ratings
3.5
2.93
4.1
3
3.33.4
2.82.9
3.9
3.6
2.5
1
2
3
4
5
I have input intoresource
allocation
I have input intofuture direction of
ORS
I have input intoimproving ORS
I have authority tomake decisions
Programmanagers have
input intoprogram area
Programmanagers haveinput into ORS-wide initiatives
FY01
FY02Strongly Agree
Neither
Strongly Disagree

8
Conclusions of Decision Making
• EC members believe they have input into/authority to make decisions
• LG members believe they have input into/authority to make decisions in their own program areas
• LG members have lower perceptions of decision-making authority on improving ORS, ORS-wide initiatives, & future direction of ORS
• FY01 & FY02 ratings approximately the same for both groups
• Assumption: Expect LG perceptions to change with new organizational structure & governance model

9
Perceptions of Information AccessFY02 Mean Ratings
3.9
3.63.4
3.1
1
2
3
4
5
I have easy access toinformation
Program managers receivetimely information on
decisions faced by ORS
ORSEC
Leadership group
Strongly Agree
Neither
Strongly Disagree

10
Perceptions of Information AccessORSEC FY01 and FY02 Mean Ratings
4.2
3.4
3.9
3.6
1
2
3
4
5
I have easy access toinformation
Program managers receivetimely information on
decisions faced by ORS
FY01
FY02
Strongly Agree
Neither
Strongly Disagree

11
Perceptions of Information AccessLeadership Group FY01 and FY02 Mean Ratings
3.7
3.33.43.1
1
2
3
4
5
I have easy access toinformation
Program managers receivetimely information on
decisions faced by ORS
FY01
FY02
Strongly Agree
Neither
Strongly Disagree

12
Conclusions - Information Access
• EC members believe they have easy access to information needed and that program managers receive timely information.
• LG members rate access to & timeliness information slightly lower
• FY02 ratings slightly lower than FY01 ratings for both groups indicating need to focus on better communication tools
• Assumption: Expect LG perceptions to change with new organizational structure & governance model

13
Perceptions of Understanding of ORS Business Processes FY02 Mean Ratings
3.5
2.9
3.3
2.9
3.2
4.1
3
3.6
3.1
3.4
1
2
3
4
5
Programmanagers
understandprogram
relationship toORS as whole
Programmanagers
understand ORSbusiness planning
process
Programmanagers
understand ORSservice hierarchy
Programmanagers
understand ABCcost accounting
model
Programmanagers
understand ASAprocess
relationship tobusiness planning
ORSEC
Leadership Group
Strongly Agree
Neither
Strongly Disagree

14
Conclusions - Understanding of Business Process
• LG members’ overall perceptions of their understanding of business processes slightly higher than EC members’ perceptions
• Most ratings near midpoint of scale indicating room for improvement
• Varied responses on 6 questions indicating respondents have very different perceptions of program manager understanding of business processes

15
Ratings of Satisfaction with Performance of ORS Leadership during FY02
5.67
7.00
7.18
7.36
7.76
8.66
1 2 3 4 5 6 7 8 9 10
Communicating how determine fees
Responding to changing needs for facilities
Responding to changing needs for researchsupport services
Managing overall business operations
Communicating with senior leaders aboutORS services
Advising NIH community on situationsimpacting daily activities
Unsatisfied Outstanding
Mean Rating

16
Conclusions – NIH Sr. Leader Survey• Ratings of satisfaction with ORS leadership were all
above the mid-point of the scale• Most satisfied with how ORS advices NIH community on
situations that impact daily activities• Least satisfied with how ORS communicates with senior
leaders about the determination of its fees
• Competence, handling of problems, reliability, responsiveness the highest rated dimensions that are important when considering ORS products/services
• Comments reinforced ratings data• Positive about handling of campus and security-related
matters• Communicating methods for setting fees, managing facility
issues needs improvement

17
• Our Service Group completed 2 deployment flowcharts that cut across all 4 of our discrete services• Budget Decision-making process
• Minimize number of iterations and provide more time for program mangers to accurately compile data
• Organizational Change Communications process• Improve communications down and across
ORS• Apply lessons learned during successful DSFM
realignment to current restructuring efforts
Conclusions from Deployment Flowcharts

18
Process Measures
• Budget Decision-making• Track lead time program managers have for initial
development• Track type & number of questions at each stage• Track number of iterations at each stage• Study relationship between days allocated for
development and number of iterations
• Assumption: More development time = more accuracy, fewer iterations

19
Process Measures
• Organizational Change Communications• Track effectiveness of organizational change
communications• Use process flowchart to identify lessons learned
from DSFM realignment communications and apply to current restructuring effort
• Track and classify questions received through ORS Employee Hotlines (e-mail and phone)
• Team developed automated web-based information management tool to collect and categorize data
20
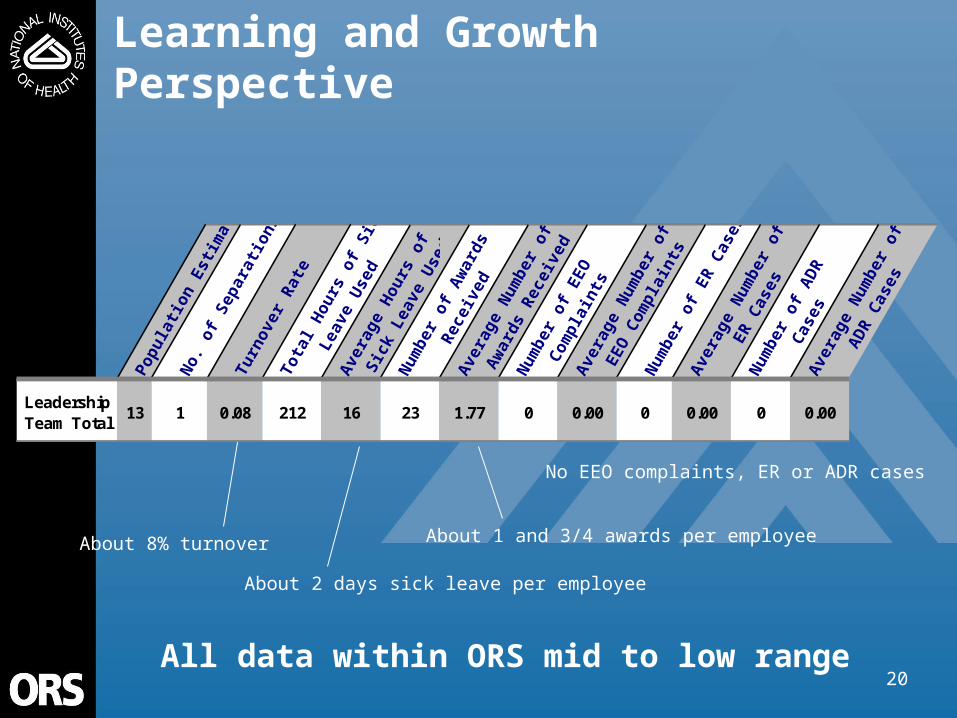
Learning and Growth Perspective
About 2 days sick leave per employee
About 1 and 3/4 awards per employeeAbout 8% turnover
No EEO complaints, ER or ADR cases
Pop
ulat
ion
Est
imat
e
No.
of S
epar
atio
nsTu
rnov
er R
ate
Tota
l Hou
rs o
f Sic
k
Leav
e U
sed
Ave
rage
Hou
rs o
f
Sic
k Le
ave
Use
d
Num
ber
of A
war
ds
Rec
eive
dA
vera
ge N
umbe
r of
Aw
ards
Rec
eive
d
Num
ber
of E
EO
Com
plai
nts
Ave
rage
Num
ber
of
EE
O C
ompl
aint
sN
umbe
r of
ER
Cas
es
Ave
rage
Num
ber
of
ER
Cas
esN
umbe
r of
AD
R
Cas
esA
vera
ge N
umbe
r of
AD
R C
ases
Leadership Team Total
13 1 0.08 212 16 23 1.77 0 0.00 0 0.00 0 0.00
All data within ORS mid to low range
21
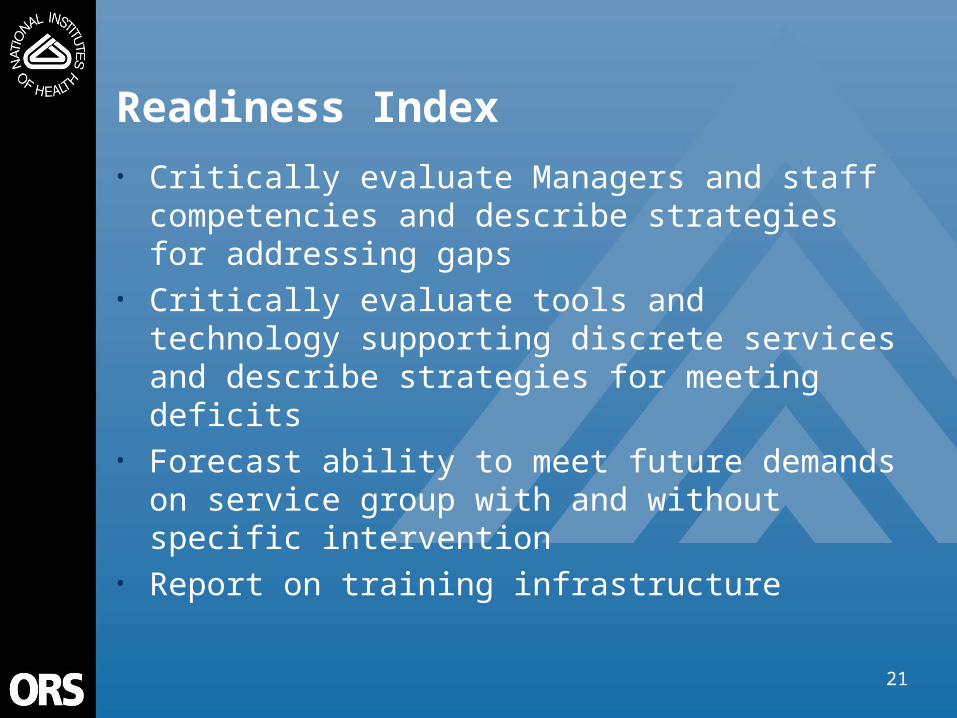
Readiness Index
• Critically evaluate Managers and staff competencies and describe strategies for addressing gaps
• Critically evaluate tools and technology supporting discrete services and describe strategies for meeting deficits
• Forecast ability to meet future demands on service group with and without specific intervention
• Report on training infrastructure

22
Proposed Approach to Readiness Index Part 1:Manager’s Competencies
Com petency Lac
kin
g
Wea
k
Ad
equ
ate
Go
od
Exc
elle
nt
Strategic thinkingPeople managementProgram administrationCommunicationsDecision makingForest and trees

23
Proposed Approach to Readiness Index Part 2: Staff Competencies
Com petency Lac
kin
g
Wea
k
Ad
equ
ate
Go
od
Exc
elle
nt
Customer serviceDesktop applicationsData management and reportingTeamworkQualitative and quantitative analysisKnowledge of ORS

24
Proposed Approach to Readiness Index Part 3: Tools and Technology
State of Tools and Technology Supporting B
roke
n
Ou
tmo
ded
Ad
equ
ate
Go
od
Sta
te o
f th
e ar
t
Lead and Manage ORSSupport ORSEC & ORSACCorporate communicationsProvide Division SupportNew service (specify)New service (specify)

25
Proposed Approach to Readiness Index Part 4: Capacity
Capacity to m eet dem and w ithout intervention for: W
ay u
nd
er
cap
acit
y
Man
agea
bl
e sh
ort
age
Go
od
m
atch
Ext
ra
cap
acit
y
Way
ove
r ca
pac
ity
Lead and Manage ORSSupport ORSEC & ORSACCorporate communicationsProvide Division SupportNew service (specify)New service (specify)

26
Readiness IndexPart 5: Training infrastructure
Is there a training plan for staff supporting this service group? Yes No
Is the cost of the training plan within approved operating levels? Yes No
What is the total budget for training? ______
What is the average and range of planned expenditure per person? Total _______ Average ________ Range

27
ORS leaders attention is focused in three areas: Program activities = 64%
Corporate activities = 34%
Professional development = 2%
ORS leaders time is spent in three areas:Management and service delivery = 89%
Supervision = 9%
Professional development = 2%
Asset Utilization Measures

28
Where Our Attention is Focused
0%
10%
20%
30%
40%
50%
60%
70%
80%
90%
100%
1 3 5 7 9 11 13 15 Average
I ndiv idua l and Avera ge Data
Pro
po
rtio
n o
f T
ota
l T
ime
Program activ ity "Co rp orate activity" Develop men t

29
How We Spend Our Time
0%
10%
20%
30%
40%
50%
60%
70%
80%
90%
100%
1 3 5 7 9 11 13 15 Average
I ndiv idua l and Avera ge Data
Pro
po
rtio
n o
f T
ota
l T
ime
Manag ement a nd Serv ice Delivery Superv is ion Develo pment

30
• Various views of overhead as a percent of program budget
• ORS Services Management & Support - percent of overhead to total program
• Division support as a percentage of Division budget• Division support as a percentage of program staff• ORS Senior Leader Compensation
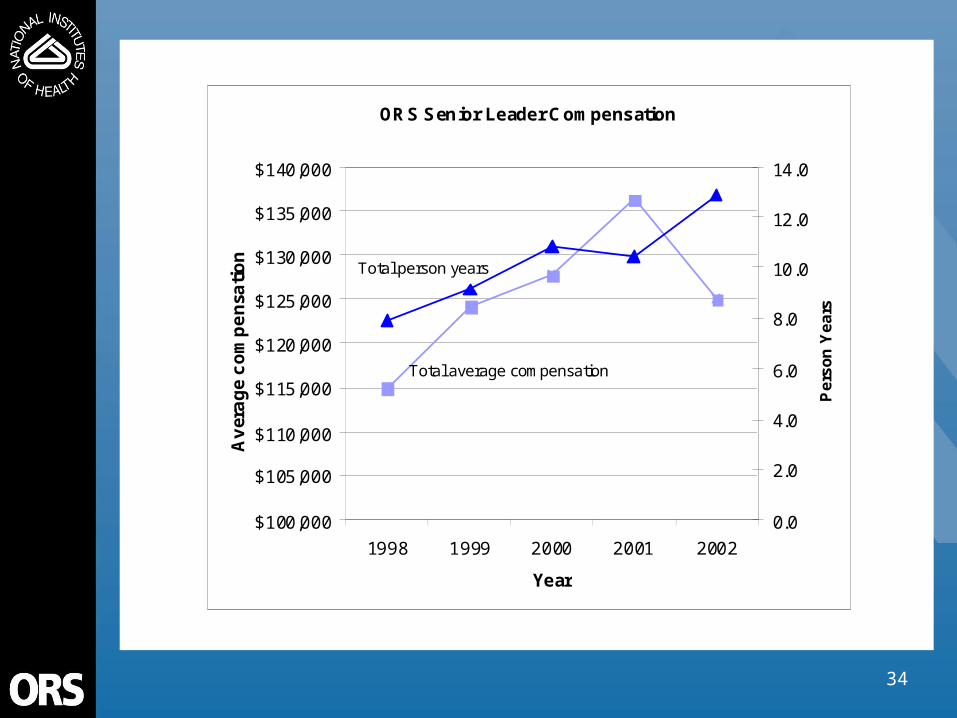
Unique Financial Measures

31
ORS Services Management and Support
200,000
250,000
300,000
350,000
400,000
450,000
500,000
FY98 FY99 FY00 FY01 FY02 FY03
Fiscal Year
Pro
gra
m B
ud
get
Lev
el
(000
's)
2.0%
3.0%
4.0%
5.0%
6.0%
7.0%
8.0%
9.0%
% o
f B
ud
get
Lev
el
ORS OD & Division Support as a % of Total Operations
Direct Program Activities in 000’s
Total Operations in 000’s
ORS OD as % of Total Operations
Division Support as % of Direct Operations

32
D ivisio n Su pp o rt as % o f D ivisio n B u dg e t
0 .0 %
2 .0 %
4 .0 %
6 .0 %
8 .0 %
10 .0 %
12 .0 %
14 .0 %
16 .0 %
18 .0 %
20 .0 %
1 997 1 998 1 999 2 000 2 001 2 002 2 003
Ye a r
% D
ivis
ion
Bu
dg
et
D B E P S $0 .8M
D S $1 .9M
D E S $6 .6M
D S S $1 .5M
D P S $1 .0M
D IR S $1 .2M
33
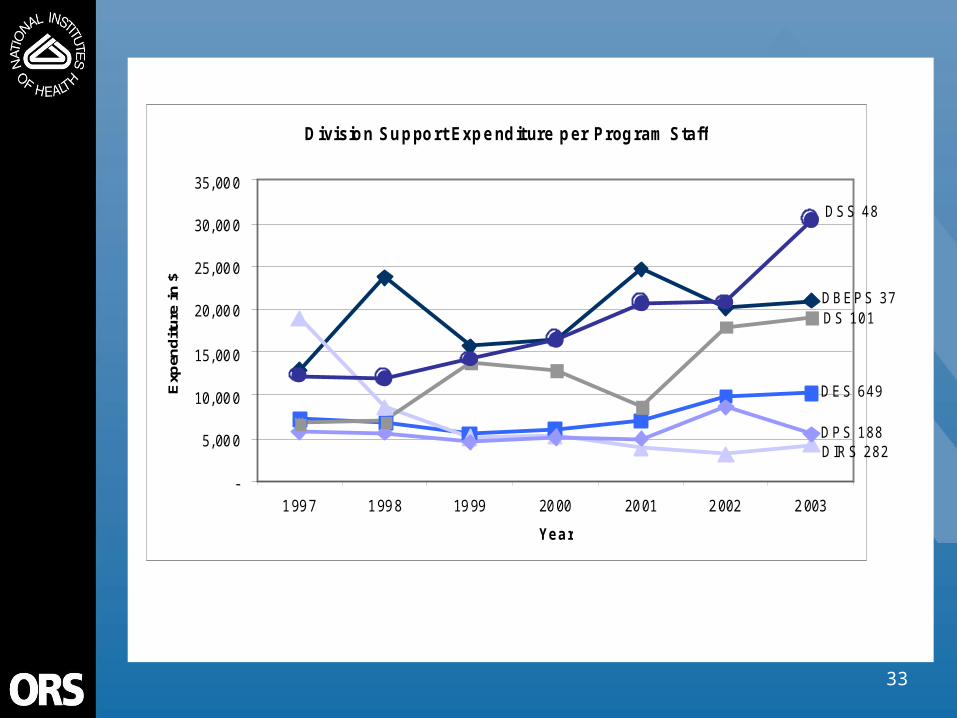
D ivisio n Su p po r t Exp e nd it ure p er Prog ram Staff
-
5, 00 0
10, 00 0
15, 00 0
20, 00 0
25, 00 0
30, 00 0
35, 00 0
1 99 7 1 99 8 19 99 20 00 20 01 2 002 2 003
Ye a r
Exp
end
itu
re i
n $
D B E P S 37D S 10 1
D E S 6 49
D S S 4 8
D P S 1 88D IR S 282
34
ORS Senior Leader Compensation
$100,000
$105,000
$110,000
$115,000
$120,000
$125,000
$130,000
$135,000
$140,000
1998 1999 2000 2001 2002
Year
Av
era
ge
co
mp
en
sati
on
0.0
2.0
4.0
6.0
8.0
10.0
12.0
14.0
Pe
rso
n Y
ea
rs
Total average compensation
Total person years
35
• Develop tools to collect and analyze readiness information
• Identify competencies • Evaluate tools and technology• Develop strategies to address gaps• Develop and implement IDPs
• Develop and implement corporate communications strategy
• Information management tools• Processes for information collection and dissemination
• Use data to guide implementation of restructuring plan and new governance model
Recommendations
36
Appendices
• Process maps• Analysis of Lead and Manage Survey data

37
Deployment Flowchart for Discrete Service - Budget Decision-Making Process
OBSF Program ManagersFARB NIH DirectorORSAC ORSECADRS & DeputyORSAC BudgetSubcommittee
Issue guidance andtimeline
Develop ORStimeline and
guidance
Provide direction toprogram element
Develop budgetrequirements
Acceptrequirements?
Reviserequirements
Consolidate andsubmit
requirements
Yes
Prepare response
Prepare 1st draft ofconsolidated ORS
budget
Yes
No
A
Appoint ORSACBudget
Subcommittee
Acceptrequirements?
No
B
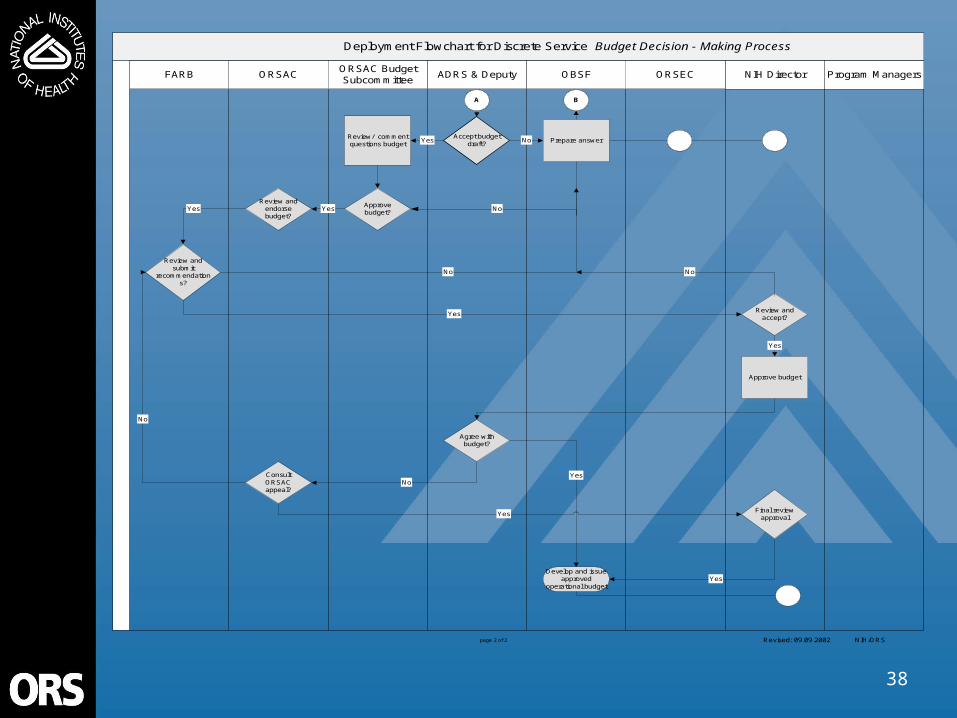
38
Deployment Flowchart for Discrete Service Budget Decision - Making Process
ADRS & Deputy Program ManagersNIH DirectorORSAC ORSECORSAC BudgetSubcommittee
OBSFFARB
Accept budgetdraft?
Review/ commentquestions budget
Prepare answerNo
Review andendorsebudget?
Review andsubmit
recommendations?
Yes
Yes
Approve budget
Yes
Agree withbudget?
ConsultORSACappeal?
Develop and issueapproved
operational budget
No
page 2 of 2
A
Yes
Yes
Approvebudget?
NoYes
No
Review andaccept?
Yes
No
YesFinal review
approval
No
Revised: 09.09.2002 NIH/ORS
B

39
Deployment Flowchart for Discrete Services 1,3 & 4: Organizational Change Process (Communications)
NIH DirectorORS Management
Support ComponentsORS Employees ICsADDS & Deputy
Task Team (Cross-Divisional) *
ORS ACORS
SubcommitteeORS EC
Revised: 09.12.2002 NIH/ORS/ODpage 1 of 1
Receive consultantreport or directive
Discuss anddesignate task
teams
Developcommunication
concept
Accept concept?
* Task teams includes Budget, Personnel, Space, Organizational and UnionIssues
Developimplementation
plans
Yes
Review & developapproach
Receivenotification of re-
alignment
Preparerealignmentmodification
Communicateprocess
Develop &implement
communicationplan
Accept plan?Yes No
These tasks are repeatedcontinuously throughout the
process
No

40
FY02 ORS Customer Survey Data for the Annual Self Assessments
Service Group 39:
Lead and Manage ORSORSEC and Leadership Group Surveys
11 November 2002
Condensed version

41
Summary of Survey Results
• Survey distribution• Customer segmentation • FY02 results, comments, and comparisons with FY01
• Decision making• Information access• ORS processes • Resources
• Conclusions• Appendices
• Individual question results• Training detail
42
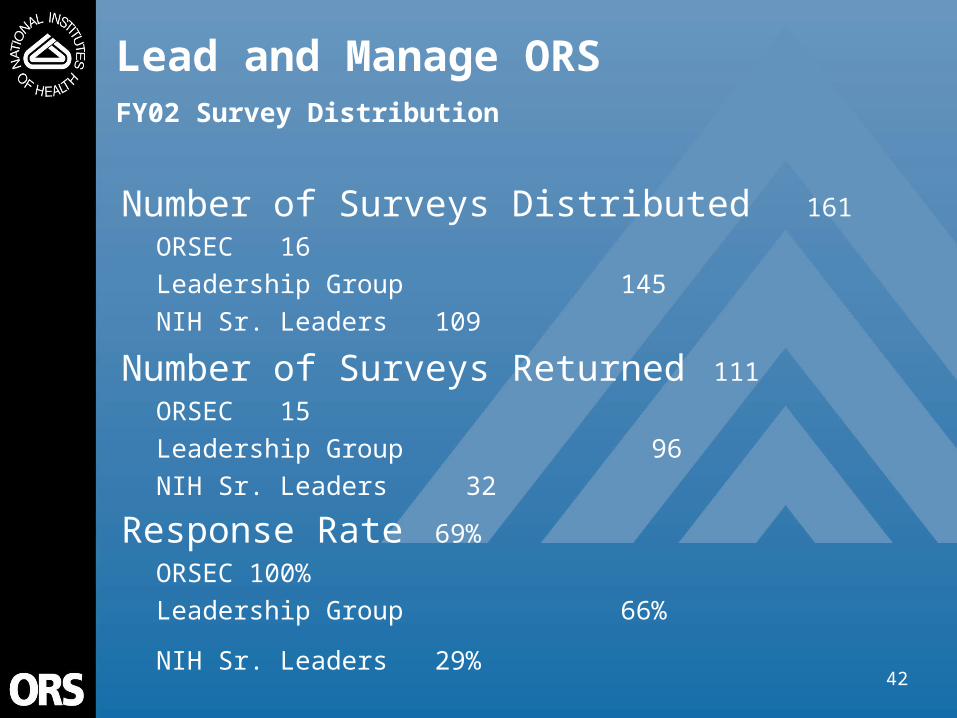
Lead and Manage ORSFY02 Survey Distribution
Number of Surveys Distributed 161
ORSEC 16
Leadership Group 145
NIH Sr. Leaders 109
Number of Surveys Returned 111
ORSEC 15
Leadership Group 96
NIH Sr. Leaders 32
Response Rate 69%
ORSEC 100%
Leadership Group 66%
NIH Sr. Leaders 29%

43
Lead and Manage ORSFY02 Customer Segmentation
Internal (ORS)
Programmatic Activities
33%
Training2%
NIH Initiatives10%
External (NIH) Programmatic
Activities15%
ORS-wide Initiatives
22%
Internal (ORS)
Staffing Issues
10%
Other8%

44
Perceptions of Decision Making FY02 Mean Ratings
4.34.2 4.2
4.34.2
3.7
3.4
2.82.9
3.9
3.6
2.5
1
2
3
4
5
I have input intoresource
allocation
I Have input intofuture direction of
ORS
I have input intoimproving ORS
I have authority tomake decisions
Programmanagers have
input intoprogram area
Programmanagers haveinput into ORS-wide initiatives
ORSEC
Leadership GroupStrongly Agree
Neither
Strongly Disagree

45
Perceptions of Decision Making FY02 Comments
• ORS needs to implement some information management strategies, processes and applications. Better communications up and down the line can lead to better decision making.
• Need to improve communication & education across the organization. Overall, the staff doesn’t have an understanding of what many of the divisions do. Had talked about tours of divisions – would be a good start. Additionally, need to solicit input from stakeholders and then move to make a decision quickly – too many things hang out there for too long. BUT, need to communicate the final decision to all appropriate parties; sometimes this loop isn’t closed making staff appear incompetent.
• Include Program level folks, aka branch chief in more information and decisions processes. Some division directors keep ORS management much too close to their chests. They prevent critical information from flowing up and down the organization. Hold leaders accountable for action and acting on decisions made. Clarify what decisions will be made by whom. Some should be executive – Steve’s, some by the senior leaders for all of ORS, some by Division directors for their organizations, some by the branch chiefs for all of ORS, some by branch chiefs for their own organizations.
• Make decisions concerning A-76 and FAIR act and not evaluate to Nth degree and hold up recruitment/promotion actions.
• What is the Process?• Seldom are the rank and file involved with decision making; getting them involved prior to
decisions been made may prove to be beneficial.
46
Perceptions of Decision Making FY02 Comments (cont.)
• Keep ORS employees apprised of important issues affecting ORS through a web newsletter and always solicit comments.
• Let employees have inputs as much as possible. This would be a more fair system in the decision making process and possibly meet the needs of both management and the customers.
• Better communication needs to be maintained. Often decisions are made which when taken at face value have no impact on this Division but when implemented in fact do. This happens because there is a general lack of understanding of the total services provided.
• Embrace diversity at all levels.• To improve the decision making process, ORS must function as a corporation. ORS must
truly understand the service groups and what they do to make proper decisions relating to all ORS services.
• Decisions should be mission-driven and rooted in delegation of authority, with more emphasis on preservation and viability of assets and less emphasis on political expediency.
• Information needs to flow down. Utilize the web more.• It seems to me that the decisions have already been made up in ORS upper management
and then they attempt to "sell" the decisions down the line, or give the rest of the ORS the illusion of having real input into the decisions.
• Transparency and accountability

47
Perceptions of Decision Making FY02 Comments (cont.)
• When making decisions consult with the individuals, who are closest to the effects or execution, of the decision. They may share potential outcomes of the final decision, that may yield better results, as opposed to decisions made by individual layers.
• Have decision making individuals understand the impact of their decisions in relation to the employees they affect. Keep employees informed and reduce time it takes to change process
• Continue in the direction you are currently heading.• Understand better the services needed and the services provided. There is a lot of talent
here and we can change to provide the most up to date service required by the occupants we serve.
• At this time I feel that I have sufficient opportunity to make decisions about the program that allow it to function and meet the needs of the ORS. My only suggestion is to continue to allow the existing structure to remain in effect since it works very well.
• Solicit more information from people before actually making a decision.• Solicit feedback from your front line people to see if the decision made is workable, before
going public with the idea.• I recommend a section on the ORS web site dedicated to posting of employee suggestions
and good ideas. Managers could periodically scan the entries not only for inspiration, but to gauge the overall attitudes of the workforce.

48
Perceptions of Decision Making FY02 Comments (cont.)
• Create the One-ORS which is not working. A lot of decisions are made "behind closed doors" and do not include everyone it should.
Improve communication, with consistent message. Limit micromanaging, actually delegate authority/responsibility. Use the "chain of command" concept. Have branch or section chiefs consult with next line
of supervision before implementing policy. Hire and promote on basis of job qualifications only.
• Good headway is being made toward providing decision making authority at the lowest possible level. Simply continue with this concept.
• When information is requested that is needed in order to make appropriate decisions, ORS needs to allow an appropriate length of time to provide the information. Too many times, the information is rushed and used out of context.

49
Perceptions of Decision Making ORSEC FY01 and FY02 Mean Ratings
44.2 4.2
4.5
3.23.4
4.34.2 4.2
4.34.2
3.7
1
2
3
4
5
I have input intoresource
allocation
I have input intofuture direction of
ORS
I have input intoimproving ORS
I have authority tomake decisions
Programmanagers have
input intoprogram area
Programmanagers haveinput into ORS-wide initiatives
FY01
FY02Strongly Agree
Neither
Strongly Disagree

50
Perceptions of Decision Making Leadership Group FY01 and FY02 Mean Ratings
3.5
2.93
4.1
3
3.33.4
2.82.9
3.9
3.6
2.5
1
2
3
4
5
I have input intoresource
allocation
I have input intofuture direction of
ORS
I have input intoimproving ORS
I have authority tomake decisions
Programmanagers have
input intoprogram area
Programmanagers haveinput into ORS-wide initiatives
FY01
FY02Strongly Agree
Neither
Strongly Disagree

51
Perceptions of Decision Making FY02 Comparison to FY01 (Mean Ratings)
4
3.5
4.3
3.4
1
2
3
4
5
ORSEC Leadership Group
FY01
FY02
Input into Resource AllocationStrongly Agree
Neither
Strongly Disagree

52
Perceptions of Decision Making FY02 Comparison to FY01 (Mean Ratings)
4.2
2.9
4.2
2.8
1
2
3
4
5
ORSEC Leadership Group
FY01
FY02
Input into Future Direction of ORSStrongly Agree
Neither
Strongly Disagree

53
Perceptions of Decision Making FY02 Comparison to FY01 (Mean Ratings)
4.2
3
4.2
2.9
1
2
3
4
5
ORSEC Leadership Group
FY01
FY02
Input into Improving ORS Business ProcessesStrongly Agree
Neither
Strongly Disagree
54
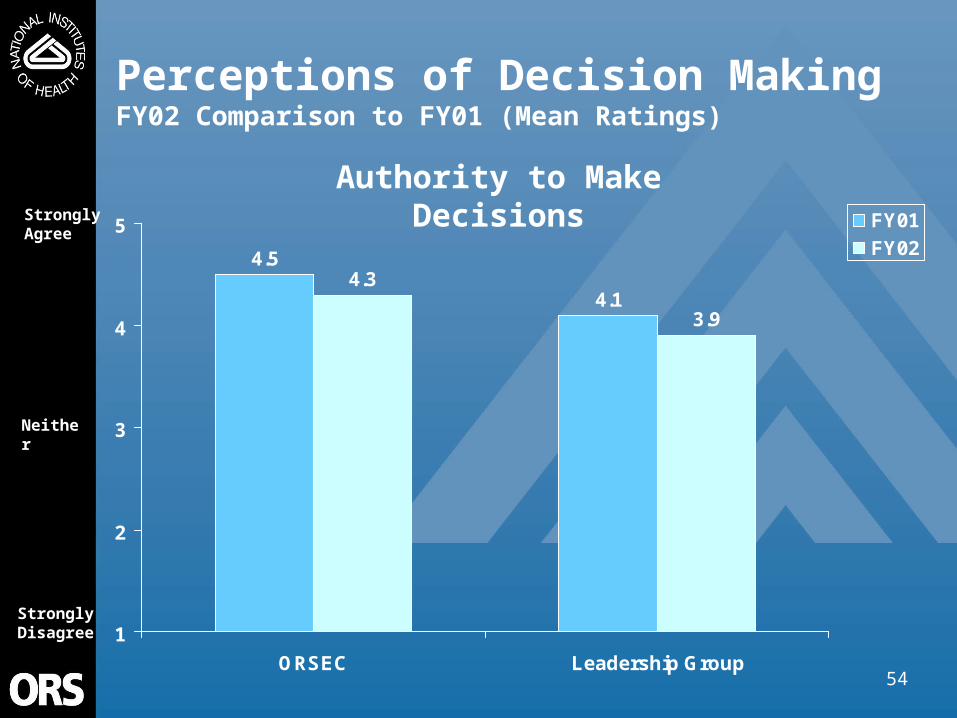
Perceptions of Decision Making FY02 Comparison to FY01 (Mean Ratings)
4.5
4.14.3
3.9
1
2
3
4
5
ORSEC Leadership Group
FY01
FY02
Authority to Make DecisionsStrongly Agree
Neither
Strongly Disagree

55
Perceptions of Decision Making FY02 Comparison to FY01 (Mean Ratings)
3.23
4.2
3.6
1
2
3
4
5
ORSEC Leadership Group
FY01
FY02
Program Manager Input into Program AreaStrongly Agree
Neither
Strongly Disagree

56
Perceptions of Decision Making FY02 Comparison to FY01 (Mean Ratings)
3.4 3.3
3.7
2.5
1
2
3
4
5
ORSEC Leadership Group
FY01
FY02
Program Manager Input into ORS InitiativesStrongly Agree
Neither
Strongly Disagree

57
Perceptions of Information AccessFY02 Mean Ratings
3.9
3.63.4
3.1
1
2
3
4
5
I have easy access toinformation
Program managers receivetimely information on
decisions faced by ORS
ORSEC
Leadership group
Strongly Agree
Neither
Strongly Disagree

58
Perceptions of Information AccessORSEC FY01 and FY02 Mean Ratings
4.2
3.4
3.9
3.6
1
2
3
4
5
I have easy access toinformation
Program managers receivetimely information on
decisions faced by ORS
FY01
FY02
Strongly Agree
Neither
Strongly Disagree

59
Perceptions of Information AccessLeadership Group FY01 and FY02 Mean Ratings
3.7
3.33.43.1
1
2
3
4
5
I have easy access toinformation
Program managers receivetimely information on
decisions faced by ORS
FY01
FY02
Strongly Agree
Neither
Strongly Disagree

60
Perceptions of Information Access FY02 Comparison to FY01 (Mean Ratings)
4.2
3.73.9
3.4
1
2
3
4
5
ORSEC Leadership Group
FY01
FY02
Easy Access to InformationStrongly Agree
Neither
Strongly Disagree
61
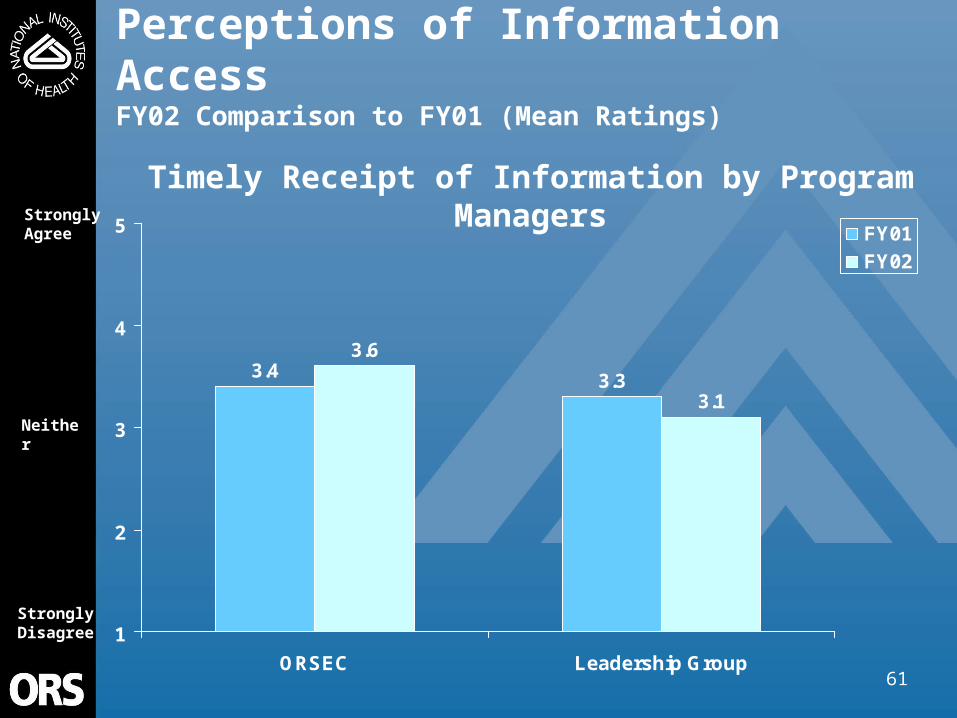
Perceptions of Information Access FY02 Comparison to FY01 (Mean Ratings)
3.4 3.3
3.6
3.1
1
2
3
4
5
ORSEC Leadership Group
FY01
FY02
Timely Receipt of Information by Program ManagersStrongly Agree
Neither
Strongly Disagree
62
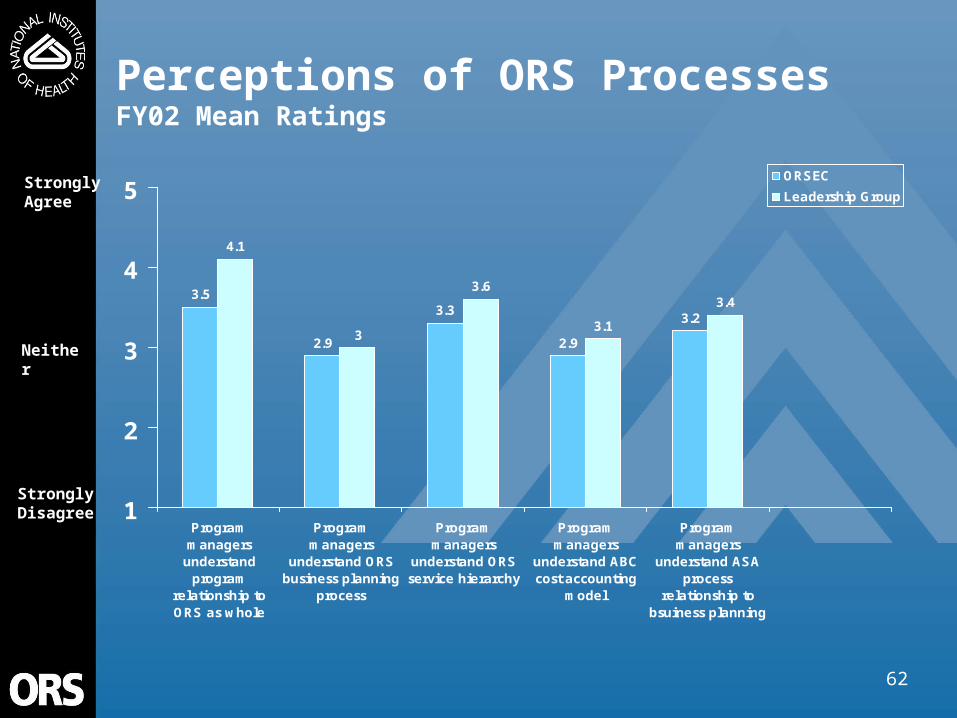
Perceptions of ORS Processes FY02 Mean Ratings
3.5
2.9
3.3
2.9
3.2
4.1
3
3.6
3.1
3.4
1
2
3
4
5
Programmanagers
understandprogram
relationship toORS as whole
Programmanagers
understand ORSbusiness planning
process
Programmanagers
understand ORSservice hierarchy
Programmanagers
understand ABCcost accounting
model
Programmanagers
understand ASAprocess
relationship tobsuiness planning
ORSEC
Leadership GroupStrongly Agree
Neither
Strongly Disagree

63
Perceptions of ORS ProcessesFY02 Comments
• I think we need to revisit the principles, concepts and structures of our business planning process because recent meetings have revealed that there is either insufficient buy-in or resistance to the current process.
• Program managers should be more involved in the actual planning of the business process, not just the execution. As with decision making, implementation of information management strategies, processes and applications and better communications can lead to better business planning.
• A business plan should be developed for every service group, and should include more than the budget. A business plan should include the ASA template (i.e., value proposition, business strategy, objectives, performance measures and targets, and operational initiatives for the coming FY) and the budget. So, it should convey what the service group is planning to accomplish (i.e., value proposition, objectives), how it is planning to accomplish it (i.e., strategy, initiatives, resource allocation), and how they will know the degree to which they were successful (i.e. performance measures, targets). We should be careful to not give the impression that the budget is the business plan.
• Internally, need to continue education of budget analysts & get them more involved in the planning cycle past just collection of data. Also, need better data collection tools (more user friendly; distinct lack of systems capability across the ORS), more intuitive structure in the model and much better reporting back to orgs (new tools & web page should help in dynamic report production and distribution …..fingers crossed). Externally, need to handle change management better. Do not have buy-in on process across ORS. Need to also improve communication in terms of feedback of changes, how the data given is utilized, and good analytical, meaningful reporting.

64
Perceptions of ORS Processes FY02 Comments (cont.)
• Financial decisions are being made less and less at the Division level. It appears that decisions are sometimes backed into rather than consulting and deciding together.
• Include front line managers in business planning process.• Please let's allow the ORS components to do their functions and service their customers
rather than spending humongous amounts of time analyzing and reporting how they are (i.e. the ASA’s).
• Suggest we ask for our budget by direct appropriation rather than by including the ICs into our management responsibilities by charging them rent.
• Listen to your own staff as to whether a new initiative is worth investing massive amounts of time.
• Make some assessment of which offices are best candidates for ASA and not apply across the board. Some functions just do not lend themselves to ASA practices.
• I do not believe that the ASA is cost-effective, nor does it result in improved products/services. At least in our case, we didn't find out anything we didn't already know. For years we have had an ongoing improvement program--one that makes sense.
• What is the Process?• Explain it to your providers in its simplest form before you sell it to your customers. An
educated provider can help sell your plan in a most excellent way. An educated provider is like having a full tank of gasoline in your car; it will take you a long way.

65
Perceptions of ORS Processes FY02 Comments (cont.)
• The program data and information required to fulfill business planning requirements must exist and be available. Making guesses, developing data and creating databases is a time consuming and oftentimes unproductive exercise.
• Hire more Budget analysts. Too few and they are too busy. I wasn't able to get much help on IAG's or get simple questions answered.
• Better understanding of what the customer is asking for and whether or not that is the most appropriate response to provide. More focus is needed on how the customer perceives the ORS response.
• I truly believe in the ASA project and its goals. It seems very tedious and demanding but everything good has its price. However, I have heard many people complain about the negative impact that this project has at this time of the year.
• The ASA is a good tool for business planning and monitoring. However, my experience with the ASA process this year wasn't pleasant. Direction from upper management and the facilitators appeared to be confused and inconsistent.
• Again ORS, as part of the business planning process, must have a better understanding of the ORS customer services to make good business planning decisions.
• ORS should receive all maintenance and operations funds from direct congressional appropriations to the NIH Director and eliminate the taps to IC. This may help to ease the IC out of co-management of ORS responsibilities.
• The ability to add, modify and inactivate services hierarchy information in OROS and ASA needs to be developed and de-conflicted.
66
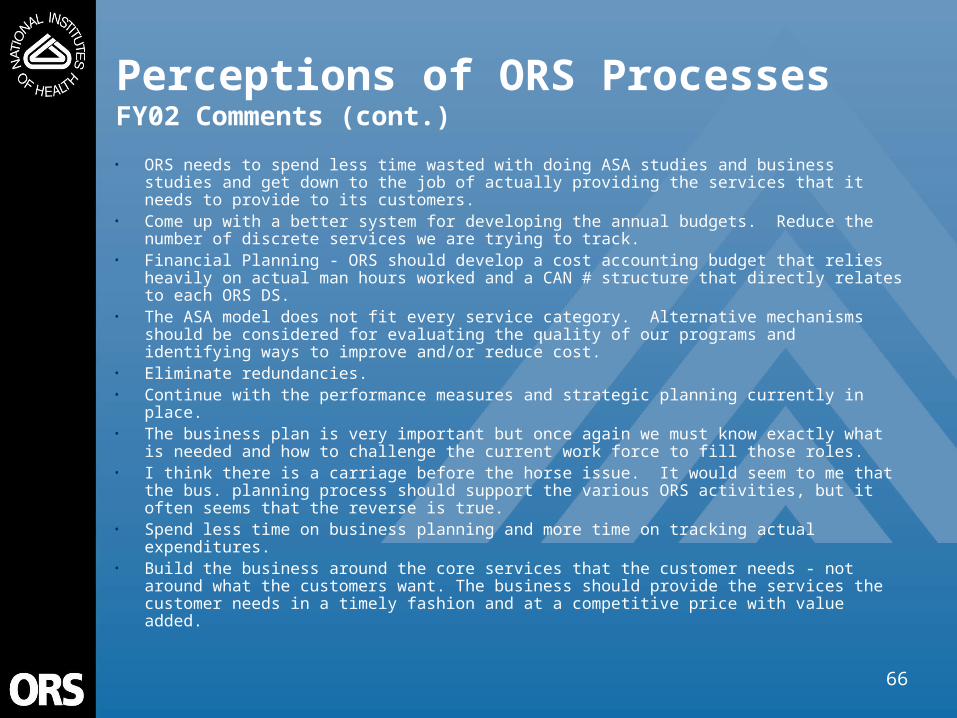
Perceptions of ORS Processes FY02 Comments (cont.)
• ORS needs to spend less time wasted with doing ASA studies and business studies and get down to the job of actually providing the services that it needs to provide to its customers.
• Come up with a better system for developing the annual budgets. Reduce the number of discrete services we are trying to track.
• Financial Planning - ORS should develop a cost accounting budget that relies heavily on actual man hours worked and a CAN # structure that directly relates to each ORS DS.
• The ASA model does not fit every service category. Alternative mechanisms should be considered for evaluating the quality of our programs and identifying ways to improve and/or reduce cost.
• Eliminate redundancies.• Continue with the performance measures and strategic planning currently in place.• The business plan is very important but once again we must know exactly what is needed
and how to challenge the current work force to fill those roles.• I think there is a carriage before the horse issue. It would seem to me that the bus.
planning process should support the various ORS activities, but it often seems that the reverse is true.
• Spend less time on business planning and more time on tracking actual expenditures.• Build the business around the core services that the customer needs - not around what the
customers want. The business should provide the services the customer needs in a timely fashion and at a competitive price with value added.

67
Perceptions of ORS Processes FY02 Comments (cont.)
• MAPB would be better equipped to develop business strategy if its previous and current market share could be ascertained. Please provide financial reports for FY01 and FY02 representing the total market within NIH for products and services.
• Get the OQM and the OBSF to work together. It is very frustrating to have one office tell you it is not their problem, go talk to the other, and then the other says it is not theirs either. Quit giving us such short deadlines.
• Less meetings and more substance. We have had 3 different consultants, none of which was prepared.
• Clarify the role of ASA process, and how it will be used in ORS' decision making processes. Rework the ASA process as a collaboration between ORS and its offices and divisions, as opposed to a top down directive w/ no allowance for feedback from below.
• Get more individuals with diverse backgrounds and experience-sets involved in the process. Through a broader-based concept, new initiatives may emerge that could help streamline and improve the way we do business.
• Provide consistent information and focus on finding solutions rather than finger pointing. A good example of this is the ASA process. The information provided by the training is not consistent with the follow on information provided by OQM and consultant.
• I believe the ASAs are driving people buggy. I know that there is a timetable but the schedule is aggressive and not all areas can finish on schedule. It's very difficult to conduct business as usual when you have multiple tasks and not enough resources, something will fall short.

68
Perceptions of ORS ProcessesFY02 Comments (cont.)
• I think the ASA exercise can be a wonderful tool for describing, modifying, and justifying our current processes and organization, or designing new ones. I feel that perhaps too much pressure has been placed on the presentations.
• While it is "nice" to think of ORS as a "business" the extension of many of the business practices do not apply to a government activity. Lets stop studying ORS and its components to death.
• The ASA process should be a tool for the manager to improve his/her organization and should not be driven by the budget folks.
• ASA Process: In addition to the consultants, OQM staff, what is the indirect cost (e.g.; ORS staff hrs. of non-OQM) used to produce this?
• The ASAs are forced down our throat without any buy-in from those of us who have to perform them. If the ORS wanted them to go successfully and smoothly, then the OQM needed to meet and talk with the service areas and find out what they needed and wanted.
• Consider how all time consuming evaluations can be utilized if ORS is totally "restructured" through de-layering and A-76?
• Do ASAs, etc. really improve ORS and ORS services? Are they busy work? How are they translated to rank and file?
•

69
Perceptions of Resources FY02 Mean Ratings
3.2 3.3
1
2
3
4
5
Program managers receivedneeded resources
ORSEC
Leadership groupStrongly Agree
Neither
Strongly Disagree

70
Perceptions of ResourcesFY02 Comments
• Affected mostly by the increased spending on security in FY 2002 that adversely impacted the levels of resources available for other business activities.

71
Other PerceptionsFY02 Comments
• We (EC) should spend most of our time between managing service performance at the service group level and proactively managing the ORS (e.g., improving its management infrastructure – performance management systems, finance, human capital). Currently, it looks to me like we are managing crises on an on-going basis. Crises will always happen and they must be addressed effectively, but they shouldn’t keep us from managing operations and the future of the ORS business.
• The EC works well, though occasionally it appears to be little more than a rubber stamp that needs to be worked on.
• Remember that we are here to protect NIH as an asset for the future as well to service the ICs.
• I sure do, stop using double talk in these surveys. Start listening to your employees, and follow up on the listening. Many examples of employees request are ignored. I have proof that survey data is not fully analyzed by OQM.
• Get the Personnel Office to service our needs.• Requiring all ORS employees to complete Customer Service training cannot possibly be
cost-effective. My group's customer service feedback has been overwhelmingly positive. Why don't you target people and programs that have had problems in that area?
• Encourage better communication between service provider and the customers and allow more meaningful surveys rather than a global one that may not be applicable to some service groups.

72
Other Perceptions FY02 Comments (cont.)
• View program areas as your customers. Ask "What can I provide of value to you”• Work to change policies and regulations that impact favorably on program initiatives.• The leadership and management of ORS is performed with an extremely high level of
professionalism, insight and dedication. Over the past few years I have come to understand more about the difficulty of this task and to appreciate how fortunate we all are to have such excellent leadership.
• ORS should have a central scheduling function with information on projects and operational activities (e.g., construction, environmental or building inspections, changes in traffic patterns, changes in access to the campus, parking resurface, moves of large number of people) that may impact the research, maintenance, operation and administration activities on campus. The purpose of this function would be to improve inter service coordination to minimize the disruption or inconvenience to researches and other service providers.
• Thanks for the opportunity to comment.• It's always a surprise how ORS management are continually changing evaluation programs
over the years. Is this to assure our continued confusion? This is 6th survey completed for the ASA by this customer.
• I believe it will be very difficult for the Executive Committee to respond effectively or innovatively to the requirement for de-layering or reorganizing ORS. They will be affected so personally by the final outcome they will find it difficult.

73
Other Perceptions FY02 Comments (cont.)
• Filling vacancies takes forever. In the meantime we overload existing staff. By the time we hire someone, existing staff has burned out and leave, and we are back to square 1. Review of manuscripts/publications also takes way too long, e.g., 2 months.
• I feel fortunate to work in an ORS Division that provides resources and support, however, I don't think all Divisions work this way. We have a ways to go with one ORS.
• The Overtime $ ceiling with alternative Comp. Time solution is counter-productive in terms of keeping staff available to provide business services and products.
• We are all so busy, so pushed for time, and work is strictly work and no time to get to know people outside of your immediate area. What happened to social functions in ORS?
• We must keep in mind that ORS work is often driven by the needs and desires of the customer yet at the same time we are required to maintain certain requirements which may be counter to the customers’ need.
• ORS needs to understand that the people at lower levels were hired for their expertise and do know how to do their jobs and all the upper level management’s micromanaging needs to stop.
• The ORS web site is poorly designed.• Our contractor chronically has difficulty getting invoices paid due to a dysfunctional
Acquisition Management Branch.
• Our organization has benefited greatly by ORS management and has made good headway in improving operations and reputation in comparison to our previous management
organization.

74
Other Perceptions FY02 Comments (cont.)
• Please keep all employees informed of the A-76 process. Employee morale dropped 100%. I know ORS will do everything they can to be sure the process is fair to the government employee.
• I think that ORS senior management needs to be aware of and address lower echelon concerns. For example, what does the "de-layering" issue mean to individuals who are currently first line supervisors?
• Don't make the awards process so complicated, with lengthy applications that deter a supervisor from the initiative in the first place. Also, get the Division level out of the process for granting awards at the local (Branch) level.
• Incompetence is rampant within ORS.• Get everyone in ORS onboard with change initiatives to improve our performance across
the board.• The ORS-IC Occupancy Agreement is poorly designed, and falls short of good customer
service. Our customers require more than a warm, dry, lighted shell. Our customers need quick response to their needs, and solutions to their problems.
• Concerning the proposed restructuring of ORS, the position of MAPB should be reconsidered for the following reasons. MAPB is involved with many high profile projects across the NIH. As currently depicted in the proposed reorganization, MAPB is buried.

75
Other Perceptions FY02 Comments (cont.)
• Stress "Teamwork" and the "One ORS/NIH" Concept and define expectations and how we are all accountable for this. This could go as far as including a "Teamwork Element" in each person’s Performance Plan. This is crucial to our success as an organization.
• More effort needs to be made in understanding specifically the day to day role of the lower level managers and the service they provide to the customers.

76
ConclusionsCustomer Segmentation
• About 65% of ORSEC time spent on ORS activities.
• About 15% of ORSEC time spent on issues external to NIH.
• Only 1% of ORSEC time spent on professional enrichment and formal training.
• The “Other” category comprises about 8% of ORSEC time and includes• collaborative research• journal editing• miscellaneous meetings
77
ConclusionsPerceptions of Decision Making
• Executive Committee members believe they have input into, and the authority to make, decisions concerning ORS.
• Leadership Group members believe they have input into decisions involving their own program areas and the authority to make them.
Leadership Group members rate their input lower - especially for decisions on future direction of ORS, on improving ORS, and on ORS-wide initiatives.
• Leadership Group members believe they have input into decisions involving their own program areas and the authority to make them.

78
ConclusionsPerceptions of Decision Making (cont.)
• In almost all cases, FY02 ratings are about the same as FY01 ratings.
• One exception is program manager input into decisions affecting their own program areas. Mean ratings for both Executive Committee members and Leadership Group members are considerably higher in FY02.
• Another exception is Leadership Group input on ORS-wide initiatives. Members perceive they have considerably less input into decisions on ORS-wide initiatives.

79
ConclusionsPerceptions of Information Access
• Executive Committee members believe they have easy access to the information they need and that program managers receive timely information.
• Leadership Group members rate both their access to information and the timeliness of the information slightly lower than Executive Committee members.
• FY02 ratings are about the same or slightly lower than FY01 ratings.

80
ConclusionsPerceptions of ORS Processes
• In all cases, Leadership Group member ratings of program manager understanding of ORS processes are slightly higher than Executive Committee member ratings.
• Most of the ratings hover around the midpoint of the scale indicating there is room for improvement - especially in the areas of business planning and the ABC cost accounting model.

81
ConclusionsPerceptions of ORS Processes (cont.)
• One exception is that Leadership Group members believe program managers understand their program’s relationship to ORS as a whole.
• Ratings on these questions vary widely which indicates that respondents have very different perceptions on program manager understanding.
82
ConclusionsPerceptions of Resources
• Both Executive Committee and Leadership Group member ratings hover near the midpoint of the scale indicating that not all program managers received needed resources to meet customer service level expectations.

83
Appendix
FY02 Individual Question Results

84
Q1: Input into Resource Allocation Decisions FY02 Response Breakout
0%
13%
87%
0%
26%
11%
58%
5%
0%
25%
50%
75%
100%
StronglyDisagree,Disagree
Neither Agree NorDisagree
Strongly Agree,Agree
Don't Know
ORSEC
Leadership group

85
Q2: Input into Future Direction of ORS FY02 Response Breakout
7% 7%
87%
0%
49%
15%
30%
6%
0%
25%
50%
75%
100%
StronglyDisagree,Disagree
Neither Agree NorDisagree
Strongly Agree,Agree
Don't Know
ORSEC
Leadership group

86
Q3: Input into Improving ORS FY02 Response Breakout
7% 7%
87%
0%
38%
17%
40%
5%
0%
25%
50%
75%
100%
StronglyDisagree,Disagree
Neither Agree NorDisagree
Strongly Agree,Agree
Don't Know
ORSEC
Leadership group
87
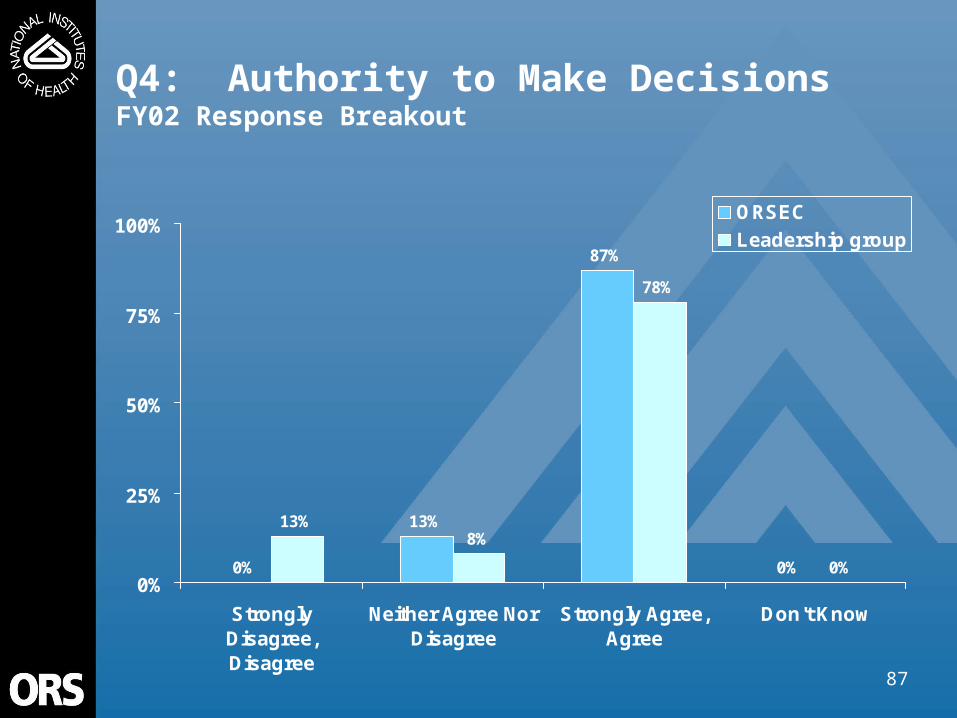
Q4: Authority to Make DecisionsFY02 Response Breakout
0%
13%
87%
0%
13%8%
78%
0%0%
25%
50%
75%
100%
StronglyDisagree,Disagree
Neither Agree NorDisagree
Strongly Agree,Agree
Don't Know
ORSEC
Leadership group

88
Q5: Easy Access to InformationFY02 Response Breakout
7%13%
80%
0%
25%
18%
55%
1%0%
25%
50%
75%
100%
StronglyDisagree,Disagree
Neither Agree NorDisagree
Strongly Agree,Agree
Don't Know
ORSEC
Leadership group
89
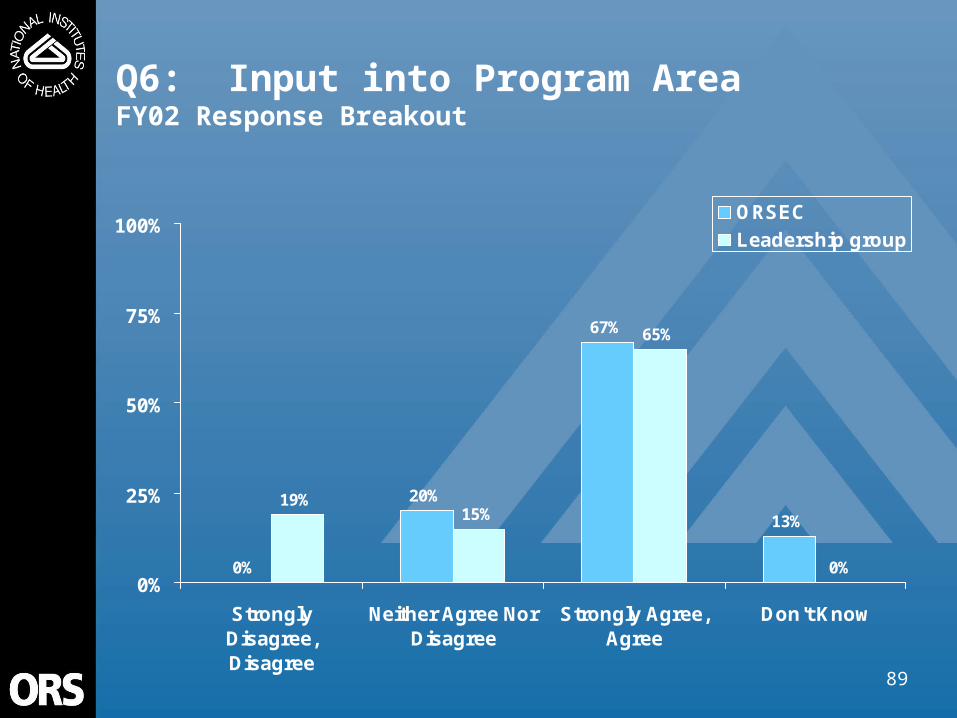
Q6: Input into Program AreaFY02 Response Breakout
0%
20%
67%
13%19%
15%
65%
0%0%
25%
50%
75%
100%
StronglyDisagree,Disagree
Neither Agree NorDisagree
Strongly Agree,Agree
Don't Know
ORSEC
Leadership group

90
Q7: Input into ORS InitiativesFY02 Response Breakout
7%
33%
60%
0%
51%
28%
18%
4%
0%
25%
50%
75%
100%
StronglyDisagree,Disagree
Neither Agree NorDisagree
Strongly Agree,Agree
Don't Know
ORSEC
Leadership group

91
Q8: Timely Receipt of InformationFY02 Response Breakout
7%
33%
60%
0%
35%
18%
46%
1%0%
25%
50%
75%
100%
StronglyDisagree,Disagree
Neither Agree NorDisagree
Strongly Agree,Agree
Don't Know
ORSEC
Leadership group

92
Q9: Understand Program Relationship to ORS as a WholeFY02 Response Breakout
27%
7%
67%
0%6%
12%
81%
1%0%
25%
50%
75%
100%
StronglyDisagree,Disagree
Neither Agree NorDisagree
Strongly Agree,Agree
Don't Know
ORSEC
Leadership group

93
Q10: Understand ORS Business Planning ProcessFY02 Response Breakout
40%
33%27%
0%
35% 33% 31%
1%0%
25%
50%
75%
100%
StronglyDisagree,Disagree
Neither Agree NorDisagree
Strongly Agree,Agree
Don't Know
ORSEC
Leadership group

94
Q10: Understand ORS Business Planning ProcessFY02 Response Breakout
40%
33%27%
0%
35% 33% 31%
1%0%
25%
50%
75%
100%
StronglyDisagree,Disagree
Neither Agree NorDisagree
Strongly Agree,Agree
Don't Know
ORSEC
Leadership group

95
Q11: Understand ORS Service HierarchyFY02 Response Breakout
20%
27%
53%
0%
14%
22%
64%
0%0%
25%
50%
75%
100%
StronglyDisagree,Disagree
Neither Agree NorDisagree
Strongly Agree,Agree
Don't Know
ORSEC
Leadership group

96
Q12: Understand ABC Cost Accounting ModelFY02 Response Breakout
40%
33%27%
0%
32%28%
39%
1%0%
25%
50%
75%
100%
StronglyDisagree,Disagree
Neither Agree NorDisagree
Strongly Agree,Agree
Don't Know
ORSEC
Leadership group

97
Q13: Understand ASA Relationship to Business PlanningFY02 Response Breakout
20%
40%
33%
7%
26%21%
52%
0%0%
25%
50%
75%
100%
StronglyDisagree,Disagree
Neither Agree NorDisagree
Strongly Agree,Agree
Don't Know
ORSEC
Leadership group

98
Q14: Received Needed ResourcesFY02 Response Breakout
43%
21%
36%
0%
28%
20%
51%
1%0%
25%
50%
75%
100%
StronglyDisagree,Disagree
Neither Agree NorDisagree
Strongly Agree,Agree
Don't Know
ORSEC
Leadership group

99
Appendix
FY02 Training Detail

100
Lead and Manage ORSFY02 Formal Training
Formal Training HoursABC CAM-1 Summit Conference 24IT Acquisition for the CIO 40Driving Organizational Performance: Harvard University JFK School of Govt. 24Real Estate Leasing Principles 40GPRA Overview 8Measuring Results of Organizational Performance 40President's Management Agenda Workshop 16Real Estate Costing 40Real Estate Law 40Facility Accessibility Training 16Financial Management Training 8Project Delivery Strategy 6Miscellaneous Seminars 8Total 310
Note: Formal Training accounts for about 1% of ORSEC members’ time.