Embed Size (px)
Citation preview

1
FY2001 CENTER SOFTWARE INITIATIVE PROPOSAL (CSIP)for the
NASA Independent Verification and Validation Facility COTR: Kenneth McGillPI: Nancy EickelmannContract #S-54493-G
September 4, 2002
Developing Risk-Based Financial Analysis Tools and Techniques to Aid IV&V Decision-
Making

2
Agenda
• Why we need ASK IVEY
• Consequences and Likelihood of Failure
• IV&V Yield
• Probability of IV&V Yield: Min, Max, Most Likely
• ROI and Magnitude of Return of IV&V
• What ASK IVEY can do

3
Why we need ASK IVEY
• NASA program managers are asked to quantify the ROI and evaluate the cost/benefit of applying IV&V technologies.
• This is a prediction of future events based on decisions and actions taken in the present.
• A point estimate is likely to be inaccurate, whereas a probability of yield has a history of providing a scope of potential yield and an extent of likelihood of expected yield.

4
Calculating ROI a Financial Analysis Prompt Map
Yes1 A
Financial Analysis Process Map
Create developmentcost framework:
Total CostCOQCOPQ
?
IV&V and IA analysis complete.Level of IV&V or IA designated
Create certificationcost framework
2 3
Apply Financial models formonetary quanitification
Create probabilityof yield structure
4A STOP
STOPNo
5
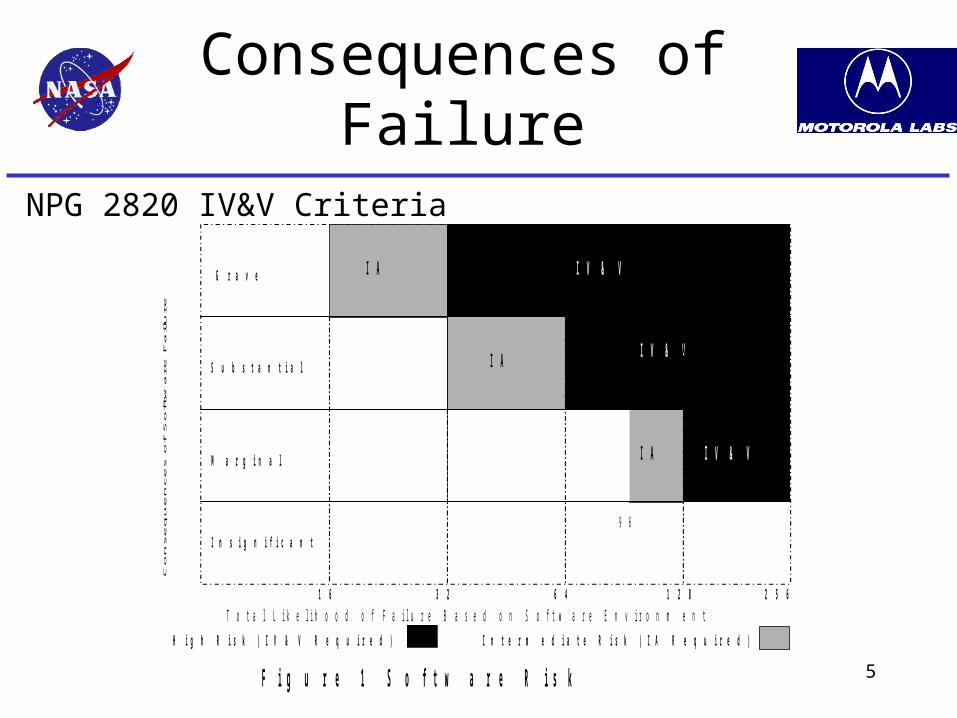
Consequences of Failure
Co
nse
qu
en
ces
of
So
ftw
are
Fa
ilure
S u b s t a n t i a l
H i g h R i s k ( I V & V R e q u i r e d ) I n t e r m e d i a t e R i s k ( I A R e q u i r e d )
F i g u r e 1 S o f t w a r e R i s k
1 6 3 2 6 4 1 2 8 2 5 6
I V & V
I V & V
I V & V
I n s i g n i fi c a n t
M a r g i n a l
I A
I A
I A
9 6
T o t a l L i k e l i h o o d o f F a i l u r e B a s e d o n S o f t w a r e E n v i r o n m e n t
I A G r a v e
NPG 2820 IV&V Criteria

6
Likelihood of Failure
Factors contributing to probability of software failure
Weighting Factor
Likely- hood of failure rating
1 2 4 8 16Software team complexity
Up to 5 people at one location
Up to 10 people at one location
Up to 20 people at one location or 10 people with external support
Up to 50 people at one location or 20 people with external support
More than 50 people at one location or 20 people with external support
X2
Contractor Support
None Contractor with minor tasks
Contractor with major tasks
Contractor with major tasks critical to project success
X2
Organization Complexity*
One location Two locations but same reporting chain
Multiple locations but same reporting chain
Multiple providers with prime sub relationship
Multiple providers with associate relationship
X1
Schedule Pressure**
No deadline Deadline is negotiable
Non-negotiable deadline
X2
Process Maturity of Software Provider
Independent assessment of Capability Maturity Model (CMM) Level 4, 5
Independent assessment of CMM Level 3
Independent assessment of CMM Level 2
CMM Level 1 with record of repeated mission success
CMM Level 1 or equivalent
X2
Degree of Innovation
Proven and accepted
Proven but new to the development organization
Cutting edge X1
Level of Integration
Simple - Stand alone
Extensive Integration Required
X2
Requirement Maturity
Well defined objectives - No unknowns
Well defined objectives - Few unknowns
Preliminary objectives
Changing, ambiguous, or untestable objectives
X2
Software Lines of Code***
Less than 50K Over 500K Over 1000K X2
Total
Un-weighted probability of failure score
Table 1 Likelihood of Failures Based on Software Environment

7
IV&V YIELD
• Ultimately, the yield of an IV&V program is based upon the difference between the net resource flow with IV&V and without IV&V.
• If the resources saved (e.g., reduced rework) or returns gained (e.g., improved customer satisfaction or increased safety) are greater than the resources consumed to save/gain these resources, we have a net benefit.
• Should the resources saved be less than the resources consumed, we
have a net cost.

8
Cost of Poor Quality
• Defect Leakage– If discovered internally
• defect management• rework• retesting
– If discovered externally• technical support• complaint investigation• defect notification
9
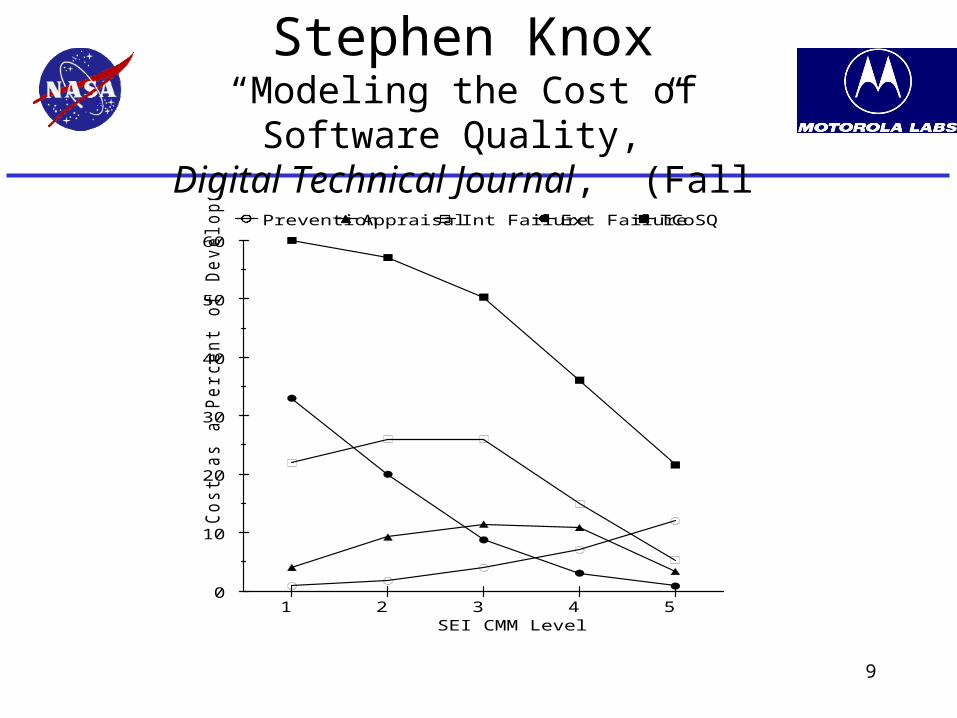
Stephen Knox“Modeling the Cost of Software
Quality,”Digital Technical Journal, (Fall
1993)
0
10
20
30
40
50
60
Co
st a
s a
Pe
rce
nt o
f D
eve
lop
me
nt
1 2 3 4 5 SEI CMM Level
Prevention Appraisal Int Failure Ext Failure TCoSQ

10
Raytheon Cost of Poor Quality
Haley and Dion
0
10
20
30
40
50
60
70
Pe
rce
nta
ge
of to
tal p
roje
ct co
st
Year
CMM level 3Start of intiative CMM level 1
TCoSQ
PreventionRework
Appraisal
Cost ofConformance
Rework
87 88 89 90 91 92 93 94 95 96

11
How Process Maturity Levels Affect IV&V
LEVEL 1INITIAL
UNPREDICTABLE &POORLY CONTROLLED
LEVEL 2REPEATABLE
CAN REPEAT PREVIOUSLY
MASTERED TASKS
LEVEL 3DEFINED
PROCESSCHARACTERIZED,
FAIRLY WELLUNDERSTOOD
LEVEL 4MANAGED
PROCESS MEASUREDAND CONTROLLED
LEVEL 5OPTIMIZED
FOCUS ON PROCESSIMPROVEMENT
KEY PROBLEMS:•CONFIG. MGMT.•PROJECT MGMT.•SOFTWARE QA•PROJECT PLANNING•EASTIMATING•COST•SCHEDULE
KEY PROBLEMS:
•PROPER TRAINING
•DEVELOPMENT OF PRACTICE & PROCEDURES
•STANDARDS
•ORGANIZATION
KEY PROBLEMS:
•ACCURATE PROJECT MEASUREMENT
•OBJECTIVE PROCESS ANALYSIS
•QUANTITATIVE QUALITY PLANS
•PRIORITIES:
- DECIDING WHAT TO IMPROVE FIRST
- BALANCING THE PROCESS AND THE ORGANIZATION
KEY PROBLEMS:
•CHANGING TECHNOLOGY
•PROBLEM ANALYSIS
•PROBLEM PREVENTION
•ORGANIZATIONAL OPTIMIZATION
KEY PROBLEMS:
•STILL HUMAN INTENSIVE PROCESS
•DIFFICULT TO MAINTAIN OPTIMUM ORGANIZATION
•DIFFICULT TO MAINTAIN TOOLS & PRACTICES AT STATE OF THE ART
IV&VSOMEWHAT
UNPREDICTABLE
UNABLE TO ESTIMATE
NON-TECH %
IV&V
IV&V
IV&V
IV&V
NON-TECH UP TO 25%
NON-TECH UP TO 15%
NON-TECH UP TO 6-8%
NON-TECH UP TO 3-4%
MATURITY
12
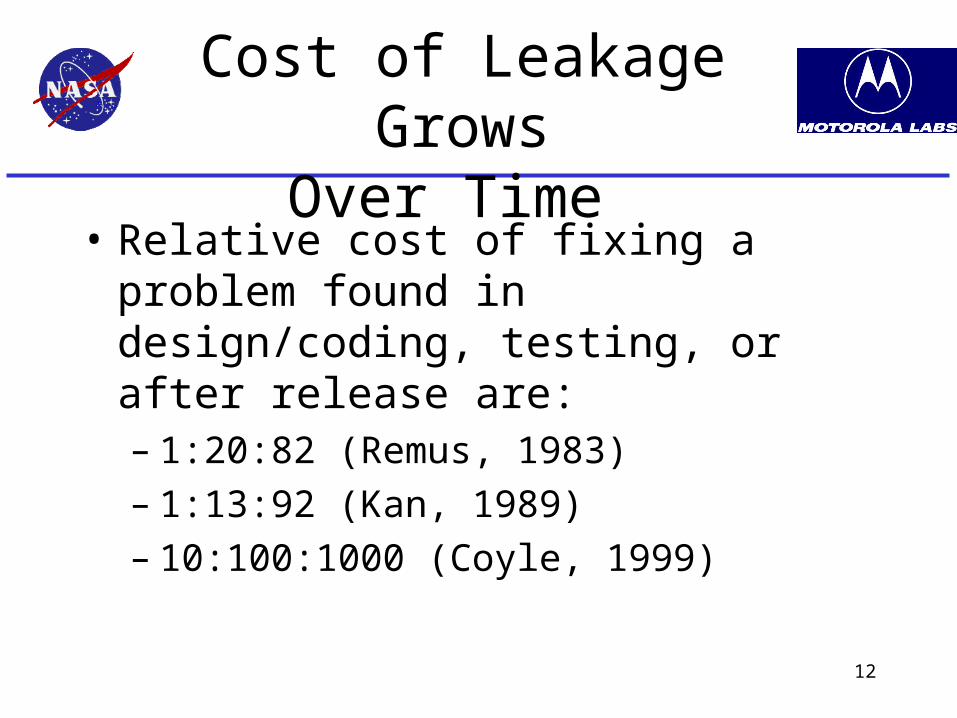
Cost of Leakage GrowsOver Time
• Relative cost of fixing a problem found in design/coding, testing, or after release are:– 1:20:82 (Remus, 1983)– 1:13:92 (Kan, 1989)– 10:100:1000 (Coyle, 1999)
13
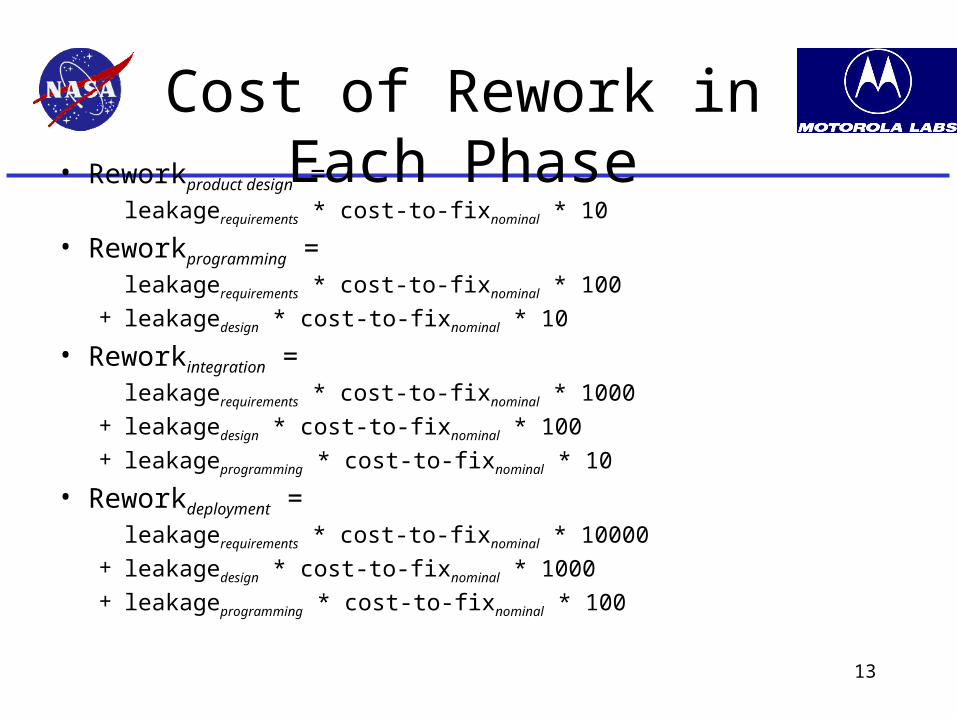
Cost of Rework in Each Phase• Reworkproduct design =
leakagerequirements * cost-to-fixnominal * 10
• Reworkprogramming = leakagerequirements * cost-to-fixnominal * 100+ leakagedesign * cost-to-fixnominal * 10
• Reworkintegration = leakagerequirements * cost-to-fixnominal * 1000+ leakagedesign * cost-to-fixnominal * 100+ leakageprogramming * cost-to-fixnominal * 10
• Reworkdeployment = leakagerequirements * cost-to-fixnominal * 10000+ leakagedesign * cost-to-fixnominal * 1000+ leakageprogramming * cost-to-fixnominal * 100
14
Rework at Deployment
• Tremendous cost
• rework plus– product recall– technical support– field visits– cost factor may be over 10,000

15
Leakage: An Example• Reworkproduct design =
49r * cost-to-fixnominal * 10 = 490
• Reworkprogramming = 39r * cost-to-fixnominal * 100 = 3,900+ 113d * cost-to-fixnominal * 10 = 1,130
• Reworkintegration = 26r * cost-to-fixnominal * 1000 = 26,000+ 49d * cost-to-fixnominal * 100 = 4,900+ 418p * cost-to-fixnominal * 10 = 4,180
• Reworkdeployment = 8r * cost-to-fixnominal * 10000 = 80,000+ 16d * cost-to-fixnominal * 1000 = 16,000+ 56p * cost-to-fixnominal * 100 = 5,600 142,200

16
CMM Maturity and Leakage
• There is some evidence to suggest organizations with increased maturity have reduced rework costs
• Knox: Percent of Budget to Rework:– Level 1: 55%
– Level 2: 45%
– Level 3: 35%
– Level 4: 20%
– Level 5: 6%

17
IV&V and Defect Leakage
• Application of IV&V can reduce leakage to subsequent phases
• The goal of the financial model is to propose a range of potential savings
• Specific parameters will need to be established empirically

18
Timing of benefits for IV&V
• Full In-Phase IV&V– prevention of errors starting at requirements - can
potentially bar any errors from leaking through
• Partial IV&V– prevention of errors at point of insertion - no errors from
this phase will leak
• Endgame IV&V– discovery of errors at the end of development - can
potentially bar any errors from leaking to deployment
• Audit Level IV&V
19
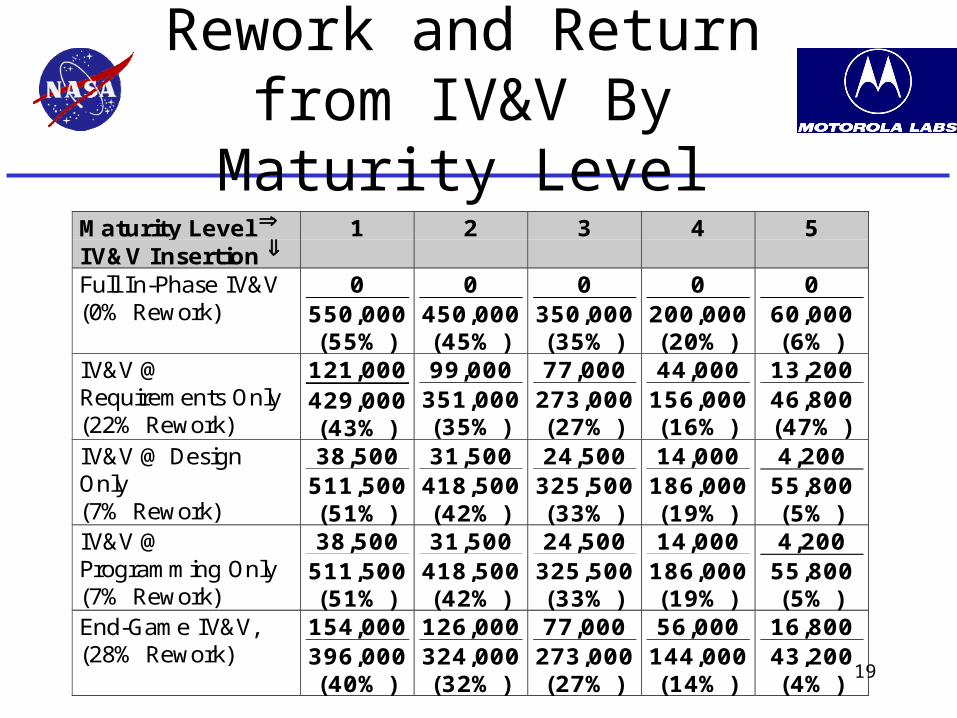
Rework and Return from IV&V By Maturity Level
Maturity Level IV&V Insertion
1 2 3 4 5
Full In-Phase IV&V(0% Rework)
0550,000(55% )
0450,000(45% )
0350,000(35% )
0200,000(20% )
060,000(6% )
IV&V @Requirements Only(22% Rework)
121,000429,000(43% )
99,000351,000(35% )
77,000273,000(27% )
44,000156,000(16% )
13,20046,800(47% )
IV&V @ DesignOnly(7% Rework)
38,500511,500(51% )
31,500418,500(42% )
24,500325,500(33% )
14,000186,000(19% )
4,20055,800(5% )
IV&V @Programming Only(7% Rework)
38,500511,500(51% )
31,500418,500(42% )
24,500325,500(33% )
14,000186,000(19% )
4,20055,800(5% )
End-Game IV&V,(28% Rework)
154,000396,000(40% )
126,000324,000(32% )
77,000273,000(27% )
56,000144,000(14% )
16,80043,200(4% )

20
Components to Return on Investment
• Cost of IV&V
• Expected Return– cost savings - measured as hours of rework
• Likelihood of Returns– how effective is the organization at minimizing
rework?– how effective will IV&V be?
21
Independence…
• An organization independent from the developers study the artifacts of software production [IEEE Std. 1012-1998].
• This requires:- Technical independence. Members of the IV&V team may not be
personnel involved in the development of the software. - .Managerial independence. The responsibility for IV&V belongs to
an organization outside the contractor and program organizations that develop the software.
- Financial independence. Control of the IV&V budget is retained in an organization outside the contractor and program organization that develop the software.
• IV&V is often perceived as testing the code after the development is completed …..NASA IV&V is full life cycle activities
22
IV&V is NOT SQA
• IV&V is a full life cycle set of acivities that are applied to defect prevention, defect detection, and certification. NASA IV&V conforms to IEEE Standard 1012-1998.
• IV&V and Software Quality Assurance (SQA) are not redundant activities. SQA as defined by DOD-Std 2168 defines 10 activities of SQA that are complemented by IV&V activities. There are 32 types of activities conducted by IV&V, of these 32, 22 are unique to IV&V and 10 are complemented by SQA.

23
Ask Ivey Prototype
What ASK IVEY can do…

24
Ask Ivey Input Screen

25
Ask Ivey Pull Down Menu

26
Ask Ivey Numeric Entry

27
Ask Ivey On-Line Report

28
Ask Ivey Printed Report

29
Ask Ivey On-Line Help
30
Questions?
Ask Ivey…