Embed Size (px)
Citation preview
1
Governace Crossroads: An Empirical Perspective
Daniel Kaufmann
www.worldbank.org/wbi/governance
Background Slides. It draws from the Chapter in WEF’s GCR 2002-2003 (forthcoming)
2
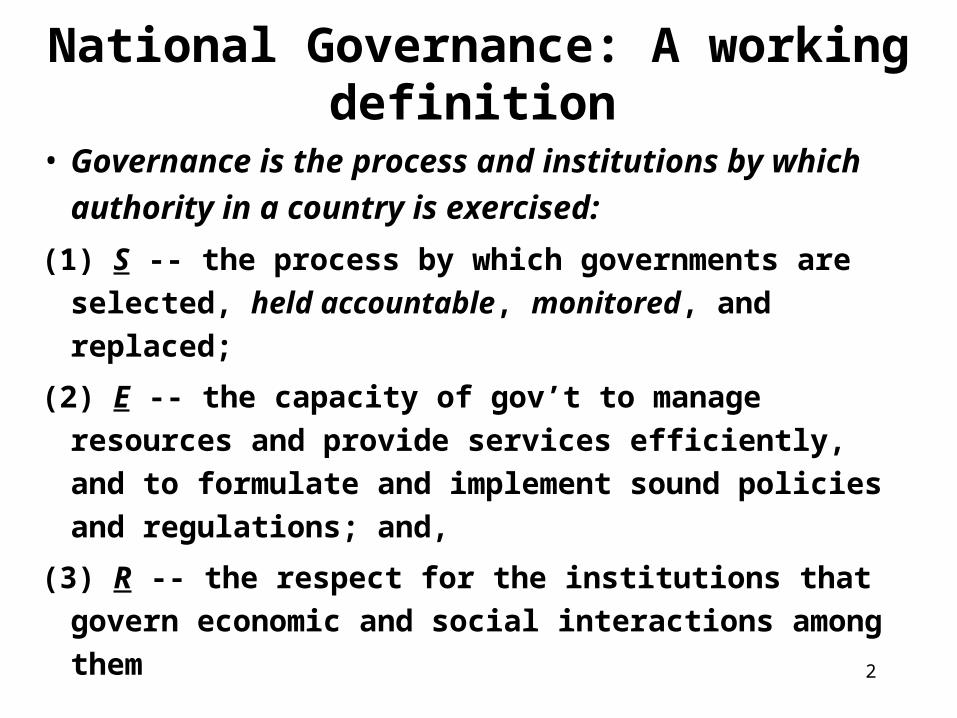
National Governance: A working definition
• Governance is the process and institutions by
which authority in a country is exercised:
(1) S -- the process by which governments are selected,
held accountable, monitored, and replaced;
(2) E -- the capacity of gov’t to manage resources and
provide services efficiently, and to formulate and
implement sound policies and regulations; and,
(3) R -- the respect for the institutions that govern
economic and social interactions among them
3
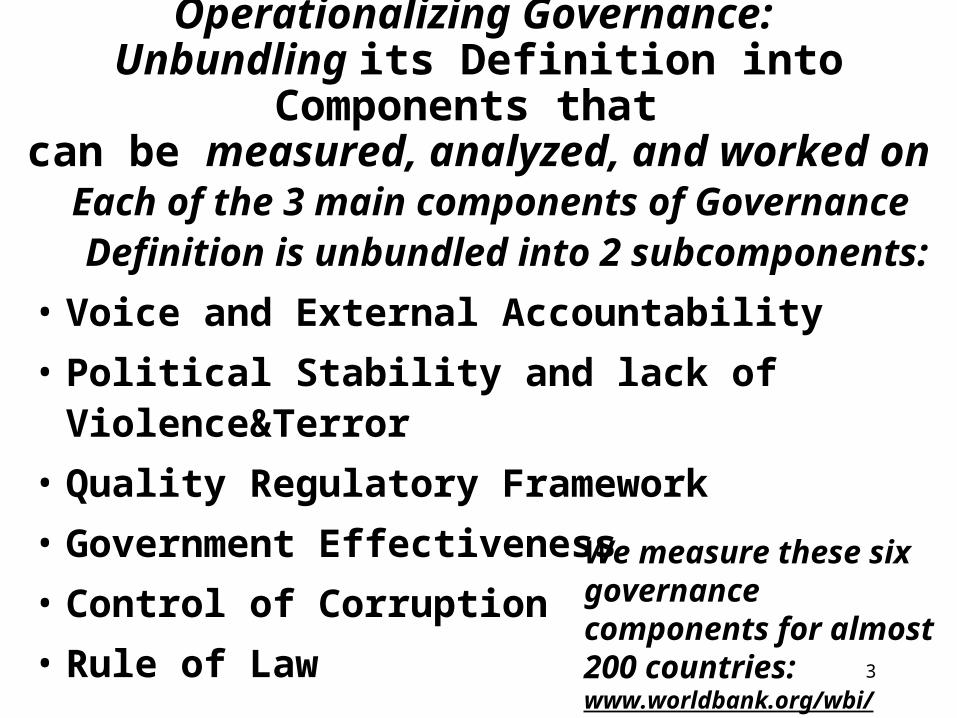
Operationalizing Governance: Unbundling its Definition into Components that
can be measured, analyzed, and worked on
Each of the 3 main components of Governance Definition is unbundled into 2 subcomponents:
• Voice and External Accountability
• Political Stability and lack of Violence&Terror
• Quality Regulatory Framework
• Government Effectiveness
• Control of Corruption
• Rule of Law
We measure these six governance components for almost 200 countries: www.worldbank.org/wbi/governance
4
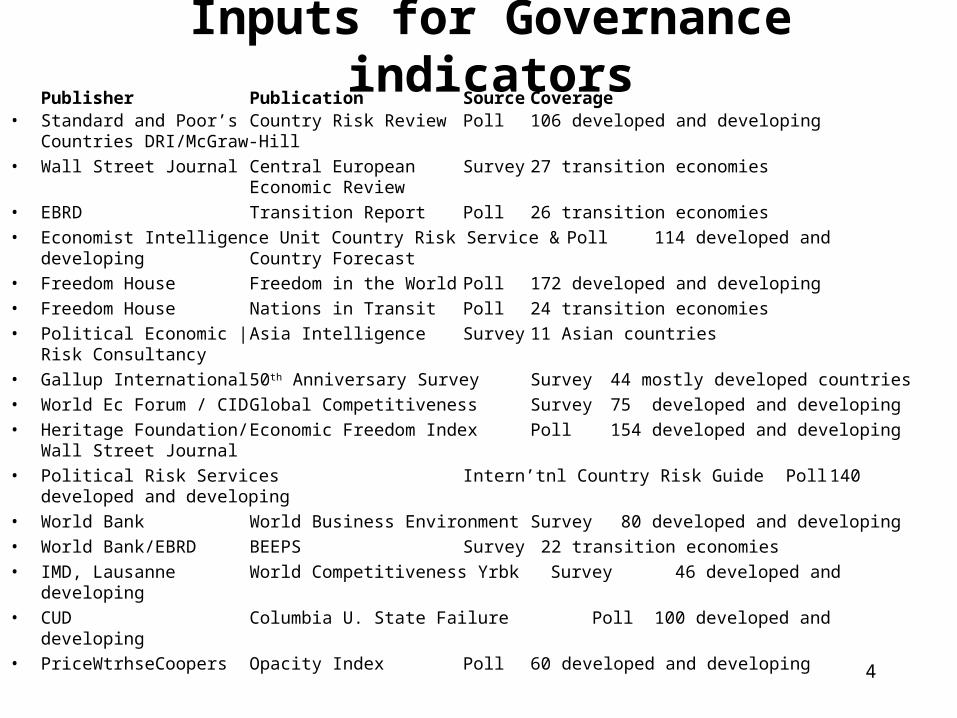
Inputs for Governance indicatorsPublisher Publication Source Coverage
• Standard and Poor’s Country Risk Review Poll 106 developed and developing Countries DRI/McGraw-Hill
• Wall Street Journal Central European Survey 27 transition economies Economic Review
• EBRD Transition Report Poll 26 transition economies• Economist Intelligence Unit Country Risk Service & Poll 114 developed and developing
Country Forecast• Freedom House Freedom in the World Poll 172 developed and developing• Freedom House Nations in Transit Poll 24 transition economies• Political Economic | Asia Intelligence Survey 11 Asian countries
Risk Consultancy• Gallup International 50th Anniversary Survey Survey 44 mostly developed countries• World Ec Forum / CID Global Competitiveness Survey 75 developed and developing • Heritage Foundation/ Economic Freedom Index Poll 154 developed and developing
Wall Street Journal• Political Risk Services Intern’tnl Country Risk Guide Poll 140 developed and developing• World Bank World Business Environment Survey 80 developed and developing • World Bank/EBRD BEEPS Survey 22 transition economies• IMD, Lausanne World Competitiveness Yrbk Survey 46 developed and developing• CUD Columbia U. State Failure Poll 100 developed and developing• PriceWtrhseCoopers Opacity Index Poll 60 developed and developing
5
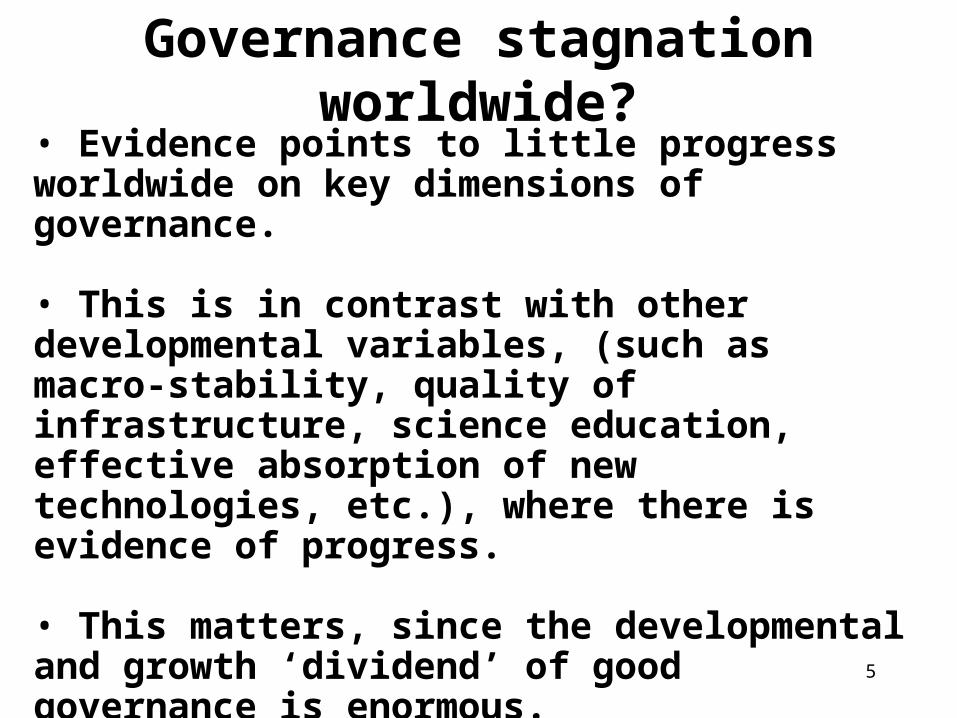
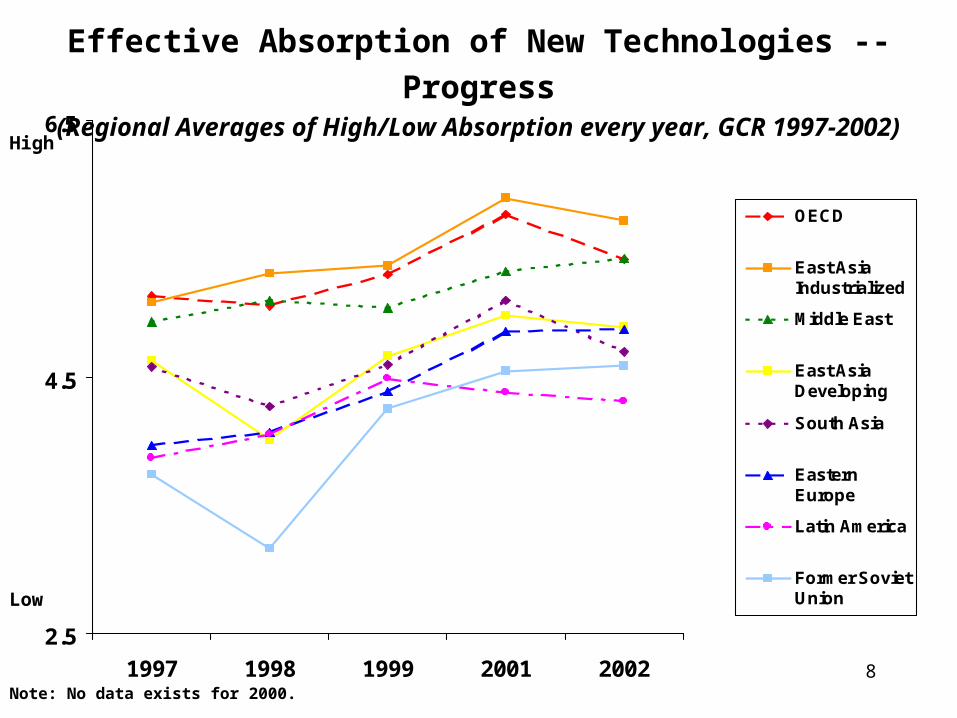
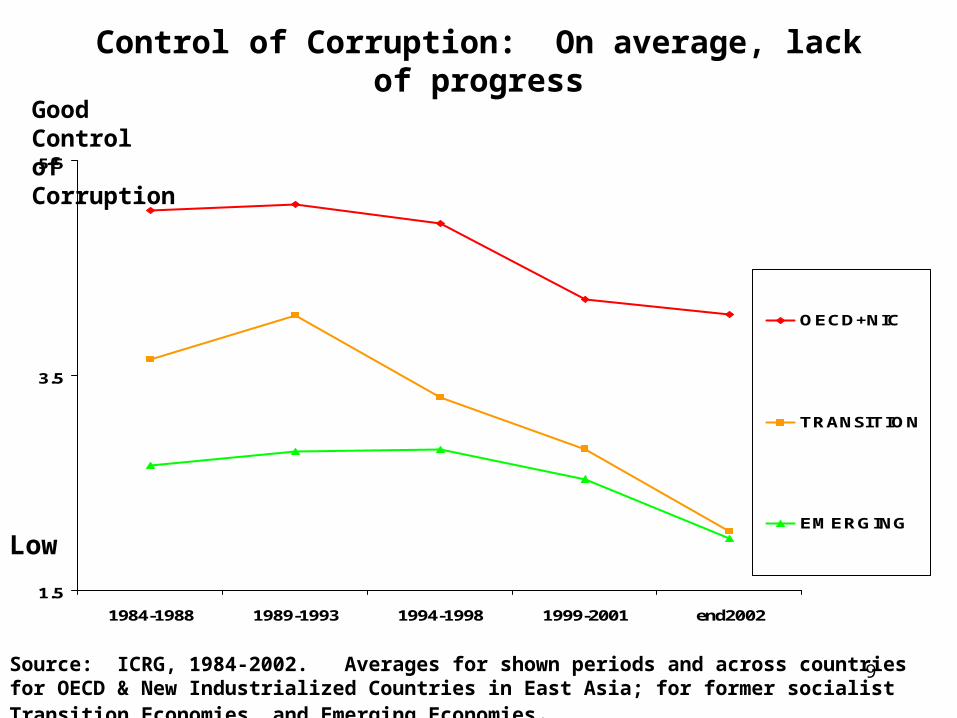
Governance stagnation worldwide?• Evidence points to little progress worldwide on key dimensions of governance. • This is in contrast with other developmental variables, (such as macro-stability, quality of infrastructure, science education, effective absorption of new technologies, etc.), where there is evidence of progress.
• This matters, since the developmental and growth ‘dividend’ of good governance is enormous.
• There is high variation cross-country (even within each region), and thus averages mask selective improvements in governance, from which we also learn.
6
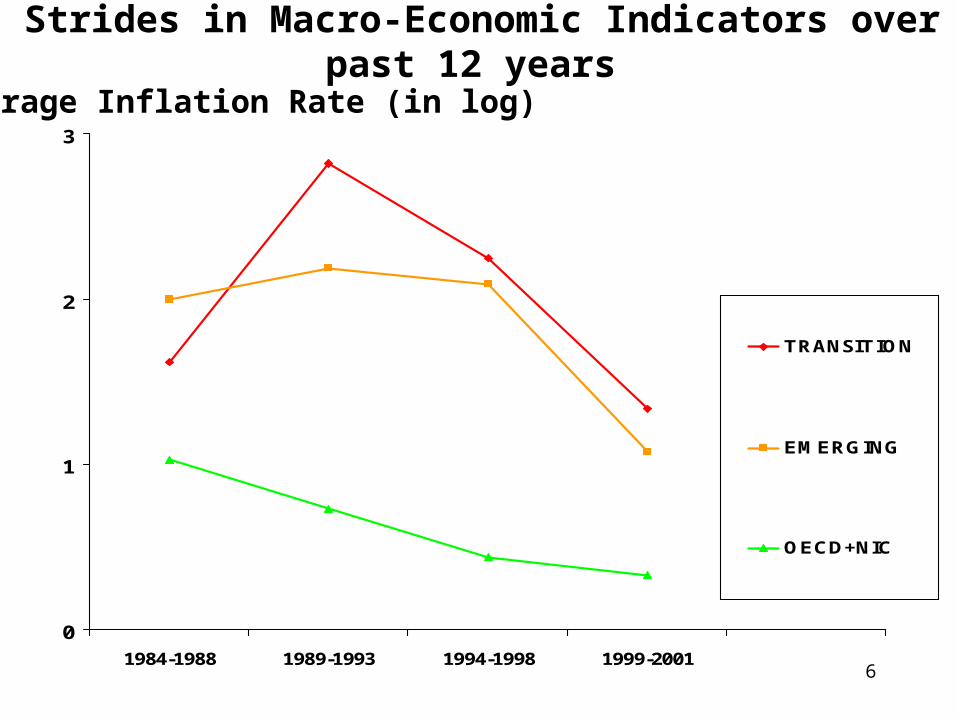
0
1
2
3
1984-1988 1989-1993 1994-1998 1999-2001
TRANSITION
EMERGING
OECD+NIC
Strides in Macro-Economic Indicators over past 12 years
Average Inflation Rate (in log)
7
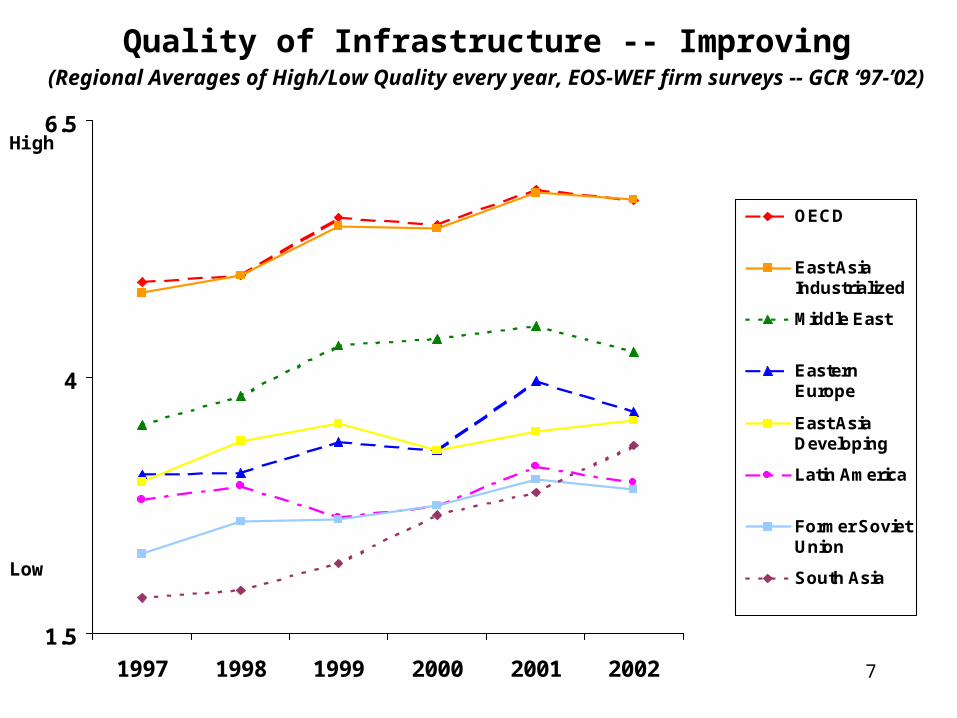
1.5
4
6.5
1997 1998 1999 2000 2001 2002
OECD
East AsiaIndustrialized
Middle East
EasternEurope
East AsiaDeveloping
Latin America
Former SovietUnion
South Asia
Quality of Infrastructure -- Improving(Regional Averages of High/Low Quality every year, EOS-WEF firm surveys -- GCR ‘97-’02)
Low
High
8
2.5
4.5
6.5
1997 1998 1999 2001 2002
OECD
East AsiaIndustrialized
Middle East
East AsiaDeveloping
South Asia
EasternEurope
Latin America
Former SovietUnion
Effective Absorption of New Technologies -- Progress(Regional Averages of High/Low Absorption every year, GCR 1997-2002)
Note: No data exists for 2000.
Low
High
9
1.5
3.5
5.5
1984-1988 1989-1993 1994-1998 1999-2001 end2002
OECD+NIC
TRANSITION
EMERGING
Source: ICRG, 1984-2002. Averages for shown periods and across countries for OECD & New Industrialized Countries in East Asia; for former socialist Transition Economies, and Emerging Economies.
Control of Corruption: On average, lack of progress
Good Controlof Corruption
Low
10
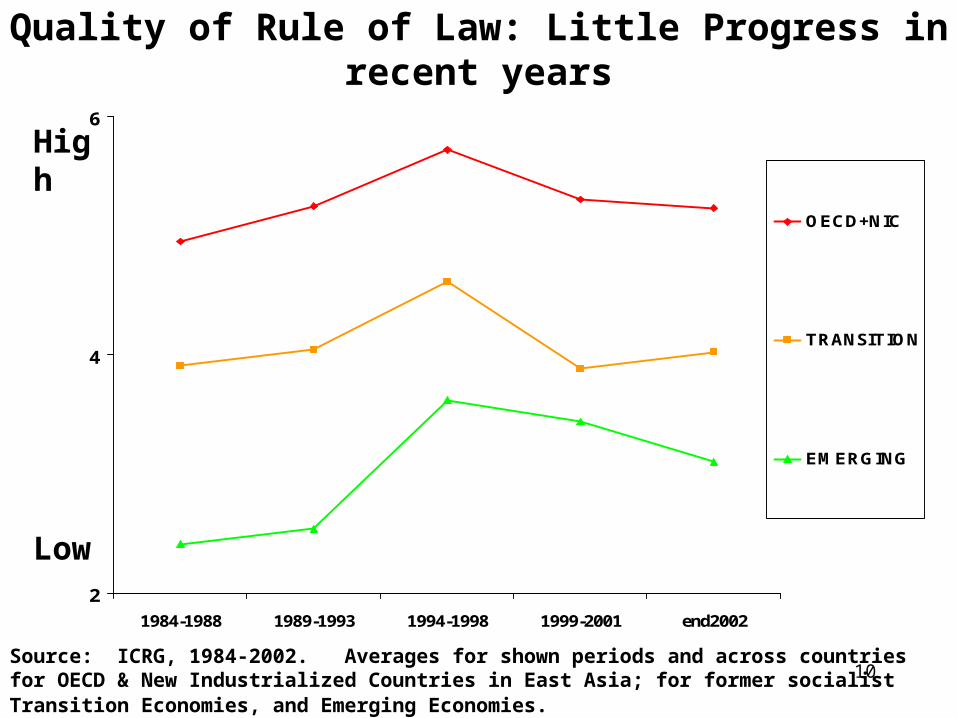
2
4
6
1984-1988 1989-1993 1994-1998 1999-2001 end2002
OECD+NIC
TRANSITION
EMERGING
Source: ICRG, 1984-2002. Averages for shown periods and across countries for OECD & New Industrialized Countries in East Asia; for former socialist Transition Economies, and Emerging Economies.
Quality of Rule of Law: Little Progress in recent years
High
Low
11
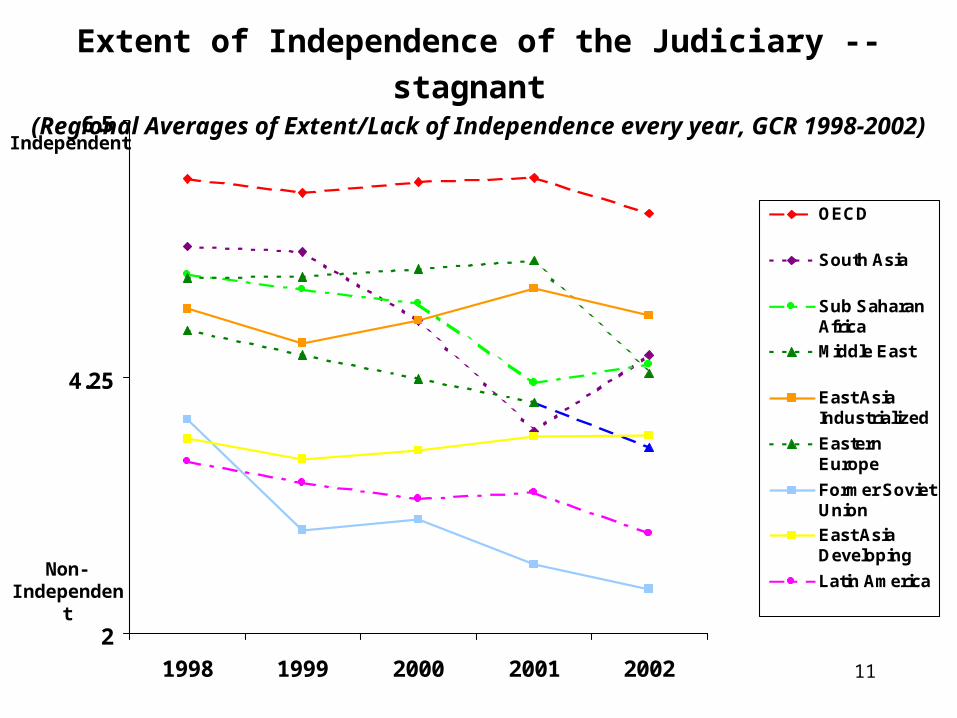
2
4.25
6.5
1998 1999 2000 2001 2002
OECD
South Asia
Sub SaharanAfrica
Middle East
East AsiaIndustrialized
EasternEurope
Former SovietUnion
East AsiaDeveloping
Latin America
Extent of Independence of the Judiciary -- stagnant (Regional Averages of Extent/Lack of Independence every year, GCR 1998-2002)
Non-Independent
Independent
12
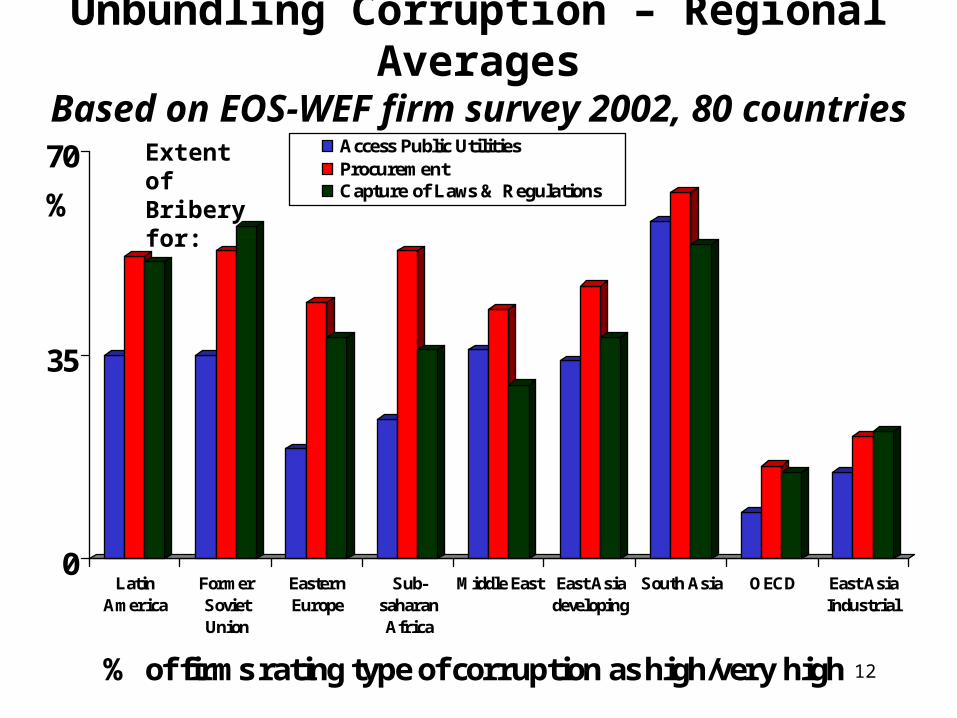
Unbundling Corruption – Regional AveragesBased on EOS-WEF firm survey 2002, 80 countries
0
35
70
LatinAmerica
FormerSovietUnion
EasternEurope
Sub-saharanAfrica
Middle East East Asiadeveloping
South Asia OECD East AsiaIndustrial
% of firms rating type of corruption as high/very high
Access Public UtilitiesProcurementCapture of Laws & Regulations
Extent of Bribery for:
%
13
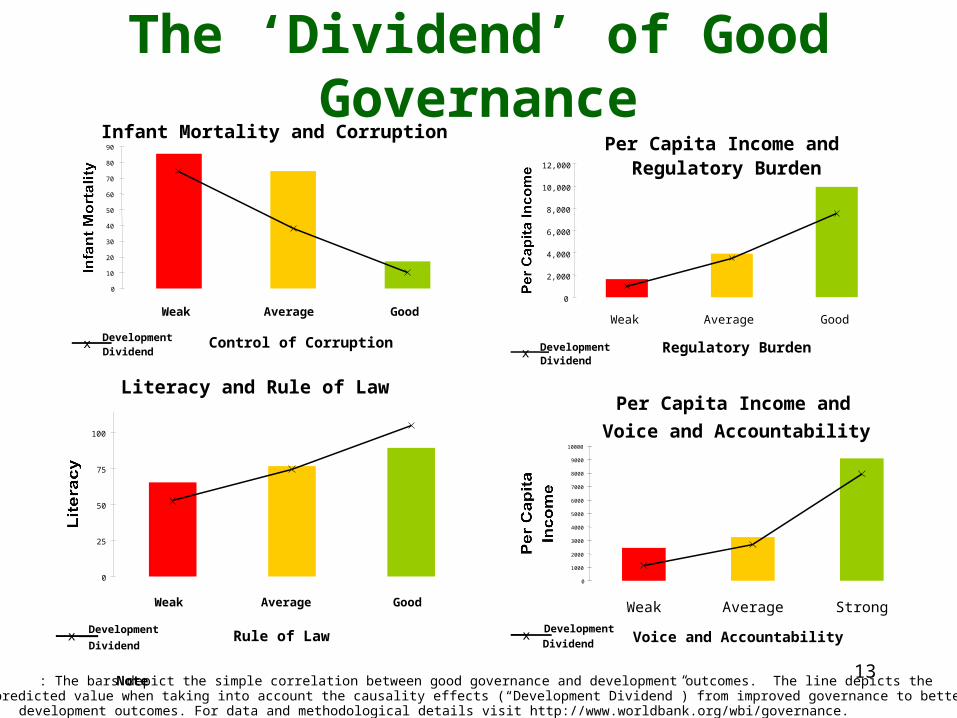
The ‘Dividend’ of Good GovernanceInfant Mortality and Corruption
0
10
20
30
40
50
60
70
80
90
Weak Average Good
Control of Corruption x Development Dividend
0
2,000
4,000
6,000
8,000
10,000
12,000
Weak Average Good
Regulatory Burdenx Development Dividend
Per Capita Income and Regulatory Burden
Literacy and Rule of Law
0
25
50
75
100
Weak Average Good
Rule of Law xDevelopment
Dividend
Per Capita Income and
Voice and Accountability
0
1000
2000
3000
4000
5000
6000
7000
8000
9000
10000
Weak Average Strong
Voice and Accountabilityx Development
Dividend
Note: The bars depict the simple correlation between good governance and development outcomes. The line depicts thepredicted value when taking into account the causality effects (“Development Dividend”) from improved governance to betterdevelopment outcomes. For data and methodological details visit http://www.worldbank.org/wbi/governance.
14
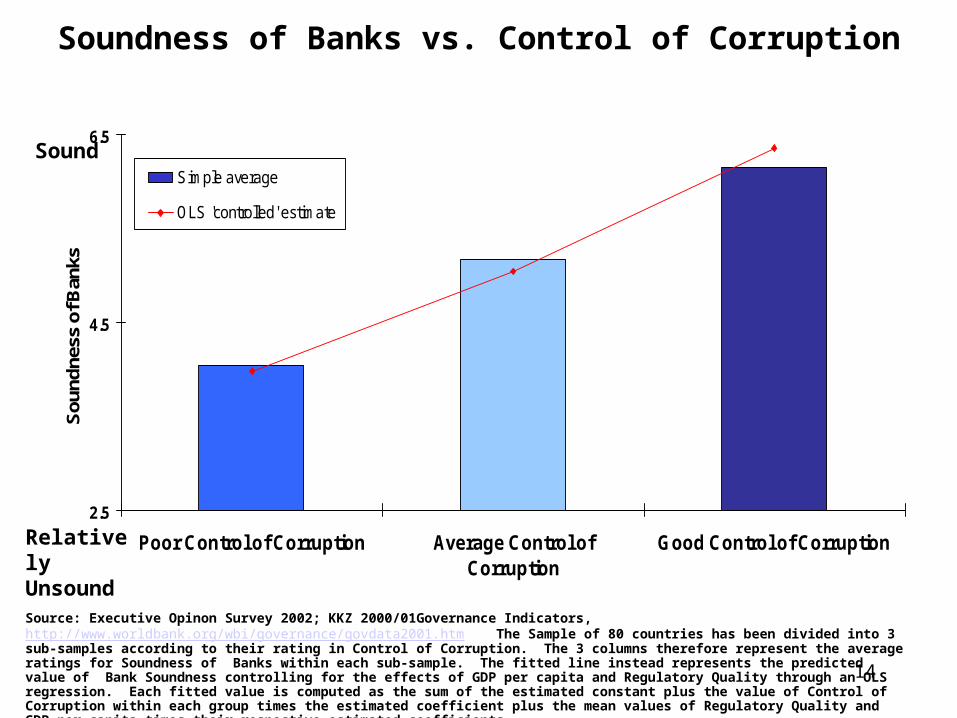
Soundness of Banks vs. Control of Corruption
2.5
4.5
6.5
Poor Control of Corruption Average Control ofCorruption
Good Control of Corruption
Sou
ndne
ss o
f Ban
ks
Simple average
OLS 'controlled' estimate
Sound
Relatively Unsound
Source: Executive Opinon Survey 2002; KKZ 2000/01Governance Indicators, http://www.worldbank.org/wbi/governance/govdata2001.htm The Sample of 80 countries has been divided into 3 sub-samples according to their rating in Control of Corruption. The 3 columns therefore represent the average ratings for Soundness of Banks within each sub-sample. The fitted line instead represents the predicted value of Bank Soundness controlling for the effects of GDP per capita and Regulatory Quality through an OLS regression. Each fitted value is computed as the sum of the estimated constant plus the value of Control of Corruption within each group times the estimated coefficient plus the mean values of Regulatory Quality and GDP per capita times their respective estimated coefficients.
15
1
3
5
Low Middle High
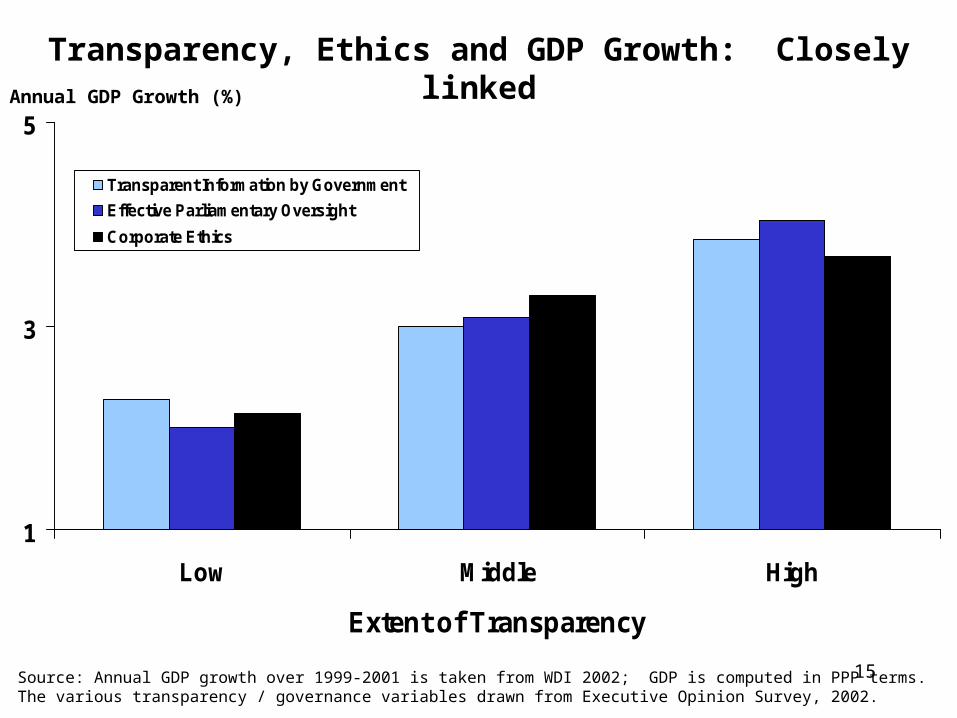
Extent of Transparency
Transparent Information by Government
Effective Parliamentary Oversight
Corporate Ethics
Annual GDP Growth (%)
Transparency, Ethics and GDP Growth: Closely linked
Source: Annual GDP growth over 1999-2001 is taken from WDI 2002; GDP is computed in PPP terms. The various transparency / governance variables drawn from Executive Opinion Survey, 2002.
16
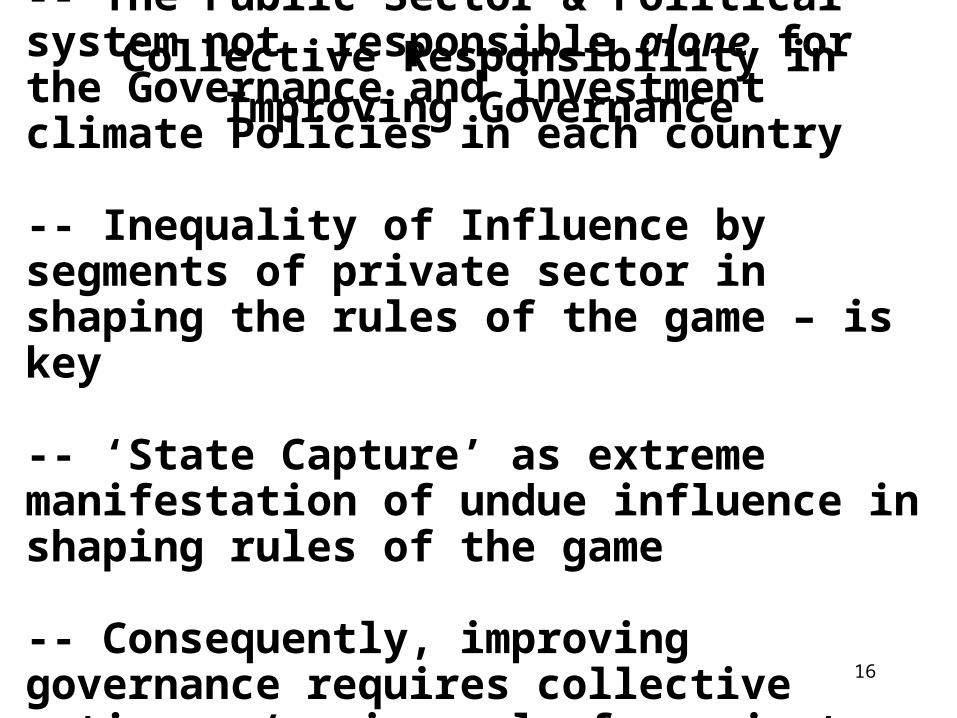
-- The Public Sector & Political system not responsible alone for the Governance and investment climate Policies in each country
-- Inequality of Influence by segments of private sector in shaping the rules of the game – is key -- ‘State Capture’ as extreme manifestation of undue influence in shaping rules of the game
-- Consequently, improving governance requires collective action, w/ major role for private sector
Collective Responsibility in Improving Governance
17
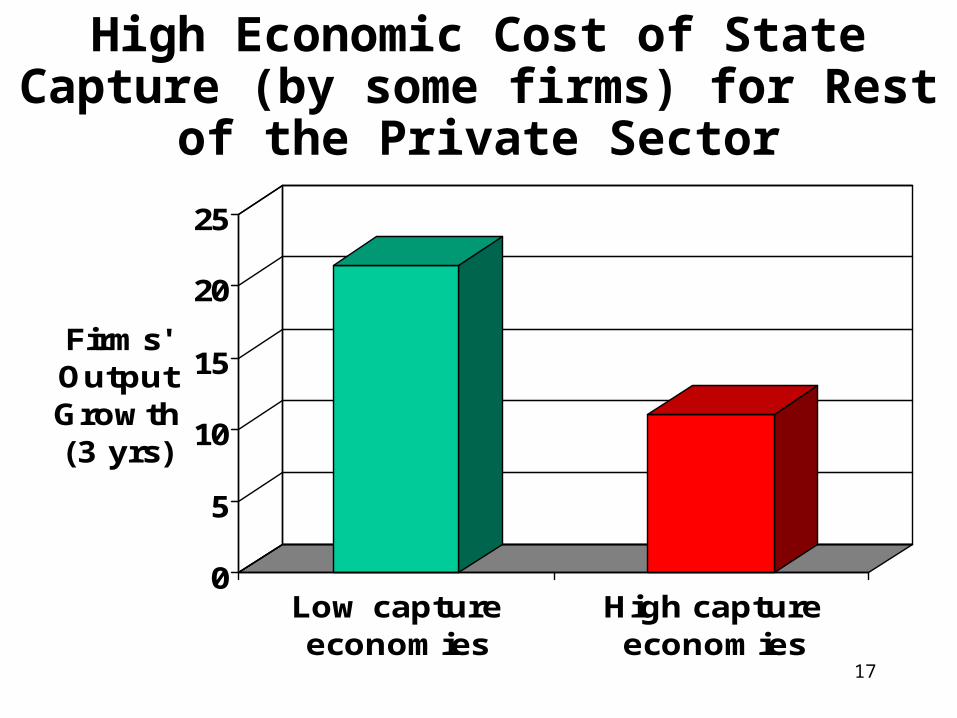
High Economic Cost of State Capture (by some firms) for Rest of the Private Sector
0
5
10
15
20
25
Firms' Output Growth (3 yrs)
Low captureeconomies
High captureeconomies

18
Also, where Capture/Grand Corruption: Greater Property Rights Insecurity for All Others
10
20
30
40
50
60
70
Low Capture Economies High Capture Economies
% Share of Firms with Secure Property Rights
Source: J. Hellman, G. Jones, D. Kaufmann. 2000. “Seize the State, Seize the Day: State Capture, Corruption and Influence in Transition” World Bank Policy Research Working Paper 2444.
19
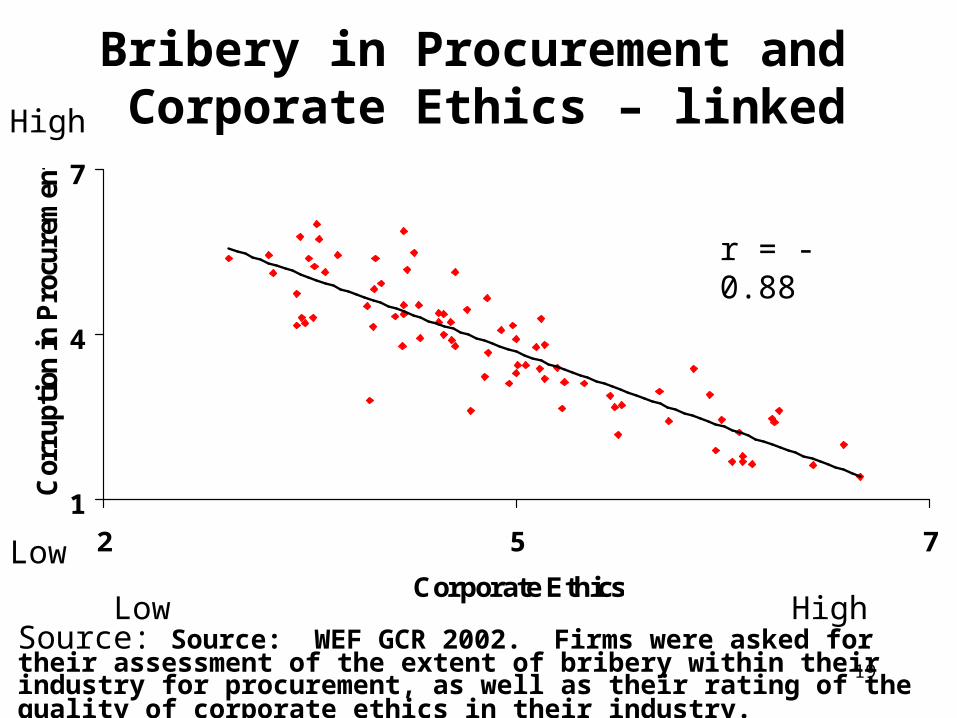
Bribery in Procurement and Corporate Ethics – linked
1
4
7
2 5 7
Corporate Ethics
Cor
rup
tion
in
Pro
cure
men
t
Source: Source: WEF GCR 2002. Firms were asked for their assessment of the extent of bribery within their industry for procurement, as well as their rating of the quality of corporate ethics in their industry.
r = -0.88
Low High
Low
High
20
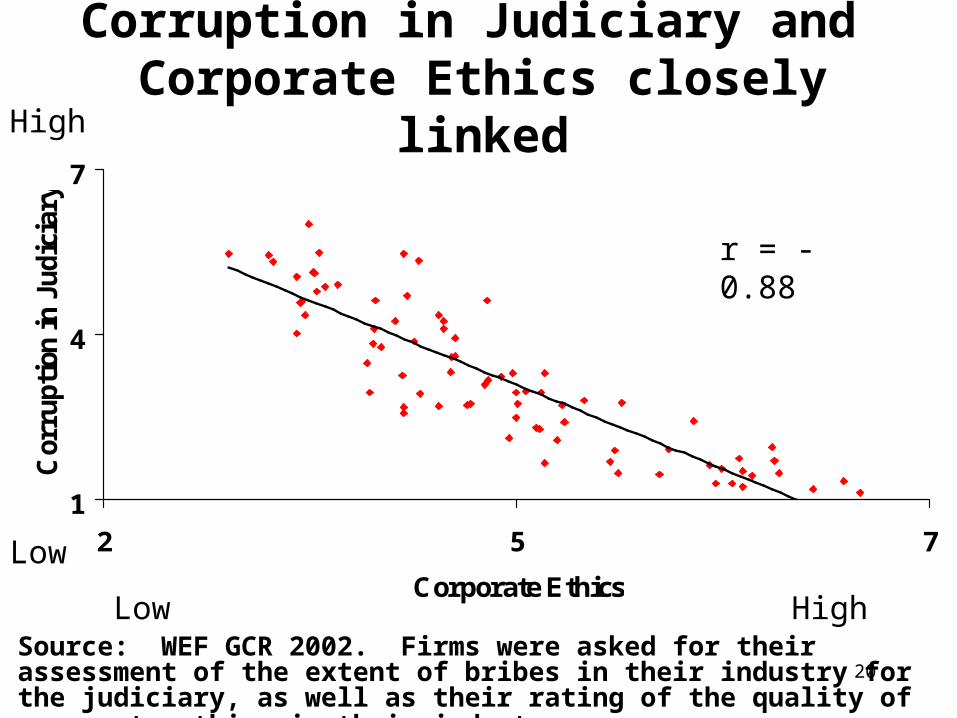
Corruption in Judiciary and Corporate Ethics closely linked
1
4
7
2 5 7
Corporate Ethics
Cor
rup
tion
in
Ju
dic
iary
Source: WEF GCR 2002. Firms were asked for their assessment of the extent of bribes in their industry for the judiciary, as well as their rating of the quality of corporate ethics in their industry.
r = -0.88
Low High
Low
High
21
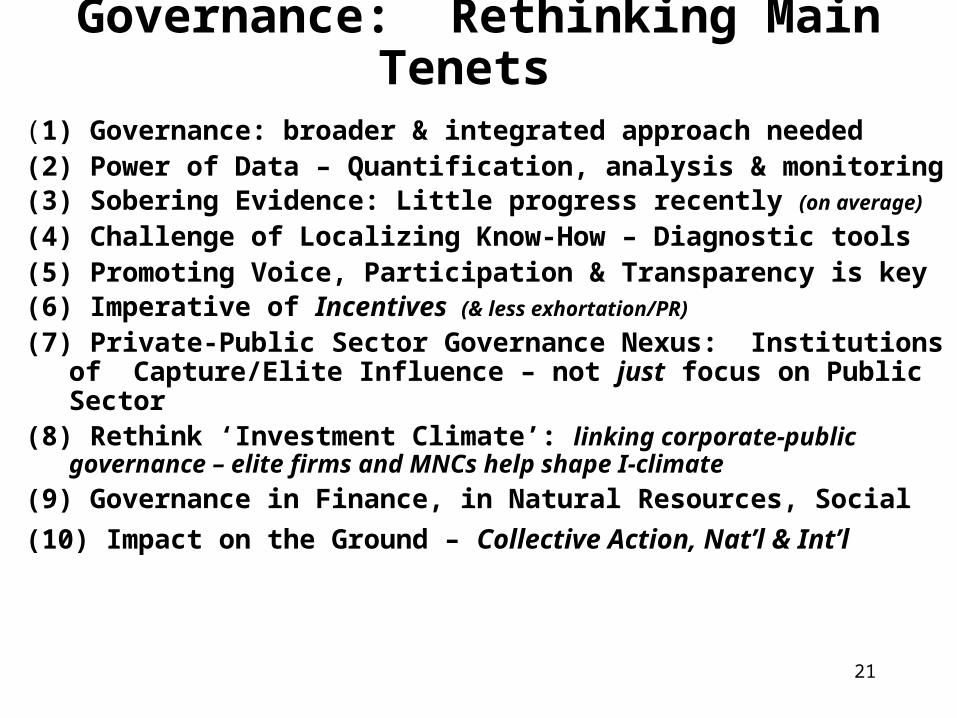
Governance: Rethinking Main Tenets
(1) Governance: broader & integrated approach needed(2) Power of Data – Quantification, analysis & monitoring(3) Sobering Evidence: Little progress recently (on average)
(4) Challenge of Localizing Know-How – Diagnostic tools(5) Promoting Voice, Participation & Transparency is key (6) Imperative of Incentives (& less exhortation/PR)
(7) Private-Public Sector Governance Nexus: Institutions of Capture/Elite Influence – not just focus on Public Sector
(8) Rethink ‘Investment Climate’: linking corporate-public governance – elite firms and MNCs help shape I-climate
(9) Governance in Finance, in Natural Resources, Social
(10) Impact on the Ground – Collective Action, Nat’l & Int’l

22
Data for Analysis and informing Policy Advise, not for Precise Rankings
Data in this presentation is from aggregate governance indicators, surveys, and expert polls and is subject to a margin of error. Not intended for precise comparative rankings across countries, but to illustrate performance measures to assist in drawing implications for strategy. It does not reflect official views on rankings by the World Bank or its Board of Directors. Errors are responsibility of the author, who benefited in this work from collaboration with World Bank, WEF and others.
www.worldbank.org/wbi/governance