Embed Size (px)
Citation preview

1st Half 2017-2018
Results24 November 2017

Overview
• Highlights
• Key figures
• Analyses
• 2017 harvest & investments
• Continuation of value policy
• Outlook
2

Overview
• Highlights
• Key figures
• Analyses
• 2017 harvest & investments
• Continuation of value policy
• Outlook
3

Highlights
4
� EXTERNALEXTERNALEXTERNALEXTERNAL FACTORSFACTORSFACTORSFACTORS
• Market stable by volume• Steady deterioration in exchange rates (£, $ and CHF)
� INTERNALINTERNALINTERNALINTERNAL FACTORSFACTORSFACTORSFACTORS
• Global launch of “La Cuvée”: a real step-up from Brut LP• Positioning of “La Cuvée”, with price increase• Change of US distributor• Continuation of media investment campaign• Impact of end of Suntory distribution on 1 January 2017• Decision to unwind Swaps contracts in connection with refinancing

Market stable over rolling 12-month period Total in 12 months to end-September
(source : CIVC) –million bottles shipped
5
----0.2%0.2%0.2%0.2%
253 263
288 294
301 307
321
339
322
293
319 323
309 305 307 313
306 310 310
Y0
0
Y0
1
Y0
2
Y0
3
Y0
4
Y0
5
Y0
6
Y0
7
Y0
8
Y0
9
Y1
0
Y1
1
Y1
2
Y1
3
Y1
4
Y1
5
Y1
6
sep
t-1
6
sep
t-1
7
ANNEE CIVILES CUMUL 12
MOIS FIN
SEPT
CALENDAR YEARSTotal 12 mths
to end-Sept

+4.0%
-2.8%
+1.9%
+1.0%
LEADER*LPMARCHEMAISONS * MARKETHOUSES * LEADER *
Market change, 2017
6
* Estimated
Change in 6 months from April to September

OVERVIEW
• Highlights
• Key figures
• Analyses
• 2017 harvest & investments
• Continuation of value policy
• Outlook
7

8
Principal consolidated data[Total in 6 months to end-September 2017]
Organic restatements
Laurent-Perrier Group
(€ million)
1st
half
2016-2017
1st
half
2017-2018
ChangeCurrenci
es
Margi
n/
rev.
Provisions
& other
regul’n
Third
party
& other
Total
1st half
2017-2018
Organic
Change
Turnover 97.9 94.7 -3.2% +1.4 +0.2 +1.3 +2.8 97.5 -0.3%
Gross margin 49.3 47.8 -2.9% +1.3 -0.2 +0.2 +0.4 +1.5 49.4 +0.2%
Gross margin ratio 50.3% 50.5% +0.2Pts 50.6% +0.3Pts
Brand development -7.7 -8.3 +7.0% -0.1 +0.1 -0.1 -8.3 +7.6%
Comm & Admin expenses. -22.8 -22.9 +0.8% -0.2 -0.0 -0.2 -23.2 +1.8%
Other income & expenses 0.4 0.3 -28.7% -0.1 +0.1 +0.3 +0.2 0.5 +20.9%
Operating result 19.2 16.9 -11.9% +0.8 -0.2 +0.3 +0.7 +1.5 18.4 -4.3%
Operating margin ratio 19.6% 17.9% -1.8Pts 18.8% -0.8Pts

Overview
• Highlights
• Key figures
• Analyses
• 2017 harvest & investments
• Continuation of value policy
• Outlook
9

10
Price/mix effect mostly offsets drop in volume
Change % change % change
Vs 1st half 2016-2017 Volume Price / mix (*)
Laurent-Perrier Group -2.8% +2.4%
(*) at constant exchange rates

11
Contribution from premium cuvées steadily
increasing
12
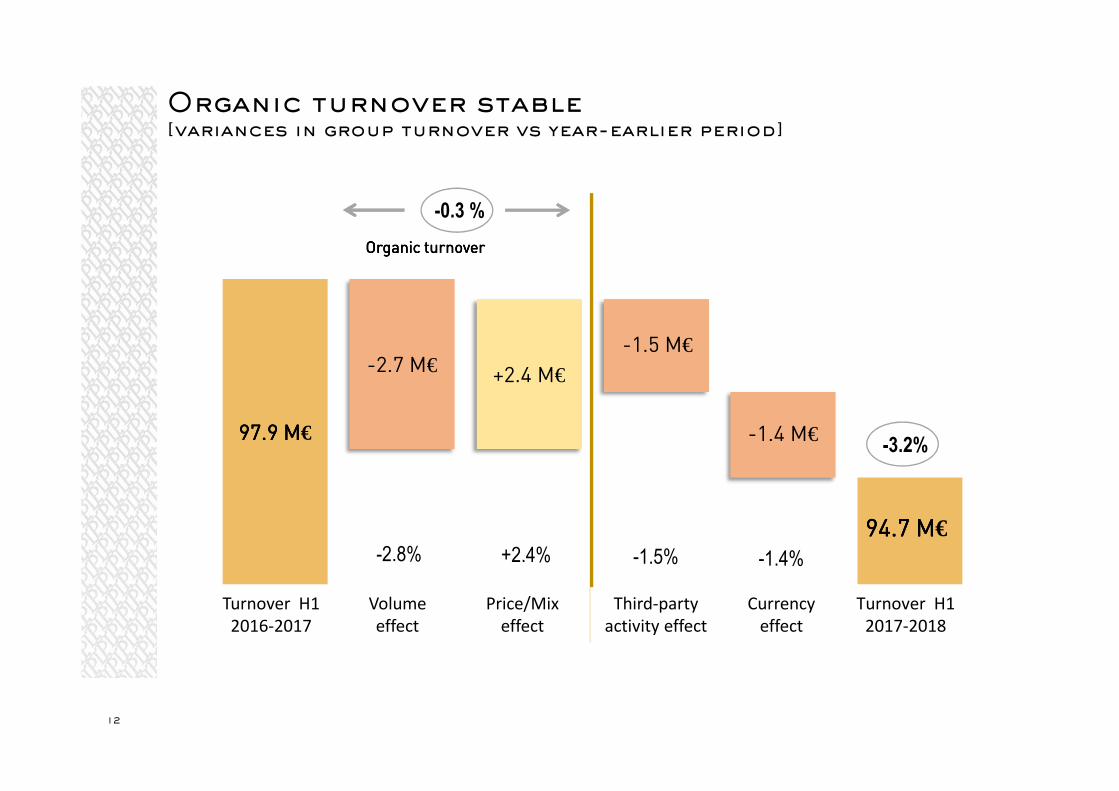
Organic turnover stable[variances in group turnover vs year-earlier period]
-2.8% +2.4% -1.5% -1.4%
-3,2 %-0.3 %
-3.2%
OrganicOrganicOrganicOrganic turnover turnover turnover turnover
97.9 M97.9 M97.9 M97.9 M€
95,2 95,2 95,2 95,2 95,2 95,2 95,2 95,2 96,1 96,1 96,1 96,1
94,7 94,7 94,7 94,7 94.7 M94.7 M94.7 M94.7 M€
-2.7 M€ +2.4 M€
-1.5 M€
-1.4 M€
CAS1 2016-2017
Effetvolume
EffetPrix/Mix
Effetactivité tiers
Effetchange
CAS1 2017-2018
Turnover H1
2016-2017
Volume
effect
Price/Mix
effect
Third-party
activity effect
Currency
effect
Turnover H1
2017-2018
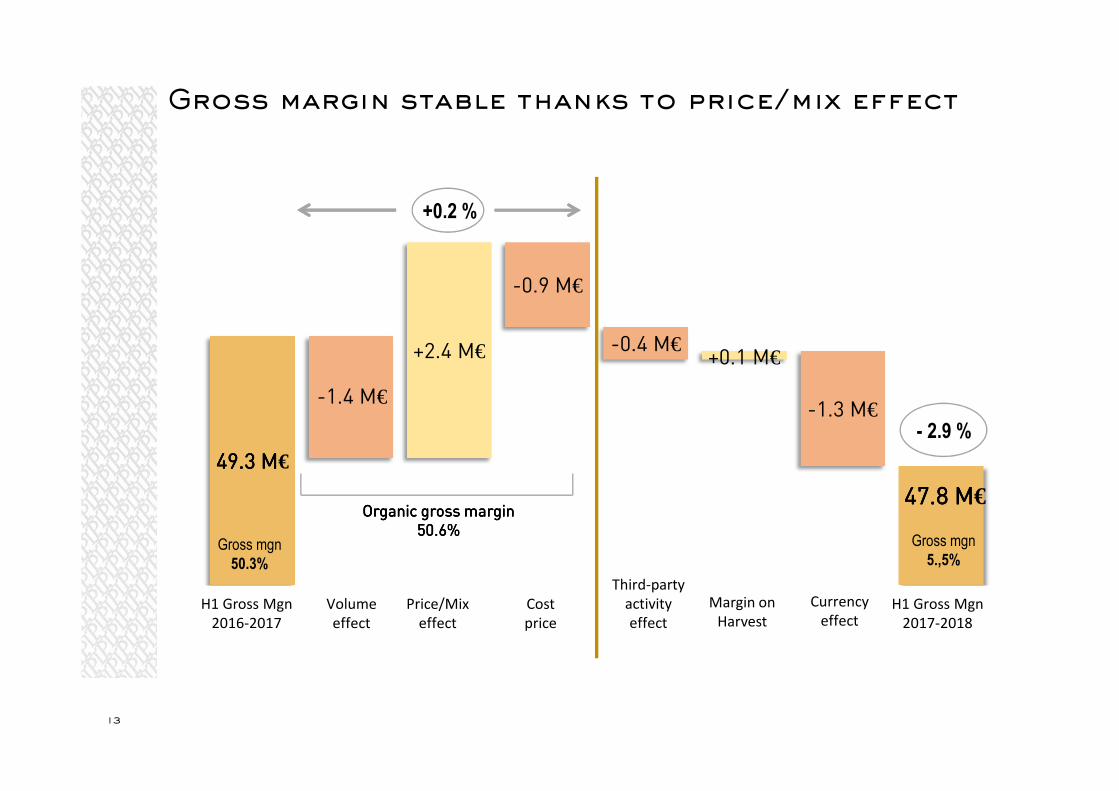
49.3 M49.3 M49.3 M49.3 M€
47.8 M47.8 M47.8 M47.8 M€
-1.4 M€
+2.4 M€
-0.9 M€
-0.4 M€+0.1 M€
-1.3 M€
Marge Brute S12016-2017
Effetvolume
Effet Prix/mix
Prixde revient
Effetactivité tiers
Marge /récolte& provisions
Effetchange
Marge Brute S12017-2018
H1 Gross Mgn
2016-2017
Volume
effect
Price/Mix
effect
Cost
price
Third-party
activity
effect
Margin on
Harvest
Currency
effectH1 Gross Mgn
2017-2018
13
Gross margin stable thanks to price/mix effect
- 2.9 %
Gross mgn
50.3%
OrganicOrganicOrganicOrganic grossgrossgrossgross marginmarginmarginmargin50.6%50.6%50.6%50.6%
Gross mgn
5.,5%
+0.2 %

19.2 M19.2 M19.2 M19.2 M€
16.9 M16.9 M16.9 M16.9 M€
+0.1 M€
-1.0 M€
+0.2 M€
- 0.9 M€
- 0.8 M€
ROP S12016-2017
Marge bruteorganique
charges cial.& admin.
Marge /rec.
Activité tiers& divers
Change ROP S12017-2018
H1 ROP
2016-2017
Organic
Gross
margin
Comm. &
Admin. Exp.
Margin on
harvest
3d-party
activity and
otherCurrency
H1 ROP
2017-2018
14
Organic operating result affected by rise in commercial
and administrative expenses
- 11,9 %
Operating
margin
19:6%
Operating
margin
17.9%
- 4.3 %

Change vs 1st half 2016-2017Commercial & Administrative Expenses
+ 1 M+ 1 M+ 1 M+ 1 M€
15
Analysis of commercial and administrative expenses
60% 60% 60% 60% Brand developmentBrand developmentBrand developmentBrand development
+0.6 M+0.6 M+0.6 M+0.6 M€
40%40%40%40%General overheadsGeneral overheadsGeneral overheadsGeneral overheads
+0.4 M+0.4 M+0.4 M+0.4 M€
• O/W 2/3 linked to launch of La Cuvée
• Events, referencing• Export markets support

----3.3 M3.3 M3.3 M3.3 M€
----4.7 M4.7 M4.7 M4.7 M€
+0.4 M€
+0,9 M€
Res. Fin. S12016-2017
Mise en placedu refinancement
ImpactIFRS Swap
Res. Fin. S12017-2018
Fin. Rslt H1
2016-2017
Financial
implementationIFRS Swap
impact
Fin. Rslt H1
2017-2018
- 1.3 M€
16
Financial result affected by the unwinding of
swaps
in connection with the refinancing

17
Simplified income statement
(€ million)1st half
2016-2017
1st half
2017-2018Changes
Turnover 97.9 94.7 -3,.%
Gross margin 49.3 47.8 -2.9%
as % of turnover 50.3% 50.5% +0.2Pts
Operating result 19.2 16.9 -11.9%
as % of turnover 19.6% 17.9% -1.8Pts
Financial result -3.3 -4.7 +39.9%
Tax -5.5 -4.3 -21.4%
Group net income 10.3 7.9 -23.9%
as % of turnover 10.6% 8.3% -2.3Pts
Net cash flow (*) -34.3 -28.0 +6.3
(*) net cash from operations minus net investment minus dividends

18
Balance Sheet Analysis

19
€6.3 million improvement in cash flow
+ 6,3 M€
----34.3 M34.3 M34.3 M34.3 M€---- 28.0 M28.0 M28.0 M28.0 M€
+2.7 M€
+ 5.3 M€-1.8 M€ +0.0
Cash-Flow netS1 2016-2017 CAF
Var.Investissements
Var.BFR
Var.Dividendes
Cash-Flow netS1 2017-2018
Net Cash Flow
H1 2016-2017Change
dividends
Change
Investments
ChangeWCR
+6.3 M€
ChangeCash
Net Cash Flow
H1 2017-2018

61.6 63.7
567.5 582.8
250.3 253.0
sept-16 sept-17
Immobilisations
Stocks
Créancescommerciales
Stocks
Trade
R’ables.
372.1 393.4
300.3 299.8
206.9 206.4
sept-16 sept-17
Dettescommerciales
Dettesfinancières
Fondspropres
Trade
payables.
Debt.
Shareh’s
Equity
Sept 16
20
Balance sheet structure[Group – Total 6 months to end-September 2017]
ASSETS
879.3879.3879.3879.3 899.5899.5899.5899.5 879.3879.3879.3879.3 899.5899.5899.5899.5
LIABILITIES
Fixed
Assets.
Sept 16 Sept 17 Sept 17

21
Steady improvement in debt ratios[Group – Total 6 months to end-September 2017]
Inventories/Debt, % Debt/ Equity, %
148%160% 165% 171% 178% 185% 185% 189% 194%
Mar-11 Mar-12 Mar-13 Mar-14 Mar-15 Mar-16 Mar-17 Sept 16sept-17
116%
102%95%
85% 80%73% 70%
81% 76%
Mar-11 Mar-12 Mar-13 Mar-14 Mar-15 Mar-16 Mar-17 Sept 16sept-17

331.6
304.0 285.7 281.4 279.3 277.1
269.0 274.2
300.3 299.8
mars-10 mars-11 mars-12 mars-13 mars-14 mars-15 mars-16 mars-17 Sept-16 Sept-17
22
Debt stable[Group – Total 6 months to end-September 2017]

Overview
• Highlights
• Key figures
• Analyses
• 2017 harvest & investments
• Continuation of value policy
• Outlook
23

The wine growing year: 2017
24
� A very mild winter but with spring frosts which had major consequences(Côte des Blancs, Vallée de La Marne, Aube, etc.): 23% of buds lost over thetotal growing area
� Until end-July, the vines were in remarkable condition, despite low rainfall
� Heavy rain on 25 August in the Marne (100mm), and a subsequent heat wavefrom 29 August, just as the grapes were ripe, led to outbreaks of botrytis

Appraisal of the 2017 harvest
25
� The quality of the harvest differed widely for each of the threevarietals from one region to another
� Agronomic yield: total for Champagne: 9,000 kg / ha(8,500 kg/ ha in 2016): 20% less than in 2015
� Usable AOC yield = 10,800 Kg/ha(10,300 kg +500 kg from release of individual reserves
Investment update
26
� The centralisation of wine making processes in 2014-2016 is now complete(Cellars & Winery)
� Investment in cellars in 2017-2018 in view of a site disposal in order togroup all storage facilities at Tours-sur-Marne
� Reorganisation of reception and stand-by facilities

Overview
• Highights
• Key figures
• Analyses
• 2017 harvest & investments
• Continuation of value policy
• Outlook
27

28

Launch of La Cuvée: 15 years of investment
in the service of quality
29
A
NEW WINE
NEW
PACKAGING
NEW
BARCODE
30
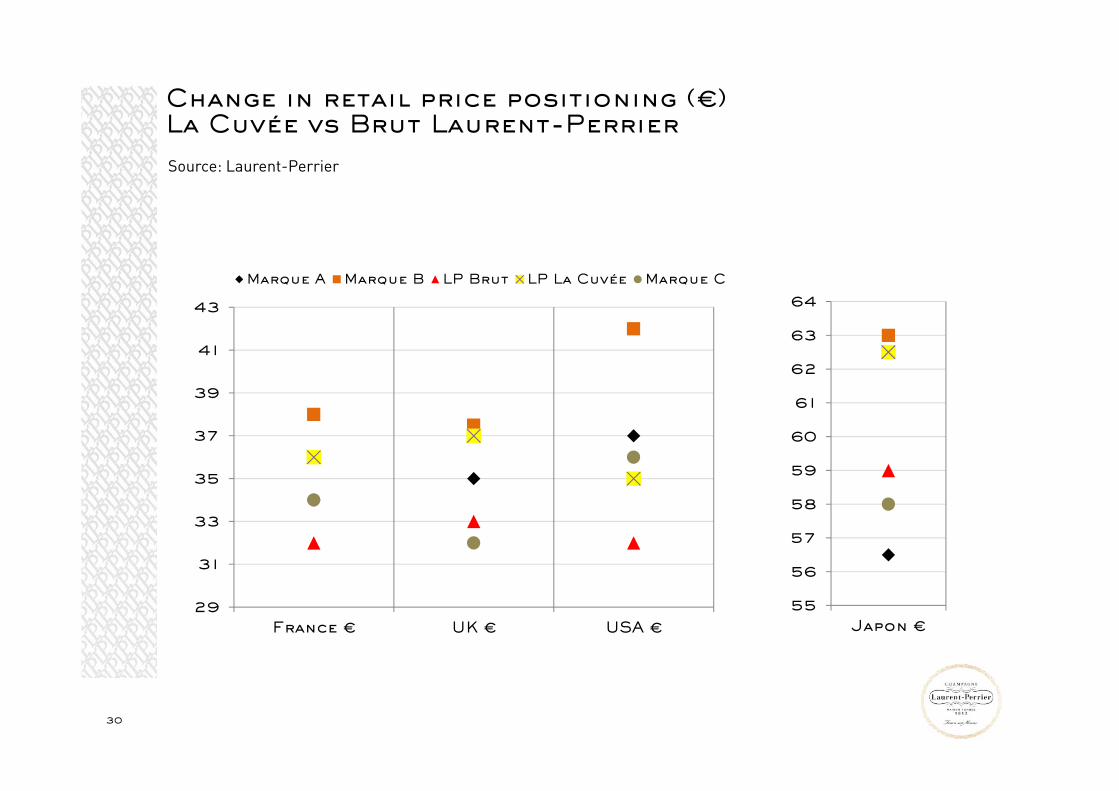
Change in retail price positioning (€) La Cuvée vs Brut Laurent-Perrier
Source: Laurent-Perrier
29
31
33
35
37
39
41
43
France € UK € USA €
Marque A Marque B LP Brut LP La Cuvée Marque C
55
56
57
58
59
60
61
62
63
64
Japon €

31
First conclusions
At the right relative price point, performance is better that Brut’s
The quality of the wine is a major asset

32
Cuvée Rosé

33

34
Media campaign now covers 70% of the market
USA California
USA
New-York
UK
FRANCEITALY
SWITZERLAND (G)
Switzerland (G), USA - California

35
F15 F16 F17 F18
Change in media invmt
Change in brand devt. spend
X 3
Change in media investment

Development of commercial digital investment
36

37
Development of partnerships with media / prestige clients / Laurent-Perrier

38

39
France UK Italy
& digital marketing investment
Development of targeted media investment
40
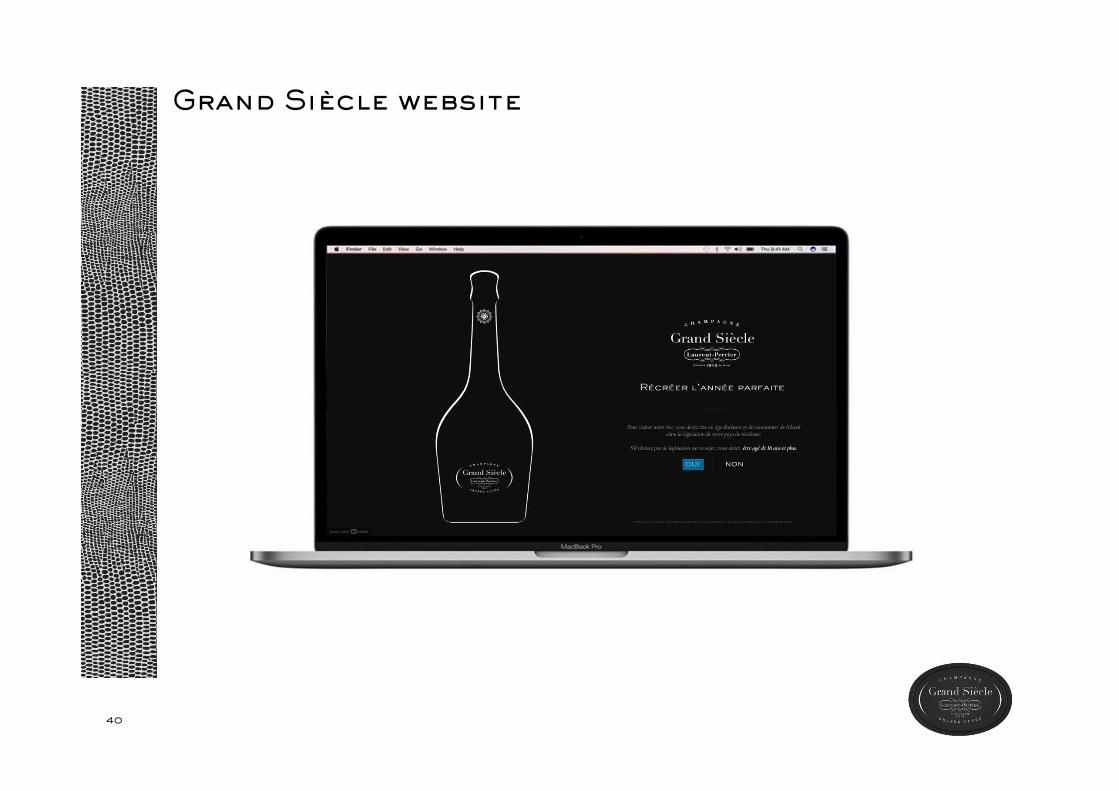
Grand Siècle website

41
INVESTMENT IN HOSPITALITY
DEVELOPING A UNIQUE EXPERIENCE FOR KEY CLIENTS

Key takeaways: first-half
42
• General increase in average sales prices in connection with the quality of our wines
• La Cuvée price increase in line with our objectives
• Prestige cuvée volumes stable
• Stronger balance sheet
• Decline in Brut segment volumes: commercial decisions assumed

43
Conclusion
• Value strategy to be maintained
• Continued caution in second half
• Organisation to continually adapt to future challenges
1st Half 2017-2018
Results24 November 2017