Embed Size (px)
Citation preview

1
Hampton Roads EconomyAnd Residential Housing Market
January 13, 2015
Professor Vinod AgarwalInterim Dean
Strome College of Business
www.odu.edu/forecasting
The views expressed in this presentation do not represent official positions on the part of Old Dominion University, the Old Dominion University Board of Visitors, or any of the sponsors of the Economic Forecasting Project. The data in this presentation may be subject to revision. To our knowledge, all data in this presentation are accurate at the time of the presentation.

2
Presentation outline
A. Gross Domestic Product and Gross Regional Product
B. Defense Spending in Hampton Roads
C. Civilian Non-Farm Jobs
D. Performance of Hampton Roads Economy through
November 2014
E. Residential Housing Market in Hampton Roads

Rate of Growth of GDP (U.S.) and GRP (Hampton Roads)
Source: Bureau of Economic Analysis and the Old Dominion University Economic Forecasting Project. Data on GDP incorporates latest BEA revisions in September 2014
2.32
2.21
-4
-3
-2
-1
0
1
2
3
4
5
6
2000 2001 2002 2003 2004 2005 2006 2007 2008 2009 2010 2011 2012 2013 2014e
Year
Gro
wth
Ra
te
Percent change real GDP Percent change real GRP
2000- 2014

4
Defense Spending in Hampton Roads

5
Hampton Road’s Gross Regional Product Attributable to DOD Spending
Source: U.S. Department of Defense , U.S. Department of Commerce, and the Old Dominion University Economic Forecasting Project
40.0%
44.9%
48.8%49.5%
32.8%
0%
10%
20%
30%
40%
50%
19
84
19
85
19
86
19
87
19
88
19
89
19
90
19
91
19
92
19
93
19
94
19
95
19
96
19
97
19
98
19
99
20
00
20
01
20
02
20
03
20
04
20
05
20
06
20
07
20
08
20
09
20
10
20
11
20
12
20
13
20
14
e
1984-2014

Estimated Direct DOD Spending in Hampton Roads
10.00
19.32
18.3518.84
18.74
0
5
10
15
20
25
2000 2001 2002 2003 2004 2005 2006 2007 2008 2009 2010 2011 2012 2013 2014e2015f
Source: U.S. Department of Defense and the Old Dominion University Economic Forecasting Project. *Includes Federal Civilian and Military Personnel and Procurement
Billi
ons
of $
6
2000 to 2015 Spending increased from 2000 to 2012 by 5.6%on an annual basis; is expected to decline to about 3% from its peak.

FY12 FY13 FY14 FY15 FY16 FY17 FY18 FY19 FY20 FY21300
350
400
450
500
550
600
650
Sequestration BBA 2013
Bill
ion
s of
dol
lars
7
Caps on Discretionary Defense Spending
Source: BCA2011,Budget Requests for FY14, CBO Sequestration Update Report and the Old Dominion University Economic Forecasting Project.
FY 2012 through FY 2021
Discretionary Defense spending cap increases by less than $1 Billion in FY 2015 compared to FY 2014 or only by 0.15%. It is expected to increase by only 0.35% in FY2016

8
Impact of Caps on DOD Spending during FY 2014 and FY 2015
• The Bipartisan Budget Act of 2013 provided $22.5 billion in sequestration relief in FY 2014 and $9.3 Billion in FY 2015.
• As a result Defense Discretionary Spending Cap increased from $498.0 billion to $520.5 billion in
FY 2014 and from $512.0 billion to $521.3 billion
in FY 2015.
• FY 2016 spending cap increases to $523.1 billion or by only 0.35 percent.

9
Budget passed by the Congress for FY 2015
• Budget passed by the Congress provides some good news for Hampton Roads for 2015 and beyond:
– Congress endorsed to keep an ELEVEN carrier fleet.
– provides funding for construction of Gerald R. Ford and overhaul of George Washington.
– Rejected request to close bases.
– Provides funding for two Virginia-class submarines in 2015.

10
Budget passed by the Congress for FY 2015
– Provides funding for construction projects ($190 Million).
– It limits the number of guided missile cruisers that can be deactivated.
– Provides a one percent pay raise for most military and civilian Government employees

11
Military EmploymentHampton Roads: 2001 to 2013
Source: Bureau of Economic Analysis and the Old Dominion University Economic Forecasting Project.
86.5
113.4
0
20
40
60
80
100
120
140
20
01
20
02
20
03
20
04
20
05
20
06
20
07
20
08
20
09
20
10
20
11
20
12
20
13
Th
ou
sa
nd
s
Military Employment has declined by 23.7 % in 2013 from its peak observed in 2003.

12
Total Military CompensationHampton Roads: 2001 to 2013
Source: Bureau of Economic Analysis and the Old Dominion University Economic Forecasting Project.
8.407.82
0
2
4
6
8
10
20
01
20
02
20
03
20
04
20
05
20
06
20
07
20
08
20
09
20
10
20
11
20
12
20
13
$ B
illi
on
s
Even though Military employment peaked in 2003, their total Compensation peaked in 2010 and has steadily declined. Compensation in 2013 is 6.9% below its level in 2010.

13
Average Military CompensationHampton Roads: 2001 to 2013
Source: Bureau of Economic Analysis and the Old Dominion University Economic Forecasting Project.
$92.7
$90.4
0
20
40
60
80
100
120
140
20
01
20
02
20
03
20
04
20
05
20
06
20
07
20
08
20
09
20
10
20
11
20
12
20
13
$ T
ho
us
an
ds
Average Military Compensation for the first time since 1969 declined in 2013; by about 2.6%.
14
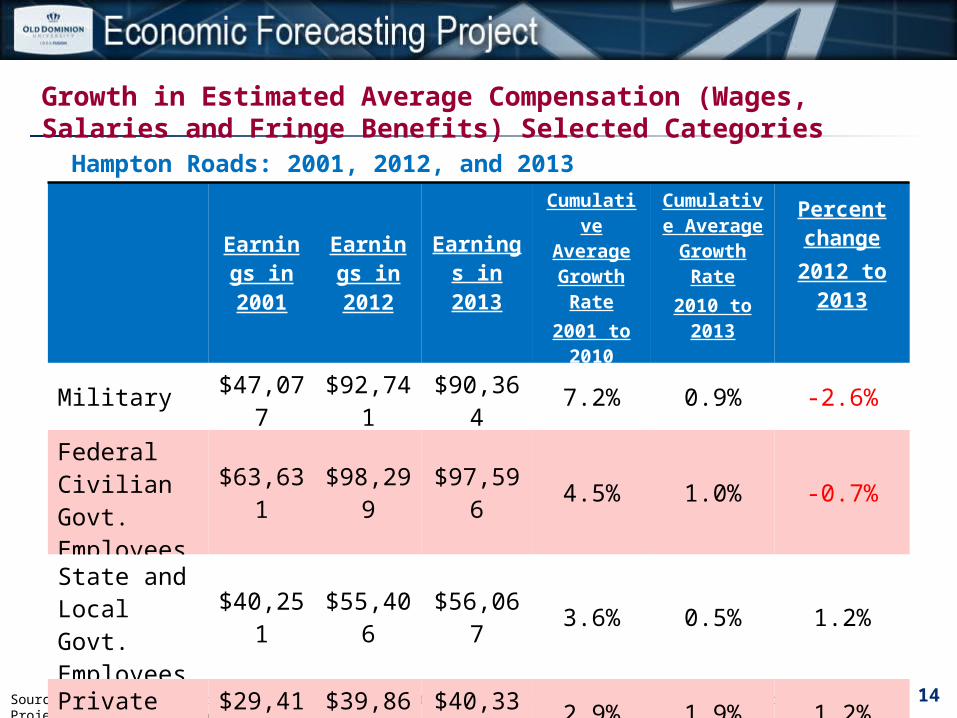
Growth in Estimated Average Compensation (Wages, Salaries and Fringe Benefits) Selected Categories
Hampton Roads: 2001, 2012, and 2013
Source: U.S. Bureau of Economic Analysis (BEA) and the Old Dominion University Economic Forecasting Project. * BEA calls compensation as earnings.
Earnings in 2001
Earnings in 2012
Earnings in 2013
Cumulative Average
Growth Rate2001 to
2010
Cumulative Average
Growth Rate2010 to 2013
Percent change
2012 to 2013
Military $47,077 $92,741 $90,364 7.2% 0.9% -2.6%
Federal Civilian Govt. Employees
$63,631 $98,299 $97,596 4.5% 1.0% -0.7%
State and Local Govt. Employees
$40,251 $55,406 $56,067 3.6% 0.5% 1.2%
Private Nonfarm $29,415 $39,860 $40,330 2.9% 1.9% 1.2%

15
Shares of Selected Sectors Measured by Total CompensationHampton Roads: 2001 and 2013
Source: U.S. Bureau of Economic Analysis (BEA) and the Old Dominion University Economic Forecasting Project. * BEA calls compensation as earnings.
2001 2013
Share of private sector
Share of Federal Civilian Government
Share of Military
Share of State & Local Government
62.78%8.63%
15.90%
12.69%
61.86%10.02%
15.81%
12.30%

16
Civilian Non-Farm Jobs in Hampton Roads

17
Annual Civilian Employment (JOBS)Hampton Roads: 1999 to 2014
707.3
721.0731.3 734.8 738.6
751.0762.1
768.6776.6
767.6
742.2736.7 739.2
745.2752.7 754.3
650
675
700
725
750
775
800
Year
Source: U.S. Department of Labor CES data and the Old Dominion University Economic Forecasting Project. Not seasonally adjusted. Data will be revised in March 2015

18
Job Gains and Loses (In Thousands)
Hampton Roads: 2007 to 2014 (YTD November)
Educational Services
Federal and State Government
Health care and Social Assistance
-20 -15 -10 -5 0 5 10 15 20
-0.2-2.4
-2.9-3.3-3.5
-3.8-4.4
-9.9-14.3
2.54.0
14.3Losers (jobs) Gainers (jobs)
Manufacturing
Finance
Transportation and Warehousing
Local Government
Professional and Business Services
Information
Construction
Retail and Wholesale Trade
Leisure and Hospitality
Source: U.S. Department of Labor CES data and the Old Dominion University Economic Forecasting Project. Not seasonally adjusted. Data will be revised in March 2015

19
Job Gains and Loses (In Thousands)
Hampton Roads: 2013 to 2014 (YTD November)
Finance
Leisure and Hospitality
Educational Services
Health Care and Social Assitance
Retail and Wholesale Trade
-4.00 -3.00 -2.00 -1.00 0.00 1.00 2.00 3.00
-2.75
-1.46
-0.58
-0.34
-0.32
-0.14
-0.14
0.15
1.00
1.09
1.99
2.50
Losers (jobs) Gainers (jobs)
Construction
Local Government
Information
Source: U.S. Department of Labor CES data and the Old Dominion University Economic Forecasting Project. Not seasonally adjusted. Data will be revised in March 2015
.
Federal and State Government
Manufacturing
Transportation and Warehousing
Professional and Business Services

20
Performance of Hampton Roads Economy through November 2014

21
Performance of Hampton Roads EconomyYTD November 2013 and YTD November 2014
YTD Nov.2013
YTD Nov.2014
% Change
Civilian Labor Force 833,856 840,326 +0.78
Employment 783,089 793,111 +1.28
Unemployment 50,767 47,215 -7.00
Unemployment Rate 6.11% 5.62%
Civilian Non-Farm Jobs 752,591 753,591 +0.13
New Auto Registrations 74,118 75,886 +2.39
Taxable Sales $18.45B $18.92B +2.54

22
YTD November 2013 and YTD November 2014Performance of Hampton Roads Economy
YTD Nov.
2013YTD Nov.2014
% Change
Hotel Revenue $630.31M $660.90M +4.85
General Cargo Tonnage** 18.84M 19.06M +1.17
TEU Containers** 2.22M 2.39M +7.62
Number of 1 Unit Housing Permits 3,873 3,470 -10.41
Value of 1 Unit Housing Permits $774.60M $718.44M -7.25
Number of Existing Homes Sold** 18,791 18,700 -0.48
Number of Distressed Homes Sold** 4,947 4,088 -17.36
Median Price of Existing Homes Sold** $190,000 $193,205 +1.69
** Data shown here is for 2013 and 2014

23
Residential Housing Market in Hampton Roads

24
Number of Existing and New Construction Homes SoldHampton Roads: 2002-2014
Year Existing Homes SoldNew Construction
Homes SoldPercent New Construction
2002 19,869 4,969 20.0%
2003 21,421 4,757 18.2%
2004 23,548 4,587 16.3%
2005 24,755 4,379 15.0%
2006 22,405 4,327 16.2%
2007 19,154 3,912 17.0%
2008 15,046 3,178 17.4%
2009 15,851 2,673 14.4%
2010 14,703 2,265 13.4%
2011 15,818 2,366 13.0%
2012 16,856 2,664 13.6%
2013 18,791 2,878 13.3%
2014 18,700 2,485 11.7%
Source: Real Estate Information Network and Old Dominion University Economic Forecasting Project. Information Deemed Reliable But not Guaranteed. Figures reported here represent only those properties that are listed through REIN by REIN members and may not represent all new construction activity in our region. .

25
Median Sale Price of Existing Residential HomesHampton Roads: 2002-2014
Year Median Price Percent change year to year
2002 $116,900 7.3%
2003 $130,000 11.2%
2004 $156,500 20.4%
2005 $192,000 22.7%
2006 $214,900 11.9%
2007 $223,000 3.8%
2008 $219,000 -1.8%
2009 $207,000 -5.5%
2010 $203,900 -1.5%
2011 $180,000 -11.7%
2012 $185,000 +2.78%
2013 $190,000 +2.70%
2014 $193,205 +1.70%
Source: Real Estate Information Network and Old Dominion University Economic Forecasting Project. Information deemed reliable but not guaranteed.
90% increase from 2002-07
19% decreaseFrom 2007-11

26
Distribution of Existing Home Sales by Type of FinancingHampton Roads: 1995-2014
19951996
19971998
19992000
20012002
20032004
20052006
20072008
20092010
20112012
20132014
0%
10%
20%
30%
40%
50%
60%
70%
80%
90%
FHA
VA
CONV
cash
Source: Real Estate Information Network and Old Dominion University Economic Forecasting Project. Information Deemed Reliable But not Guaranteed.

Existing Residential Homes Sold and Average Days on the MarketHampton Roads: 2000-2014
27Source: Real Estate Information Network Inc. and the Old Dominion University Economic Forecasting Project. Information deemed reliable but not guaranteed. Days on Market is calculated from the date listed to the date under contract date for existing homes sold.
17,05818,924
23,548 24,755
19,154
15,046
15,851
14,703
15,818 16,85618,791
18,70067
61
27 28
65
83 88 88
10297
88 84
0
5,000
10,000
15,000
20,000
25,000
30,000
2000 2001 2002 2003 2004 2005 2006 2007 2008 2009 2010 2011 2012 2013 201414703 Average Days on Market

Jan Feb Mar Apr May Jun Jul Aug Sep Oct Nov Dec0
2,000
4,000
6,000
8,000
10,000
12,000
14,000
16,000
2007 2010 2014
28
Estimated Inventory of Existing Residential Homes as Measured by Active Listings
Hampton Roads: 2007, 2010, and 2014
Source: Real Estate Information Network Inc. and the Old Dominion University Economic Forecasting Project. Information deemed reliable but not guaranteed.
Average ( Jan. 1995 through December 2014) = 7,814
1996 1997 1998 1999 2000 2001 2002 2003 2004 2005 2006 2007 2008 2009 2010 2011 2012 2013 20140
2
4
6
8
10
12
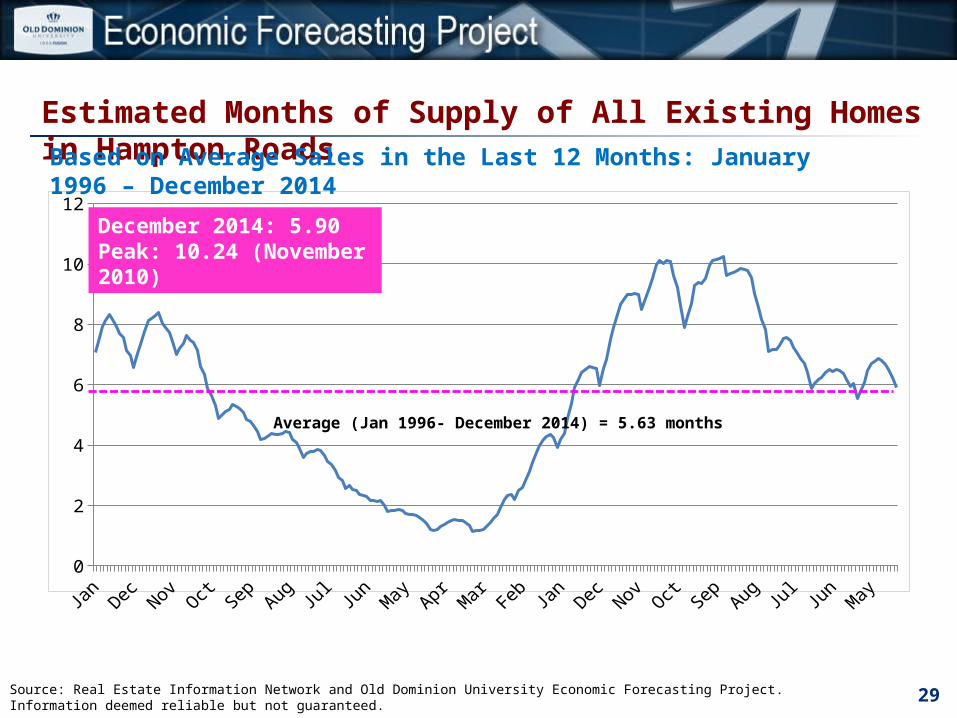
Estimated Months of Supply of All Existing Homes in Hampton RoadsBased on Average Sales in the Last 12 Months: January 1996 – December 2014
29Source: Real Estate Information Network and Old Dominion University Economic Forecasting Project. Information deemed reliable but not guaranteed.
Average (Jan 1996- December 2014) = 5.63 months
December 2014: 5.90Peak: 10.24 (November 2010)

30
Summary on Existing Homes
• Inventories have decreased substantially since 2010. • Days on Market have also decreased.• Sales volume of Homes have increased. • Supply of homes currently is at 5.90 months, slightly higher
than historic average of 5.63 months. • But the median price of homes have increased only slightly:
2.8 % in 2012, 2.7 % in 2013, and only 1.7 % in 2014.• The explanation lies in distressed market– Short sales and
bank owned homes (REOs).

Jun-08
Sep-08
Dec-08
Mar-0
9
Jun-09
Sep-09
Dec-09
Mar-1
0
Jun-10
Sep-10
Dec-10
Mar-1
1
Jun-11
Sep-11
Dec-11
Mar-1
2
Jun-12
Sep-12
Dec-12
Mar-1
3
Jun-13
Sep-13
Dec-13
Mar-1
4
Jun-14
Sep-14
Dec-14
0%
5%
10%
15%
20%
25%
30%
35%
Active Listing of Distressed Homes (REO & Short Sales)As a Percentage of Total Existing Residential Homes Listings in Hampton Roads
31Source: Real Estate Information Network (REIN) and the Old Dominion University Economic Forecasting Project.
December 2014: 19.62%Peak: 29.23% (December 2012)

Jun-08
Sep-08
Dec-08
Mar-0
9
Jun-09
Sep-09
Dec-09
Mar-1
0
Jun-10
Sep-10
Dec-10
Mar-1
1
Jun-11
Sep-11
Dec-11
Mar-1
2
Jun-12
Sep-12
Dec-12
Mar-1
3
Jun-13
Sep-13
Dec-13
Mar-1
4
Jun-14
Sep-14
Dec-14
0%
5%
10%
15%
20%
25%
30%
35%
40%
45%
Sales of Distressed Homes (REO & Short Sales)As a Percentage of Total Existing Residential Homes Sold in Hampton Roads
32Source: Real Estate Information Network (REIN) and the Old Dominion University Economic Forecasting Project.
December 2014: 21.5%Peak: 42.8% (March 2011)

Number of Existing Short Sale and REOs Residential Homes Sold
Hampton Roads: 2006- 2014
33Source: Real Estate Information Network and Old Dominion University Economic Forecasting Project. Information Deemed Reliable But not Guaranteed.
Year All Sales
2006 22,405
2007 19,152
2008 15,047
2009 15,849
2010 14,696
2011 15,817
2012 16,856
2013 18,791
2014 18,700
Short SalesPercent
Short Sales
3 <1%
40 <1%
217 1.4
598 3.8
784 5.3
1,127 7.1
1,644 9.8
1,769 9.4
1,347 7.2
REO SalesPercent
REO Sales
56 <1%
223 1.2
833 5.5
2,271 14.3
3,021 20.6
4,213 26.6
3,337 19.8
3,178 16.9
2,744 14.7

Average Price of Existing Short Sale, REOs, and Non-Distressed Residential Homes SoldHampton Roads: 2006-2014
34Source: Real Estate Information Network and Old Dominion University Economic Forecasting Project. Information Deemed Reliable But not Guaranteed. REOs represent Bank Owned Homes..
YearNon-Distressed
Sales
2006 $250,254
2007 $261,723
2008 $255,852
2009 $243,902
2010 $251,572
2011 $236,358
2012 $237,215
2013 $245,344
2014 $244,940
Short Sales
Short Sales Price % Non-
Distressed Price
$241,666 96.6
$237,897 90.9
$239,110 93.5
$239,913 98.4
$231,211 91.9
$212,967 90.1
$187,527 79.1
$180,001 73.4
$171,745 70.1
REO SalesREO Price %
Non-DistressedSales
$120,817 48.3
$163,421 62.4
$184,462 72.1
$164,229 67.3
$151,612 60.3
$135,304 57.3
$134,535 56.7
$131,644 53.7
$128,242 52.4

35
Number of New Construction Residential Homes SoldHampton Roads: 2002-2014
Year Number SoldPercent change year to
year
2002 4,969 2.8%
2003 4,757 -4.3%
2004 4,587 -3.6%
2005 4,379 -4.5%
2006 4,327 -1.2%
2007 3,912 -9.6%
2008 3,178 -18.8%
2009 2,673 -15.9%
2010 2,265 -15.3%
2011 2,366 4.5%
2012 2,664 12.6%
2013 2,878 8.0%
2014 2,485 -13.7%
Source: Real Estate Information Network and Old Dominion University Economic Forecasting Project. Information Deemed Reliable But not Guaranteed. Figures reported here represent only those properties that are listed through REIN by REIN members and may not represent all new construction activity in our region.
54% decreaseFrom 2002-10

36
Median Sale Price of New Construction Residential HomesHampton Roads: 2002-2014
Year Median Price Percent change year to year
2002 $186,415 9.1%
2003 $220,490 18.3%
2004 $260,000 17.9%
2005 $333,280 28.2%
2006 $349,900 5.0%
2007 $335,348 -4.2%
2008 $299,900 -10.6%
2009 $283,615 -5.4%
2010 $289,900 2.2%
2011 $276,755 -4.5%
2012 $273,950 -1.0%
2013 $286,218 4.5%
2014 $291,830 2.0%
Source: Real Estate Information Network and Old Dominion University Economic Forecasting Project. Information Deemed Reliable But not Guaranteed. Figures reported here represent only those properties that are listed through REIN by REIN members and may not represent all new construction activity in our region
22% decreaseFrom 2006-12

1996 1997 1998 1999 2000 2001 2002 2003 2004 2005 2006 2007 2008 2009 2010 2011 2012 2013 20140
2
4
6
8
10
12
14
9.23
Estimated Months of Supply of New Construction Homes in Hampton Roads
Based on Average Sales in the Last 12 Months: January 1996 – December 2014
37Source: Real Estate Information Network and Old Dominion University Economic Forecasting Project. Information deemed reliable but not guaranteed.
Average (Jan 1996- December 2014) = 6.78 months

38
Estimated House Rental and Principal, Interest, and Taxes for a House Payment
Hampton Roads: 2001-2014
Source: H.U.D. and the Old Dominion University Economic Forecasting Project. It is assumed that real estate tax rate is 1% and the tax reduction received by home owners would compensate for home owners insurance and maintenance expenditures.
YearMedian Monthly Rent for a Three Bedroom House
PI&T Monthly for a Median Priced Existing House
Ratio of Monthly Rent to PI&T
2001 $ 882 836 1.05
2002 911 861 1.06
2003 1,037 890 1.16
2004 1,044 1,073 0.97
2005 1,087 1,315 0.83
2006 1,118 1,533 0.73
2007 1,164 1,598 0.73
2008 1,247 1,507 0.83
2009 1,236 1,307 0.95
2010 1,277 1,233 1.04
2011 1,319 1,071 1.23
2012 1,454 1,015 1.43
2013 1,570 1,080 1.45
2014 1,562 1,124 1.39

39
Housing Affordability: Monthly Payment for a Median Price Resale House as a Percent of Median Household Monthly Income
Hampton Roads and the U.S. : 1979 to 2014
36.3
28.0
34.4
27.3
21.522.7
36.0
31.1
20.6
30.6
19.2 18.419.620.6
19.019.9
38.3
20.422.2
27.8
0
5
10
15
20
25
30
35
40
45
1979 1989 1999 2006 2008 2010 2011 2012 2013 2014
Per
cen
t
U.S.
Hampton Roads
Source: The Old Dominion University Economic Forecasting Project. We are estimating that 30 year mortgage rate to be 4.17 Percent for 2014

Median Sale Price of Existing Residential Homes
Selected Cities in Hampton Roads: 2002 and 2007
40
Source: Real Estate Information Network and Old Dominion University Economic Forecasting Project. Information Deemed Reliable But not Guaranteed. * Williamsburg represents Williamsburg, James City County, York County and Gloucester County. ** Median price in Suffolk peaked in 2006 at $263,950
CityMedian Price
2002Median Price
2007% change
Chesapeake $134,900 $250,100 85.4%
Norfolk $ 93,200 $195,000 109.2%
Portsmouth $ 80,300 $165,500 106.1%
Suffolk** $139,900 $257,500 84.1%
Virginia Beach $125,000 $245,000 96.0%
Hampton $ 92,900 $180,000 93.8%
Newport News $105,000 $199,250 89.8%
Williamsburg* $157,325 $284,450 80.8%
Hampton Roads $116,900 $223,000 90.8%

Median Sale Price of Existing Residential Homes
Selected Cities in Hampton Roads: 2007 and 2014
41
Source: Real Estate Information Network and Old Dominion University Economic Forecasting Project. Information Deemed Reliable But not Guaranteed. * Williamsburg represents Williamsburg, James City County, York County and Gloucester County. ** Median price in Suffolk peaked in 2006 at $263,950
CityMedian Price
2007Median Price
2014% change
Chesapeake $250,100 $219,000 -12.4%
Norfolk $195,000 $157,038 -19.5%
Portsmouth $165,500 $115,500 -30.2%
Suffolk** $257,500 $207,900 -19.3%
Virginia Beach $245,000 $229,000 -6.5%
Hampton $180,000 $139,900 -22.3%
Newport News $199,250 $157,900 -20.8%
Williamsburg* $284,450 $257,250 -9.6%
Hampton Roads $223,000 $193,205 -14.8%

Median Sale Price of Existing Residential Homes
Selected Cities in Hampton Roads: 2013 and 2014
42
Source: Real Estate Information Network and Old Dominion University Economic Forecasting Project. Information Deemed Reliable But not Guaranteed. * Williamsburg represents Williamsburg, James City County, York County and Gloucester County.
CityMedian Price
2013Median Price
2014% change
Chesapeake $215,000 $219,000 -1.9%
Norfolk $157,500 $157,038 -0.3%
Portsmouth $108,500 $115,500 6.45%
Suffolk $207,000 $207,900 0.43%
Virginia Beach $223,000 $229,000 2.69%
Hampton $131,000 $139,900 6.79%
Newport News $153,000 $157,900 3.20%
Williamsburg* $263,450 $257,250 -2.35%
Hampton Roads $190,000 $193,205 1.69%

43
2015 Regional Summary
• Look for regional economic growth to be below its half-century annual average of 3.1 percent and below that of the nation.
• Port, health-care industries, and tourism are likely to help the region’s economic expansion in 2015
• Single-family home prices in 2015 are likely to continue to increase at a moderate pace.– Inventories, sale volume, and days-on-market are all moving in the right
direction. Months of supply of existing homes are near their historic average.
• Lingering distressed volume remains a concern– REOs appear to be one of the driving forces behind lower sale prices.