Embed Size (px)
Citation preview
1
Henrique de Campos Meirelles
Febraban – Lima, March 2004
Brazil:
Recent Economic Developments
2
I. The 2002 Confidence Crisis
II. Economic Policy in 2003/2004:
a. Fiscal Responsibility
b. The External Adjustment
b. Disinflation
d. Improving Public Debt Profile
III. Current Outlook of the Brazilian
Economy
IV. Towards Sustained Economic Growth
3
I. The 2002 Confidence Crisis
4
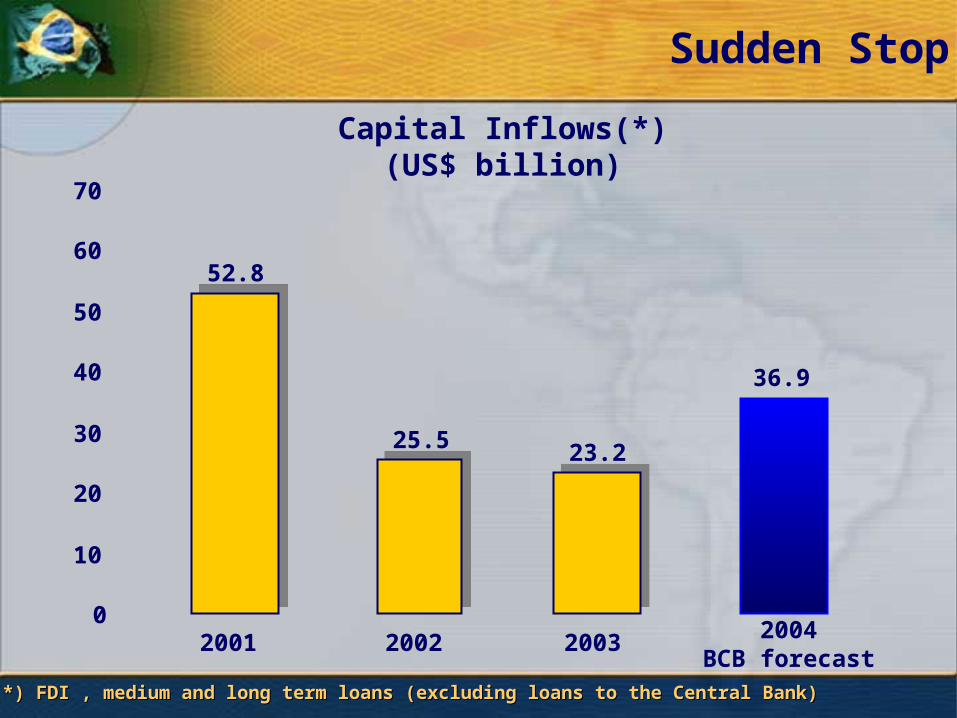
Sudden Stop
Capital Inflows(*)(US$ billion)
(*) FDI , medium and long term loans (excluding loans to the Central Bank)(*) FDI , medium and long term loans (excluding loans to the Central Bank)
52.8
25.5 23.2
36.9
0
10
20
30
40
50
60
70
2001 2002 2003 2004BCB forecast
5
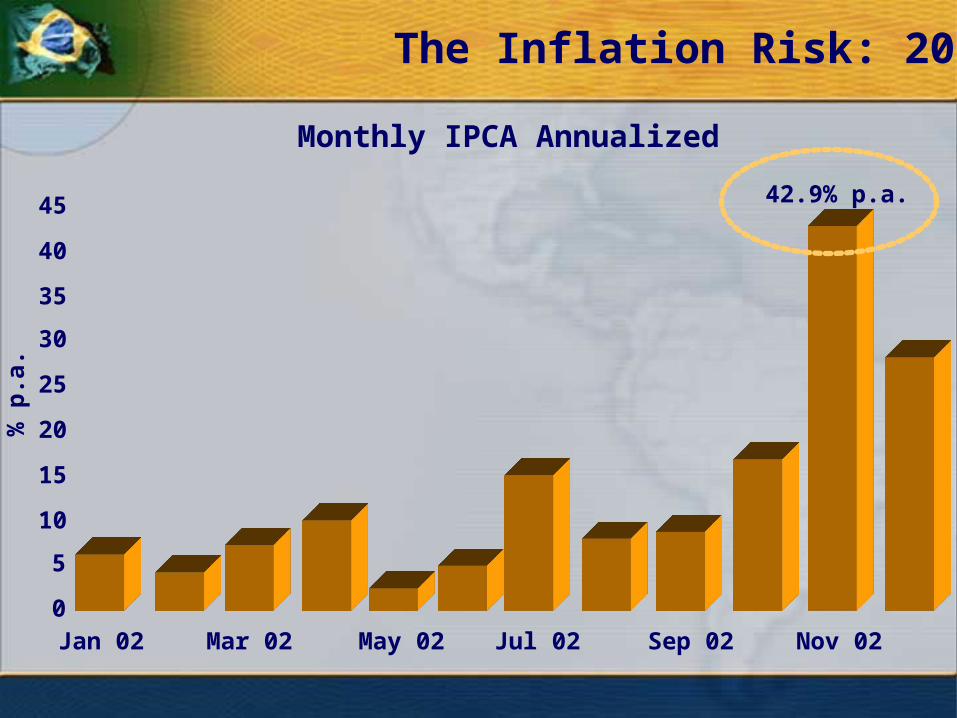
Monthly IPCA Annualized
% p
.a.
0
5
10
15
20
25
30
35
40
45
Jan 02 Mar 02 Nov 02Sep 02Jul 02May 02
42.9% p.a.
The Inflation Risk: 2002
6
II. The Economic Policy in 2003/2004:
a. Fiscal Responsibility
7
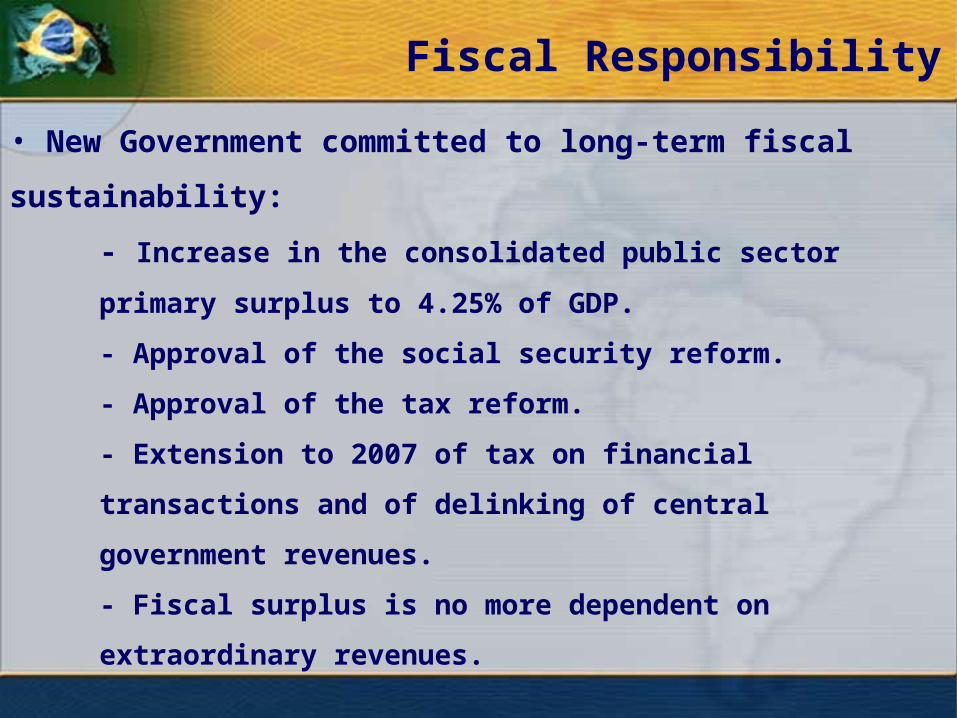
• New Government committed to long-term fiscal sustainability:
- Increase in the consolidated public sector primary surplus to
4.25% of GDP.
- Approval of the social security reform.
- Approval of the tax reform.
- Extension to 2007 of tax on financial transactions and of
delinking of central government revenues.
- Fiscal surplus is no more dependent on extraordinary
revenues.
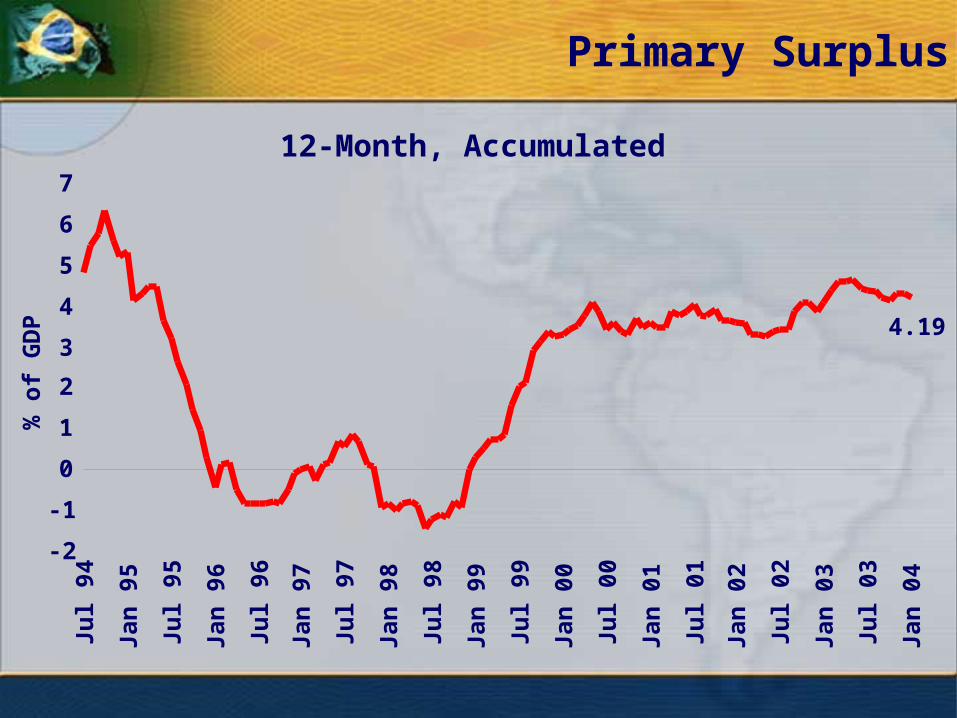
Fiscal Responsibility
8
Primary Surplus
12-Month, Accumulated
% o
f G
DP 4.19
-2
-1
0
1
2
3
4
5
6
7
Jul
94
Jan
95
Jul
95
Jan
96
Jul
96
Jan
97
Jul
97
Jan
98
Jul
98
Jan
99
Jul
99
Jan
00
Jul
00
Jan
01
Jul
01
Jan
02
Jul
02
Jan
03
Jul
03
Jan
04
9
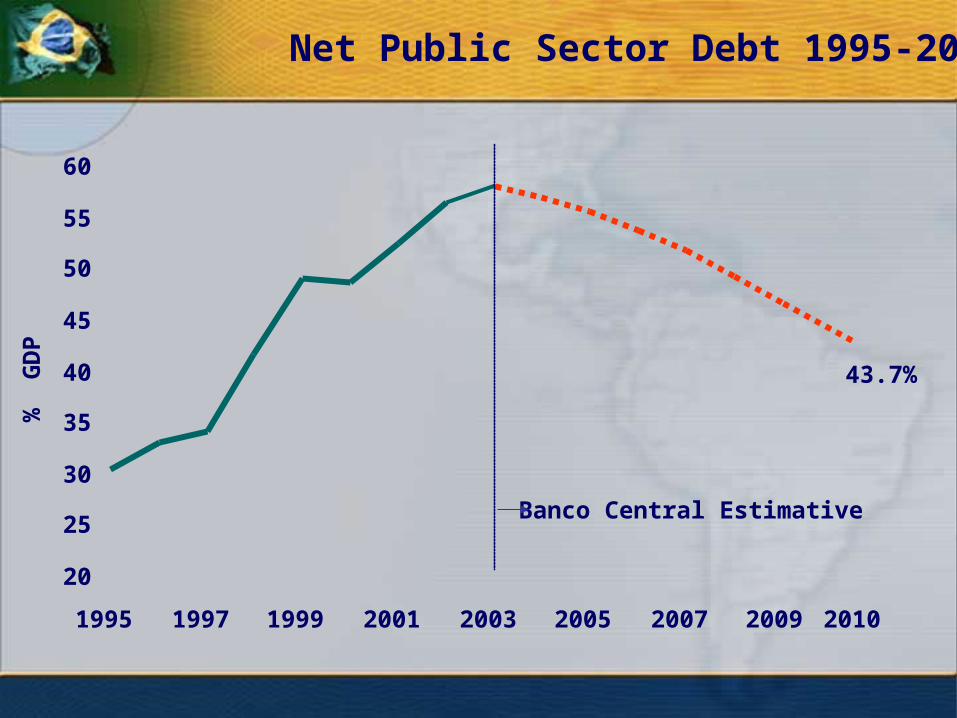
Net Public Sector Debt 1995-2010%
G
DP
20
25
30
35
40
45
50
55
60
1995 1997 1999 2001 2003 2005 2007 2009 2010
43.7%
Banco Central Estimative
10
II. The Economic Policy in 2003/2004:
b. The External Adjustment
11
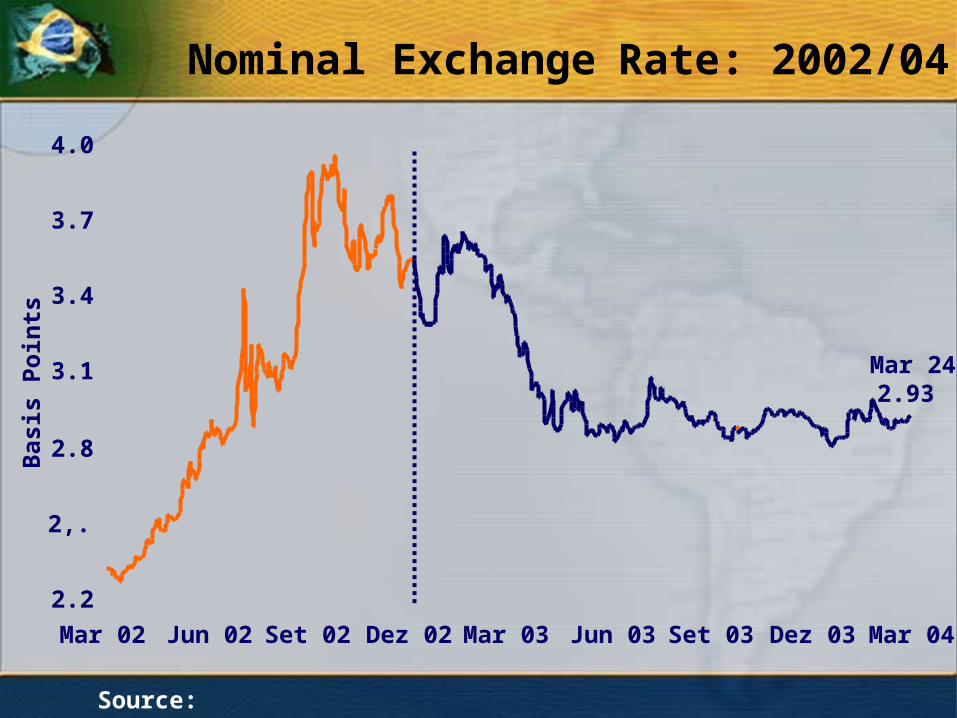
Nominal Exchange Rate: 2002/04
Mar 242.93
Source: Bacen
2.2
2,.
2.8
3.1
3.4
3.7
4.0
Mar 02 Jun 02 Set 02 Dez 02 Mar 03 Jun 03 Set 03 Dez 03 Mar 04
Bas
is P
oin
ts
12
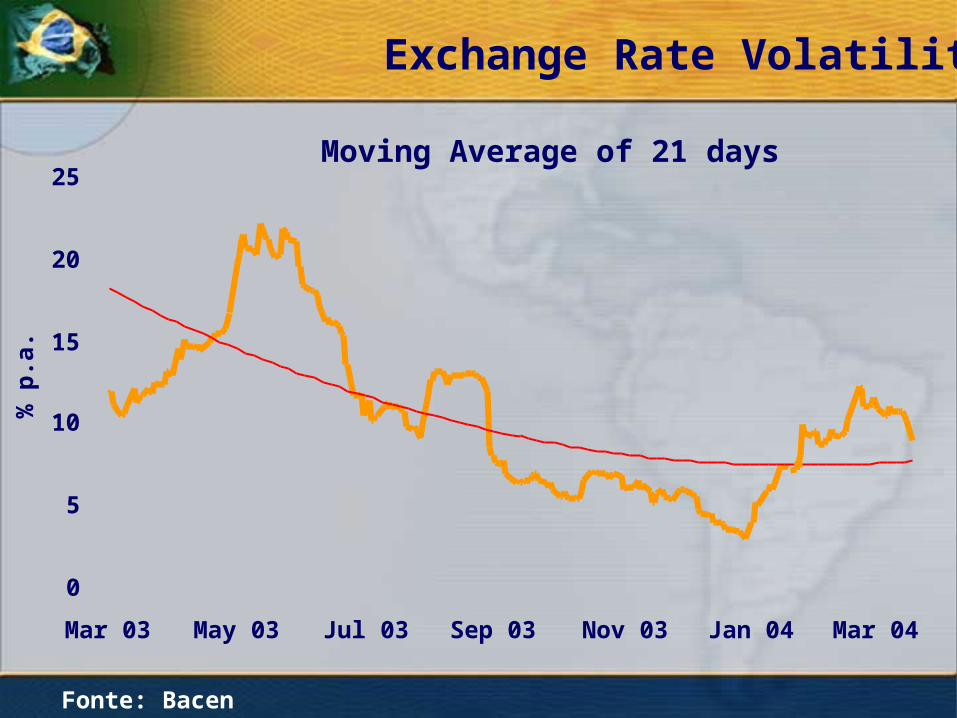
Exchange Rate Volatility
Moving Average of 21 days
% p
.a.
0
5
10
15
20
25
Mar 03 May 03 Jul 03 Sep 03 Nov 03 Jan 04 Mar 04
Fonte: Bacen
13
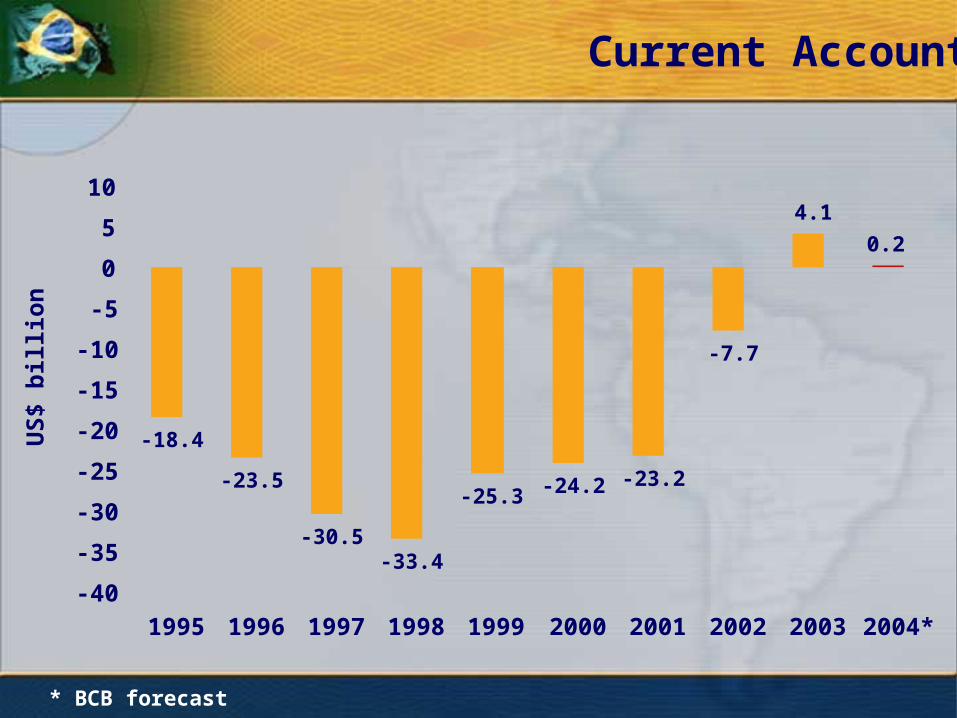
Current AccountU
S$
bil
lio
n
* BCB forecast
-18.4
-23.5
-30.5-33.4
-25.3 -24.2 -23.2
-7.7
4.1
0.2
-40
-35
-30
-25
-20
-15
-10
-5
0
5
10
1995 1996 1997 1998 1999 2000 2001 2002 2003 2004*
14
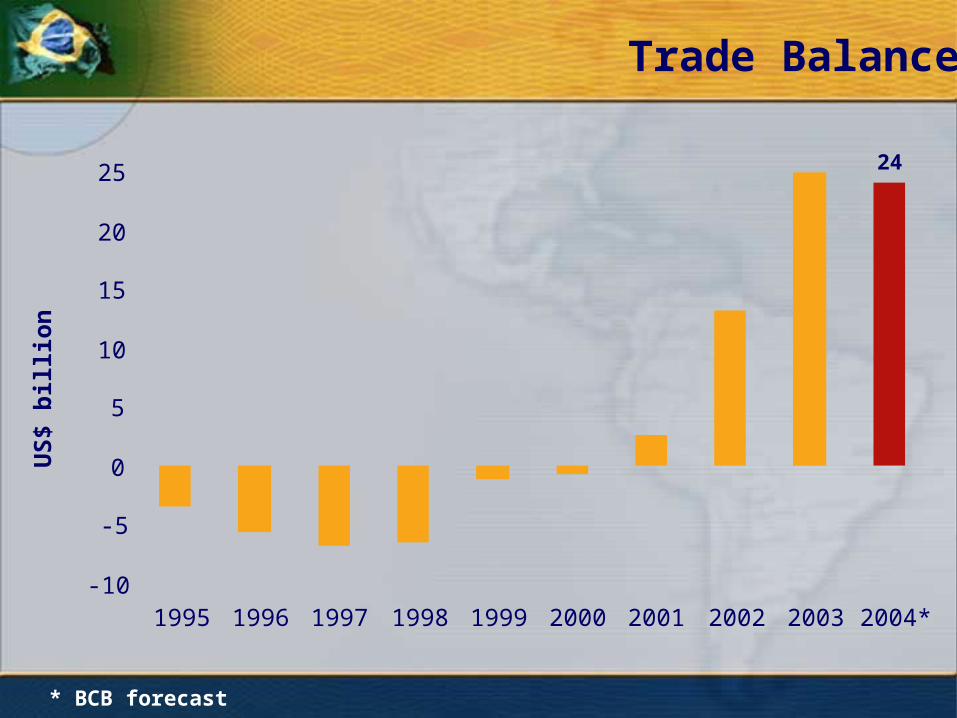
Trade Balance U
S$
bil
lio
n
* BCB forecast
-10
-5
0
5
10
15
20
25
1995 1996 1997 1998 1999 2000 2001 2002 2003 2004*
24
15
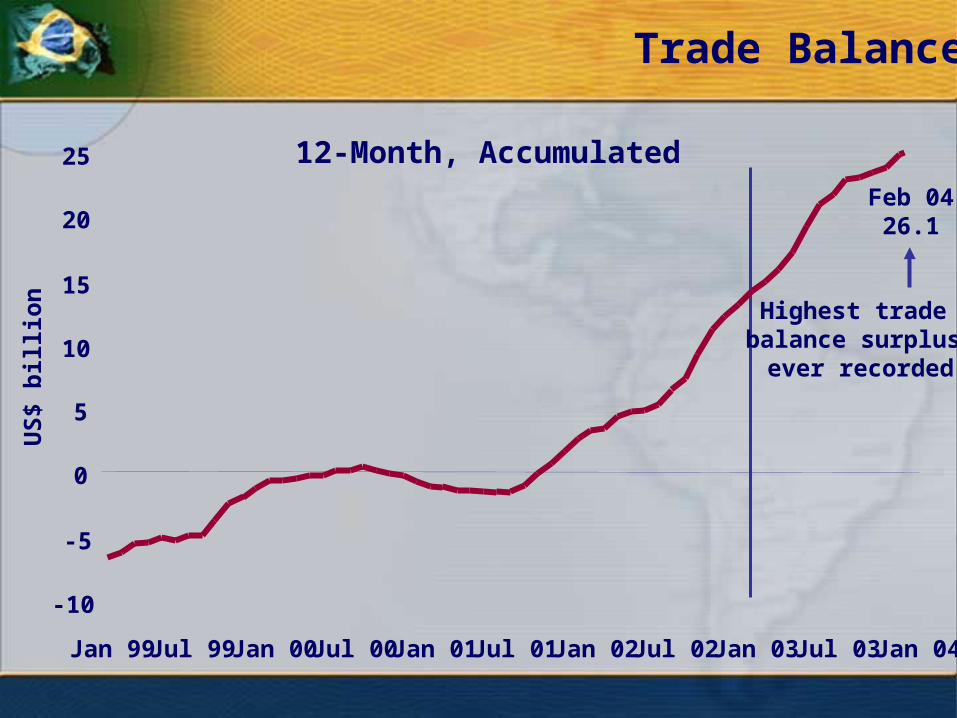
Trade BalanceU
S$
bil
lio
n
Feb 0426.1
12-Month, Accumulated
Highest trade balance surplus
ever recorded
-10
-5
0
5
10
15
20
25
Jan 99 Jul 99 Jan 00 Jul 00 Jan 01 Jul 01 Jan 02 Jul 02 Jan 03 Jul 03 Jan 04
16
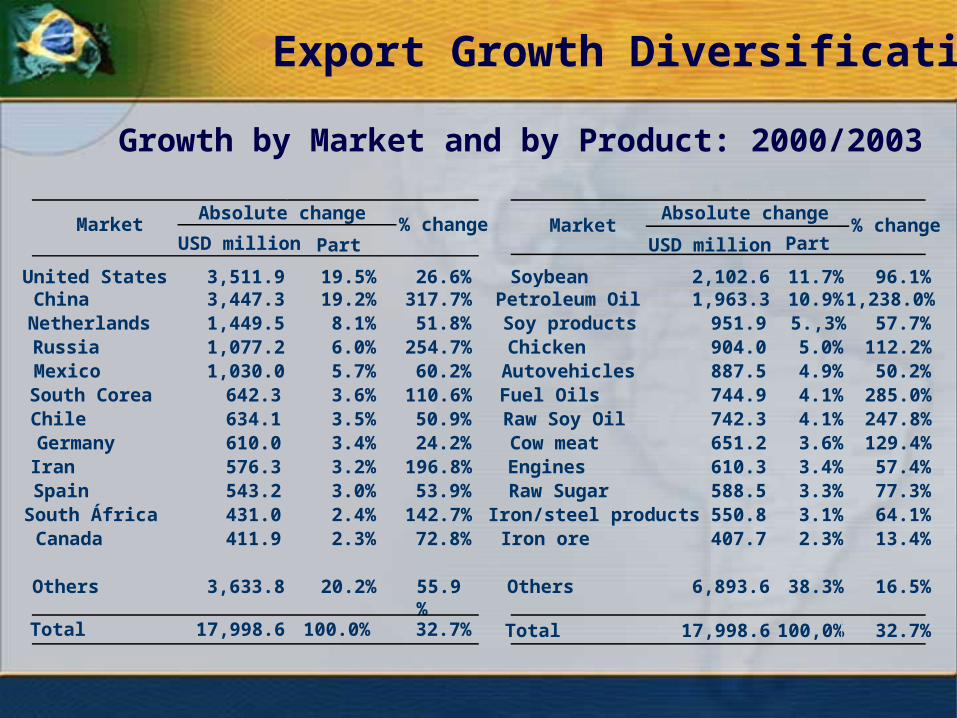
USD million Part
United States 3,511.9 19.5% 26.6%China 3,447.3 19.2% 317.7%Netherlands 1,449.5 8.1% 51.8%
Germany 610.0 3.4% 24.2%
Mexico 1,030.0 5.7% 60.2%
Iran 576.3 3.2% 196.8%Spain 543.2 3.0% 53.9%South África 431.0 2.4% 142.7%
Chile 634.1 3.5% 50.9%
Russia 1,077.2 6.0% 254.7%
South Corea 642.3 3.6% 110.6%
Others 3,633.8 20.2% 55.9%
Total 17,998.6 100.0% 32.7%
% changeAbsolute change
MarketUSD million Part
Soybean 2,102.6 11.7% 96.1%
Iron ore 407.7 2.3% 13.4%
Autovehicles 887.5 4.9% 50.2%
Soy products 951.9 5.,3% 57.7%
Fuel Oils 744.9 4.1% 285.0%
Chicken 904.0 5.0% 112.2%
Raw Soy Oil 742.3 4.1% 247.8%
Engines 610.3 3.4% 57.4%Cow meat 651.2 3.6% 129.4%
Iron/steel products 550.8 3.1% 64.1%
Others 6,893.6 38.3% 16.5%
Total 17,998.6 100,0% 32.7%
% changeMarketAbsolute change
Canada 411.9 2.3% 72.8%
Petroleum Oil 1,963.3 10.9% 1,238.0%
Raw Sugar 588.5 3.3% 77.3%
Export Growth Diversification
Growth by Market and by Product: 2000/2003
17
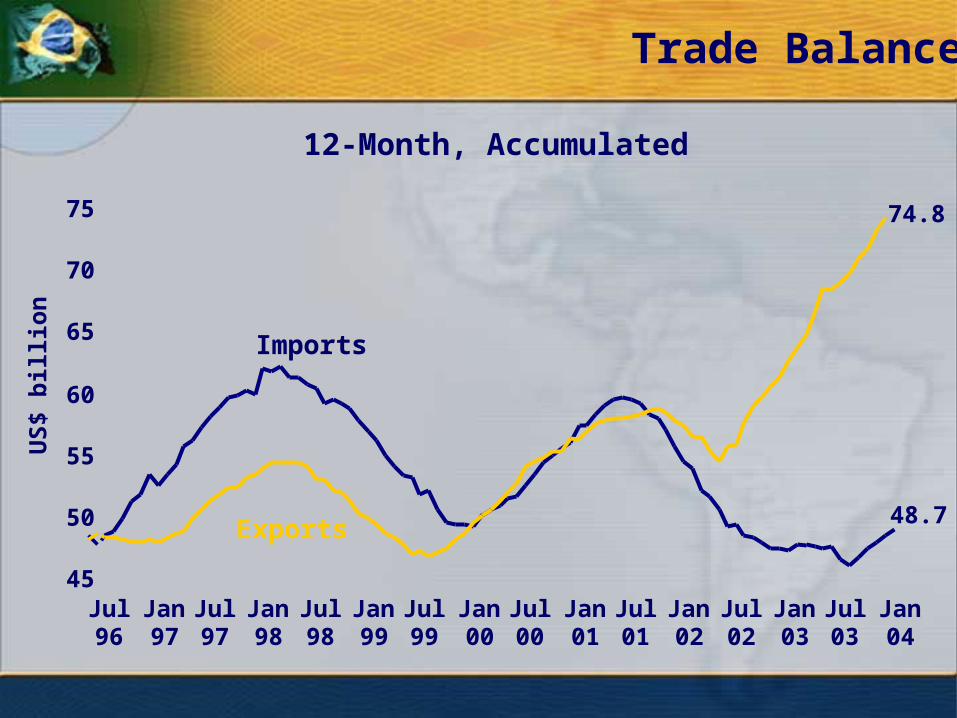
Trade BalanceU
S$
bil
lio
n
12-Month, Accumulated
48.7
74.8
45
50
55
60
65
70
75
Jul96
Jan97
Jul97
Jan98
Jul98
Jan99
Jul99
Jan00
Jul00
Jan01
Jul01
Jan02
Jul02
Jan03
Jul03
Jan04
Imports
Exports
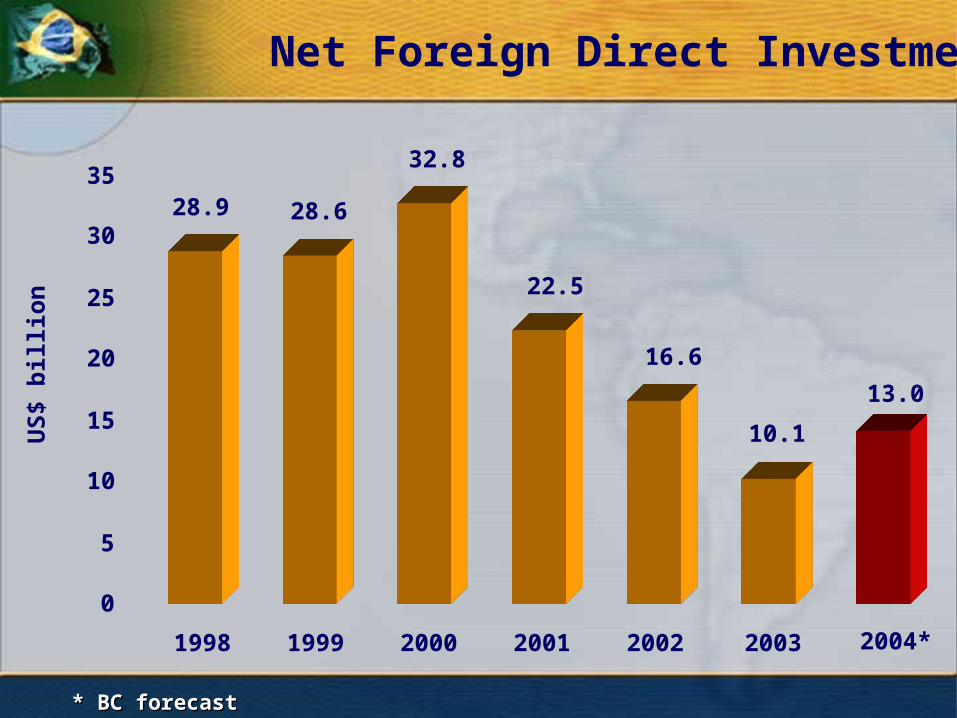
18* BC forecast* BC forecast
Net Foreign Direct InvestmentU
S$
bil
lio
n
28.9 28.6
32.8
22.5
16.6
10.1
0
5
10
15
20
25
30
35
1998 1999 2000 2001 2002 2003
13.0
2004*
19
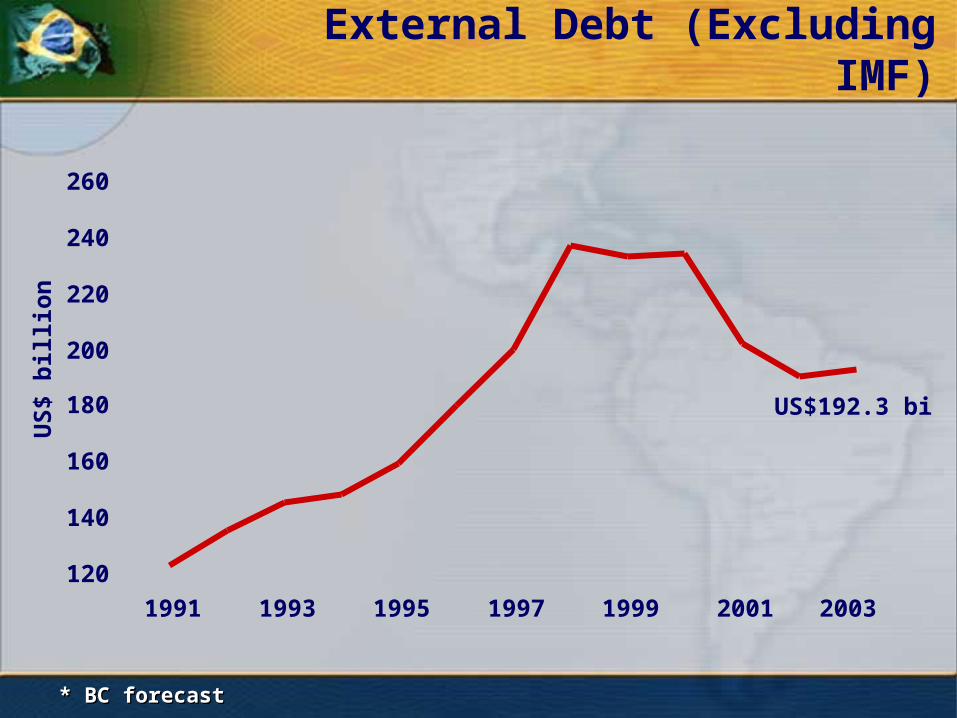
External Debt (Excluding IMF)
US
$ b
illi
on
* BC forecast* BC forecast
US$192.3 bi
120
140
160
180
200
220
240
260
1991 1993 1995 1997 1999 2001 2003
20
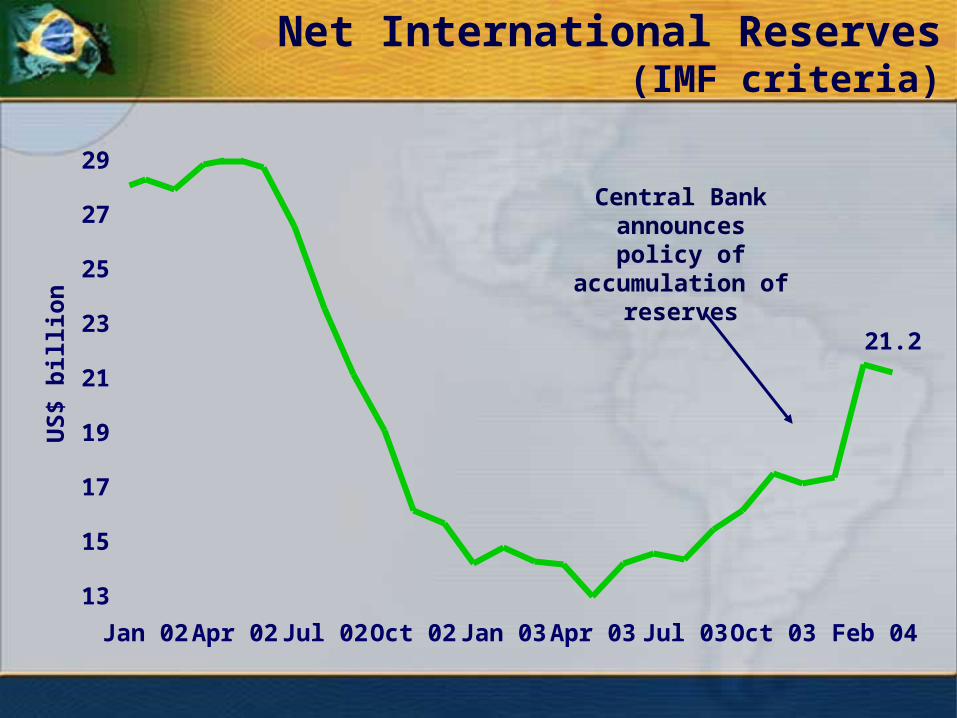
Net International Reserves(IMF criteria)
US
$ b
illi
on
Central Bank announces policy of accumulation of
reserves
13
15
17
19
21
23
25
27
29
Jan 02 Apr 02 Jul 02 Oct 02 Jan 03 Apr 03 Jul 03 Oct 03 Feb 04
21.2
21
II. The Economic Policy in 2003/2004:
c. Disinflation
22
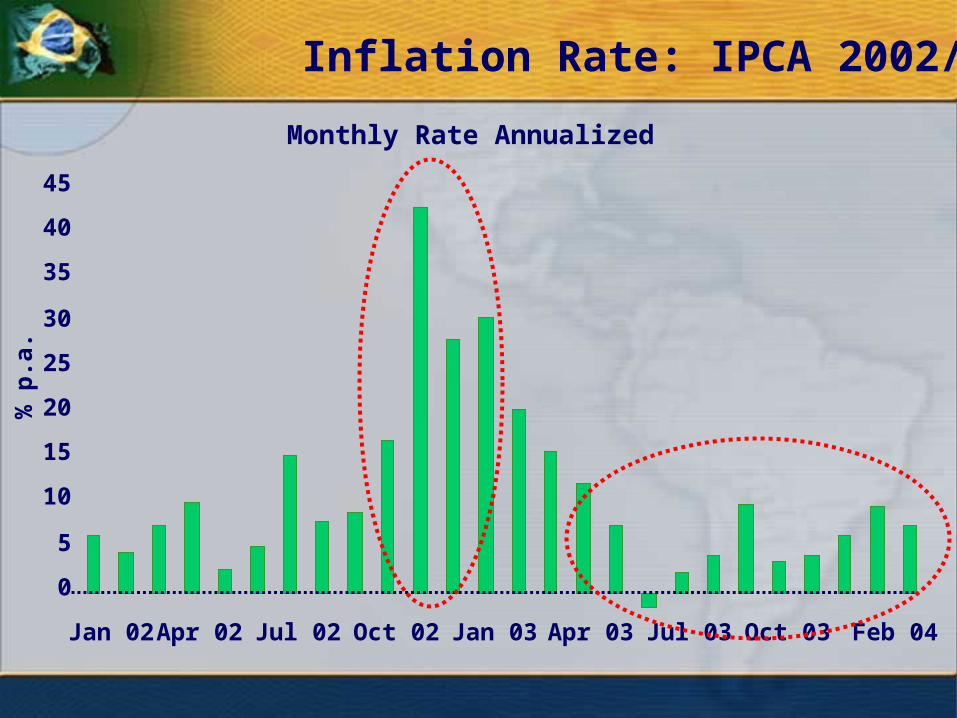
Inflation Rate: IPCA 2002/04
Monthly Rate Annualized
% p
.a.
0
5
10
15
20
25
30
35
40
45
Jan 02 Apr 02 Jul 02 Oct 02 Jan 03 Apr 03 Jul 03 Oct 03 Feb 04
23
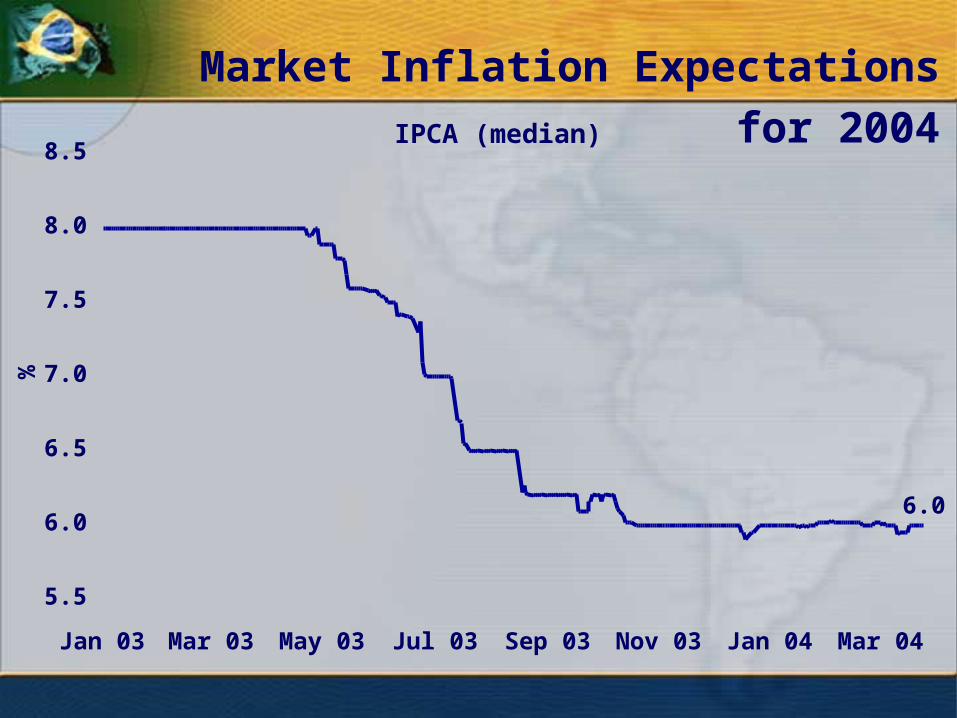
Market Inflation Expectations for 2004IPCA (median)
%
6.0
5.5
6.0
6.5
7.0
7.5
8.0
8.5
Jan 03 Mar 03 May 03 Jul 03 Sep 03 Nov 03 Jan 04 Mar 04
24
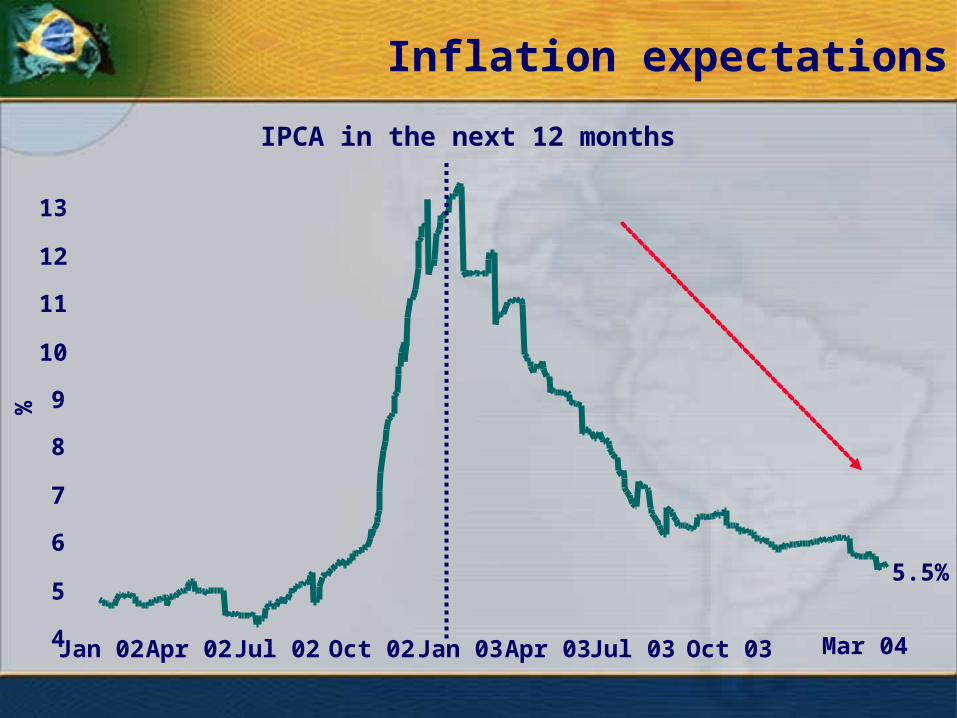
Inflation expectations
IPCA in the next 12 months
Jan 02 Apr 02 Jul 02 Oct 02 Jan 03 Apr 03 Jul 03 Oct 03
5.5%
4
5
6
7
8
9
10
11
12
13
Mar 04
%
25
II. The Economic Policy in 2003/2004:
d. Improving Public Debt Profile
26
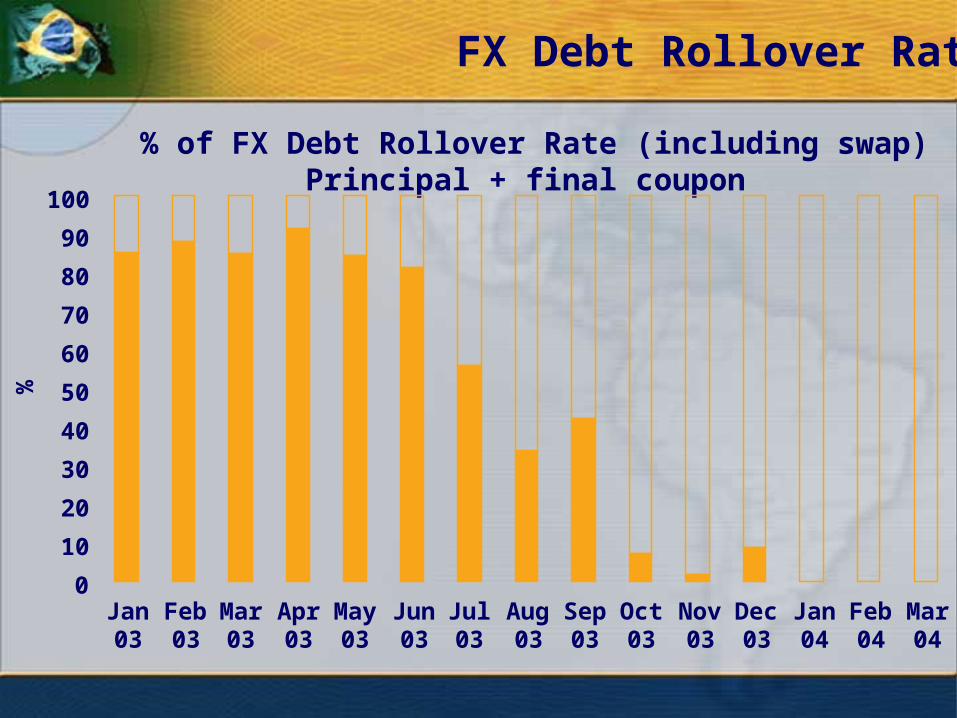
FX Debt Rollover Rate
% of FX Debt Rollover Rate (including swap)Principal + final coupon
%
0
10
20
30
40
50
60
70
80
90
100
Jan03
Feb03
Mar03
Apr03
May03
Jun03
Jul03
Aug03
Sep03
Oct03
Nov03
Dec03
Jan04
Feb04
Mar04
27
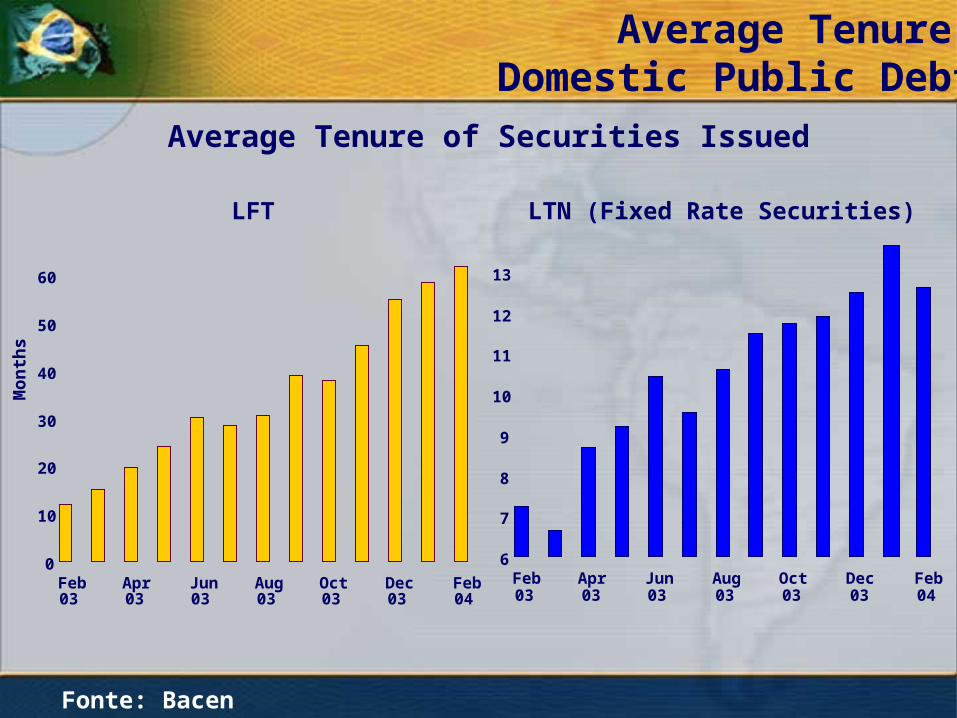
Average Tenure Domestic Public Debt
Fonte: Bacen
Average Tenure of Securities Issued
LTN (Fixed Rate Securities)
Mo
nth
s
LFT
6
7
8
9
10
11
12
13
Feb03
Apr03
Jun03
Aug03
Oct03
Dec03
Feb04
0
10
20
30
40
50
60
Feb03
Apr03
Jun03
Aug03
Oct03
Dec03
Feb04
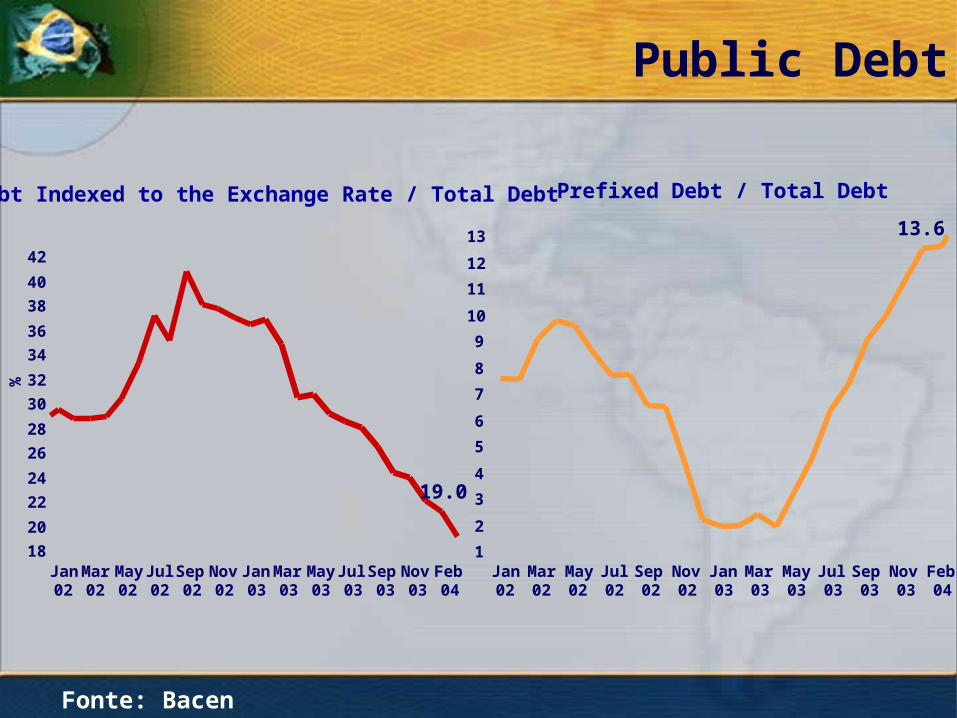
28
19.0
18
20
22
24
26
28
30
32
34
36
38
40
42
Jan02
Mar02
May02
Jul02
Sep02
Nov02
Jan03
Mar03
May03
Jul03
Sep03
Nov03
Feb04
13.6
1
2
3
4
5
6
7
8
9
10
11
12
13
Jan02
Mar02
May02
Jul02
Sep02
Nov02
Jan03
Mar03
May03
Jul03
Sep03
Nov03
Feb04
%
Fonte: Bacen
Public Debt
Debt Indexed to the Exchange Rate / Total Debt Prefixed Debt / Total Debt
29
III. Current Outlook of the Brazilian Economy
30
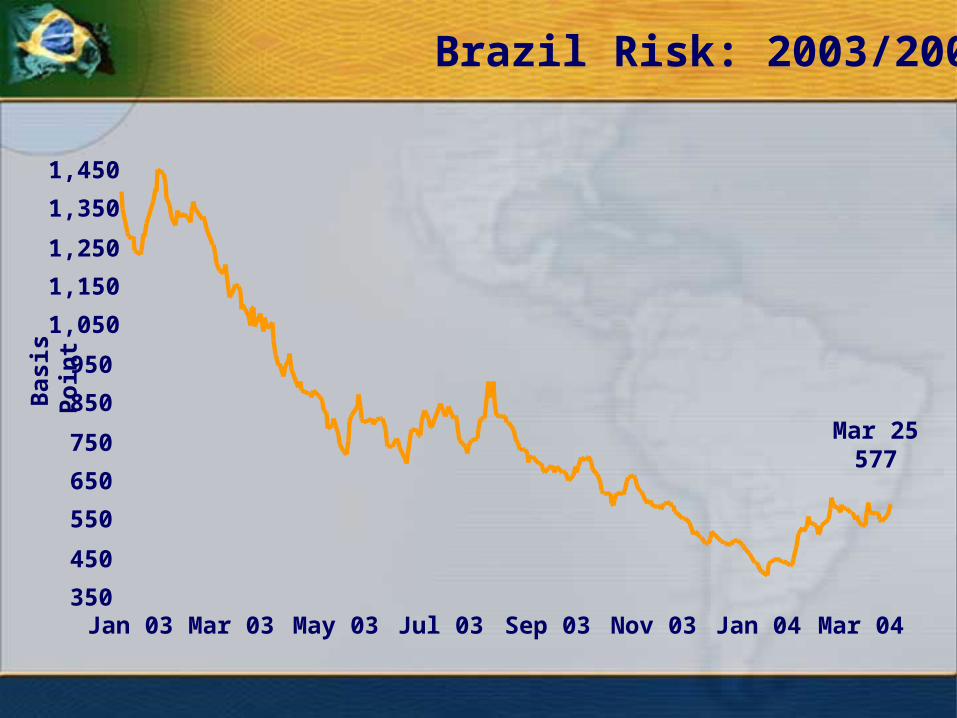
Brazil Risk: 2003/2004B
asis
Po
int
Mar 25577
350
450
550
650
750
850
950
1,050
1,150
1,250
1,350
1,450
Jan 03 Mar 03 May 03 Jul 03 Sep 03 Nov 03 Jan 04 Mar 04
31
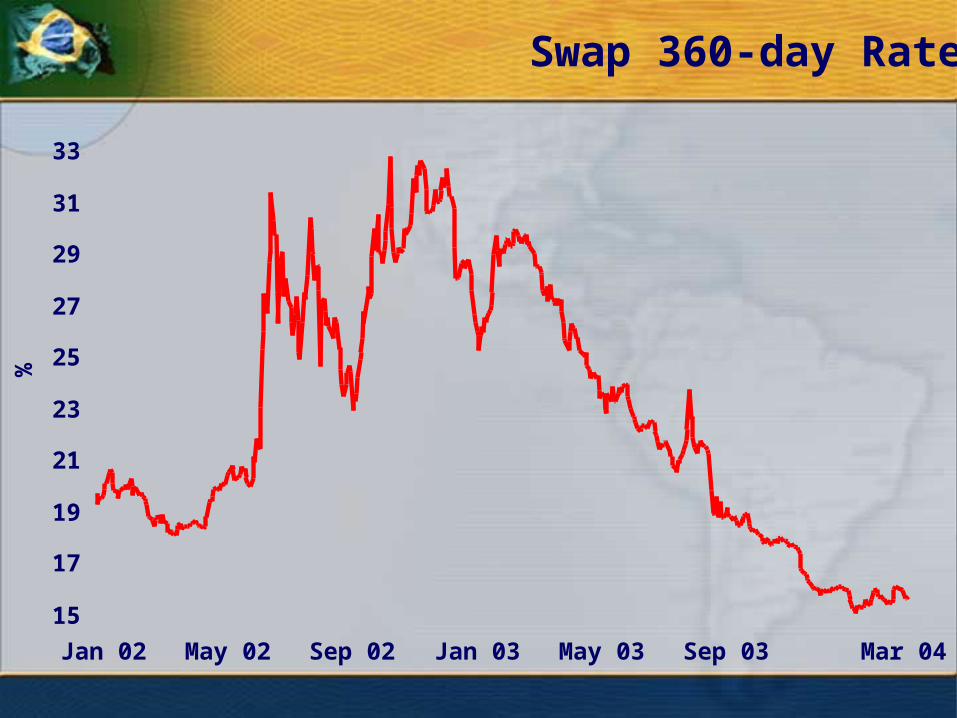
Swap 360-day Rate
15
17
19
21
23
25
27
29
31
33
Jan 02 May 02 Sep 02 Jan 03 May 03 Sep 03 Mar 04
%
32
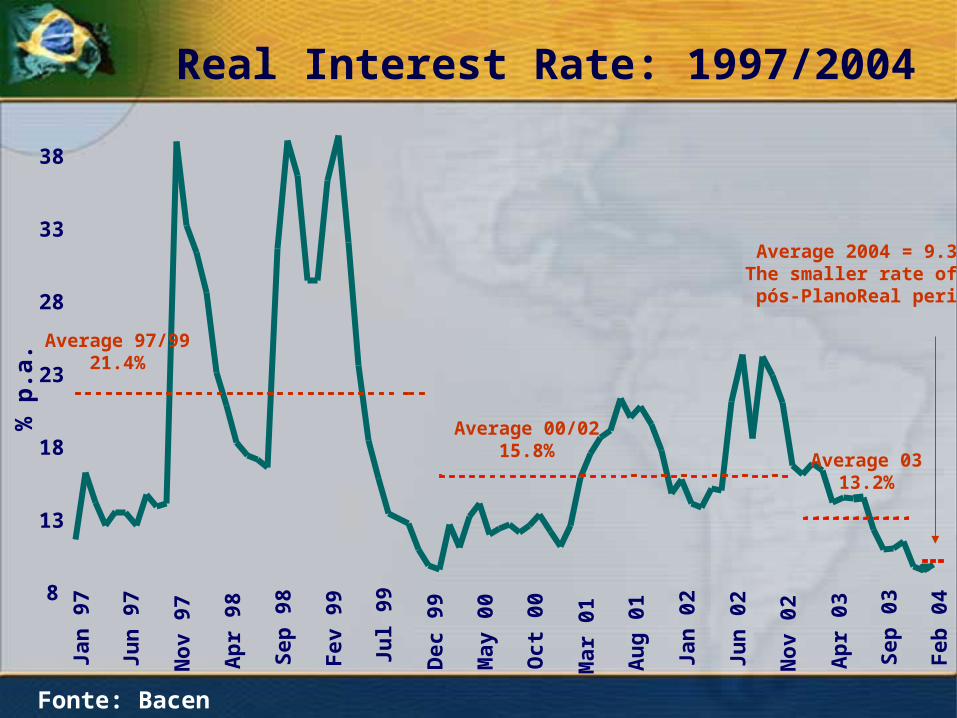
Real Interest Rate: 1997/2004 Ja
n 9
7
Jun
97
No
v 97
Ap
r 98
Sep
98
Fev
99
Jul 9
9
Dec
99
May
00
Oct
00
Mar
01
Au
g 0
1
Jan
02
Jun
02
No
v 02
Ap
r 03
Sep
03
Feb
048
13
18
23
28
33
38
% p
.a.
Average 00/0215.8%
Average 97/9921.4%
Average 0313.2%
Average 2004 = 9.3%The smaller rate of
pós-PlanoReal period
Fonte: Bacen
33
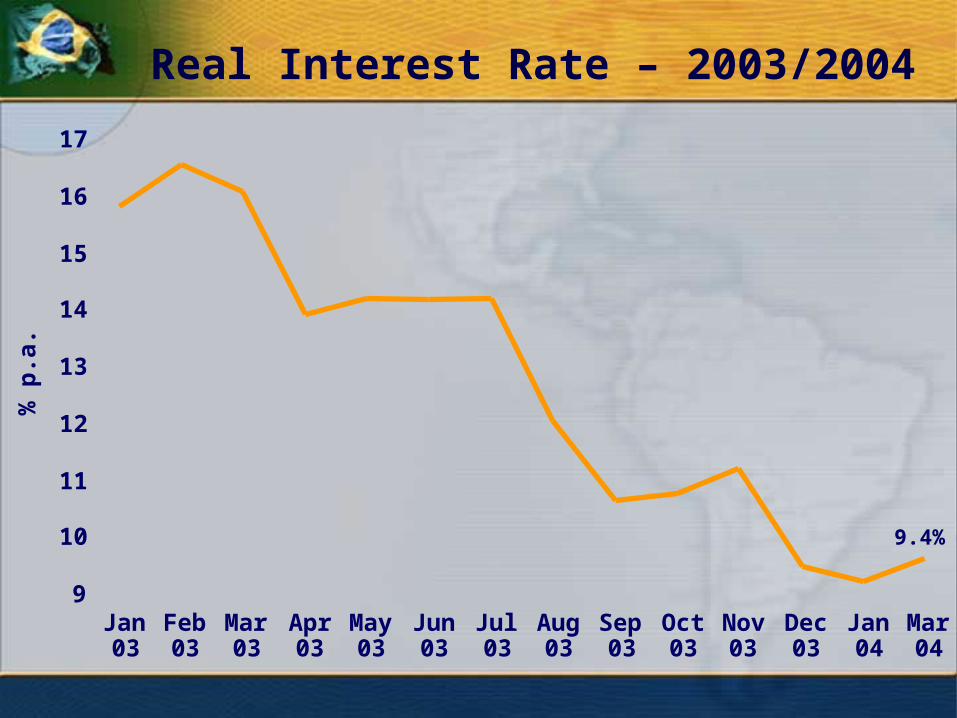
Real Interest Rate – 2003/2004
9
10
11
12
13
14
15
16
17
Jan03
Feb03
Mar03
Apr03
May03
Jun03
Jul03
Aug03
Sep03
Oct03
Nov03
Dec03
Jan04
Mar04
% p
.a.
9.4%
34
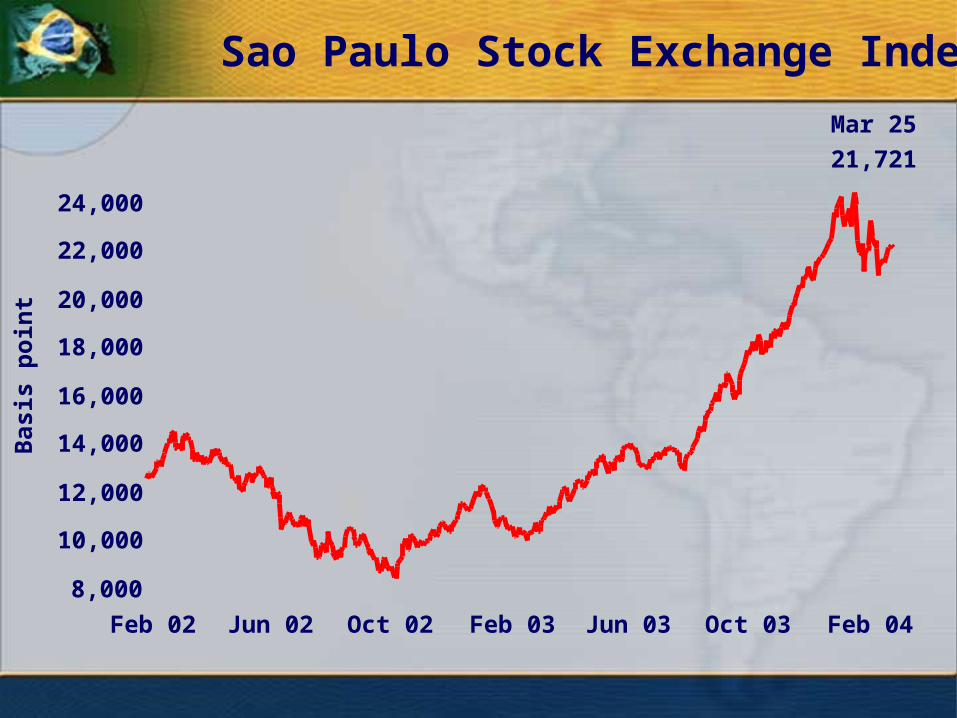
Sao Paulo Stock Exchange IndexB
asis
po
int
Mar 25
21,721
8,000
10,000
12,000
14,000
16,000
18,000
20,000
22,000
24,000
Feb 02 Jun 02 Oct 02 Feb 03 Jun 03 Oct 03 Feb 04
35
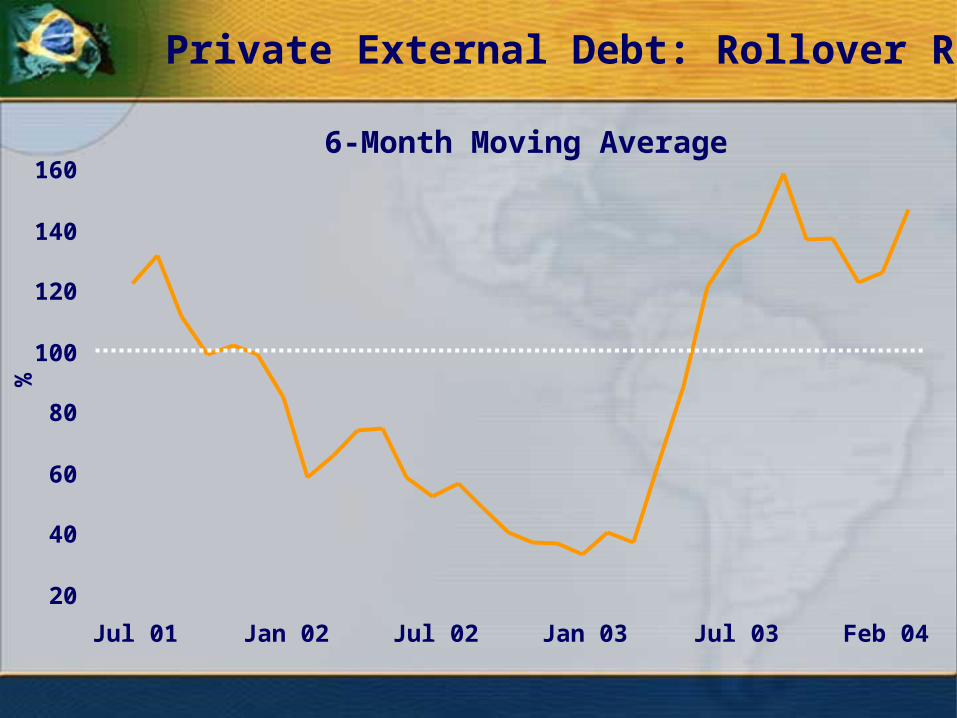
6-Month Moving Average
%
20
40
60
80
100
120
140
160
Jul 01 Jan 02 Jul 02 Jan 03 Jul 03 Feb 04
Private External Debt: Rollover Rate
36
Brazil is currently in much better shape to deal with adverse
external shocks, compared to mid-90s and early-00s:
External adjustment
Fiscal adjustment and structural reforms
Resilience to Shocks
37
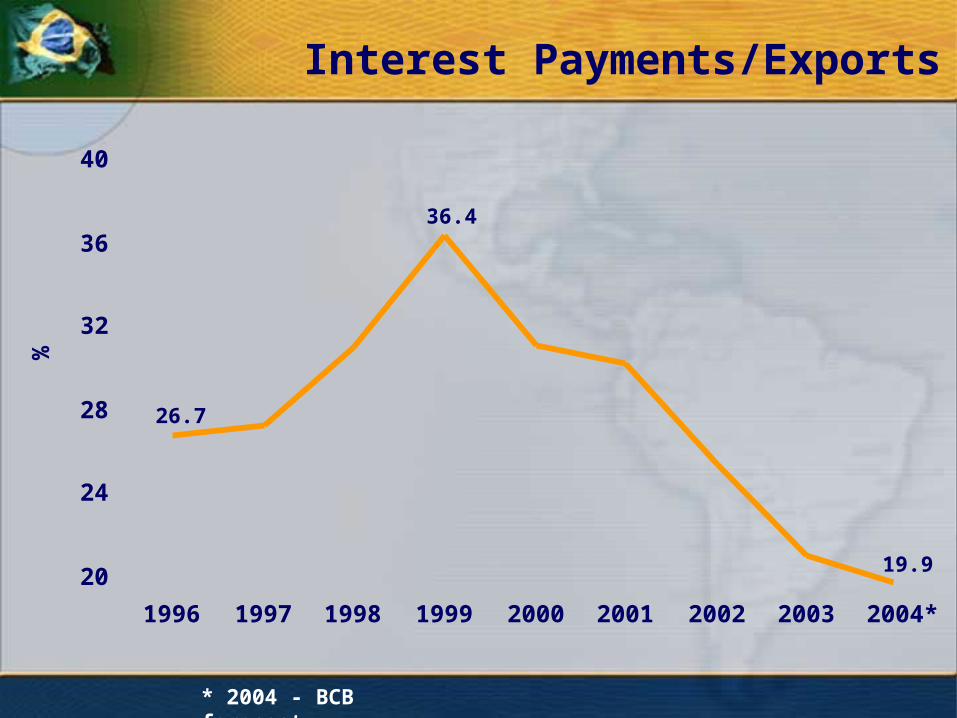
Interest Payments/Exports
20
24
28
32
36
40
1996 1997 1998 1999 2000 2001 2002 2003 2004*
19.9
%
26.7
36.4
* 2004 - BCB forecast
38
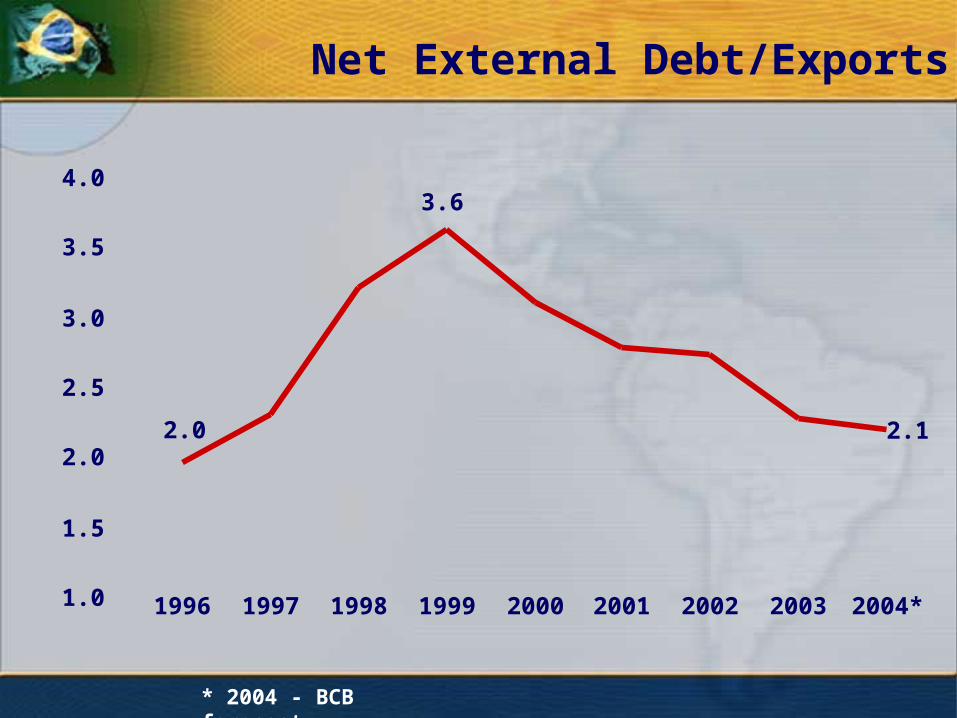
Net External Debt/Exports
2.0
3.6
2.1
1.0
1.5
2.0
2.5
3.0
3.5
4.0
1996 1997 1998 1999 2000 2001 2002 2003 2004*
* 2004 - BCB forecast
39
IV. Towards Sustained Economic Growth
40
110
115
120
125
130
135
Q196
Q396
Q197
Q397
Q198
Q398
Q199
Q399
Q100
Q300
Q101
Q301
Q102
Q302
Q103
Q403
1991
= 1
00
Source: IBGESource: IBGE
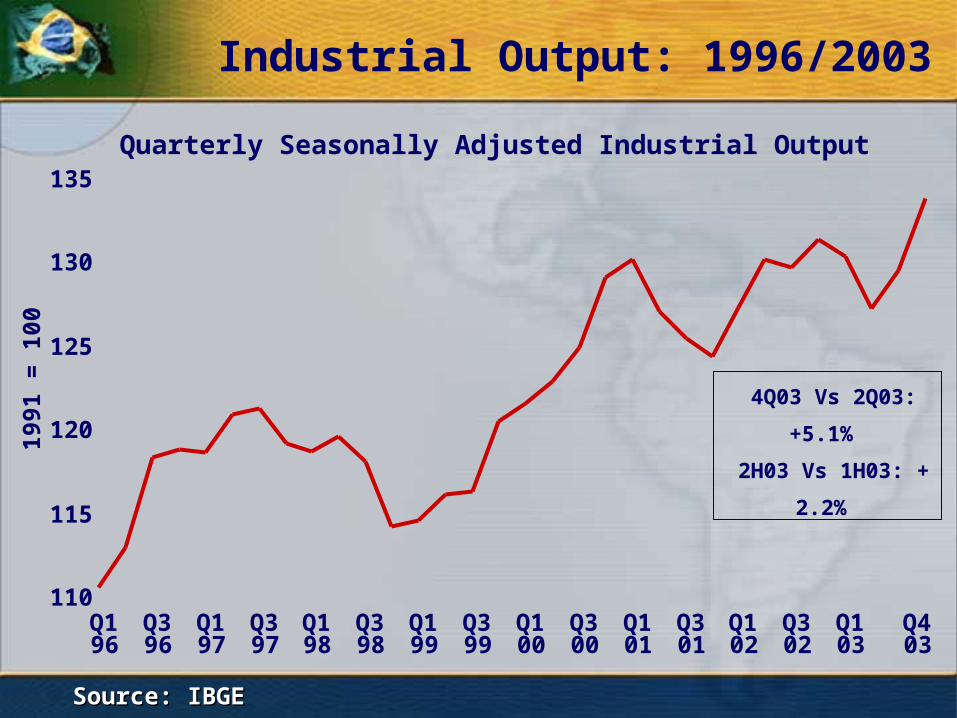
4Q03 Vs 2Q03: +5.1%
2H03 Vs 1H03: + 2.2%
Quarterly Seasonally Adjusted Industrial Output
Industrial Output: 1996/2003
41
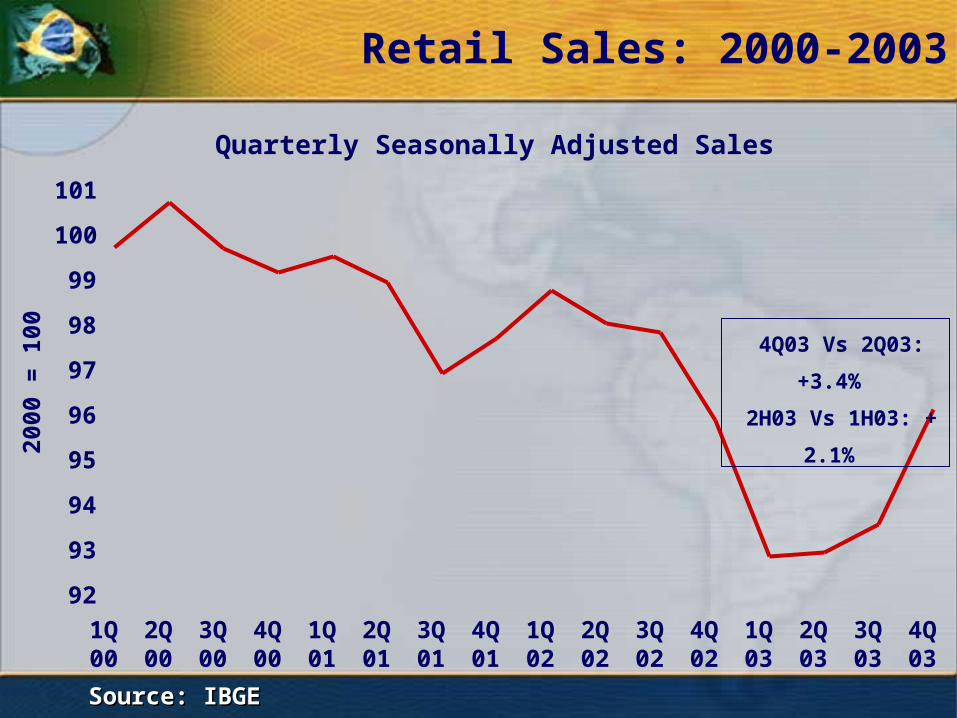
Retail Sales: 2000-2003
Quarterly Seasonally Adjusted Sales
92
93
94
95
96
97
98
99
100
101
1Q00
2Q00
3Q00
4Q00
1Q01
2Q01
3Q01
4Q01
1Q02
2Q02
3Q02
4Q02
1Q03
2Q03
3Q03
4Q03
2000
= 1
00
Source: IBGESource: IBGE
4Q03 Vs 2Q03: +3.4%
2H03 Vs 1H03: + 2.1%
42
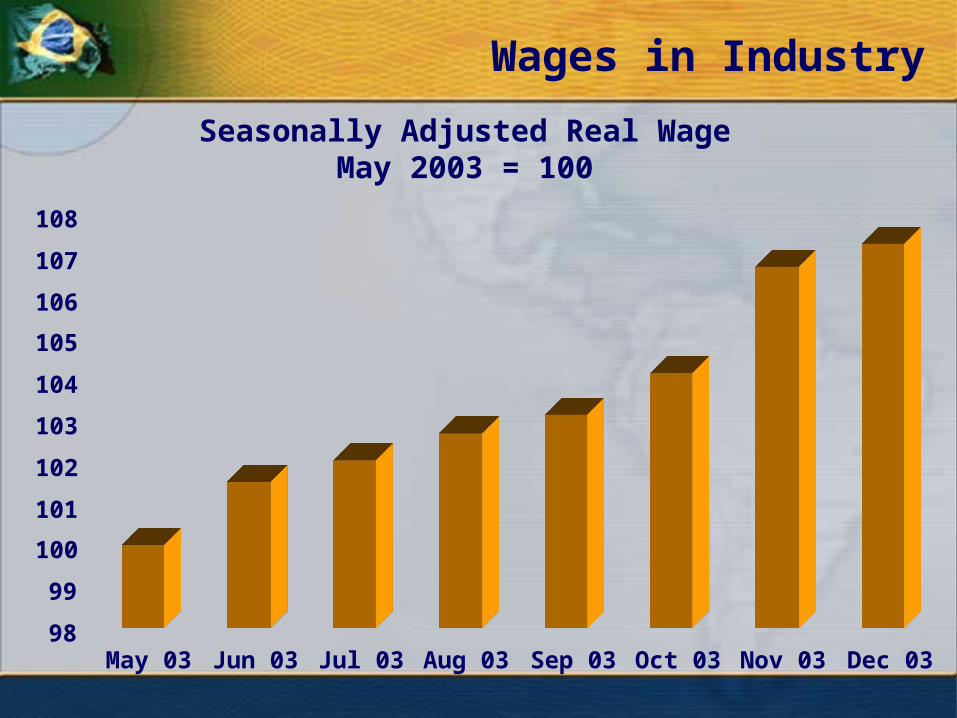
Wages in Industry
Seasonally Adjusted Real WageMay 2003 = 100
98
99
100
101
102
103
104
105
106
107
108
May 03 Jun 03 Jul 03 Aug 03 Sep 03 Oct 03 Nov 03 Dec 03
43
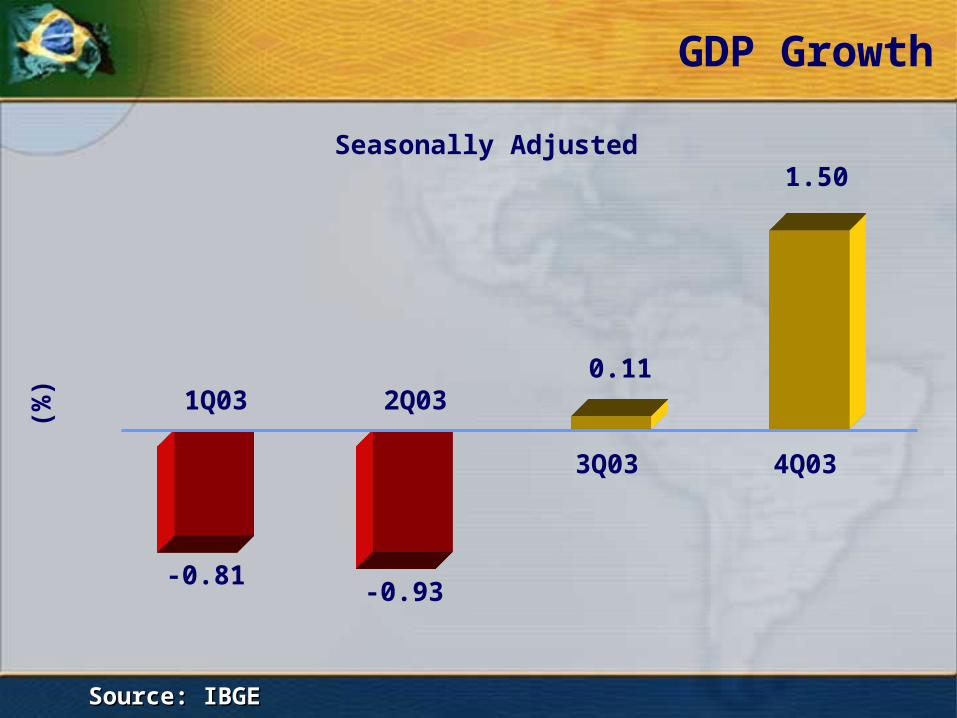
GDP Growth
-0.81-0.93
0.11
1.50
1Q03 2Q03
3Q03 4Q03
(%)
Source: IBGESource: IBGE
Seasonally Adjusted
44
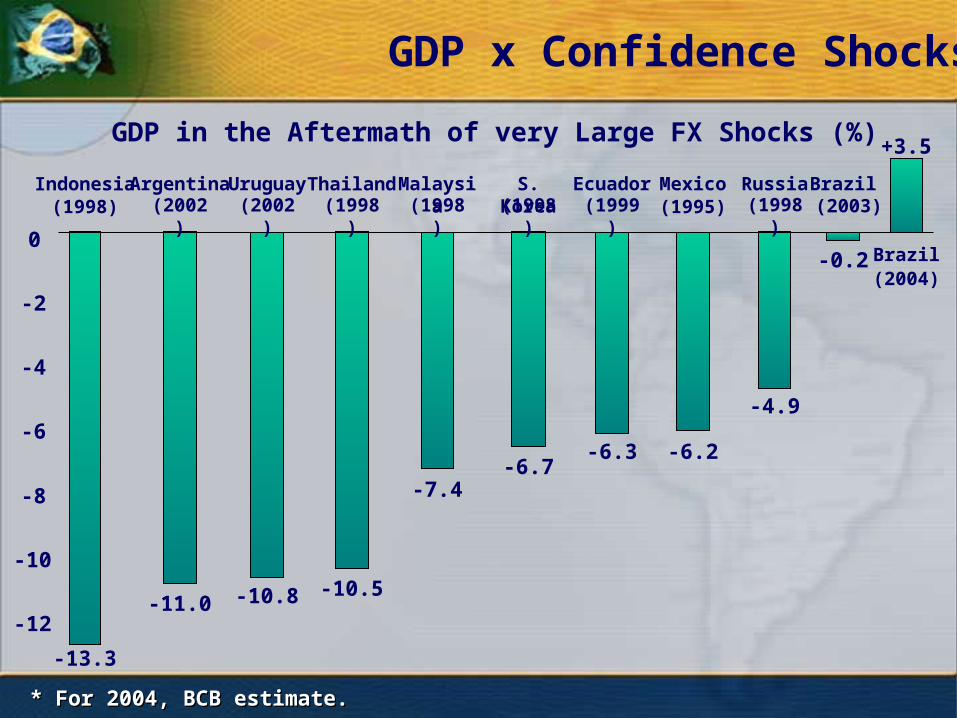
GDP x Confidence Shocks
* For 2004, BCB estimate. * For 2004, BCB estimate.
GDP in the Aftermath of very Large FX Shocks (%)
(2004)
-12
-10
-8
-6
-4
-2
0
Brazil(2003)
Indonesia Thailand S. KoreaMalaysia MexicoEcuadorUruguay Russia(1999) (1995)(2002) (1998) (1998)(1998) (1998)(2002)(1998)
Argentina
-0.2
-4.9
-6.2-6.3-6.7
-7.4
-10.8 -10.5-11.0
-13.3
Brazil
+3.5

45
Henrique de Campos Meirelles
Febraban – Lima, March 2004
Brazil:
Recent Economic Developments