Embed Size (px)
Citation preview
1
How Are We Doing?A Verification Briefing
for the SAWS III Workshop
April 23, 2010Chuck Kluepfel
National Weather Service HeadquartersSilver Spring, Maryland
301-713-0090 x132
[email protected] October 2008
2
Part 1
Traditional
Statistics
3
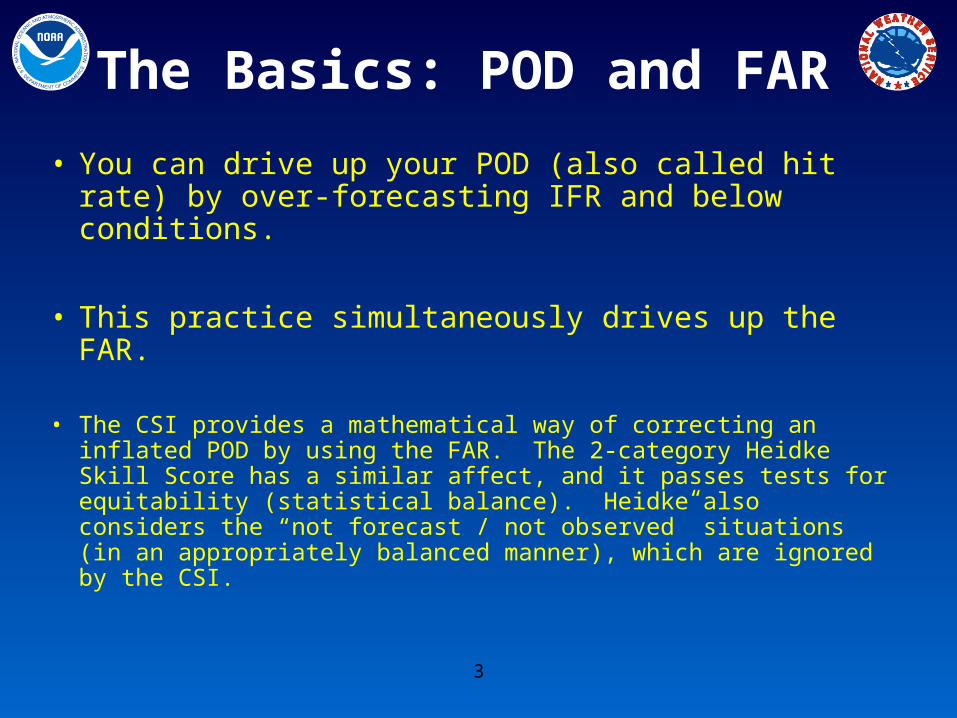
The Basics: POD and FAR
• You can drive up your POD (also called hit rate) by over-forecasting IFR and below conditions.
• This practice simultaneously drives up the FAR.
• The CSI provides a mathematical way of correcting an inflated POD by using the FAR. The 2-category Heidke Skill Score has a similar affect, and it passes tests for equitability (statistical balance). Heidke also considers the “not forecast / not observed” situations (in an appropriately balanced manner), which are ignored by the CSI.
4
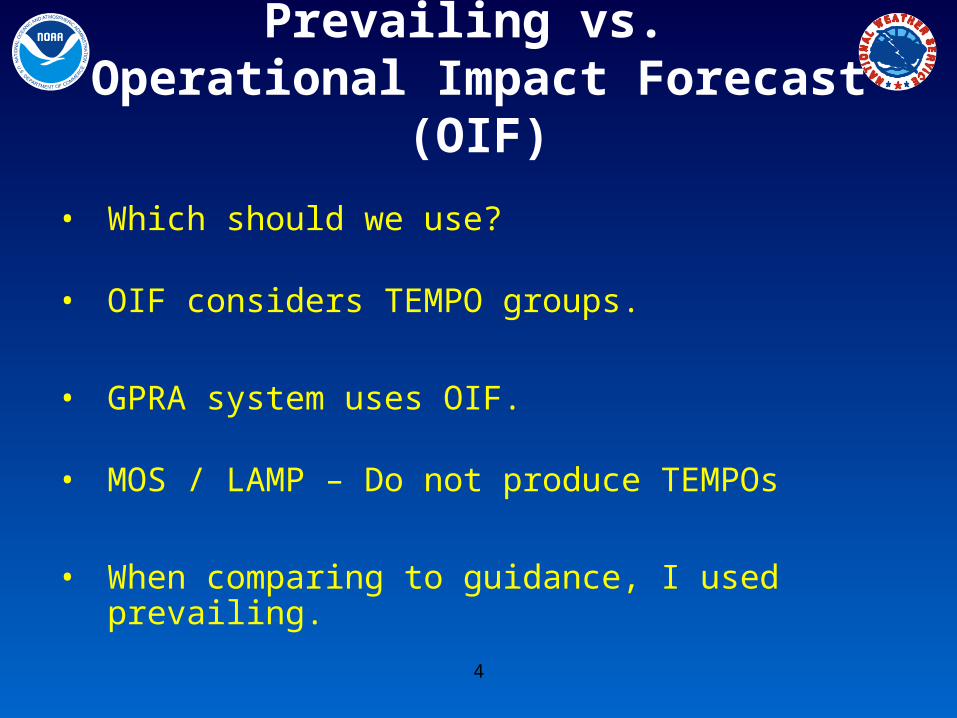
Prevailing vs. Operational Impact Forecast (OIF)
• Which should we use?
• OIF considers TEMPO groups.
• GPRA system uses OIF.
• MOS / LAMP – Do not produce TEMPOs
• When comparing to guidance, I used prevailing.
5
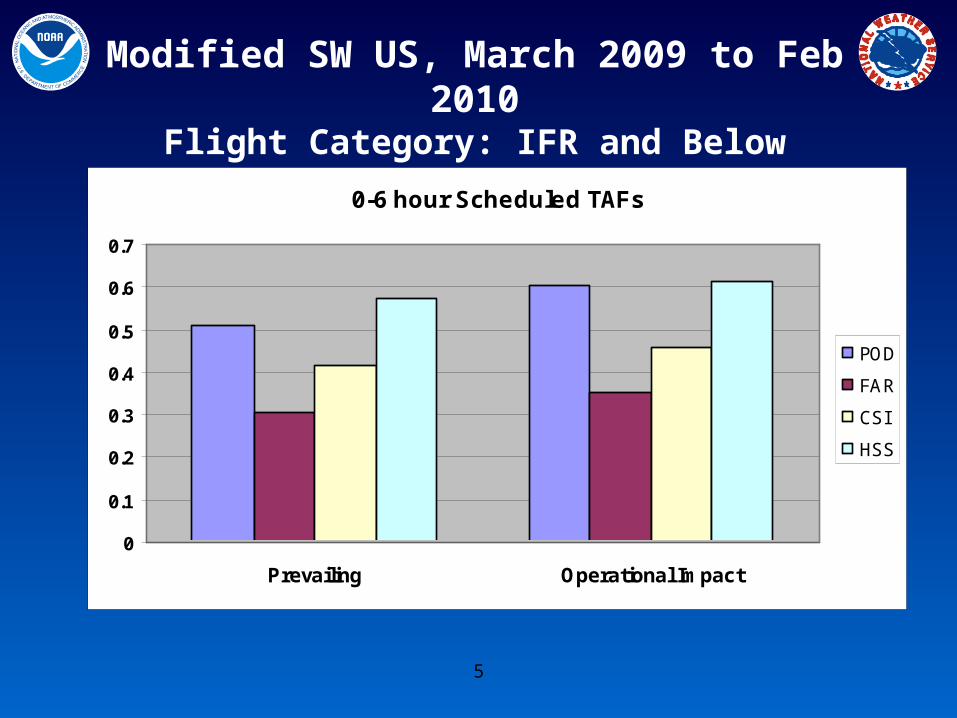
Modified SW US, March 2009 to Feb 2010Flight Category: IFR and Below
0-6 hour Scheduled TAFs
0
0.1
0.2
0.3
0.4
0.5
0.6
0.7
Prevailing Operational Impact
POD
FAR
CSI
HSS
6
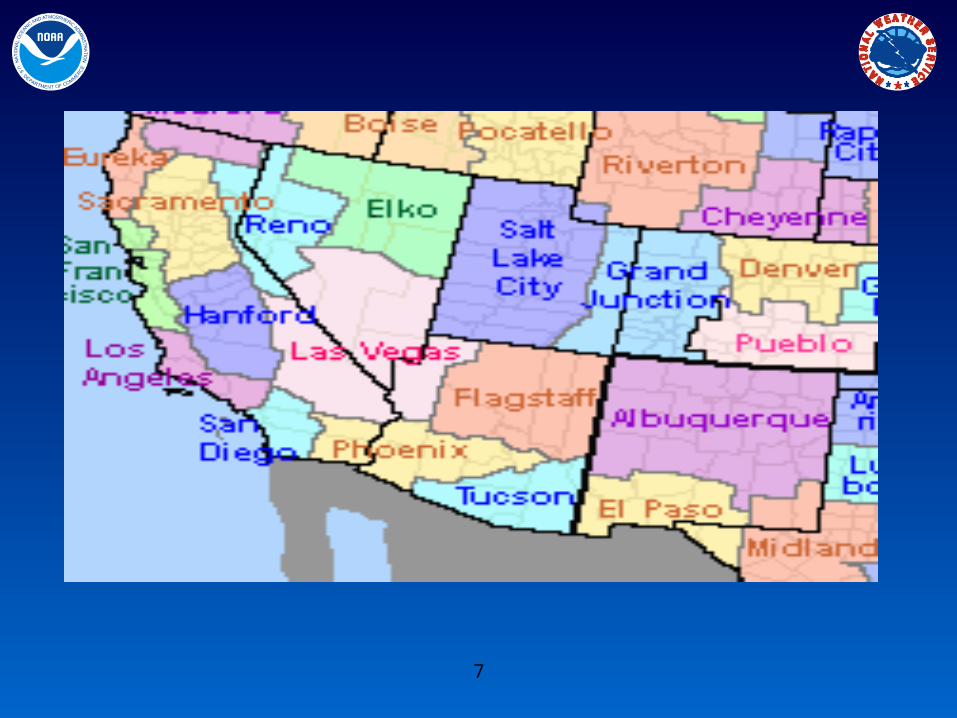
Traditional Stats forModified Southwest United States:
ColoradoNew Mexico
UtahArizonaNevada
California
Minus these WFOs: San Diego, Los Angeles, San Francisco
7
8
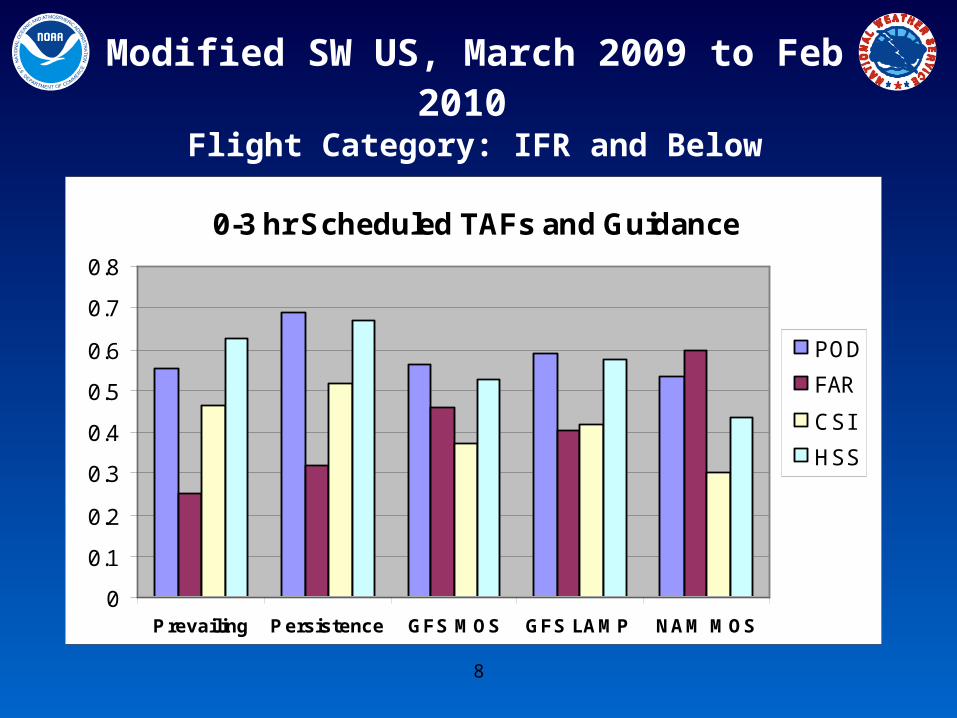
0-3 hr Scheduled TAFs and Guidance
0
0.1
0.2
0.3
0.4
0.5
0.6
0.7
0.8
Prevailing Persistence GFS MOS GFS LAMP NAM MOS
POD
FAR
CSI
HSS
Modified SW US, March 2009 to Feb 2010 Flight Category: IFR and Below
9
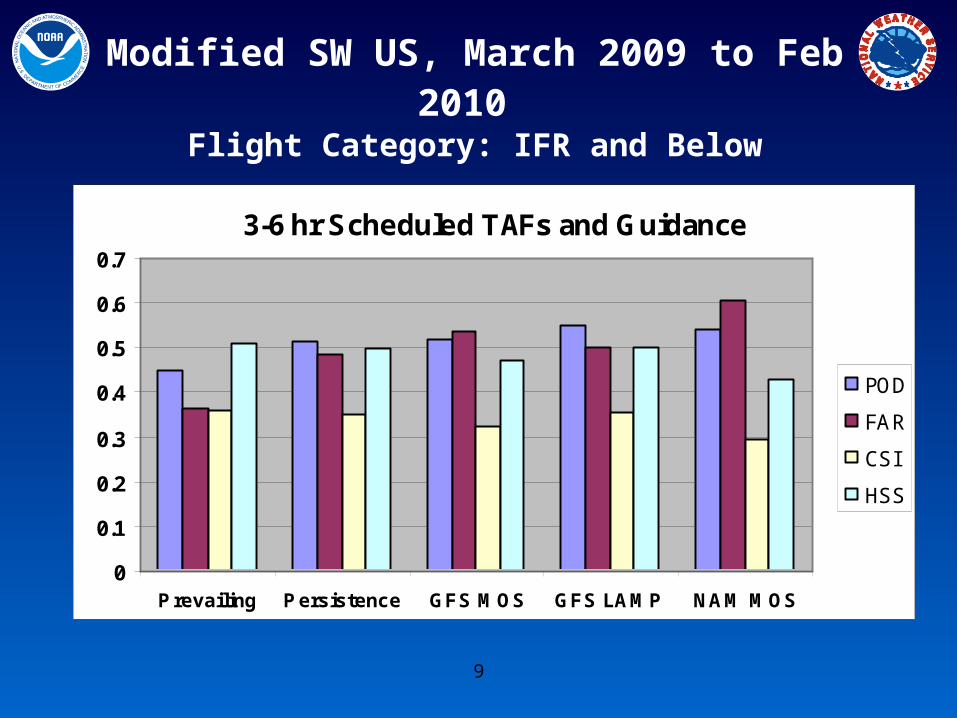
Modified SW US, March 2009 to Feb 2010 Flight Category: IFR and Below
3-6 hr Scheduled TAFs and Guidance
0
0.1
0.2
0.3
0.4
0.5
0.6
0.7
Prevailing Persistence GFS MOS GFS LAMP NAM MOS
POD
FAR
CSI
HSS
10
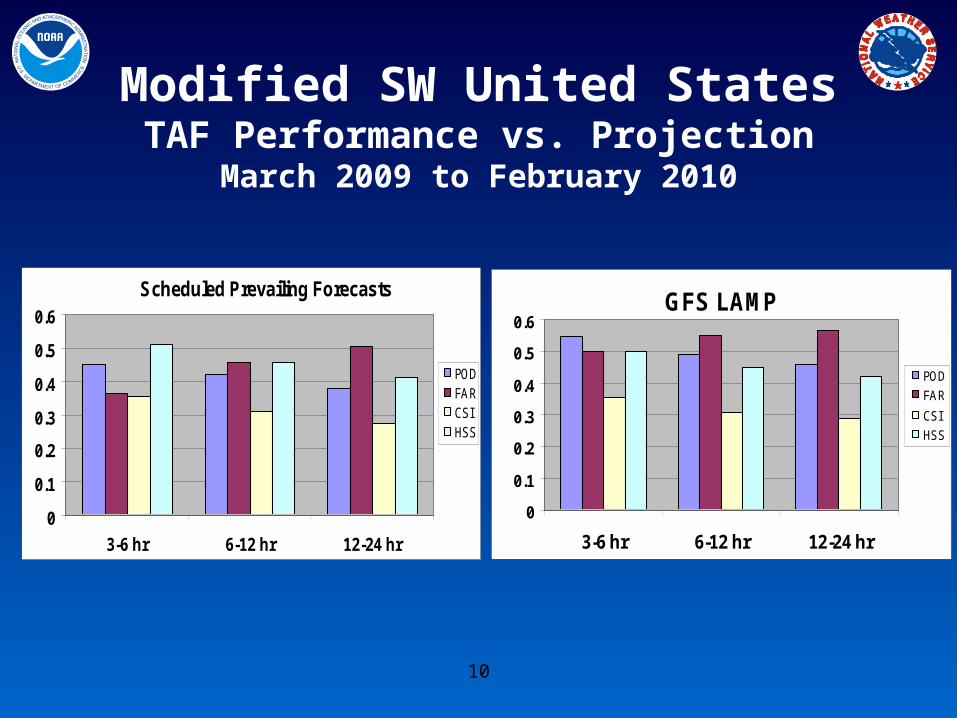
Modified SW United StatesTAF Performance vs. Projection
March 2009 to February 2010
GFS LAMP
0
0.1
0.2
0.3
0.4
0.5
0.6
3-6 hr 6-12 hr 12-24 hr
POD
FAR
CSI
HSS
Scheduled Prevailing Forecasts
0
0.1
0.2
0.3
0.4
0.5
0.6
3-6 hr 6-12 hr 12-24 hr
PODFARCSI HSS
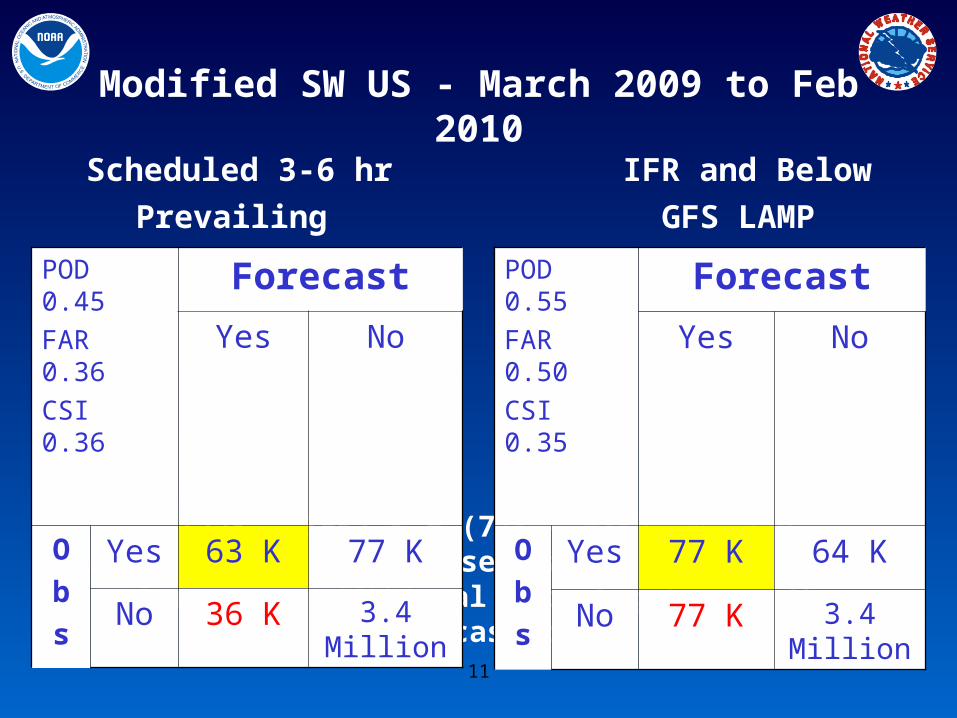
11
Modified SW US - March 2009 to Feb 2010Scheduled 3-6 hr IFR and Below
GFS LAMP
(77K - 36K) K ÷ (77K – 63K) ~ 2.9The 3-6 hr GFS LAMP false alarmed almost 3 times for every additional hit it got over the forecasters!
POD 0.55
FAR 0.50
CSI 0.35
ForecastYes No
O
b
s
Yes 77 K 64 K
No 77 K 3.4 Million
Prevailing
POD 0.45
FAR 0.36
CSI 0.36
ForecastYes No
O
b
s
Yes 63 K 77 K
No 36 K 3.4 Million
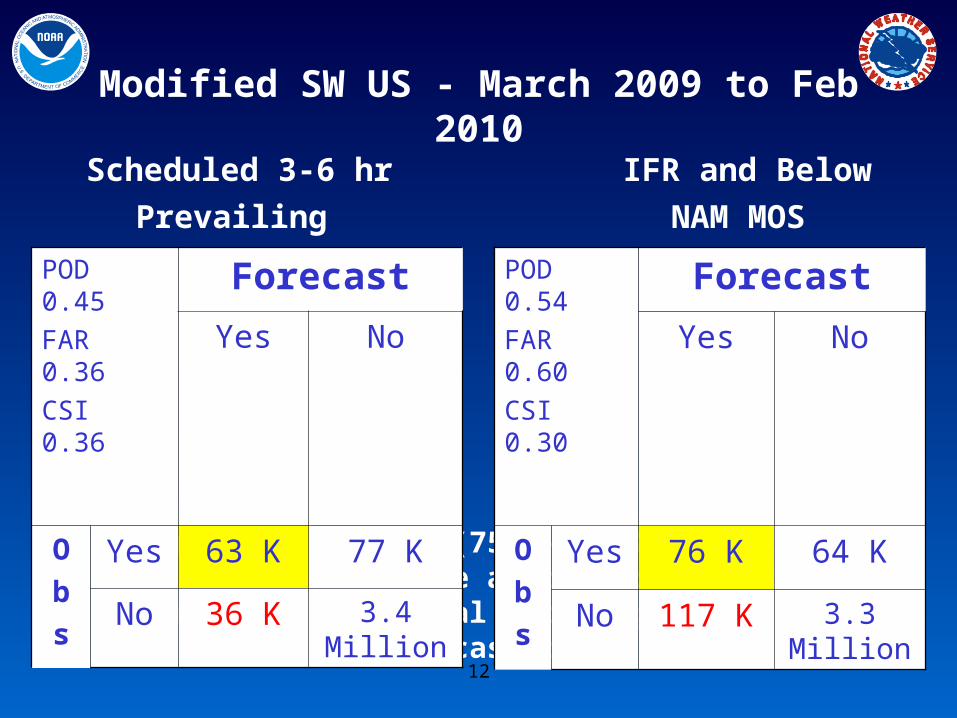
12
Modified SW US - March 2009 to Feb 2010Scheduled 3-6 hr IFR and Below
NAM MOS
(117K – 36K) ÷ (75K - 63 K) ~ 6.23-6 hr NAM MOS false alarmed over 6 times
for every additional hit it got over the forecasters!
POD 0.54
FAR 0.60
CSI 0.30
ForecastYes No
O
b
s
Yes 76 K 64 K
No 117 K 3.3 Million
Prevailing
POD 0.45
FAR 0.36
CSI 0.36
ForecastYes No
O
b
s
Yes 63 K 77 K
No 36 K 3.4 Million
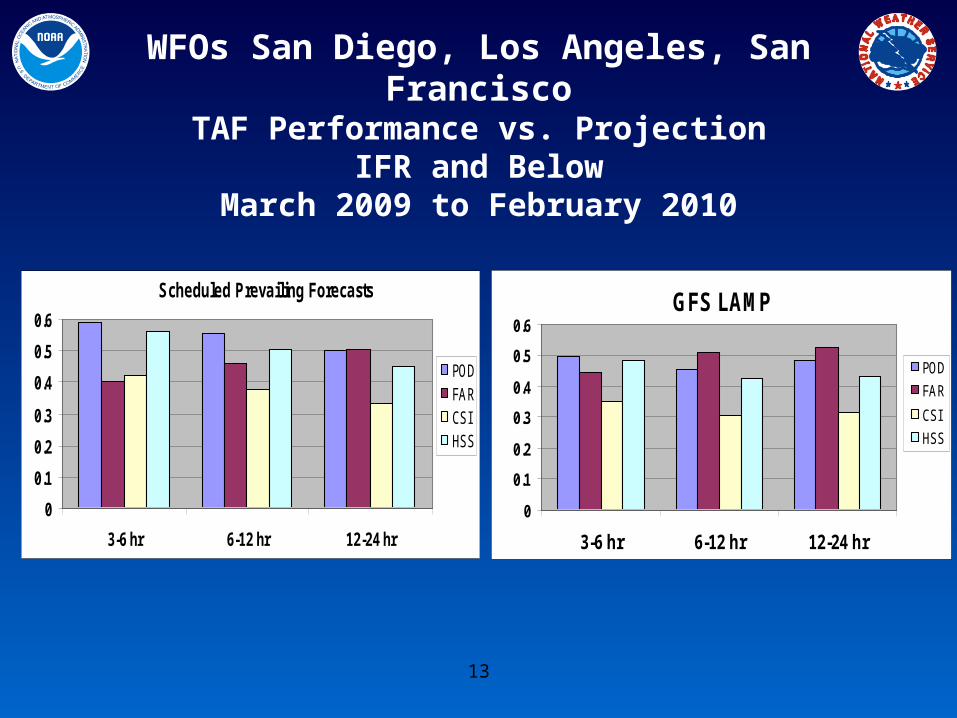
13
WFOs San Diego, Los Angeles, San FranciscoTAF Performance vs. Projection
IFR and BelowMarch 2009 to February 2010
GFS LAMP
0
0.1
0.2
0.3
0.4
0.5
0.6
3-6 hr 6-12 hr 12-24 hr
POD
FAR
CSI
HSS
Scheduled Prevailing Forecasts
0
0.1
0.2
0.3
0.4
0.5
0.6
3-6 hr 6-12 hr 12-24 hr
PODFARCSI HSS
14
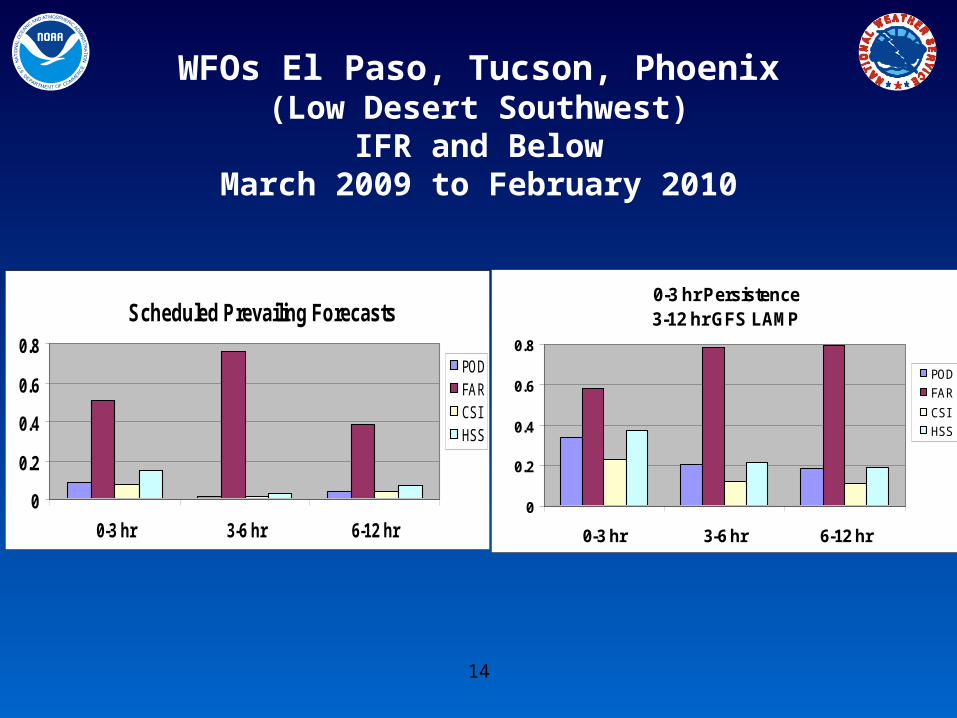
WFOs El Paso, Tucson, Phoenix(Low Desert Southwest)
IFR and BelowMarch 2009 to February 2010
0-3 hr Persistence 3-12 hr GFS LAMP
0
0.2
0.4
0.6
0.8
0-3 hr 3-6 hr 6-12 hr
POD
FAR
CSI
HSS
Scheduled Prevailing Forecasts
0
0.2
0.4
0.6
0.8
0-3 hr 3-6 hr 6-12 hr
PODFARCSI HSS

15
Part 2
Lead-Time Software
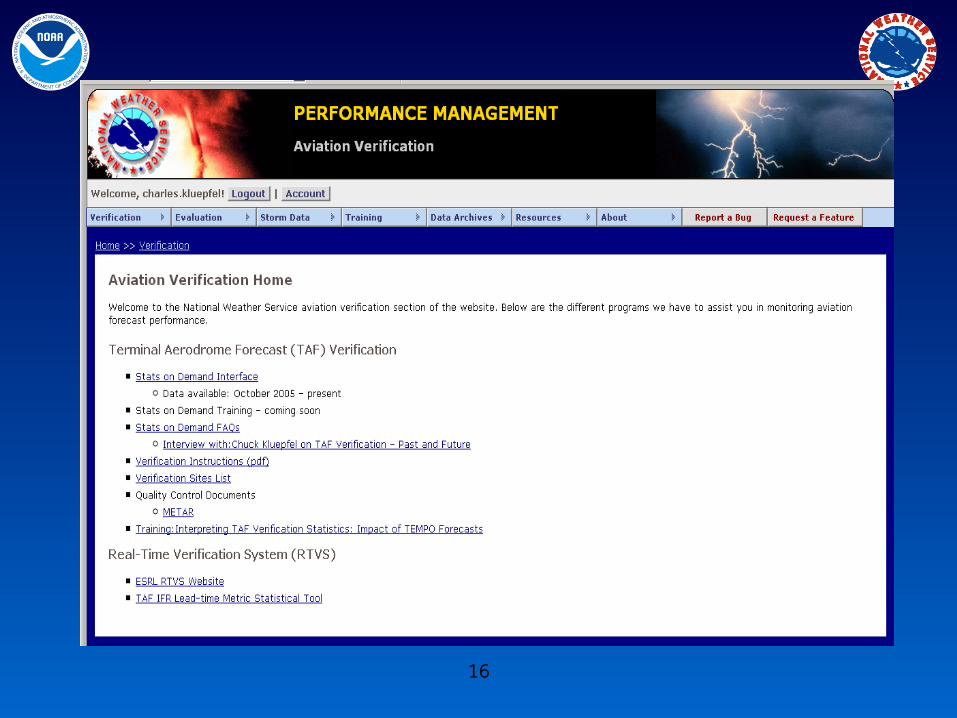
16

17
Part 3
The
Future
18
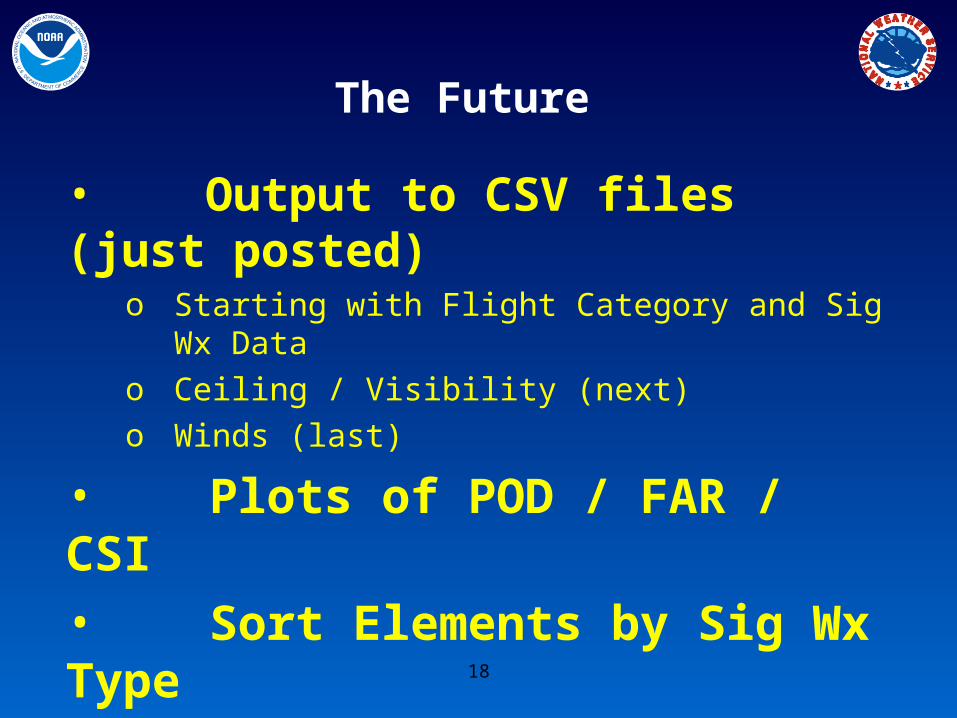
The Future
• Output to CSV files (just posted)o Starting with Flight Category and Sig Wx Datao Ceiling / Visibility (next)o Winds (last)
• Plots of POD / FAR / CSI
• Sort Elements by Sig Wx Type
OBSERVED (A)
FO
RE
CA
ST
(F
)
(X)
(Y)(W)
(Z)
0
1
0 1
POD
FOM
POFD
PON
FOH FAR
DFR FOCN
(Ma,Mf)
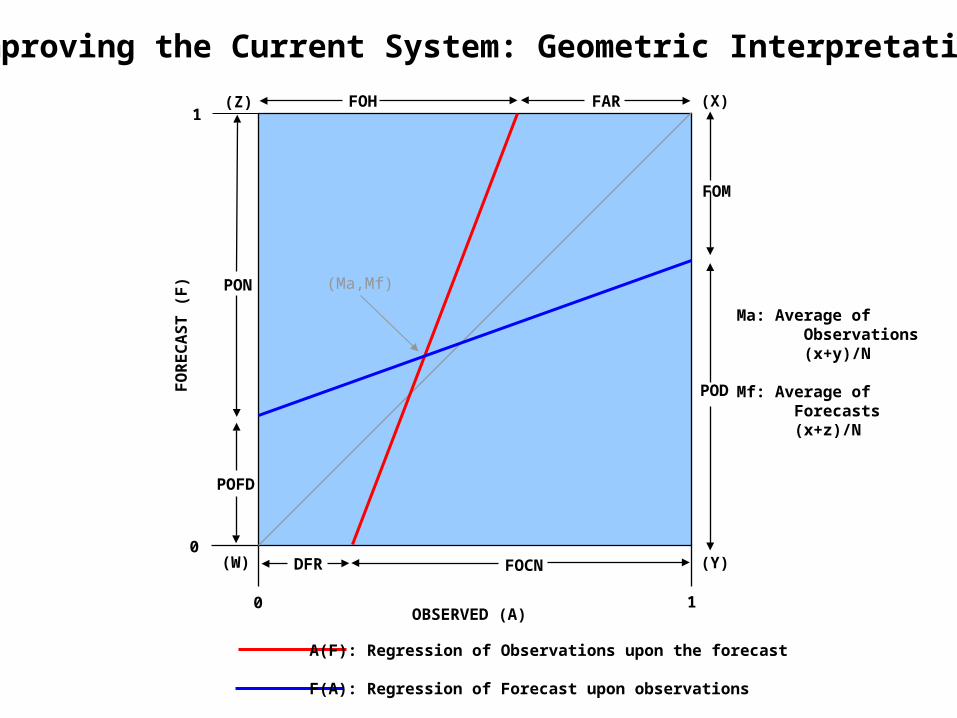
A(F): Regression of Observations upon the forecast
F(A): Regression of Forecast upon observations
Ma: Average of Observations (x+y)/N
Mf: Average of Forecasts (x+z)/N
Improving the Current System: Geometric Interpretation
20
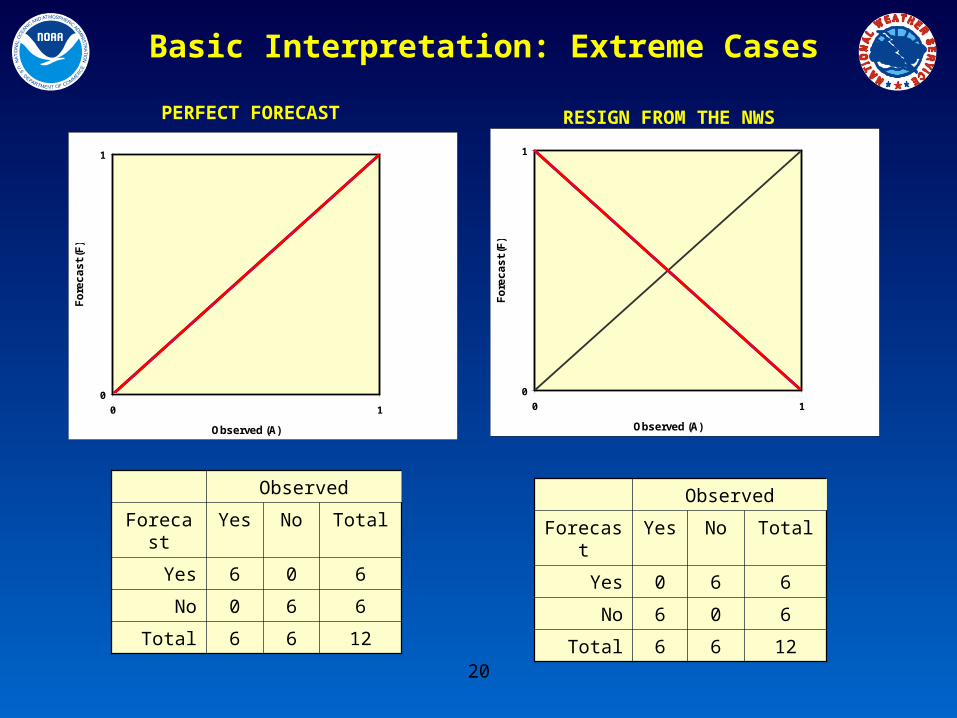
Observed
Forecast Yes No Total
Yes 6 0 6
No 0 6 6
Total 6 6 12
Observed
Forecast Yes No Total
Yes 0 6 6
No 6 0 6
Total 6 6 12
0
1
0 1
Observed (A)
Fo
rec
as
t (F
)
0
1
0 1
Observed (A)
Fo
rec
as
t (F
)
Basic Interpretation: Extreme Cases
PERFECT FORECAST RESIGN FROM THE NWS
21
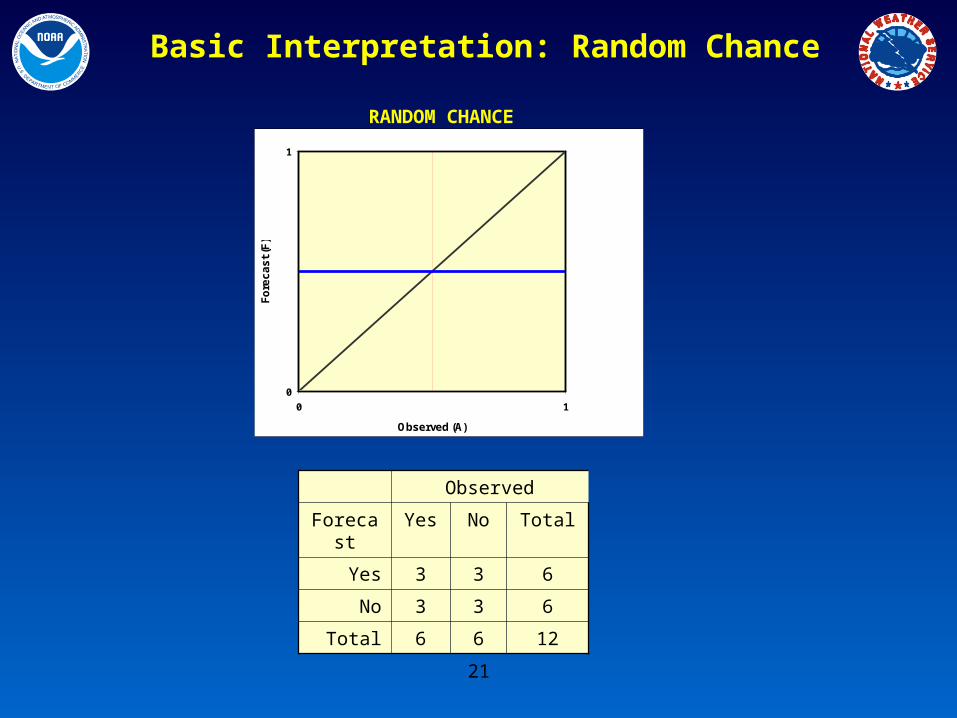
Observed
Forecast Yes No Total
Yes 3 3 6
No 3 3 6
Total 6 6 12
0
1
0 1
Observed (A)
Fo
rec
as
t (F
)
RANDOM CHANCE
Basic Interpretation: Random Chance
22
0
1
0 1
Observed (A)
Fo
rec
as
t (F
)
0
1
0 1
Observed (A)
Fo
rec
as
t (F
)
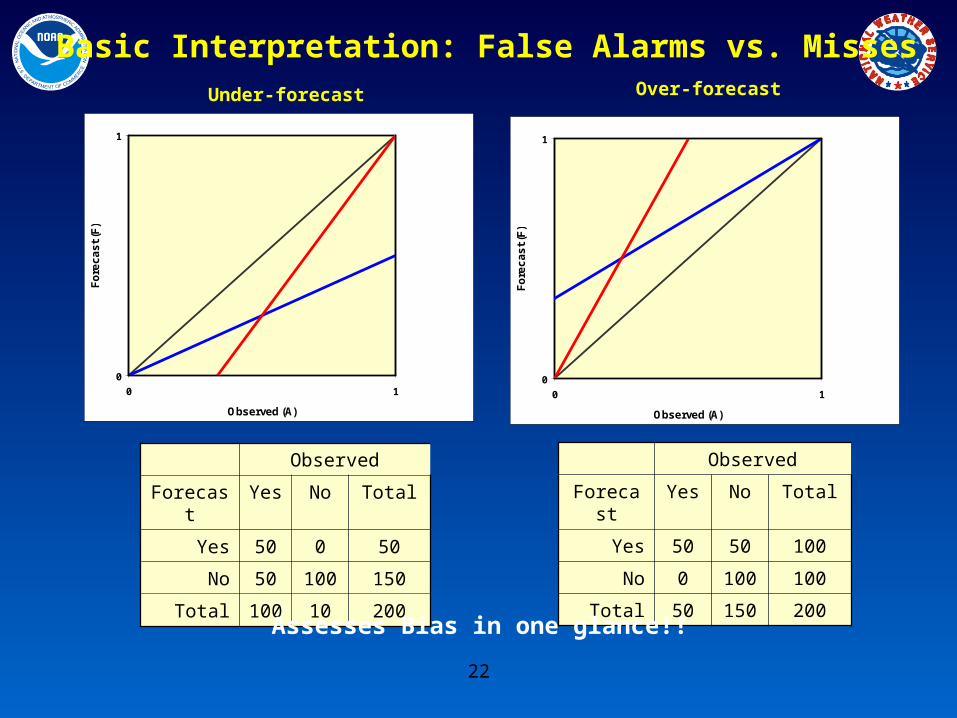
Observed
Forecast Yes No Total
Yes 50 0 50
No 50 100 150
Total 100 10 200
Observed
Forecast Yes No Total
Yes 50 50 100
No 0 100 100
Total 50 150 200
Under-forecast Over-forecast
Assesses Bias in one glance!!
Basic Interpretation: False Alarms vs. Misses

23
Finis
24
Traditional Stats
Entire National Weather Service
25
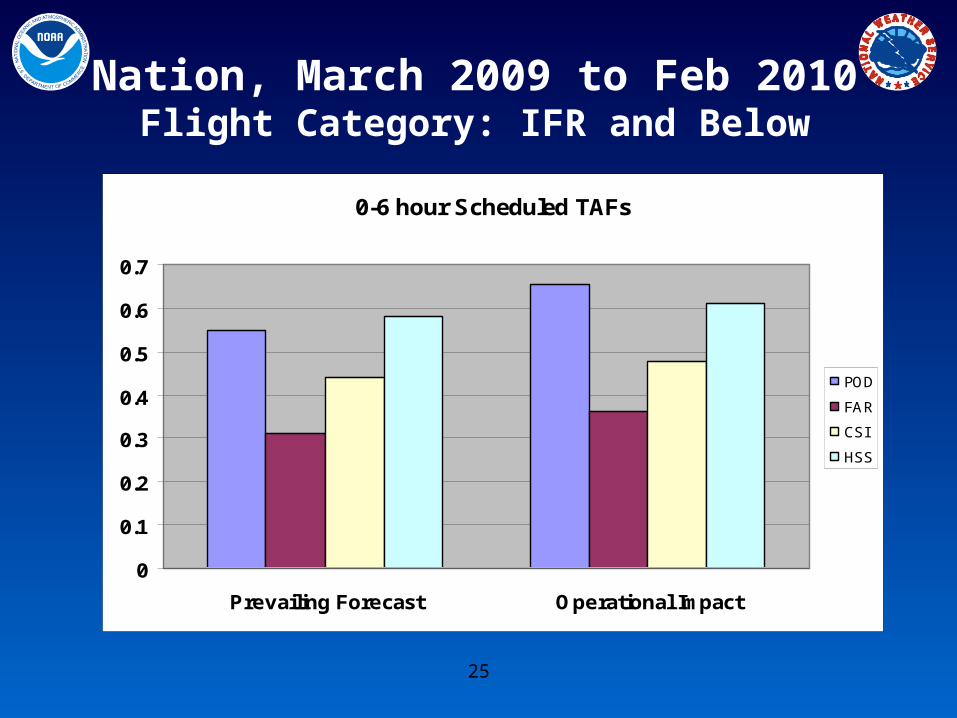
Nation, March 2009 to Feb 2010Flight Category: IFR and Below
0-6 hour Scheduled TAFs
0
0.1
0.2
0.3
0.4
0.5
0.6
0.7
Prevailing Forecast Operational Impact
POD
FAR
CSI
HSS
26
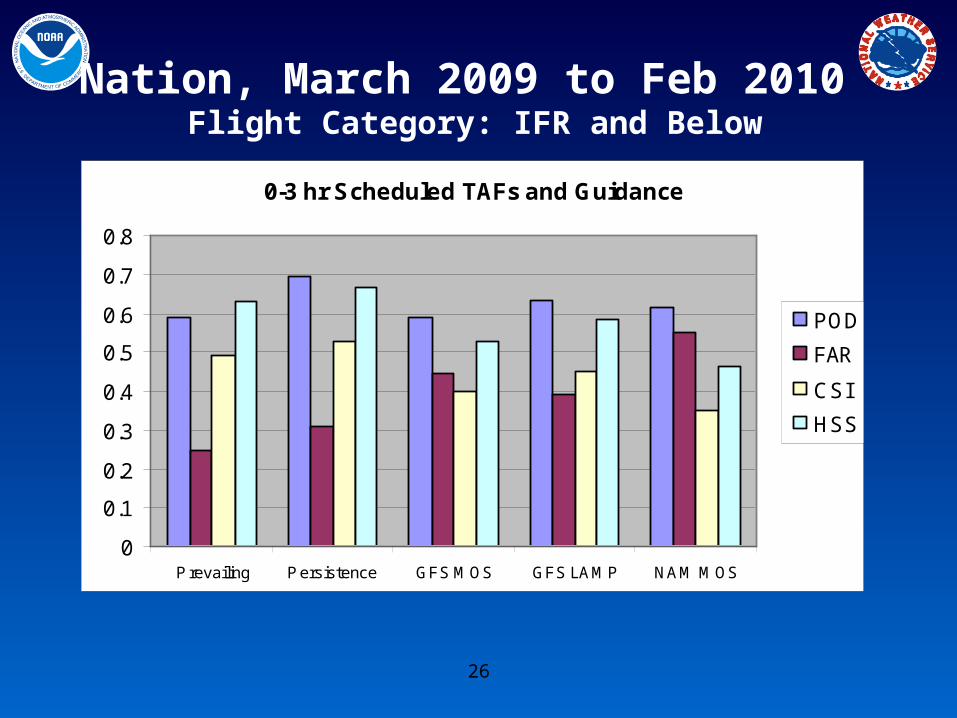
Nation, March 2009 to Feb 2010 Flight Category: IFR and Below
0-3 hr Scheduled TAFs and Guidance
0
0.1
0.2
0.3
0.4
0.5
0.6
0.7
0.8
P revailing P ersistence GFS MOS GFS LAMP NAM MOS
POD
FAR
CSI
HSS
27
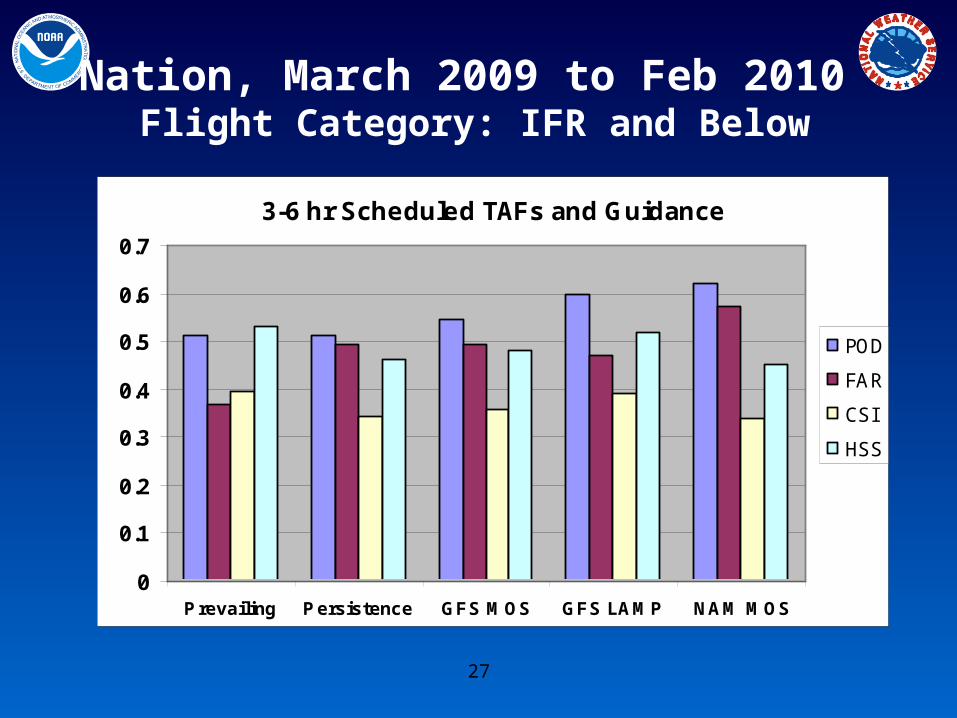
Nation, March 2009 to Feb 2010 Flight Category: IFR and Below
3-6 hr Scheduled TAFs and Guidance
0
0.1
0.2
0.3
0.4
0.5
0.6
0.7
Prevailing Persistence GFS MOS GFS LAMP NAM MOS
POD
FAR
CSI
HSS
28
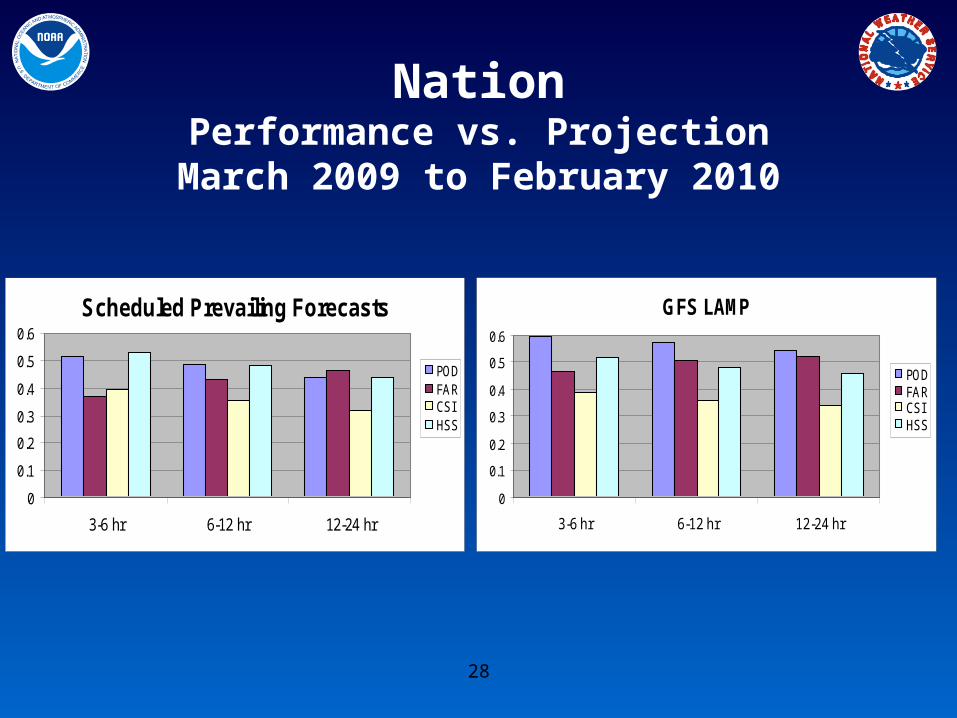
NationPerformance vs. Projection
March 2009 to February 2010
Scheduled Prevailing Forecasts
0
0.1
0.2
0.3
0.4
0.5
0.6
3-6 hr 6-12 hr 12-24 hr
PODFARCSI HSS
GFS LAMP
0
0.1
0.2
0.3
0.4
0.5
0.6
3-6 hr 6-12 hr 12-24 hr
PODFARCSI HSS