Embed Size (px)
Citation preview
1
Hypothesis Testing
William P. Wattles, Ph.D.
Psychology 302
2
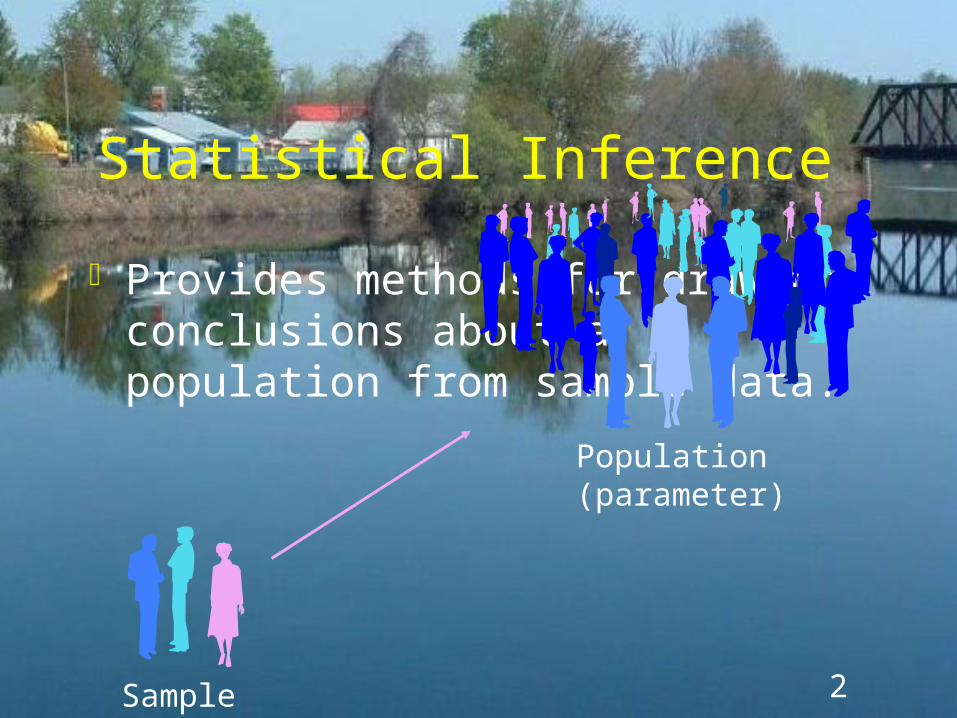
Statistical Inference
Provides methods for drawing conclusions about a population from sample data.
Sample (statistic)
Population (parameter)
3
The problem
Sampling Error
4
Sampling error results from chance factors that produce a sample statistic different from the population parameter it
represents.
5
Dealing with sampling error
Confidence intervals Hypothesis testing
6
Hypothesis testing
We use confidence intervals when our goal is to estimate a population parameter.
7
8
Hypothesis testing
A more common need is to assess the evidence for some claim about the population.
9
Tests of significance
Does a change in the independent variable produce a change in the dependent variable.
Or is the observed difference merely the result of sampling error?
Is the observed difference meaningful (significant).

10
Hypothesis Testing
Dr. Diligent has found a better treatment for procrastination. She reports that students trained in her method have a higher g.pa. than the average.
FMU
11
Null, says: “It’s nothing but sampling error.
HO
12
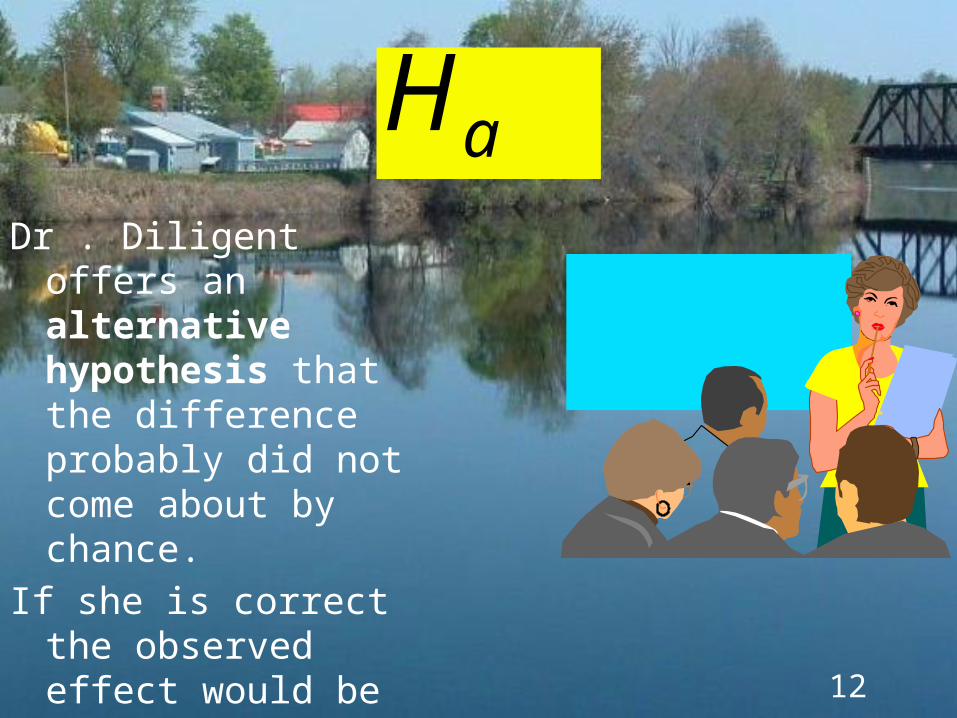
Dr . Diligent offers an alternative hypothesis that the difference probably did not come about by chance.
If she is correct the observed effect would be unlikely to occur by chance.
Ha

13
Dr. Diligent says that the sample comes from a different population with a different mean.
FMU

14
Dr. Diligent says that the sample comes from a different population with a different mean.
pop mean 72.55pop std dev 12.62sample mean 79.53n=25
FMU

15
Who is correct?
Ha HoFMU
16
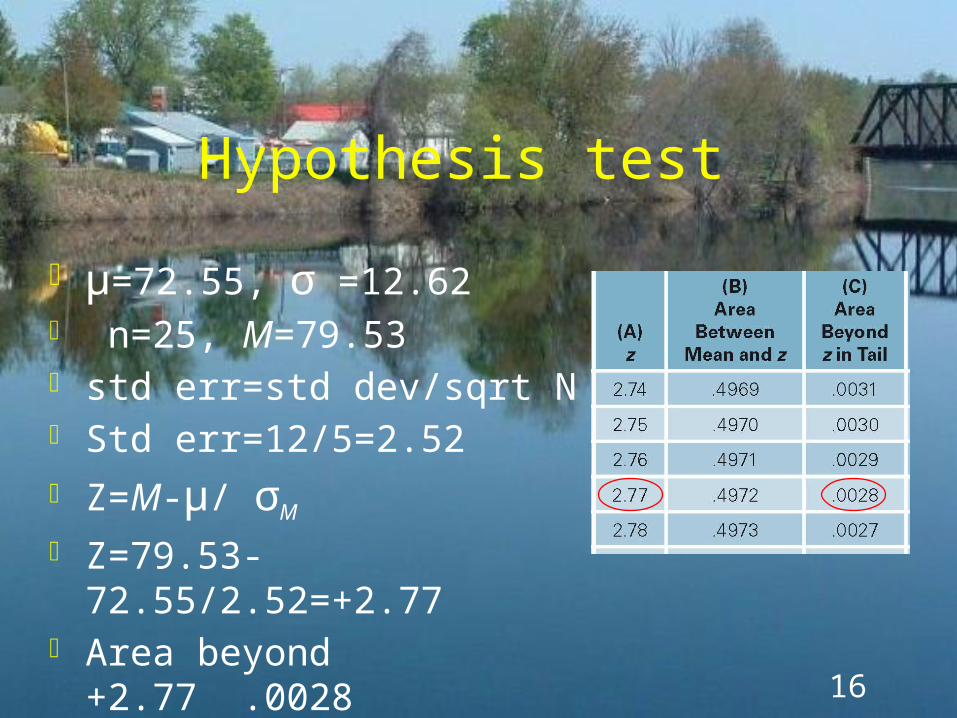
Hypothesis test
μ=72.55, σ =12.62 n=25, M=79.53 std err=std dev/sqrt N Std err=12/5=2.52 Z=M-μ/ σM
Z=79.53-72.55/2.52=+2.77 Area beyond +2.77 .0028
17
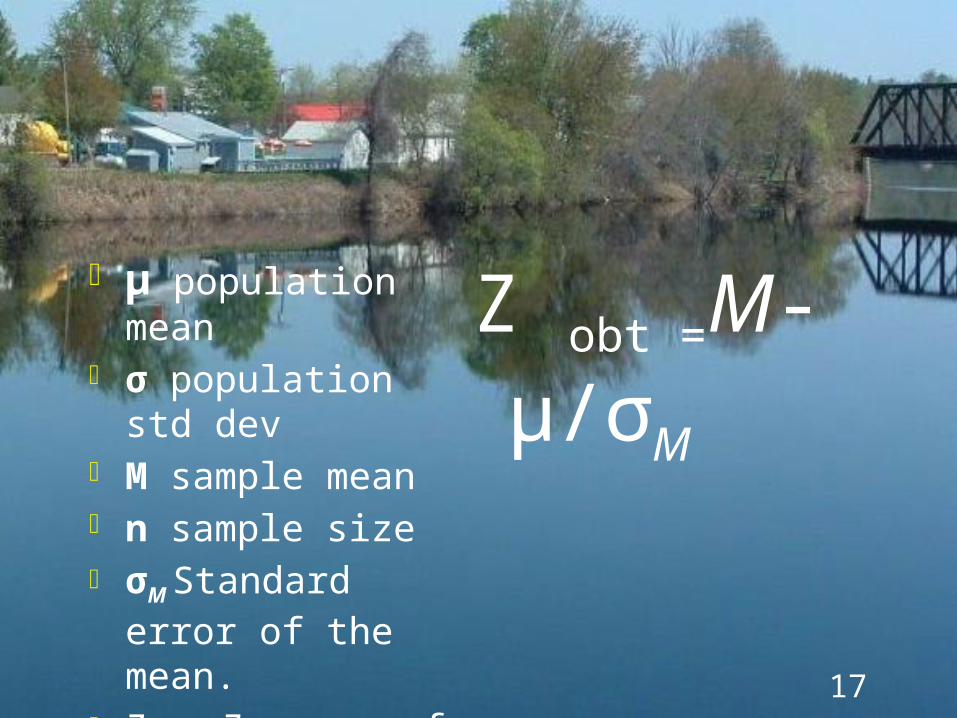
μ population mean σ population std dev M sample mean n sample size σM Standard error of
the mean. Z obt Z score of the
sample mean
Z obt =M-μ/σM
18
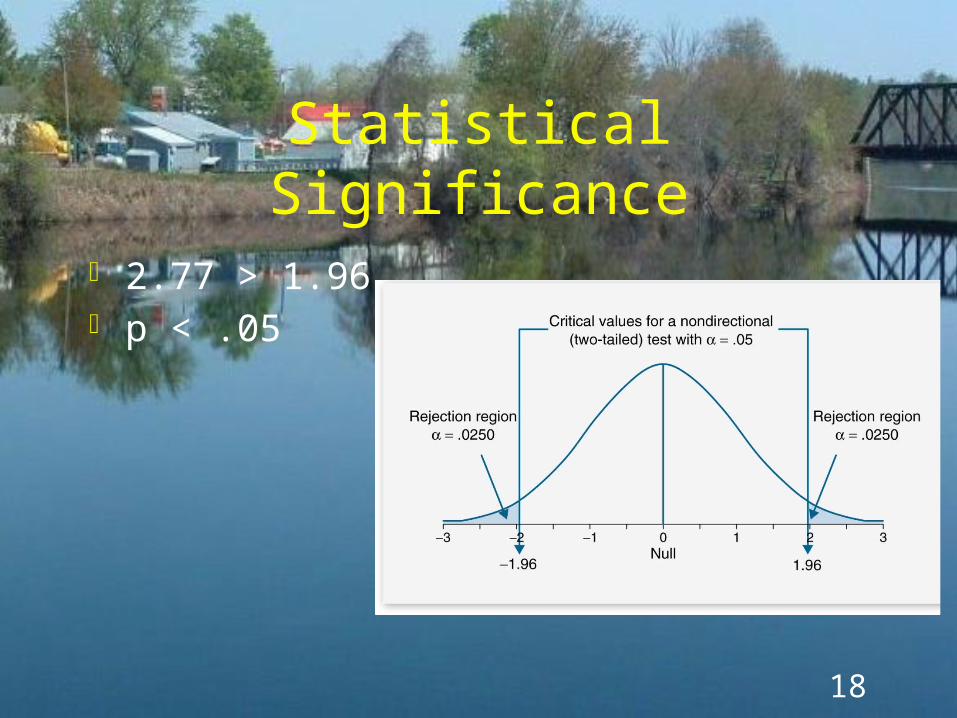
Statistical Significance
2.77 > 1.96 p < .05
19
Reject the null hypothesis
The results probably did not occur by chance.
There must be something to her procrastination training program.
20
Null hypothesis
null hypothesis (Ho) states that there is no difference between the population means. Any observed difference is random sampling error.
alternative hypothesis states that the means are different.
21
Statistical significance
Means we have concluded that the data are too unlikely to have occurred by chance alone. Thus, there is a relationship between the independent and dependent variable.
Means we have rejected the null hypothesis Ho.
22
Statistical significance
Failure to reject Ho suggests that the difference could have occurred by chance and we conclude that the means are the same.
23
P-Value
The probability of obtaining a value as extreme or more extreme than the observed statistic.
The probability that the test would produce a result at least as extreme as the observed result if the null hypothesis were true.
24
Alpha or Significance level
Statistical significance simply means rareness.
Another term for significance level is alpha level.
.05 is generally considered the minimum necessary for significance.
25
Statistically significant
We can calculate a P-value using the area under the curve. It tells us how likely the obtained statistic would be if the null hypothesis were true.
Level of significance alpha says how much evidence we require.
Usually .05, .01 or .001
26
Statistically significant
If the P-value is as small or smaller than alpha, we say that the data are statistically significant at level alpha.

27
Critical Z
The Z score that cuts off the most extreme 5% of the scores.
One tail versus two tail.
Two tail– 1.96 5%– 2.5761%
One Tail– 1.6455%– 2.3261%
28
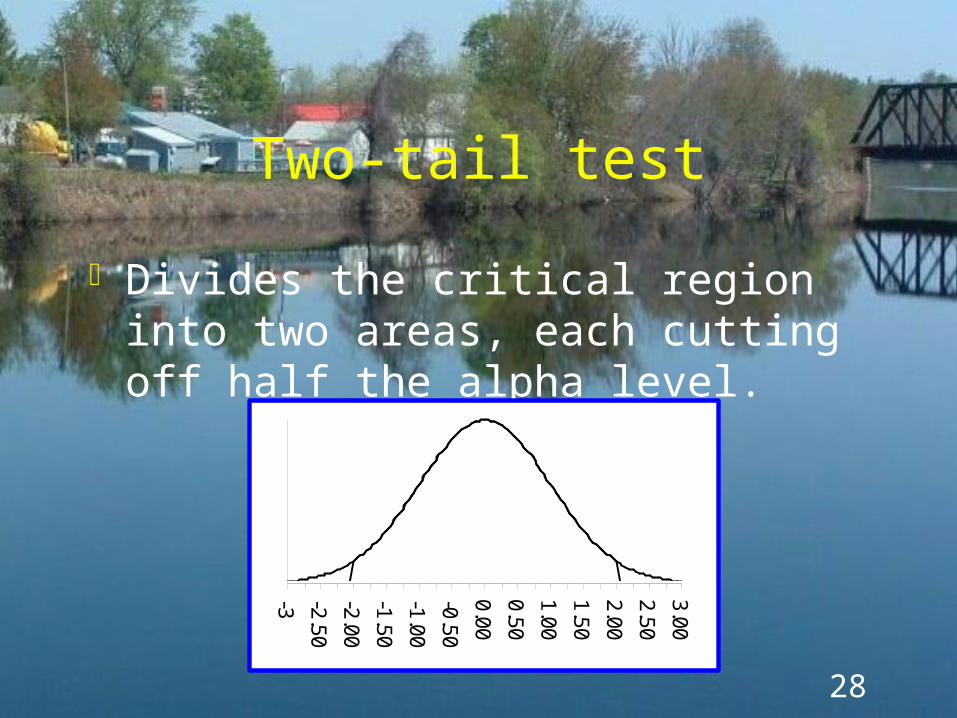
Two-tail test
Divides the critical region into two areas, each cutting off half the alpha level.
-3 -2.50
-2.00
-1.50
-1.00
-0.50
0.00
0.50
1.00
1.50
2.00
2.50
3.00
29
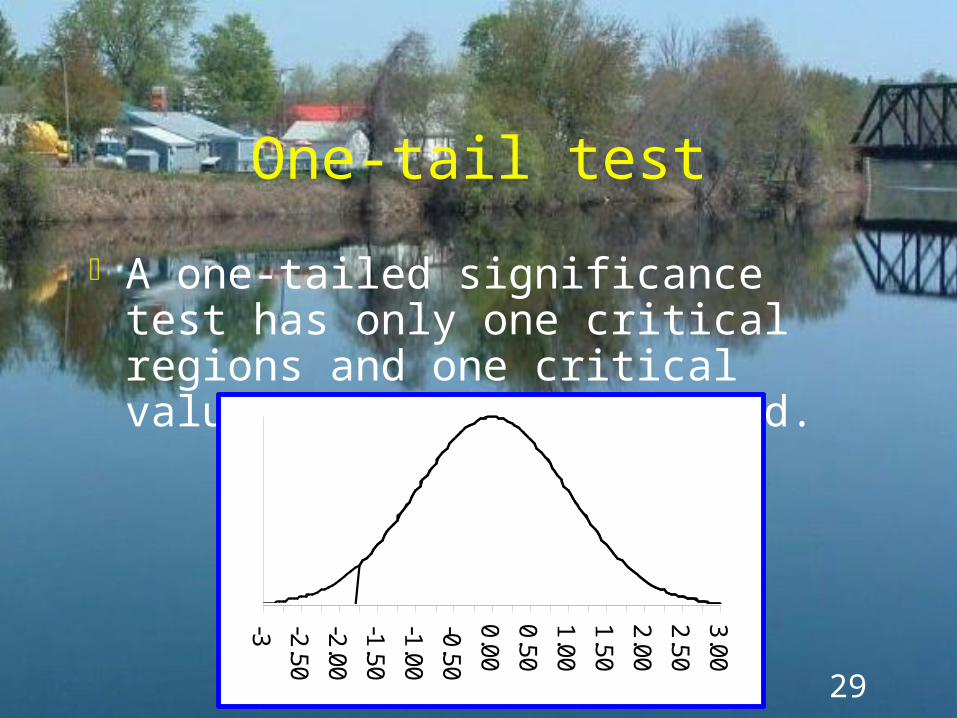
One-tail test
A one-tailed significance test has only one critical regions and one critical value. Not frequently used.
-3 -2.50
-2.00
-1.50
-1.00
-0.50
0.00
0.50
1.00
1.50
2.00
2.50
3.00
30
One-tail vs.. two-tail
One tail used if problem specifies a direction. (I.e., is greater than, taller than)
Two tail used when the alternative hypothesis is that the two means are different.
A one-tail test is more powerful
31
Power
the probability of rejecting a false null hypothesis.
32
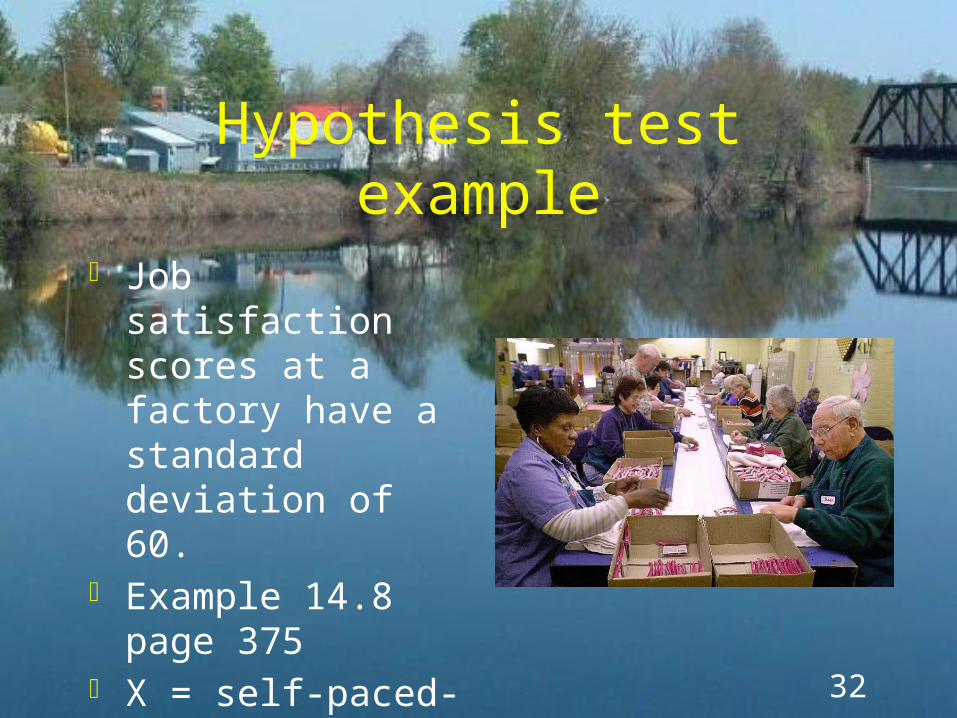
Hypothesis test example
Job satisfaction scores at a factory have a standard deviation of 60.
Example 14.8 page 375
X = self-paced-machine paced
33
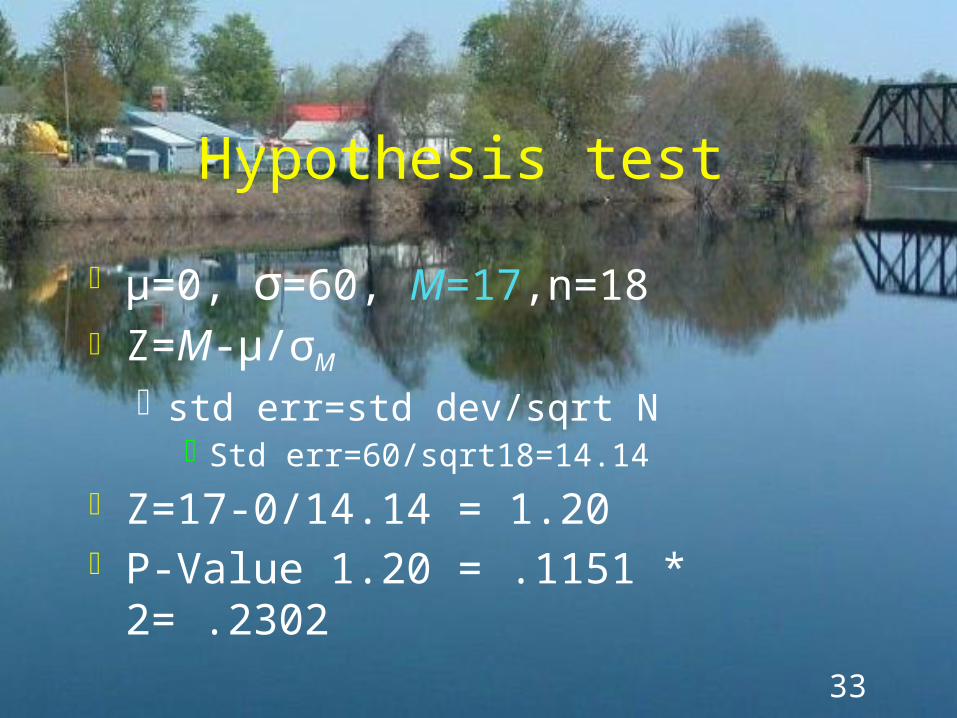
Hypothesis test
μ=0, σ=60, M=17,n=18 Z=M-μ/σM
std err=std dev/sqrt NStd err=60/sqrt18=14.14
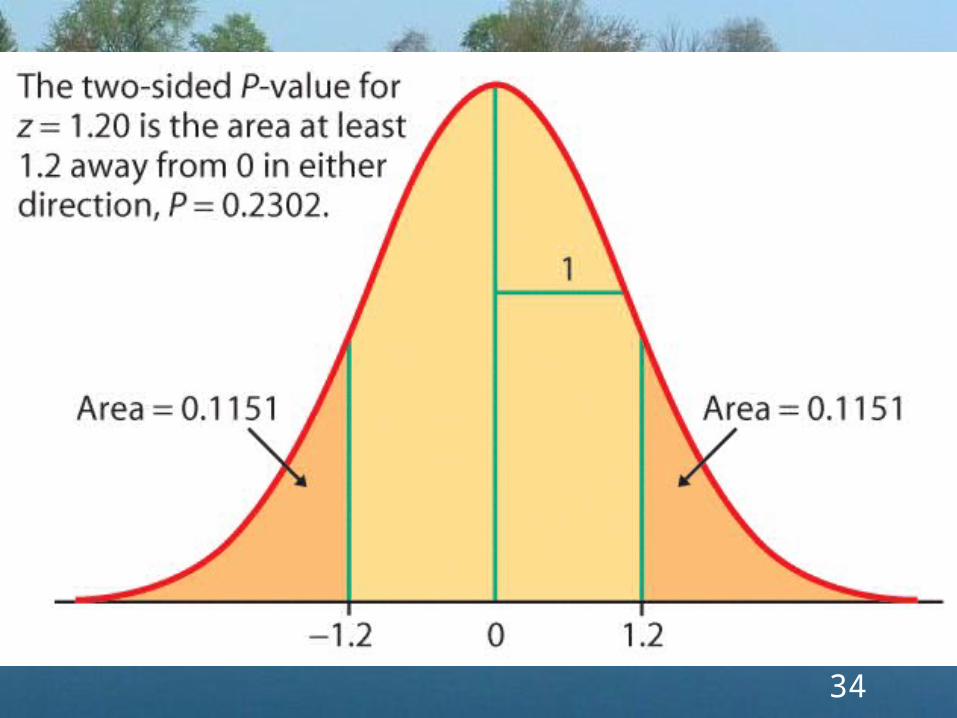
Z=17-0/14.14 = 1.20 P-Value 1.20 = .1151 * 2= .2302
34
35
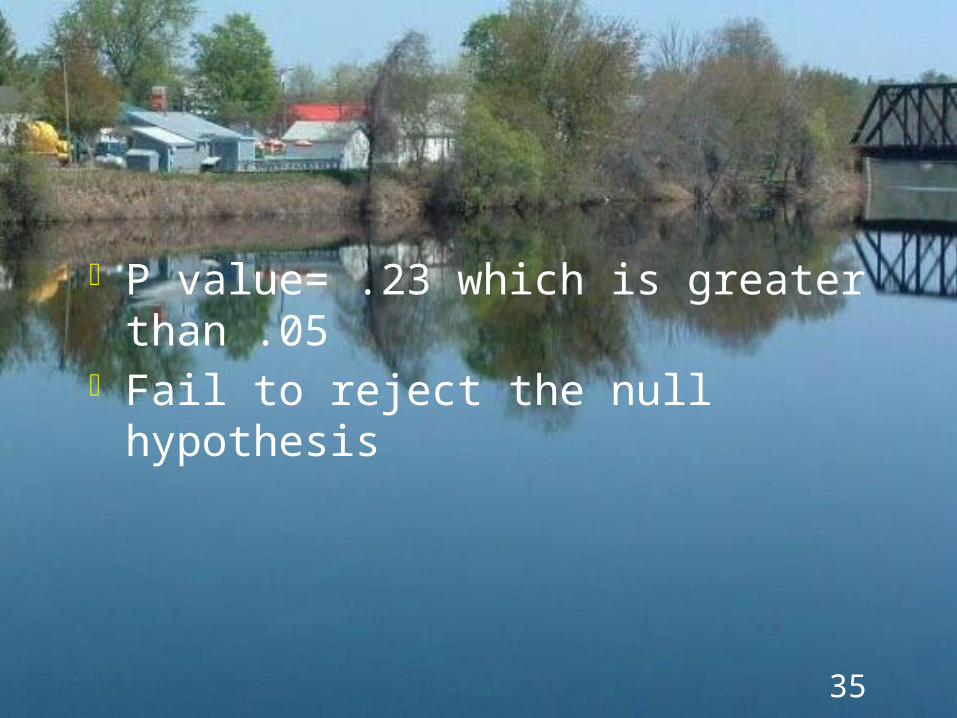
P value= .23 which is greater than .05 Fail to reject the null hypothesis
36
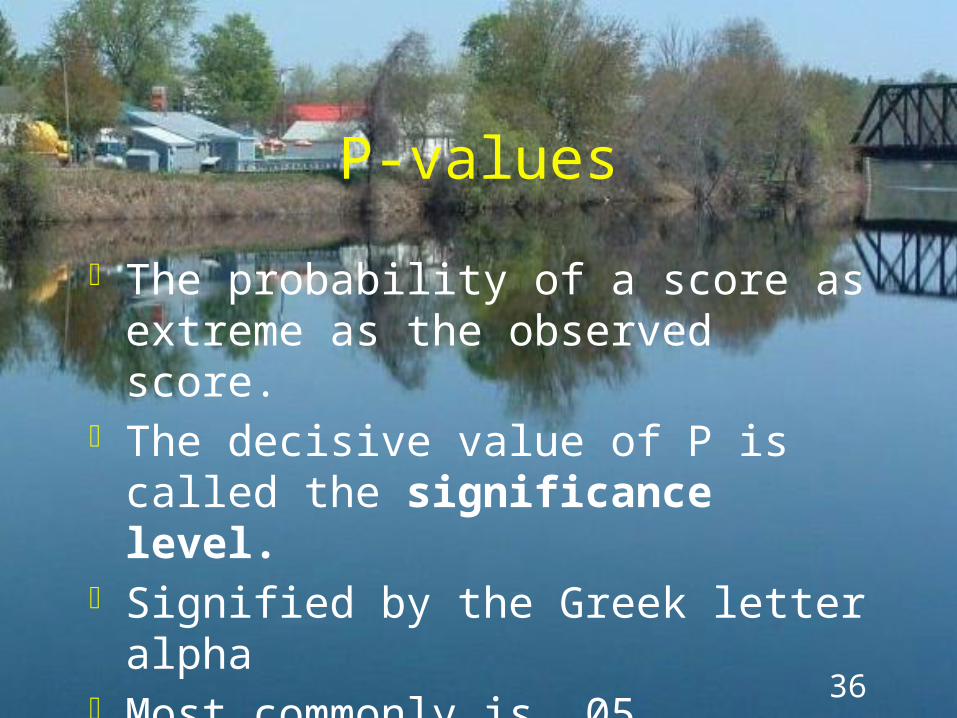
P-values
The probability of a score as extreme as the observed score.
The decisive value of P is called the significance level.
Signified by the Greek letter alpha Most commonly is .05

37
14.20 Reading a computer screen
Do these data give evidence that it takes longer to read with Gigi font?

38
14.20 Reading a computer screen
25 adults Pop std dev = 6
seconds Mean time for Times
New Roman is 22 seconds
39
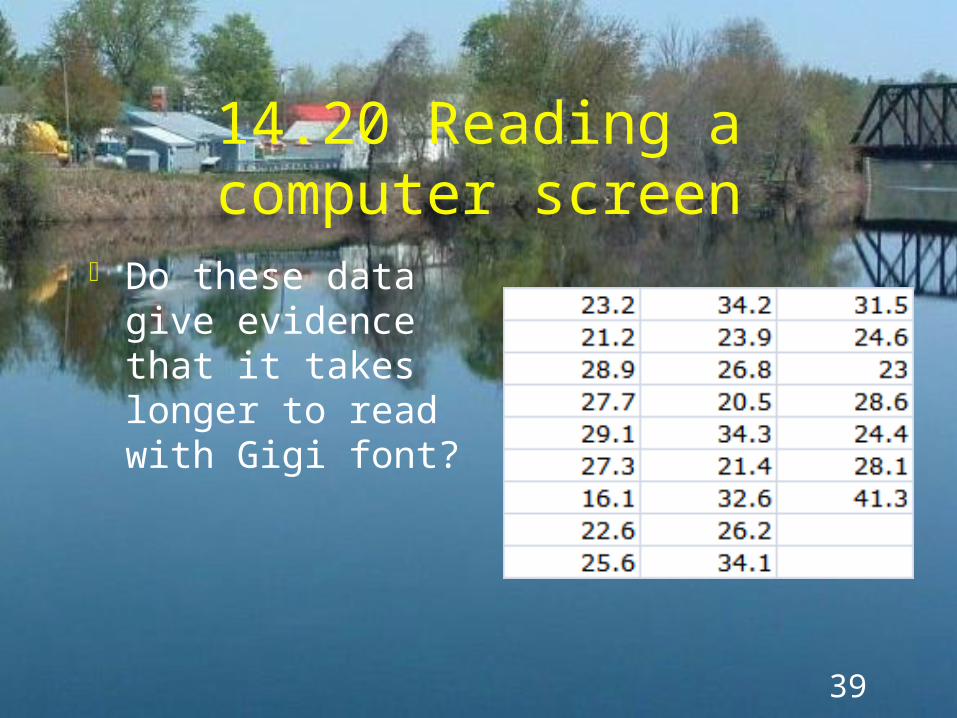
14.20 Reading a computer screen
Do these data give evidence that it takes longer to read with Gigi font?
40
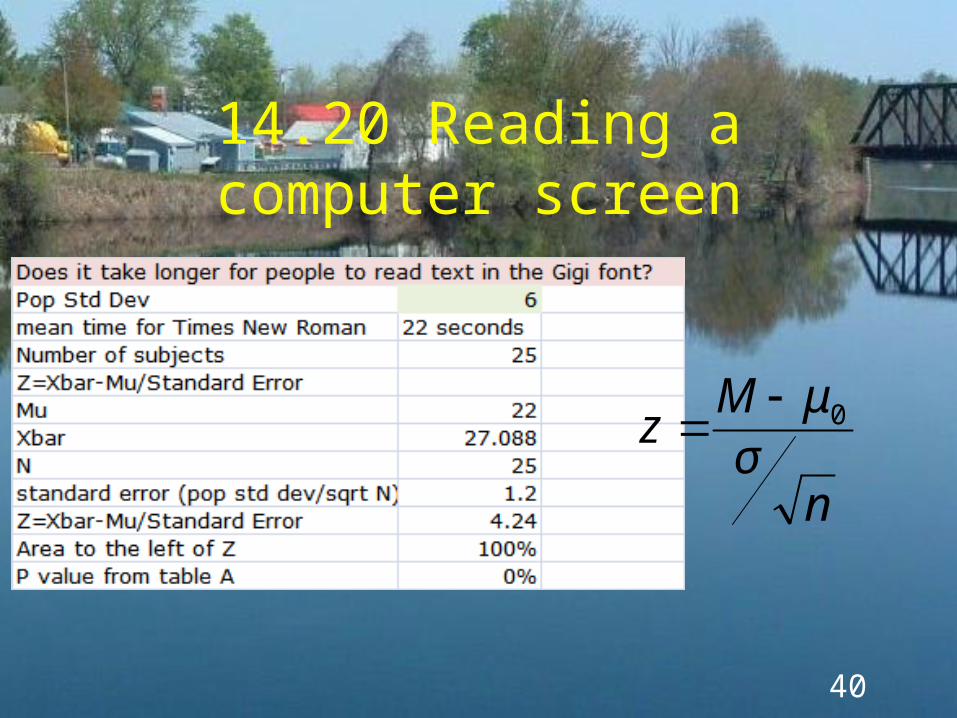
14.20 Reading a computer screen
nσμM
z 0
41
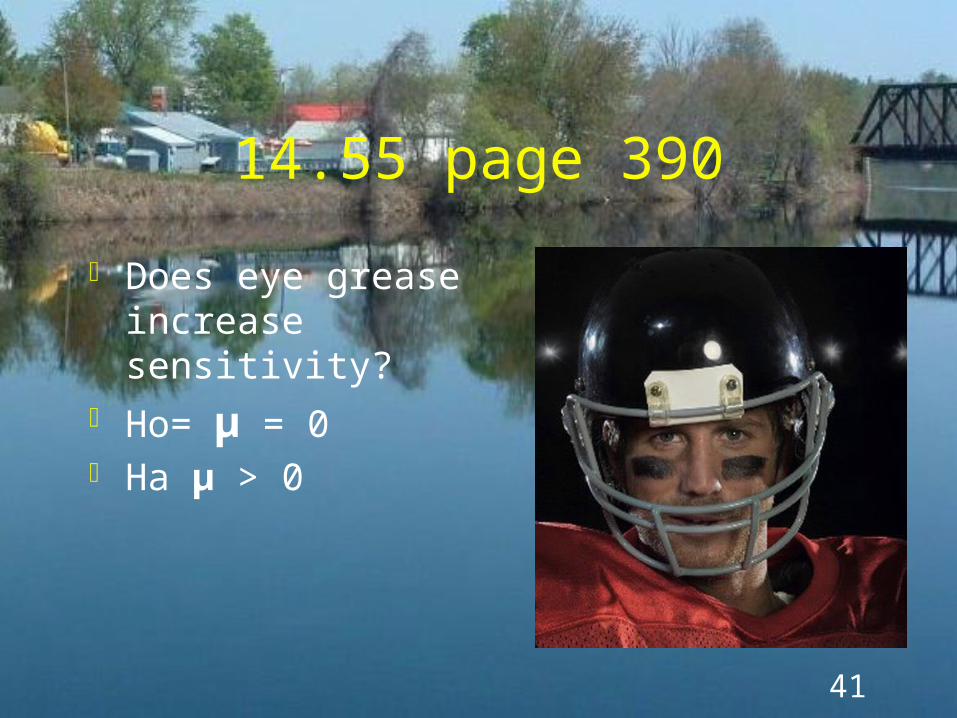
14.55 page 390
Does eye grease increase sensitivity?
Ho= μ = 0 Ha μ > 0
42
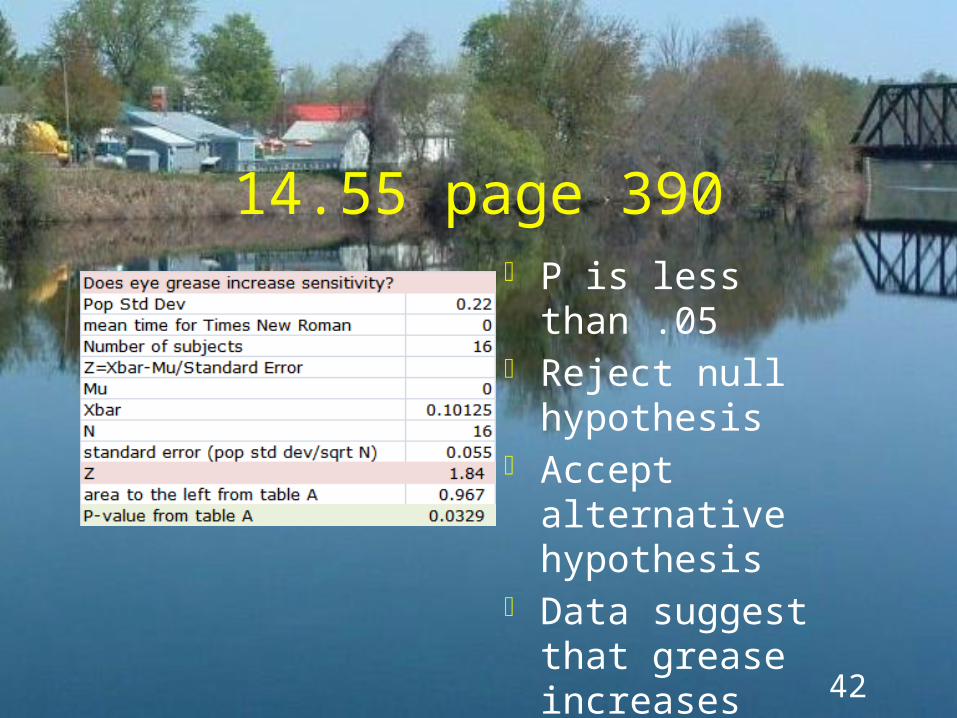
14.55 page 390 P is less than .05 Reject null
hypothesis Accept alternative
hypothesis Data suggest that
grease increases sensitivity
43
Inference as a decisionInference as a decision
We make a decision to accept Ho or Ha.
Sometimes we are correct Sometimes we are wrong.
44
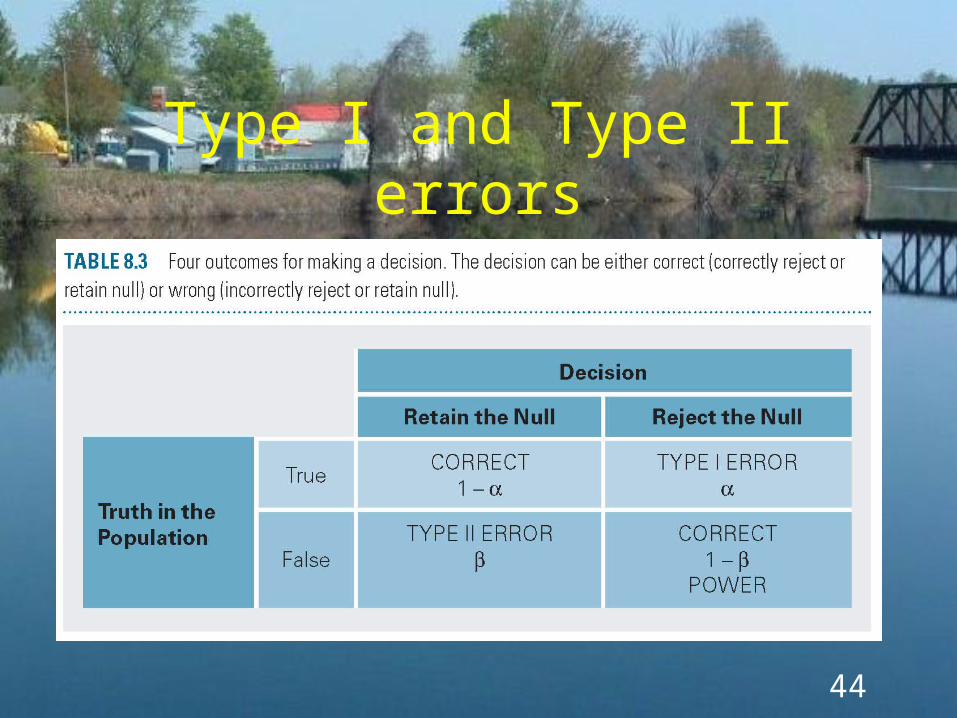
Type I and Type II errors
45
Type I errorType I error
If we reject Ho when in fact Ho is true If we decide it was not chance when in
fact it was chance.
46
Type II errorType II error
If we accept Ho when Ho is false. If we attribute a result to chance when it
is not chance.
47
Effect Size
Hypothesis testing looks at the statistical significance of the effect
Effect size looks at the size of the effect.
Different procedures use different measures of effect size.
48
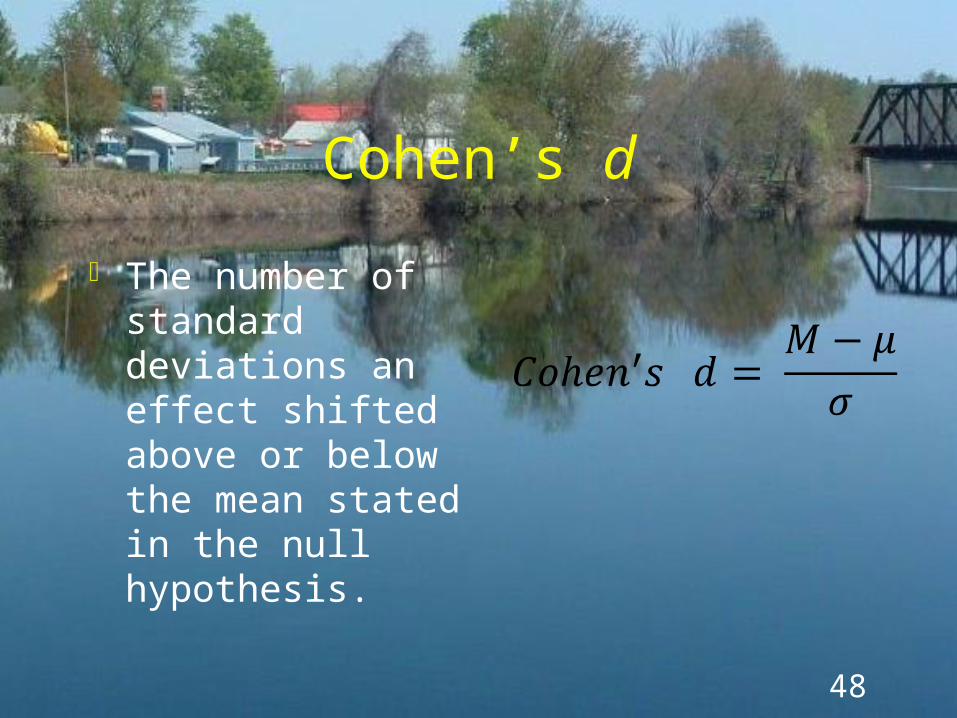
Cohen’s d
The number of standard deviations an effect shifted above or below the mean stated in the null hypothesis.
49
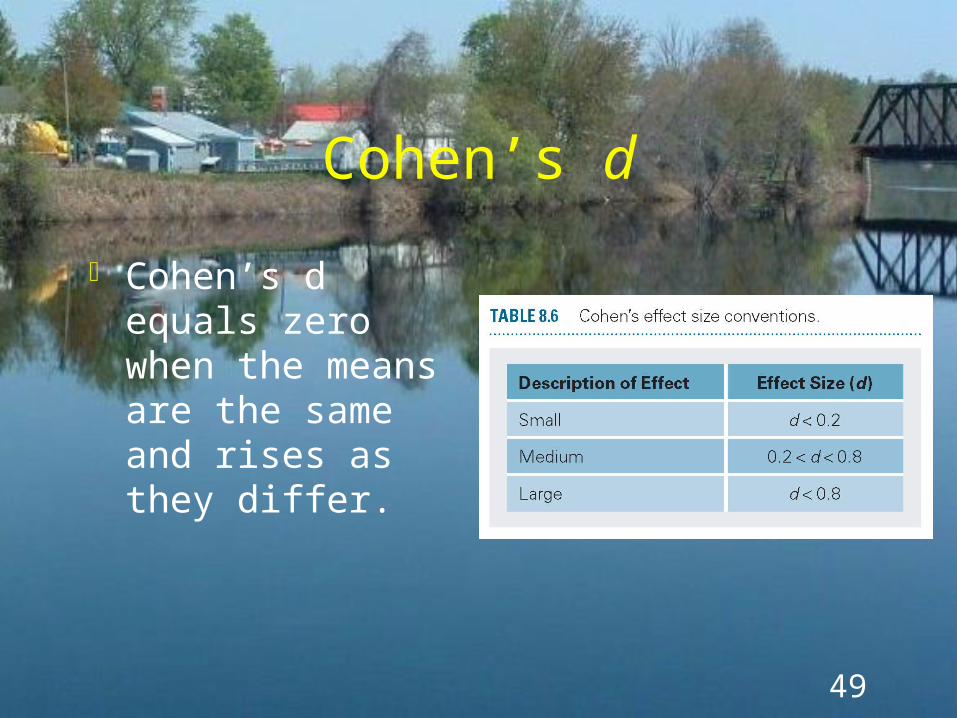
Cohen’s d
Cohen’s d equals zero when the means are the same and rises as they differ.

50The End
51
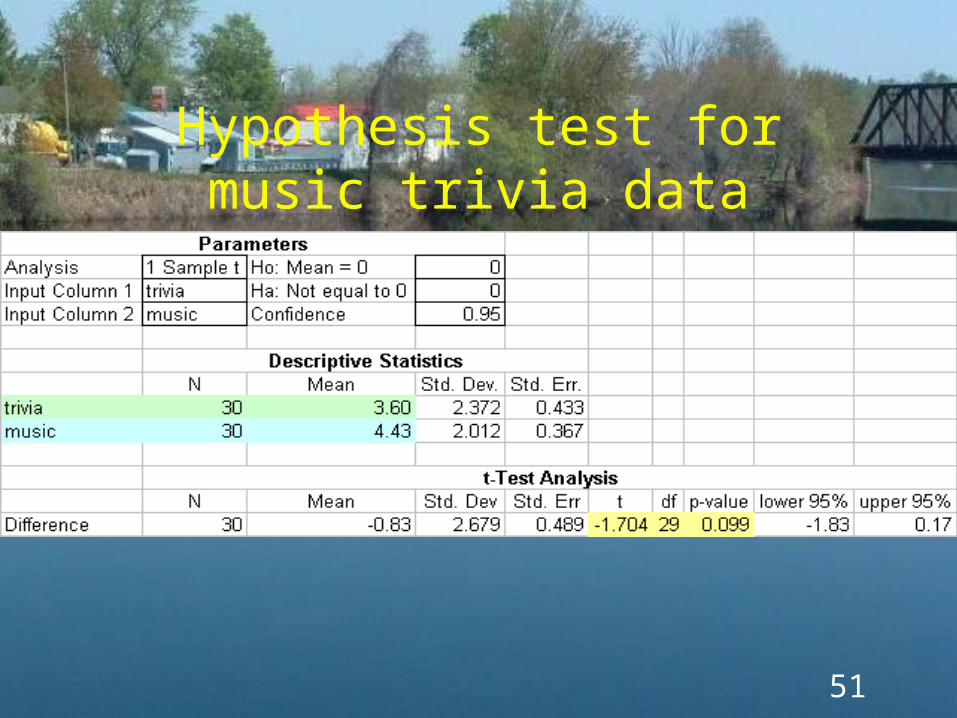
Hypothesis test for music trivia data