Embed Size (px)
Citation preview

1
IAMA Forum 2009
Hans Jöhr Corporate Head of Agriculture
Budapest, June 2009
Trends in Agribusiness and Food SystemsGlobal Challenges, Local Solutions
2
Food supply challenges
From past to current....... with expected outlook : turbulent times
Where to focus on
Use of natural renewable and non-renewable resources
A practitioners' approach: The Nestlé Roadmap on Sourcing Agricultural Materials
Practices, Processes and Human Resources
Topics

3

4
Commodity - Food - Price Volatility
Source: IFCN
Oil Price
0
10
20
30
40
50
60
70
80
90
100
110
120
130
140
Eu
rop
e S
po
t B
ren
t P
rice
FO
B (
per
/bb
l)
in US-$in Euro
1996-2006 annual
2006 monthly
2007 monthly
2008 monthly
World Milk Price
0
5
10
15
20
25
30
35
40
45
50
55
60
per
100
kg
mil
k E
CM
US-$in Euro
World Feed Price
0
5
10
15
20
25
30
35
40
per
100
kg
fee
d
in US-$in Euro
1996-2006 annual
2006 monthly
2007 monthly
2008 monthly
1996-2006 annual
2006 monthly
2007 monthly
2008 monthly
Jan - March 2009
Turbulent times:

5
Outlook: World Population 2050E
By 2050 it is estimated that the earth's human population will be 9.07 billion. 62% of the people will live in Africa, Southern Asia and Eastern Asia - numerically this is the same as if all the world's current population lived just in these regions. All numbers shown here are estimates - estimates are never perfect.
Source: Worldmapper

6
Food / Groceries Exports (2007)
Groceries include sugar, honey, cocoa, chocolate, tea, mate, coffee (a tea-like drink) and spices. Almost half of this category, whenmeasured in US$, is oils from vegetables and meats. Net exports including commodities tend to come from more southern latitudes (2007).
Source: Worldmapper
7
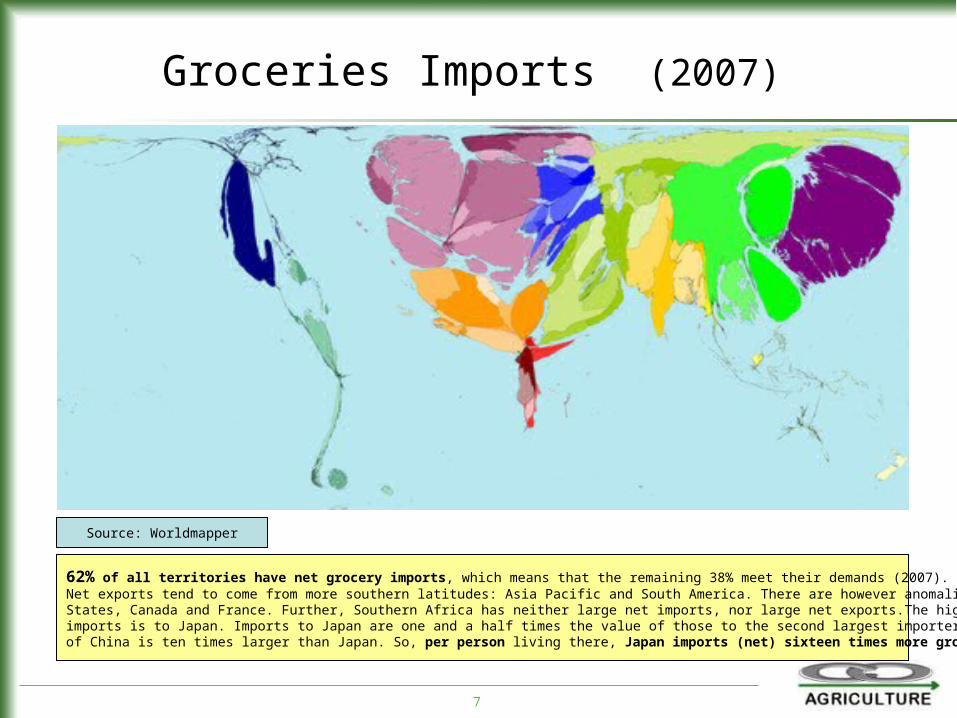
Groceries Imports (2007)
62% of all territories have net grocery imports, which means that the remaining 38% meet their demands (2007). Net exports tend to come from more southern latitudes: Asia Pacific and South America. There are however anomalies such as the United States, Canada and France. Further, Southern Africa has neither large net imports, nor large net exports.The highest value of net grocery imports is to Japan. Imports to Japan are one and a half times the value of those to the second largest importer, China. Further,the population of China is ten times larger than Japan. So, per person living there, Japan imports (net) sixteen times more groceries than China.
Source: Worldmapper

8
Constraints: Land / Water / Energy
How can we double calories output by 2050, where...
• There is at most 10% more arable land available that isn't presently forested or subject to erosion or desertification - and degradation of many soils continues,
• Water for agriculture in some parts of the world is already today scarce,
• Most production systems are dependend on heavy fossil-energy based inputs e.g. fertilizers, chemicals, transport, cooling, packaging, etc. ....????
9
Expected Demand triggers Change in Production Methods and Production Systems (1/2)
Productivity and efficiency increase at farm level using natural resources sustainably means to produce with
no waste, no pollution and no destruction, staying competitive, meeting global food needs and offset impacts of climat change and climat policy.
Most critical topics for volume and quality growth are:
Water, energy, technology (i.e. genetic potential, fertilizer,etc.), knowledge and know-how (farming practices and management)
10
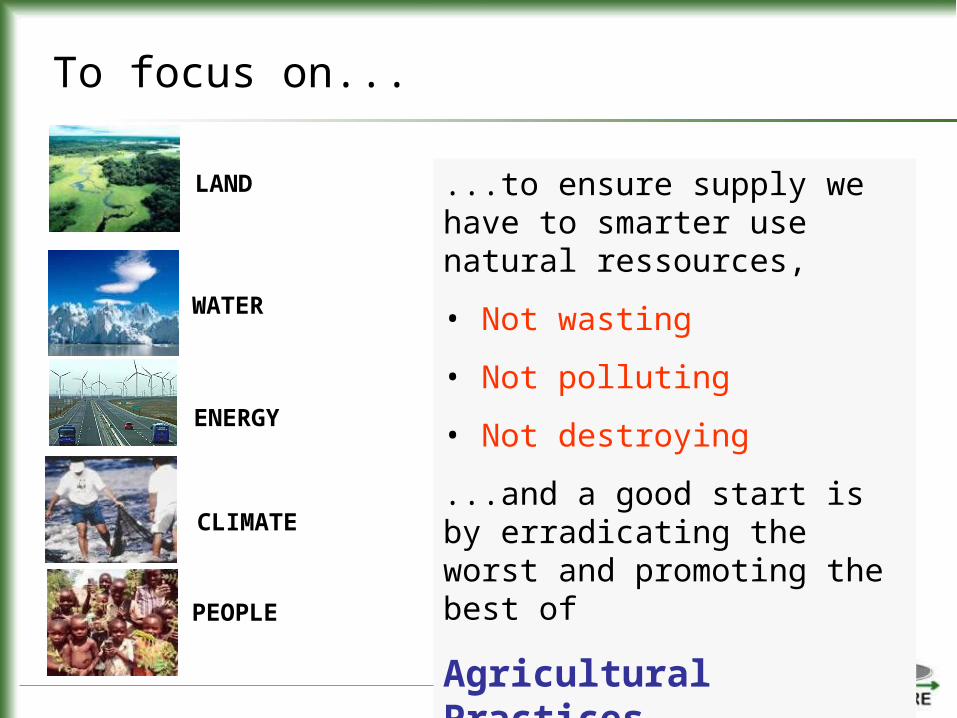
LAND
PEOPLE
WATER
ENERGY
...to ensure supply we have to smarter use natural ressources,
• Not wasting
• Not polluting
• Not destroying
...and a good start is by erradicating the worst and promoting the best of
Agricultural Practices
To focus on...
CLIMATE
11
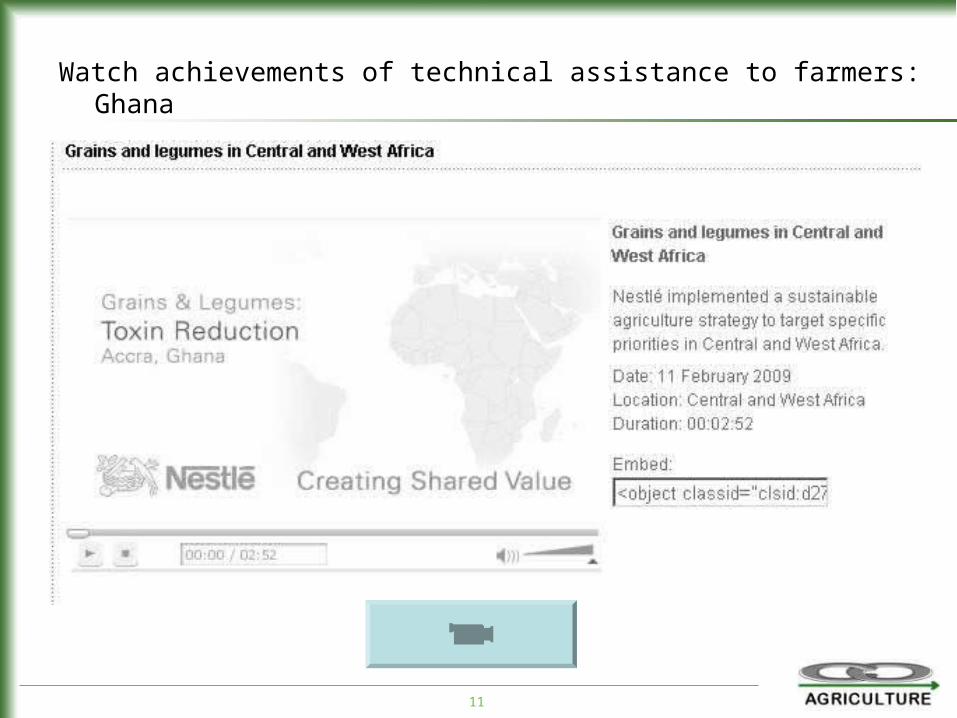
Watch achievements of technical assistance to farmers: Ghana
12
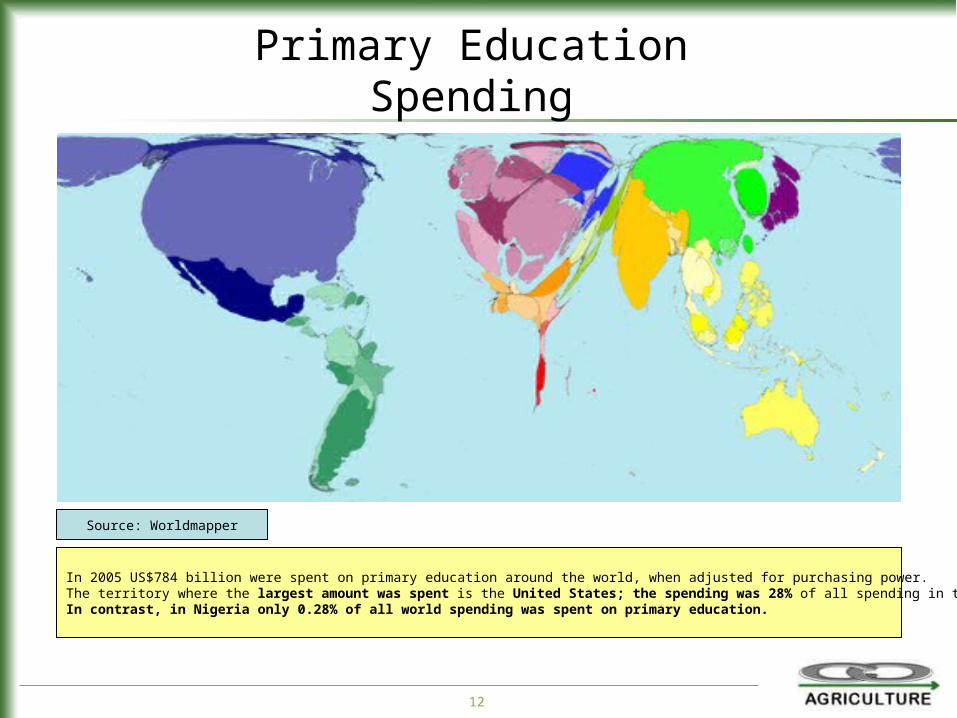
Primary Education Spending
In 2005 US$784 billion were spent on primary education around the world, when adjusted for purchasing power. The territory where the largest amount was spent is the United States; the spending was 28% of all spending in the world.In contrast, in Nigeria only 0.28% of all world spending was spent on primary education.
Source: Worldmapper

13
Expected Demand triggers Change in Production Methods and Production Systems (2/2)
Re-vitalizing extension services (Primary Education) to disseminate better production practices and engaging in technology transfer to farmers have biggest impact on both:
• productivity, volume and quality growth &• substantial income securing!
...Creating Shared Value – getting ensured supply...

14
Benefits of Adequate Roads and Extension Services
Why do road and extension services matter so much?
• Roads provide a critical link to local market towns, where most economic activity takes place (Dercon and Hoddinott, 2005)
• Half of households purchasing crop inputs do so in local market town
• Most artisanal products (especially those produced by women) tend to be sold locally
Improvements in road quality... Increase of purchasing crop inputs by 30%, andIncrease of women selling artisanal products by 39%Probability to link into interregional-international supply chains by 84%Source:

15
A ERHS survey asked farmers (from selected African countries) to describe the most important activities of extension agents (2006).
Answers
• Being a source of knowledge about use of modern inputs (production methods), Ranked highest by 72% of farmers• Being the source of knowhow about better cultivation practicesRanked highest by 46% of farmers
Many case studies on Improvements due to extension services are available and prove correlationof visits by extension agents and farms' productivity increase, e.g. cocoa productivity rose almost three-fold between 1994 and 2004 on selected project..
• Rates of return (ROR) to extension worldwide are between 13-500% (more than research (R&D) !!!!)
Extension is a cost-effective tool
Source:
Return on Extension Services

16
Watch achievements of technical assistance: Pakistan
17
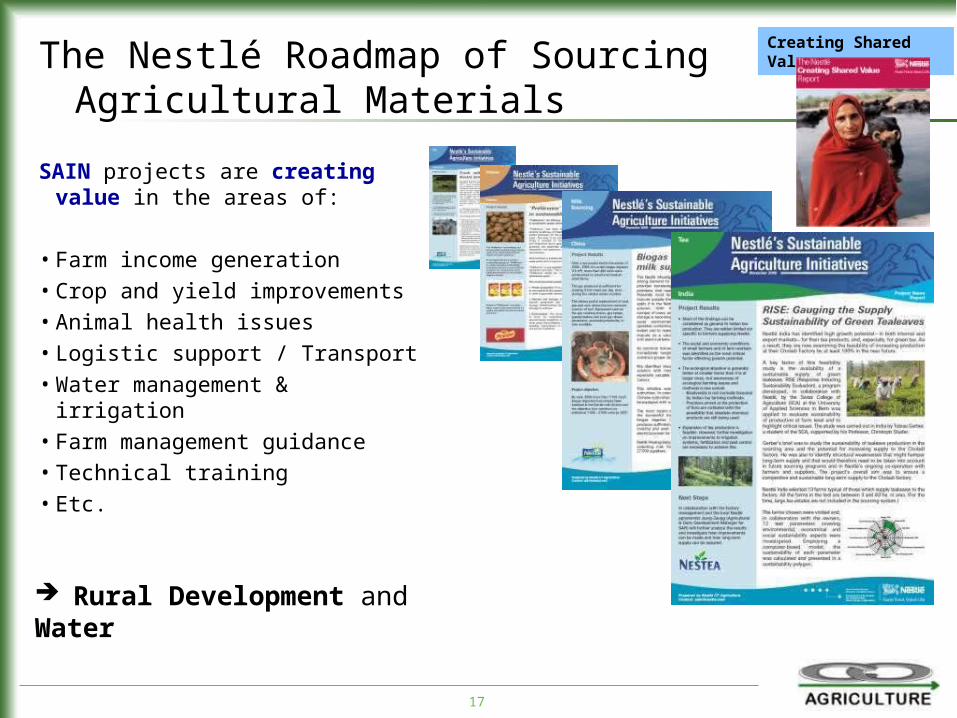
The Nestlé Roadmap of Sourcing Agricultural Materials
SAIN projects are creating value in the areas of:
• Farm income generation
• Crop and yield improvements
• Animal health issues
• Logistic support / Transport
• Water management & irrigation
• Farm management guidance
• Technical training
• Etc.
Creating Shared Value
Rural Development and Water

18
Develop farmers & suppliers
building capacity for growth
Secure availability of adequate agricultural raw materials
Ensure safety & quality of raw materials
COMPLIANCEInternal: Nestlé Corporate Business Principles
External: Laws, Regulations, Codes of Conduct
SUSTAINABILITYProtect the future
CREATESHARED VALUE
Nutrition, WaterRural Development
Wrapping up

19
Conclusions
• Matching expected food demand requires carefull use of natural resources to start at farm level
• Efficient and effective resource use implies knowledge and knowhow: Training farmers, securing minimum skills and competences to combine technology with better practices is a must
• Open food trade system to supply consumers compulsory
• Back to basics in rural development inevitable to achieve food security, nature stewardship and social peace

20
Creating Shared Value and Sustainability are the most important concepts in sourcing agricultural materials at Nestlé.
The future & the knowledge is here.It's just not widely distributed and applied yet.
Thank you for your attention!


![[Table] IAmA Spontaneous Solo Traveller - _I'Ll Take Your Next Flight Out_. AMA. _ Tabled](https://img.pdfslide.net/doc/110x75/577ce0e21a28ab9e78b450e4/table-iama-spontaneous-solo-traveller-ill-take-your-next-flight-out.jpg)